Nanodefects in YAG:Ce-Based Phosphor Microcrystals
by
Victor Lisitsyn
1, 
Ludmila Lisitsyna
2,*, 
Aida Tulegenova
3,
Yangyang Ju
1,
Elena Polisadova
1,*,
Evgeniy Lipatov
4 and
Vitaliy Vaganov
1 1
School of Advanced Manufacturing Technologies, National Research Tomsk Polytechnic University, 30 Lenin Ave., 634050 Tomsk, Russia
2
Department of Physics, Chemistry and Theoretical Mechanics, Tomsk State University of Architecture and Building, 2 Solyanaya Sq., 634003 Tomsk, Russia
3
Department of Solid State Physics and Nolinean Physics, Al-Farabi Kazakh National University, 71 al-Farabi Ave., Almaty 050040, Kazakhstan
4
Institute of High Current Electronics, SB RAS, Akademichesky Ave., 2/3, 634055 Tomsk, Russia
*
Authors to whom correspondence should be addressed.
Crystals 2019, 9(9), 476; https://doi.org/10.3390/cryst9090476
Submission received: 28 June 2019
/
Revised: 26 August 2019
/
Accepted: 4 September 2019
/
Published: 11 September 2019
(This article belongs to the Special Issue Non-Classical Crystal Growth)
Abstract
:The present paper focused on the study of spectral–kinetic characteristics of luminescence in two batches of yttrium aluminum garnet (YAG):Ce-based phosphors synthesized in different years by two manufacturers: NPO “Platan” in Russia and “GrandLux” in the People’s Republic of China (PRC). Upon studying the structural characteristics of the phosphors—elemental composition, morphology, and X-ray diffraction (XRD) patterns—it was concluded that both types of YAG:Ce phosphors are highly imperfect. The presence of heterogeneities of different nature was accompanied by the introduction—to compensate for charges and elastic stresses—of intrinsic lattice defects during synthesis. There is a high probability of creating complex defects during phosphor synthesis. Luminescence properties (full width at half maximum (FWHM), spectral position of the emission peaks, excitation spectra of emission, emission decay time) are affected by the nearest environment of the luminescence center; whereas the degree of correlation of defects (distance between the components of the donor–acceptor pair) does not depend on the concentration of impurities, intrinsic defects, and their ratio. The results do not fit into the framework of existing ideas regarding the processes in phosphors as systems with widely distributed luminescence centers. The patterns obtained in the paper are discussed based on a hypothesis according to which a nanodefect phosphorus crystal phase is formed during the synthesis.
Keywords:
phosphors; YAG:Ce; photoluminescence; cathodoluminescence; excitation; spectra; kinetics; excilamp; nanodefect1. Introduction
Phosphors based on yttrium aluminum garnet (YAG) doped with cerium (Y3Al5O12:Ce) are promising materials for white light-emitting diodes (LEDs). Luminescence in these phosphors is converted into emission in the range of 500–750 nm upon excitation in the 460-nm region, in which InGaN-based chips efficiently emit [1,2,3,4,5]. The combination of the portion of the chip emission transmitted through the phosphor and phosphor luminescence caused by the absorbed chip emission provides visible emission of the LED in the spectral range from 400 to 750 nm. It is assumed that photoluminescence (PL) in the visible (V) region in YAG:Ce phosphors is due to cerium ions. Two excitation bands of Ce3+ at 460 and 340 nm are caused by 4F5/2→5D0, 5D1 transitions, and wide luminescence bands at 520 and 580 nm are due to 5D0→4F5/2, 4F7/2 transitions, respectively. The comparison of the spectra in the reviewed studies reveals a difference in the shape of the luminescence band [6,7,8,9,10]. However, no well-grounded explanation of this difference is provided.
It is shown that, in radio- and cathodoluminescence (CL) spectra in all the YAG:Ce materials of different morphology (crystalline, ceramic, powder, films) observed, the 520–560-nm region is similar to those under selective excitation in bands at 340 and 460 nm [11,12,13]. Additional luminescence bands can be observed in the ultraviolet (UV) spectral region at 310, 370, and 435 nm [14,15]. In References [16,17], it was shown that, when the YAG:Ce crystal is excited by X-rays, intense luminescence can be observed in a wide spectral range of 250–600 nm, with three wide bands at 300, 360, and 530 nm. A similar luminescence spectrum was found under gamma excitation by the 137Cs source in Reference [18]. In Reference [19], luminescence that consisted of two wide bands at ~310 and 370 nm was detected in YAG:Ce ceramics exposed to X-rays in the region of 250–450 nm. In addition, a narrow peak at 312 nm caused by transitions in gadolinium ions was detected in the CL spectrum. This luminescence was quenched at high concentrations of gadolinium [20,21]. It was shown that CL of YAG:Ce single crystals in the UV region was associated with the presence of antidefects (AD) in the material [22,23,24,25,26]; the band at 296 nm was caused by the emission of excitons localized near AD and the band at 335 nm was caused by recombination of free electrons and holes localized on YAl AD [26]. Excitation of YAG:Ce crystals, films, and ceramics by radiation at 7.28 eV causes luminescence in the region of 200–450 nm due to YAl AD and F+ centers near AD [27,28]. Thus, excitation of luminescence by ionizing radiation causes bands in the UV spectral region, in addition to the bands at 520–560 nm. The positions and shapes of the luminescence bands in the UV spectral region reported in published papers are different.
It was found that the luminescence decay kinetics depend on the excitation technique. Under excitation in the band at 450 nm, the characteristic decay time in YAG:Ce phosphors is ~60 ns [29]. Excitation of phosphors by X-rays [19] causes an additional decay component with a time ranging from 340 to 560 ns. The decay time of X-ray luminescence is typically longer than that of PL [30]. The increased decay time of X-ray luminescence compared with PL is assumed to be due to shallow traps in the band gap [31], which trap charge carriers, thereby delaying their recombination on Ce3+. Excitation of ceramics by gamma rays [32] causes two-stage luminescence decay kinetics with characteristic times of 45–55 ns and 0.6–1.7 μs. Thus, the spectral–kinetic characteristics of the luminescence in phosphors depend not only on the prehistory, but also on the type of excitation, particle energy, and energy of photon quanta.
The comparison of the known results obtained for luminescence of YAG:Ce phosphors presented in the above brief analysis shows great variety in luminescence properties for samples grown by different authors in different conditions under excitation by different types of radiation sources. Evidently, the synthesis of phosphors—complex multicomponent systems—is performed under extreme conditions, which does not allow satisfactory reproducibility of the synthesis results. There are no approaches for the comparison of data arrays obtained by different researchers in different conditions.
2. Objects of Research and Methods of Luminescence Excitation
This paper presents the results of complex studies of spectral–kinetic characteristics of luminescence in the visible (V) and in the UV spectral regions for two types of industrial phosphors of different prehistory upon excitation by xenon and excimer lamps and high-energy electrons. Industrial phosphors are available to researchers from various laboratories, and this allows them to focus on studying properties of the materials using different methods to gain a deeper insight into processes. This approach can identify the most common patterns of processes in YAG phosphors under excitation.
It is known that the luminescent properties (LP) of highly imperfect phosphors depend on the types and concentration of defects: LP = f(Cd, Cm, Cui, Cv, Ci, CaD, CcD), where C is the concentration of dopants (d), modifiers (m)—ions that change the properties of the matrix or a dopant, uncontrollably entering impurities (ui), vacancies (v), interstitial ions (i), antidefects (aD), and complexes of different defects (cD). The values of Cd, Cm, and Cui in YAG:Ce depend on the initial imperfection, and the values of the other elements, especially CaD and CcD, depend on synthesis conditions. The values of Cd, Cm, and Cui can range from 0% to ~3% of the total number of lattice sites, and CaD can attain 5% [33]. There is no doubt that extrinsic defects are introduced during synthesis; however, there are no methods to estimate their concentrations. At high concentrations and various lattice defects, there can be and should be interrelation between their concentrations. For example, CcD = f(Cd, Cm, Cv, Ci). Therefore, the dependence of the luminescent characteristics on the concentration of defects can be nonlinear. The properties of phosphors of different prehistory cannot be compared, and the relationship between the properties of materials and elemental composition, types of defects, and structure cannot be identified due to the complex dependence of the composition and the concentration of defects in synthesized phosphors.
The approach described below was chosen to investigate the problem. Two types of industrial YAG:Ce phosphors were taken from different manufacturers synthesized under different conditions but with similar luminescent characteristics. In each phosphor type, the compositions of dopants and modifiers of phosphors were close in magnitude. The comparison of luminescent and structural properties of these types of phosphors made it possible to separate the effect of intrinsic defects and find the most common impact of the totality of defects on the processes during phosphor excitation. The present paper focused on the study of YAG:Ce phosphors of two types by different manufacturers: SDL—from Research Institute “PLATAN” LTD (Fryazino, Russia)—and C-YAG—from GrandLux Optoelectronic Co. (Intermatix Photonics, Jiangsu, China).
The PL of phosphors was studied under excitation by different types of radiation source. Direct excitation of luminescence centers in the visible region was performed using standard pulsed and stationary xenon lamps and chips with different emission spectra.
PL in the UV region was excited using powerful pulsed KrCl, XeBr, and XeCl excilamps of monochromatic radiation with wavelengths of 222, 282, and 308 nm [34]. The repetition frequency of the excilamp pulses was 100 kHz, and the full width at half maximum (FWHM) duration was ~100 ns. The average radiation power density of the excilamp was 7 mW/cm2, and the peak value was ~0.7 W/cm2.
CL was excited using a high-current pulsed accelerator with high-energy electrons of 0.25 MeV. The electron flux pulse duration was 10 ns, and the current density was as high as 100 A/cm2. At least 95% of the total absorbed energy of the flux is consumed in the creation of electron–hole excitations in the matrix.
In the present work, initial imperfection of phosphors was estimated via different methods: using the SEM Quanta3D 200i with an integrated energy-dispersive X-ray elemental analysis system (EDAX) (for the evaluation of phosphors elemental composition); using the Burevestnik X-ray diffractometer DRON-7 (for the evaluation of structural composition).
The PL spectra were measured using an HR2000+Ocean Optics spectrometer in the range of 300–800 nm. The CL spectra were recorded with a fiber spectrometer AvaSpec-ULS3648 and AvaSpec-2048. Steady-state PL and excitation spectra were measured with a fluorescence spectrophotometer Agilent Cary Eclipse.
Kinetic characteristics of the luminescence decay were measured using an MDR-204 monochromator of the Hamamatsu 10720-20 PMT with a Tetronix DPO-3033 oscilloscope.
All measurements were performed at 300 K. The accuracies of the measurements were as follows: wave length = 2 nm; FWHM = 0.01 eV; decay time Δτ = 2 ns (in the time range 0–200 ns), Δτ = 0.2 μs (in the time range 0–20 μs), Δτ = 2 μs (in the time range 0–100 μs); energy yield of the energy conversion (ηe) at λex = 447 nm − 10%. The luminescence of phosphors in the visible spectral region of 500–750 nm is abbreviated as LV, and luminescence in the UV spectral region (200–400 nm) is abbreviated as LUV.
3. Characterization of Phosphors
The objects of research were YAG:Ce phosphors of two types: SDL and C-YAG. SDL phosphors were marked as SDL 2700, SDL 3500, and SDL 4000. C-YAG phosphors were marked as YAG-01, YAG-02, YAG-04, YAG-05, and YAG-06. Batches of synthesized phosphors in different years were marked with an additional reference to the year of manufacture. In the other cases, the results were given for phosphors synthesized in the year 2016. The labeling of the samples was the same as that of the manufacturers to be able to compare our results and the results of other authors. The batches of phosphors synthesized in different years were marked with reference to the production year.
All phosphors were prepared by solid-state synthesis. Phosphors were powders of yttrium aluminum garnet microcrystals with different Gd and Ce contents. The phosphors of different types differed in their morphology. The particles of C-YAG phosphors were generally 3–5-fold larger than those of SDL phosphors and were more uniform in size.
The elemental composition of the samples was determined using the SEM Quanta3D 200i with an integrated energy-dispersive X-ray elemental analysis system (EDAX). Data on the composition of the studied phosphors are presented in Table 1.
Table 1 presents the elemental composition of samples synthesized in 2016. The elemental compositions of phosphors of one type, but from different batches, were different. In SDL phosphors synthesized in 2015, 2016, and 2018, the relative differences in the compositions of the main elements could be as much as 10–15%. The same difference could be observed in C-YAG phosphors synthesized in 2016 and 2017. The difference in the oxygen content ranging from 52.8 to 58.8 at.% indicates a high degree of non-stoichiometry in the microcrystals.
The structural properties of YAG phosphors were investigated using the Burevestnik X-ray diffractometer, DRON-7. Figure 1 shows examples of XRD spectra of the studied phosphors. The results obtained for the XRD spectra allowed us to draw some conclusions. Phosphors of both types had a YAG phase as the main phase, similar to that found in the phosphor crystals [35]. Additional diffraction peaks in the presented XRD spectra indicated the presence of a corundum phase (Al2O3) and YAM phase (Y4Al2O9). Additional phases can be caused by different thermal synthesis conditions: up to 900–1000 °C, a YAM phase is formed during solid-state synthesis; at 1100–1200 °C, a YAP phase is formed; a YAG phase is formed above 1400–1600 °C [36]. The peaks in the presented XRD spectra at 29.6° and 36.3–36.5° were due to the presence of the YAM phase [37], the peaks at 37.9°, 69°, and 71° belonged to the corundum phase. In some phosphors, a YAP phase could be observed, which manifested as a peak at ~32°.
The studies of the elemental composition, morphology, and XRD patterns demonstrated that YAG:Ce phosphors of both types were highly imperfect. The concentration of dopant ions varied from 0.1% to 1.4% of the number of ions in the lattice. The concentrations of modifiers differed to a larger extent. All phosphors were non-stoichiometric and contained other phases in addition to the dominant YAG phase. The presence of heterogeneities of different nature was accompanied by the introduction—to compensate for charges and elastic stresses—of intrinsic lattice defects during synthesis. There is a high probability of creating complex defects during phosphor synthesis.
4. Experimental Results
4.1. PL in the Visible Region in Phosphors
Steady-state PL and excitation spectra were measured at 300 K with a fluorescence spectrophotometer Agilent Cary Eclipse using a 150 W Xe lamp as an excitation source (190–1100 nm spectral range, with ±1.5 nm wavelength accuracy).
The measurement results for two types of phosphors are presented in Figure 2. The luminescence and excitation spectra measured were similar to those in YAG:Ce phosphors. The luminescence excitation bands caused by 4F5/2→5D0, 5D1 transitions in Ce3+ were at 460 and 340 nm, and the luminescence bands due to 5D0→4F5/2, 4F7/2 transitions in Ce3+ were in the region of 530–560 nm. The excitation peak at 460 nm agreed well with the absorption band of YAG:Ce phosphors and the emission band of an InGaN-based chip [38,39]. In Gd-modified phosphors, the luminescence band maximum was shifted to the long-wavelength spectral region.
Kinetic characteristics of the luminescence decay were measured under excitation by chip radiation with λex = 452 nm. The luminescence was recorded using an MDR-204 monochromator of the Hamamatsu 10720-20 PMT with a Tetronix DPO-3033 oscilloscope.
Figure 3 shows PL decay kinetics at 530−560 nm excited in the 460-nm region in C-YAG phosphors. The luminescence in all phosphors decayed with characteristic time in the range of 60–80 ns. Within 1 µs, the luminescence in the region of 530−560 nm intensity decreased at least 500 fold, and it was well described by a mono-exponential function.
The PL decay kinetics in samples of SDL type were similar to those shown in Figure 3.
We estimated the energy yield of the energy conversion (ηe) of the excitation energy at λex = 447 nm into luminescence at 530–560 nm using an integrating sphere. The ηe value was defined using the following formula:
where , , , and are relative and the maximum values of the radiation spectral density of the chip (c) and the phosphor (l); λi represents the limits of the integration of the emission spectra of the chip and the phosphor.
Table 2 summarizes the spectral, kinetic, and energy characteristics of PL in the visible region in the SDL and C-YAG phosphors studied.
The results presented in Table 2 show that (1) the values of the energy yield of the chip radiation conversion into luminescence were close in all the phosphors, (2) the FWHM of the luminescence bands of SDL phosphors was greater than that in C-YAG phosphors (0.485 and 0.385 eV, respectively), and (3) the positions of the emission band peaks were within 570–535 nm in phosphors. A difference in the parameters of the luminescence band in the visible region of spectra of YAG:Ce phosphors was observed in References [40,41,42,43,44,45,46], where the luminescence band peaks were within 515–565 nm, and the FWHM values were in the range of 0.39–0.5 eV. The described difference in luminescence parameters indicates that the structure of the environment around the luminescence centers in phosphors differs. This is evidently due to the different technological modes of synthesis of materials.
A comparison of the emission and structural characteristics of the phosphors of both types shows similar luminescent characteristics in phosphors with different structural characteristics. This is possible if complex nanosized defects with similar compositions, but a different ratio of components, are formed in the phosphors of both types during synthesis under different conditions.
4.2. PL of Phosphors under Excitation by Excilamp Radiation
The excitation spectrum of PL in the optical range consisted of two bands at 350 and 460 nm (Figure 2). Figure 4 shows the excitation spectra of LV and LUV in C-YAG phosphors in the UV region of 200–350 nm. The results show that LV intensity increased with a decrease in the wavelength in the region below 300 nm. It should be noted that luminescence intensity under UV excitation in phosphors of different types amounted to 0.6–0.7 of the intensity under excitation at 350 nm.
The results clearly demonstrate the dependence of the relationships between LUV band intensities on the excitation wavelength and show that the bands in the LUV spectra were due to different luminescence centers caused by intrinsic structural defects [15]. Excitation spectra of LV and LUV in SDL phosphors were similar to the results presented in Figure 4.
Excitation of PL in the region 200–300 nm was also studied using excilamps—sources of monochromatic ultraviolet radiation of high power—for the excitation. The PL spectra were measured using an HR2000+Ocean Optics spectrometer in the range 300–800 nm.
Figure 5a–c shows the PL spectra of SDL phosphors under excitation at 222, 282, and 308 nm by KrCl, XeBr, and XeCl excilamps, respectively. Excitation of phosphors by excilamp radiation in all cases caused PL in the visible (480–720 nm) and UV (300−400 nm) regions. The luminescence spectrum in the UV region consisted of two bands with maxima at 320 and 370 nm. The FWHMs of both bands were about 0.4 eV. Figure 5d shows the luminescence spectra of SDL 2700 phosphors under excitation by radiation of different excilamps.
It was found that the relationships between the intensities of the emission bands in the UV and visible regions in different phosphors differed significantly. The relationships between the UV band intensities were also different in different phosphors. This means that the luminescent centers responsible for the LUV and for LV were different in nature. The luminescence in the UV region can be associated with intrinsic structural defects in the form of YAlAD and F+ centers near AD [27]. The results clearly demonstrate the dependence of the relationships between LUV band intensities on the excitation wavelength and show that the bands in the LUV spectra were due to different luminescence centers caused by intrinsic structural defects [15]. Therefore, from the results presented in Figure 5, it can be assumed that the levels of intrinsic defects in SDL-type phosphors were different.
Figure 6 shows the luminescence spectra of C-YAG phosphors upon excitation by excilamps. The insets provide enlarged luminescence spectra in the UV region. In phosphors of C-YAG and SDL types, bands at ~320 and 370 nm were observed in the UV spectral region. Similar to SDL phosphors, the relationships between the intensities of these bands in C-YAG phosphors were different and depended on the excitation wavelength. When emission was excited by radiation at 282 nm, the intensity of the UV band was relatively higher than that under excitation at 222 nm.
A comparison of the results, obtained for the luminescence in the visible and UV regions excited by excilamps in SDL and C-YAG phosphors (Figure 5 and Figure 6), indicated a significant difference in the intensity ratios of the bands observed in the LV and LUV spectra. For example, the intensity ratio of the bands at 370 and 560 nm (I370/I560) depended on the phosphor prehistory. This ratio was typically smaller for C-YAG phosphors and ranged from 0 to 0.1. There was no clear relationship between this ratio and the elemental composition of phosphors. In SDL phosphors, the I370/I560 ratio varied in the range of 0.05–0.5. Since the LUV bands belonged to the luminescence centers caused by intrinsic structural defects, it can be concluded that the concentration of intrinsic defects in C-YAG phosphors was lower than that in SDL phosphors. Obviously, the difference in the intrinsic defects in phosphors depends on the synthesis modes.
4.3. CL Spectra of Phosphors
The CL spectra were recorded with fiber spectrometer AvaSpec-ULS3648 and AvaSpec-2048. Figure 7a shows the spectra of CL in visible and UV regions in the studied phosphors. In the spectra of all the phosphors, the dominant band was found in the region of ~550 nm. The luminescence bands of phosphors doped with Gd3+ were shifted to the long-wavelength region due to the increased lattice parameter in the region of the Ce3+ luminescence center [46]. The luminescence spectrum observed in the UV spectral region exhibited a wide band with a maximum at about 370 nm and a narrow peak at 312 nm. Figure 7b shows the enlarged LUV spectra. No relationship was found between the intensity of this band and the content of Gd3+/Ce3+ in the lattice; the ratio of the band intensities at 370 and 560 nm was approximately similar for phosphors of both types. The luminescence in the region of 370 nm could have been due to the existence of intrinsic defects, possibly excitons localized near the antidefects [24,25,26,47]. The value of the peak at 312 nm was maximum in phosphors with moderate concentrations of Gd3+. At high Gd3+ concentrations, this band was suppressed in SDL 2700 phosphorus due to concentration quenching [23]. The luminescence in SDL 4000 was probably caused by the presence of Gd3+ traces in the materials to be synthesized.
Figure 8 shows the CL spectra in SDL phosphors synthesized in 2015, 2016, and 2018 under similar conditions. The positions and shapes of the bands of phosphors of the same type synthesized in different years did not change. However, the ratio of the bands at 312 and 560 nm changed significantly. This was probably due to different compositions of the starting materials used for the synthesis.
As can be seen in Figure 8b, the intensity of the luminescence band at 312 nm was proportional to the excitation energy density per pulse. The maximum energy density per pulse used was 350 mJ/cm2. This means that energy was transferred to the luminescence centers responsible for the band at 312 nm directly from the matrix, which mainly absorbed the excitation energy.
The intensity ratio and the type of UV luminescence bands depended on the excitation technique. The most noticeable effect was the occurrence of the band at 312 nm in the CL spectra in gadolinium-containing phosphors, which was not observed in the photoluminescence spectra.
4.4. CL Decay Kinetic Characteristics in Phosphors
The CL decay kinetic characteristics after excitation were measured using a pulsed optical spectrometer with a time resolution of 7 ns in the range from 10 ns to 30 μs. The luminescence was recorded using an MDR-204 monochromator PMT Hamamatsu 10720-20 and PMT 84-6, and Tetronix DPO-3033LeCROY oscilloscope (350 MHz).
The luminescence decay after excitation by an electron flow pulse is complex. Figure 9 shows measurement results for the CL decay kinetics in the range of 0–300 ns and 1–100 µs. The longest decay time was observed in gadolinium-containing phosphors. In the time range up to 300 ns, the CL intensity decreased 20-fold. The characteristic decay time of the fast component τ1 was about 60–70 ns. There were two slow components of decay luminescence: units and tens of microseconds. The longest decay time was observed in SDL 3500, YAG-01, and YAG-06 phosphors. The shortest decay time was observed in SDL 4000, YAG-02, YAG-04, and YAG-05 phosphors.
The kinetic curves of CL decay in the region of 560 nm were well described by the sum of exponential functions, shown in Equation (2).
where Ai is the amplitude of the decay component intensity, and τi is the characteristic decay time of the corresponding decay component.
Values of decay time for different luminescence bands in phosphors of SDL and C-YAG types are summarized in Table 3 and Table 4. Table 3 shows the characteristics of the kinetic curves of LV decay in the microsecond time interval in SDL phosphors synthesized under similar conditions in different years. The characteristic time of CL decay was almost similar for phosphors of the same type but different batches; however, it differed for phosphors of different types (Table 4). It should be noted that the ratio of the light sums of the components was different in phosphors of different types.
The kinetic characteristics of the luminescence decay were found to be the most sensitive characteristics of phosphors. The results of studies of phosphors produced in different years, presented in Table 3, demonstrate that the kinetic parameters of luminescence in industrial phosphors could achieve high reproducibility (within 8%) for a long time—from 2015 to 2018. This makes it possible to compare the kinetics parameters of industrial phosphors and the phosphors synthesized in research laboratories.
High-energy electrons transfer their energy to the material to create electron excitations in the matrix: electron–hole pairs, excitons. Therefore, the luminescence observed in the region of 560 nm is due to relaxation of intrinsic electronic excitations. Differences in the luminescence decay parameter presented in Table 3 and Table 4 can be attributed to the differences in the time of energy transfer from the lattice to the luminescence center. Most likely, the transfer time depends on the mutual distance between the components of the electron–hole pair or of the donor–acceptor pair, one of the components of which is an activator ion (Ce3+).
The CL decay kinetics in the region of 560 nm in all the studied phosphors of both types showed three decay components with characteristic times in the ranges of 60–70 ns, 2.2–2.8 µs, and 14–21.5 µs (Figure 9, Table 3 and Table 4). The existence of three distinct similar decay components in phosphors of both types indicates a similar mutual spatial distribution of the components in the donor–acceptor pairs with the luminescence center in all the phosphors studied. Some differences in the values of the characteristic time within each component were probably due to the differences in the environment surrounding the luminescence center. The discrete values of the characteristic decay time of CL in all phosphors suggest that the mutual distance in pairs did not exceed several inter-ion distances.
The high luminescence intensity in the region of 560 nm shows that electronic excitations caused by radiation appeared with high probability at the luminescence centers.
Note that the decay kinetics of CL in the UV region also had several components. For example, Table 5 shows the kinetic parameters of CL decay in the UV spectral region in SDL phosphors of different types and batches. The decay kinetics in each of the bands (at 312 and 370 nm) showed two decay components, and their values significantly differed from those in the band at 560 nm in the CL spectrum in the visible region. Thus, electron excitations were localized in the luminescence centers of different types in the CL spectra in visible and UV regions.
5. Discussion
The studied phosphors of two types exhibited different degrees of imperfection. All phosphors were non-stoichiometric, and, in addition to the main YAG phase, they contained other phases such as YAM and YAP phases. This suggests that these phosphors were highly imperfect; they contained large concentrations of various impurities and intrinsic defects. This was also indicated by the data on the elemental composition of the phosphors. This conclusion is consistent with that made in References [48,49,50,51]. The formation of complex defects is highly probable in microcrystals of phosphor powder.
The analysis of the PL and excitation spectra of the studied phosphors of two types indicated differences in the luminescence patterns. All bands of PL in the visible region in SDL phosphors were shifted to the long-wavelength region relative to similar bands in C-YAG phosphors. In both types of phosphors, the FWHM of the luminescence bands differed. The bands in C-YAG phosphors were narrower. It is known that Ce ions are the emission centers in all phosphors; therefore, it can be assumed that the different FWHM of the bands and the relative displacement of the band position in the phosphors of two types were due to the difference in the environment of cerium ions.
The CL decay kinetics in the band at 560 nm in phosphors of both types displayed at least three decay components with characteristic times in the ranges of 60–70 ns, 2.2–2.8 µs, and 14–21.5 µs. Three distinct characteristic times of CL decay in phosphors of both types suggested that the mutual distribution of the components in the donor–acceptor pair with the luminescence center was similar in all the phosphors studied. Some differences in values within the characteristic time of each decay component could have been due to the difference in the spatial environment of the luminescence center.
Consequently, electronic excitations during relaxation were localized in the region of luminescence centers. Three discrete values of the CL characteristic decay times in all phosphors suggested that the mutual distance between components of pairs attained a value of no more than several inter-ion distances.
The study results show that the luminescence properties (FWHM of the bands, position of emission peaks, types of excitation spectra) are affected by the nearest environment of the luminescence center, whereas the degree of correlation of defects (distance between the components of the donor–acceptor pair) does not depend on the concentrations of impurities, intrinsic defects, and their ratio. This is only possible if complex defects are formed in crystals during synthesis and if emission centers are inside these complexes.
The existence of such nanosized defect complexes was shown for LiF:W, U, Ti scintillation crystals in References [52,53], and for zinc and cadmium tungstates in References [54,55,56]. Complex impurity centers in binary ionic and complex ionic–covalent crystals could be created, as shown in Reference [57].
The composition of nanodefects in the YAG phosphor microcrystals is assumed to be an emission center localized on lattice components, such as matrix ions and lattice defects, including intrinsic defects and ion-modifiers. Nanosized defects are formed at the sintering and annealing stages of phosphor synthesis. The ratio of the structural components in the nanodefect and their spatial distribution around the luminescence center depend on the synthesis mode used. Nanodefects in the YAG microcrystal can be represented as something like a quantum dot [58,59]. The difference is that a quantum dot is typically represented by a nanoscaled crystal, with an intrinsic composition and structure in the matrix lattice. The nanodefect in the YAG phosphor microcrystal is a nanoscale region formed from elements of the matrix and lattice point defects during synthesis. Therefore, the structure and composition of the complex nanodefect may change depending on the synthesis conditions.
The results of the study show that there are three different channels of energy transfer to luminescence centers under excitation.
- The optical effect of radiation fluxes in the photon energy range from 2.5–4 eV directly excites luminescence centers located in the nanodefect.
- When phosphor is exposed to high-energy electrons with energy exceeding Eg (6.43 eV), more than 95% of the energy is transferred to the matrix ions. The electronic excitations created can be captured by nanodefects that have a large geometrical capture cross-section. Relaxation of electronic excitations in the matrix or nanodefect can result in luminescence. It is highly probable that excitation and relaxation proceed as follows: the hole component of the electron–hole pair is efficiently captured by nanodefects and localized in the region of the luminescence center—a component of the nanodefect. Excitons localized on defects can be formed [60]. After that, an electron is captured in the hole, and energy is transferred to the luminescence center, with subsequent radiative transition of center to the ground state followed by radiation of energy in the visible or UV spectral regions.
- Luminescence excitation in YAG phosphors in the region of 4–6 eV seems to be most interesting. A wide excitation band can be caused by the new defect phase formed, in addition to those found in the XRD spectra, during synthesis, with peculiar energy characteristics different from those of the matrix lattice. The results described below are evidence of the presence of this new structural phase.
The band gap in YAG:Ce is 6.43 eV [16]. LV and LUV are efficiently excited in the region of 4–6 eV. Consequently, there is no need to create electron–hole pairs and excitons in the matrix to excite luminescence.
The absorption coefficient in the region of 4–6 eV in highly luminescent single crystals and YAG:Ce ceramics exceeds 102 cm−1 [28]. The measured absorption coefficient in the YAG:Ce single crystal in this region is 30–50 cm−1 [17,18]. Although the absorption coefficients in phosphor microcrystals are yet to be measured (only transmission spectra and decay spectra were measured), it can be assumed that their magnitude in phosphor is higher than that in single crystals.
The high absorption coefficient (>102 cm−1) in the wide spectral region indicates that the amount of lattice defects in the YAG:Ce microcrystal exceeds 0.1% of the total crystal volume. Nanodefects can represent a structural phase, and the totality of these should manifest itself in the energy spectrum of the phosphor crystal.
The band diagram of a microcrystal with nanodefects can be represented as a band diagram of a phosphor matrix with the band gap Egm (6.43 eV) containing the band diagram of the nanodefect phase with the band gap Egn (4 eV) and a set of possible intraband and interband transitions (Figure 10).
Optical excitation of phosphors in the region of 340 nm (3.65 eV) or 460 nm (2.69 eV) results in direct excitation of the luminescence centers and the subsequent emission of energy in the region of 540 nm.
Excitation of luminescence in the energy region E that satisfies the condition Egm > E > Egn leads to occurrence of an additional luminescence in the UV region at 370 nm.
Excitation of luminescence by radiation with energy E > Egm causes luminescence in the visible spectral region (540 nm) and in the UV regions at 370 nm and 312 nm.
6. Conclusions
Comprehensive studies were performed for two types of industrial YAG:Ce phosphors exposed to radiation fluxes that provided different methods of energy transfer to luminescence centers.
The analysis of the study results suggested that emission processes in YAG:Ce-based phosphor microcrystals, being highly imperfect systems, occurred at the centers of emission in the nanodefect compositions. Nanodefects are considered as complexes consisting of matrix ions and various point lattice defects, both intrinsic (vacancies, interstitial ions, antidefects) and impurities (doping impurities, modifiers). Nanodefects are formed during synthesis; therefore, their properties depend on techniques and technological modes of synthesis.
It was shown that there are three regions in the luminescence excitation spectrum of YAG:Ce phosphors. Irradiation in the range of 2.5–4 eV causes direct excitation of luminescence centers (Ce3+ ions).
The effect of hard radiation, sufficient to create electron–hole pairs in the matrix, results in occurrence of the luminescence at 320 and 370 nm and, in some phosphors, at 312 nm, in addition to the main band in the visible spectral region. The ratio of the intensities of the luminescence bands depends on the phosphor prehistory.
Exposure to optical radiation flux in the range of 4–6.2 eV leads to luminescence in the regions of 560, 320, and 370 nm. The ratio of the intensities of the luminescence bands depends on the prehistory of the phosphors and differs from that measured in the CL spectra. It is suggested that absorption in this spectral region is due to interband transitions in the new structural phase—the nanodefect phase formed during synthesis. The band diagram of a microcrystal with nanodefects can be represented as a band diagram of a matrix with the band gap Egm (6.43 eV), containing the band diagram of the nanodefect phase with the band gap Egn (4 eV) and a set of possible intraband and interband transitions. This pattern allows us to consistently explain the differences in the luminescent properties of phosphors observed when using different excitation techniques.
The presented ideas regarding the processes in microcrystalline YAG:Ce phosphors suggest that attention should be paid to the creation of conditions for nanodefect formation during phosphor synthesis. For example, during synthesis via solid-phase reactions between metal oxides [61], the formation of nanodefects occurs during sintering and subsequent annealing of materials. During sintering, defects accumulate in the region of the dopant. A nanodefect phase is formed during subsequent annealing.
Author Contributions
V.L. coordinated the study of physical phenomena in the materials, and wrote part of the manuscript; L.L. and E.P. participated in the analysis of experimental results and their interpretation; A.T., Y.J., E.L., and V.V. participated in measurements of PL and CL spectra, XRD patterns, and kinetics parameters of luminescence.
Funding
The research was funded by the Ministry of Science and Higher Educationof the Russian Federation for 2017-2019 (research work NO 13.3647.2017/PP).
Acknowledgments
The authors gratefully thank N.P. Soshchin for providing samples for research.
Conflicts of Interest
The authors declare no conflict of interest.
References
- Nakamura, S. Background Story of the Invention of Efficient InGaN Blue-Light-Emitting Diodes. Angew. Chem. Int. Ed. 2015, 54, 7770–7788. [Google Scholar] [CrossRef] [PubMed]
- Nakamura, S. Present performance of InGaN based blue/green/yellow LEDs. Proc. SPIE 1997, 3002, 26–35. [Google Scholar]
- Narukawa, Y.; Ichikawa, M.; Sanga, D.; Sano, M.; Mukai, T. White light emitting diodes with super-high luminous efficacy. J. Phys. D Appl. Phys. 2010, 43, 354002. [Google Scholar] [CrossRef]
- Qiao, J.; Zhao, J.; Liu, Q.; Xia, Z. Recent advances in solid-state LED phosphors with thermally stable luminescence. J. Rare Earths 2019, 37, 565–572. [Google Scholar] [CrossRef]
- Ye, S.; Xiao, F.; Pan, Y.X.; Ma, Y.Y.; Zhang, Q.Y. Phosphors in phosphor-converted white light-emitting diodes: Recent advances in materials, techniques and properties. Mater. Sci. Eng. R Rep. 2010, 71, 1–34. [Google Scholar] [CrossRef]
- Blasse, G.; Bril, A. Hypersensitivity of the 5D0—7F2 transition of trivalent europium in the garnet structure. J. Chem. Phys. AIP Publ. 1967, 47, 5442–5443. [Google Scholar] [CrossRef]
- Blasse, G.; Grabmaier, B.C. Luminescent Materials; Springer: Berlin/Heidelberg, Germany; New York, NY, USA, 1994; p. 241. [Google Scholar]
- Dorenbos, P. 5d-level energies of Ce3+ and the crystalline environment. IV. Aluminates and «simple» oxides. J. Lumin. 2002, 99, 283–299. [Google Scholar] [CrossRef]
- Munoz-Garcia, A.B.; Barandiaran, Z.; Seijo, L. Antisite defects in Ce-doped YAG (Y3Al5O12): First-principles study on structures and 4f-5d transitions. J. Mater. Chem. 2012, 22, 19888–19897. [Google Scholar] [CrossRef]
- He, X.; Liu, X.; Li, R.; Yang, B.; Yu, K.; Zeng, M.; Yu, R. Effects of local structure of Ce3+ ions on luminescent properties of Y3Al5O12:Ce nanoparticles. Sci. Rep. 2016, 6, 22238. [Google Scholar] [CrossRef]
- Blasse, G.; Bril, A. A new phosphor for flying-spot cathode-ray tubes for color television: Yellow-emitting Y3Al5O12-Ce3+. Appl. Phys. Lett. 1967, 11, 53–54. [Google Scholar] [CrossRef]
- Gorbenko, V.; Krasnikov, A.; Nikl, M.; Zazubovich, S.; Zorenko, Y. Luminescence characteristics of LuAG:Pr and YAG:Pr single crystalline films. Opt. Mater. 2009, 31, 1805–1807. [Google Scholar] [CrossRef]
- Han, T.; Lang, T.; Zhong, Y.; Cao, S.; Peng, L.; Yakovlev, A.; Polisadova, E. Spectral broadening of a single Ce3+-doped garnet by chemical unit cosubstitution for near ultraviolet LED. Opt. Mater. Express 2018, 8, 3761–3769. [Google Scholar] [CrossRef]
- Nizankovski, S.; Dan’ko, A.Y.; Zelenskaya, O.V.; Tarasov, V.A.; Zorenko, Y.V.; Puzikov, V.M.; Grin, L.A.; Trushkovsky, A.G.; Savchin, V.P. Cathodoluminescence and scintillation characteristics of YAG:Ce crystals grown by horizontal directional crystallization in a protective atmosphere. Lett. J. Phys. Technol. 2009, 35, 77–83. [Google Scholar]
- Zorenko, Y.; Voznyak, T.; Gorbenko, V.; Zych, E.; Nizankovski, S.; Dan’ko, A.; Puzikov, V. Luminescence properties of Y3Al5O12:Ce nanoceramics. J. Lumin. 2011, 131, 17–21. [Google Scholar] [CrossRef]
- Yang, X.; Li, H.; Bi, Q.; Su, L.; Xu, J. Growth of large-sized Y3Al5O12:Ce (Ce:YAG) scintillation crystal by the temperature gradient technique(TGT). J. Cryst. Growth 2009, 311, 3692–3696. [Google Scholar] [CrossRef]
- Nikl, M.; Yoshikawa, A.; Vedda, A.; Fukud, T. Development of novel scintillator crystals. J. Cryst. Growth 2006, 292, 416–421. [Google Scholar] [CrossRef]
- Yoshikawa, A.; Kamada, K.; Kurosawa, S.; Shoji, Y.; Yokota, Y.; Chani, V.I.; Nikl, M. Crystal growth and scintillation properties of multi-component oxide single crystals: Ce:GGAG and Ce:La-GPS. J. Lumin. 2016, 169, 387–393. [Google Scholar] [CrossRef] [Green Version]
- Osipov, V.V.; Ishchenko, A.V.; Shitov, V.A.; Maksimov, R.N.; Lukyashin, K.E.; Platonov, V.V.; Orlov, A.N.; Osipov, S.N.; Yagodin, V.V.; Viktorov, L.V.; et al. Fabrication, optical and scintillation properties of transparent YAG:Ce. Opt. Mater. 2017, 71, 98–102. [Google Scholar] [CrossRef]
- Kucera, M.; Nikl, M.; Hanus, M.; Onderisinova, Z. Gd3+ to Ce3+energy transfer in multi-component GdLuAG and GdYAG garnet scintillators. Phys. Stat. Solidi (RRL) 2013, 7, 571–574. [Google Scholar] [CrossRef]
- Kucera, M.; Hanus, M.; Onderisinova, Z.; Prusa, P.; Beitlerova, A.; Nikl, M. Energy transfer and scintillation properties of Ce3+ doped (LuYGd)3(AlGa)5O12 multicomponent garnets. IEEE Trans. Nucl. Sci. 2014, 61, 282–289. [Google Scholar] [CrossRef]
- Onderisinova, Z.; Kucera, M.; Hanus, M.; Nikl, M. Temperature-dependent nonradiative energy transfer from Gd3+ to Ce3+ ions in co-doped LuAG:Ce,Gd garnet scintillators. J. Lumin. 2015, 167, 106–113. [Google Scholar] [CrossRef]
- Kucera, M.; Onderisinova, Z.; Bok, J.; Hanus, M.; Schauer, P.; Nikl, M. Scintillation response of Ce3+ doped GdGa-LuAG multicomponent garnet films under e-beam excitation. J. Lumin. 2016, 169, 674–677. [Google Scholar] [CrossRef]
- Nikl, M.; Mihokova, E.; Pejchal, J.; Vedda, A.; Zorenko, Y.; Nejezchleb, K. The antisite LuAl defect-related trap in Lu3Al5O12:Ce single crystal. Phys. Status Solidi B 2005, 242, R119–R121. [Google Scholar] [CrossRef]
- Zorenko, Y.; Voznyak, T.; Gorbenko, V.; Zorenko, T.; Voloshinovskiĭ, A.; Vistovsky, V.; Nikl, M.; Nejezchleb, K.; Kolobanov, V.; Spasskiĭ, D. Luminescence spectroscopy of excitons and antisite defects in Lu3Al5O12 single crystals and single-crystal films. Opt. Spectrosc. 2008, 104, 75–87. [Google Scholar] [CrossRef]
- Nikl, M.; Vedda, A.; Fasoli, M.; Fontana, I.; Laguta, V.V.; Mihokova, E.; Pejchal, J.; Rosa, J.; Nejezchleb, K. Shallow traps and radiative recombination processes in Lu3Al5O12:Ce single crystal scintillator. Phys. Rev. B 2007, 76, 195121. [Google Scholar] [CrossRef]
- Zorenko, Y.; Voloshinovskii, A.; Savchyn, V.; Vozniak, T.; Nikl, M.; Nejezchleb, K.; Mikhailin, V.; Kolobanov, V.; Spassky, D. Exciton and antisite defect-related luminescence in Lu3Al5O12 and Y3Al5O12 garnets. Phys. Stat. Sol. (B) 2007, 244, 2180–2189. [Google Scholar] [CrossRef]
- Lang, T.; Han, T.; Zhao, C.; Fang, S.; Zhao, L.; Korepanov, V.I.; Yakovlev, A.N. Luminescence properties of color tunable new garnet structure (Lu1-xMnx)3Al2(Al1-xSix)3O12:Ce3+. J. Lumin. 2019, 207, 98–104. [Google Scholar] [CrossRef]
- Zych, E.; Brecher, C.; Glodo, J. Kinetics of cerium emission in a YAG:Ce single crystal: The role of traps. J. Phys. Condens. Matter. IOP Publ. 2000, 12, 1947. [Google Scholar] [CrossRef]
- Vedda, A.; Fasoli, M.; Nikl, M.; Laguta, V.; Mihokova, V.; Pejchal, E.; Yoshikawa, J.A.; Zhuravleva, M. Trap-center recombination processes by rare earth activators in YAlO3 single crystal host. Phys. Rev. 2009, 80, 045113. [Google Scholar] [CrossRef]
- Fasoli, M.; Vedda, A.; Nikl, M.; Jiang, C.; Uberuaga, B.P.; Andersson, D.A.; McClellan, K.J.; Stanek, C.R. Band-gap engineering for removing shallow traps in rare-earth Lu3Al5O12 garnet scintillators using Ga3+ doping. Phys. Rev. 2011, 84, 081102. [Google Scholar] [CrossRef]
- Chena, X.; Hua, Z.; Daia, J.; Chena, H.; Shia, Y.; Koua, H.; Kucerkovac, R.; Beitlerovac, A.; Nikl, M.; Lia, J. Fabrication and optical properties of cerium doped Lu3Ga3Al2O12 scintillation ceramics. Opt. Mater. 2018, 85, 121–126. [Google Scholar] [CrossRef]
- Asatryan, G.R.; Kramushenko, D.D.; Uspenskaya, Y.A.; Baranov, P.G.; Petrosyan, A.G. Family of paramagnetic centers of Ce+ ions in ayttrium aluminum garnets. Solid State 2014, 56, 1106–1111. [Google Scholar]
- Lomaev, M.; Sosnin, E.; Tarasenko, V. Excilamps and their applications. Chem. Eng. Technol. 2016, 39, 39–50. [Google Scholar] [CrossRef]
- Rabasovic, M.S.; Sevic, D.; Krizan, J.; Rabasovic, M.D.; Savic-Sevic, S.; Mitric, M.; Petrovic, M.; Gilic, M.; Romcevic, N. Structural properties and luminescence kinetics of white nanophosphor YAG:Dy. Opt. Mater. 2015, 50, 250–255. [Google Scholar] [CrossRef]
- Zhao, D.; Coyle, T.W.; Chien, K. Phase composition and microstructure of yttrium aluminum garnet (YAG) coatings prepared by suspension plasma spraying of Y2O3–Al2O3 powders. Surf. Coat. Technol. 2013, 235, 303–309. [Google Scholar] [CrossRef]
- Zhou, Y.; Lu, X.; Xiang, H.; Feng, Z. Preparation, mechanical, and thermal properties of a promising thermal barrier material: Y4Al2O9. J. Adv. Ceram. 2015, 4, 94–102. [Google Scholar] [CrossRef]
- Hoppe, H.A. Recent developments in the field of inorganic phosphors. Angew. Chem. Int. Ed. 2009, 48, 3572–3582. [Google Scholar] [CrossRef]
- George, N.C.; Denault, K.A.; Seshadri, R. Phosphors for solid-state white lighting. Ann. Rev. Mater. Res. 2013, 43, 481–501. [Google Scholar] [CrossRef]
- Husnen, R.A.; Zainuriah, H.; Naser, M.A.; Forat, H.A.; Ahmad, F.O. Ce-doped YAG phosphor powder synthesized via microwave combustion and its application for white LED. Opt. Eng. 2019, 58, 027110. [Google Scholar]
- Yang, Y.; Wang, X.; Liu, B.; Zhang, Y.; Lv, X.; Li, J.; Li, S.; Wei, L.; Zhang, H.; Zhang, C. Dependence of emitting light for LEDs fabricated by YAG:Ce crystal wafer on wafer thickness. J. Lumin. 2018, 204, 157–161. [Google Scholar] [CrossRef]
- Lee, Y.-W.; Wu, S.-H. Fabrication and performance assessment of coprecipitation-based YAG:Ce nanopowders for white LEDs. J. Microelectron. Eng. 2018, 199, 24–30. [Google Scholar] [CrossRef]
- Dantelle, G.; Salaiin, M.; Bruyere, R.; Kodjikian, S.; Ibanez, A. Luminescent coatings prepared from optimized YAG:Ce nanoparticles. Thin Solid Film. 2017, 543, 36–42. [Google Scholar] [CrossRef]
- Armetta, F.; Saladino, M.L.; Giordano, C.; Defilippi, C.; Marciniak, Ł.; Hreniak, D.; Caponetti, E. Non-conventional Ce:YAG nanostructures via urea complexes. Sci. Rep. 2019, 9, 3368. [Google Scholar] [CrossRef]
- Song, L.; Dong, Y.; Shao, Q.; Jiang, J. Preparation of Y3Al5O12:Ce nanophosphors using salt microemulsion method and their luminescent properties. J. Mater. Sci. 2018, 3, 5196–15203. [Google Scholar] [CrossRef]
- Shi, H.; Zhu, C.; Huang, J.; Chen, J.; Chen, D.; Wang, W.; Wang, F.; Cao, Y.; Yuan, X. Luminescence properties of YAG:Ce, Gd phosphors synthesized under vacuum condition and their white LED performances. Opt. Mater. Express 2014, 4, 649–655. [Google Scholar] [CrossRef]
- Varney, C.R.; Reda, S.M.; Mackay, D.T.; Rowe, M.C.; Selim, F.A. Strong visible and near infrared luminescence in undoped YAG single crystals. AIP Adv. 2011, 1, 042170. [Google Scholar] [CrossRef]
- Chaika, M.A.; Dulina, N.A.; Doroshenko, A.G.; Parkhomenko, S.V.; Gayduk, O.V.; Tomala, R.; Strek, W.; Hreniak, D.; Mancardi, G.; Vovk, O.M. Influence of calcium concentration on formation of tetravalent chromium doped Y3Al5O12 ceramics. Ceram. Int. 2018, 44, 13513–13519. [Google Scholar] [CrossRef]
- Yavetskiy, R.P.; Baumer, V.N.; Doroshenko, A.G.; Kopylov, L.Y.; Kosyanov, D.Y.; Kravchenko, V.B.; Parkhomenko, S.V.; Tolmachev, A.V. Phase formation and densification peculiarities of Y3Al5O12:Nd3+ during reactive sintering. J. Cryst. Growth 2014, 401, 839–843. [Google Scholar] [CrossRef]
- Zhoua, T.; Zhang, L.; Lia, Z.; Wei, S.; Wu, J.; Wang, L.; Yang, H.; Fu, Z.; Chen, H.; Tang, D.; et al. Toward vacuum sintering of YAG transparent ceramic using divalent dopant as sintering aids: Investigation of microstructural evolution and optical property. Ceram. Int. 2017, 43, 3140–3146. [Google Scholar] [CrossRef]
- Waetzig, K.; Kunzer, M.; Kinski, I. Influence of sample thickness and concentration of Ce dopant on the optical properties of YAG:Ce ceramic phosphors for white LEDs. J. Mater. Res. 2014, 29, 2318–2324. [Google Scholar] [CrossRef]
- Lisitsyna, L.A.; Oleshko, V.I.; Putintseva, S.N.; Lisitsyn, V.M. Pulsed cathodoluminescence of irradiated LiF–O and LiF(U)–O crystals. Opt. Spectr. 2008, 105, 531–537. [Google Scholar] [CrossRef]
- Lisitsyna, L.A.; Lisitsyn, V.M. Composition nanodefects in doped lithium fluoride crystals. Phys. Solid State 2013, 55, 2297–2303. [Google Scholar] [CrossRef]
- Lisitsyn, V.M.; Valiev, D.T.; Lisitsyna, L.A.; Tupitsyna, I.A.; Polisadova, E.F.; Oleshko, V.I. Spectral kinetic characteristics of Li, Bi-activated cadmium tungstate crystals. J. Appl. Spectrosc. 2013, 80, 361–365. [Google Scholar] [CrossRef]
- Lisitsyn, V.M.; Valiev, D.T.; Tupitsyna, I.A.; Polisadova, E.F.; Oleshko, V.I.; Lisitsyna, L.A.; Andryuschenko, L.A.; Yakubovskaya, A.G.; Vovk, O.M. Effect of particle size and morphology on the properties of luminescencein ZnWO4. J. Lumin. 2014, 153, 130–135. [Google Scholar] [CrossRef]
- Lisitsyn, V.M.; Lisitsyna, L.A.; Polisadova, E.F. Nanodefects in highly imperfect optical crystals. Bull. Russ. Acad. Sci. Phys. 2019, 83, 336–342. [Google Scholar] [CrossRef]
- Lushchik, A.; Lushchik, C.; Popov, A.I.; Schwartz, K.; Shablonin, E.; Vasil’chenko, E. Influence of complex impurity centres on radiation damage in wide-gap metal oxides. Nucl. Instrum. Methods Phys. Res. B 2016, 374, 90–96. [Google Scholar] [CrossRef]
- Chung, S.-R.; Wang, K.-W.; Wang, M.-W. Hybrid YAG/CdSe quantum dots phosphors for white light-emitting diodes. J. Nanosci. Nanotechnol. 2013, 13, 4358–4363. [Google Scholar] [CrossRef]
- Shvaleva, M.; Tuzova, Y.; Romanov, A.; Aseev, V.; Nikonorov, N.; Mynbayev, K.; Bugrov, V. Optical and thermal properties of lead-silicate glass phosphors for high-power white LEDs. Tech. Phys. Lett. 2015, 41, 1041–1043. [Google Scholar] [CrossRef]
- Korepanov, V.I.; Lisitsyn, V.M.; Lisitsyna, L.A. Formation of near-defect excitons in alkali-halide crystals. Russ. Phys. J. 1996, 39, 1082–1092. [Google Scholar] [CrossRef]
- Pan, Y.; Wu, M.; Su, Q. Comparative investigation on synthesis and photoluminescence of YAG:Ce phosphor. Mater. Sci. Eng. B 2004, 106, 251–256. [Google Scholar] [CrossRef]
Figure 1.
X-ray diffraction (XRD) patterns of phosphor samples of different types synthesized under different conditions.
Figure 1.
X-ray diffraction (XRD) patterns of phosphor samples of different types synthesized under different conditions.

Figure 2.
Spectra of excitation (1) and luminescence (2) in SDL (a) and C-YAG phosphors (b).
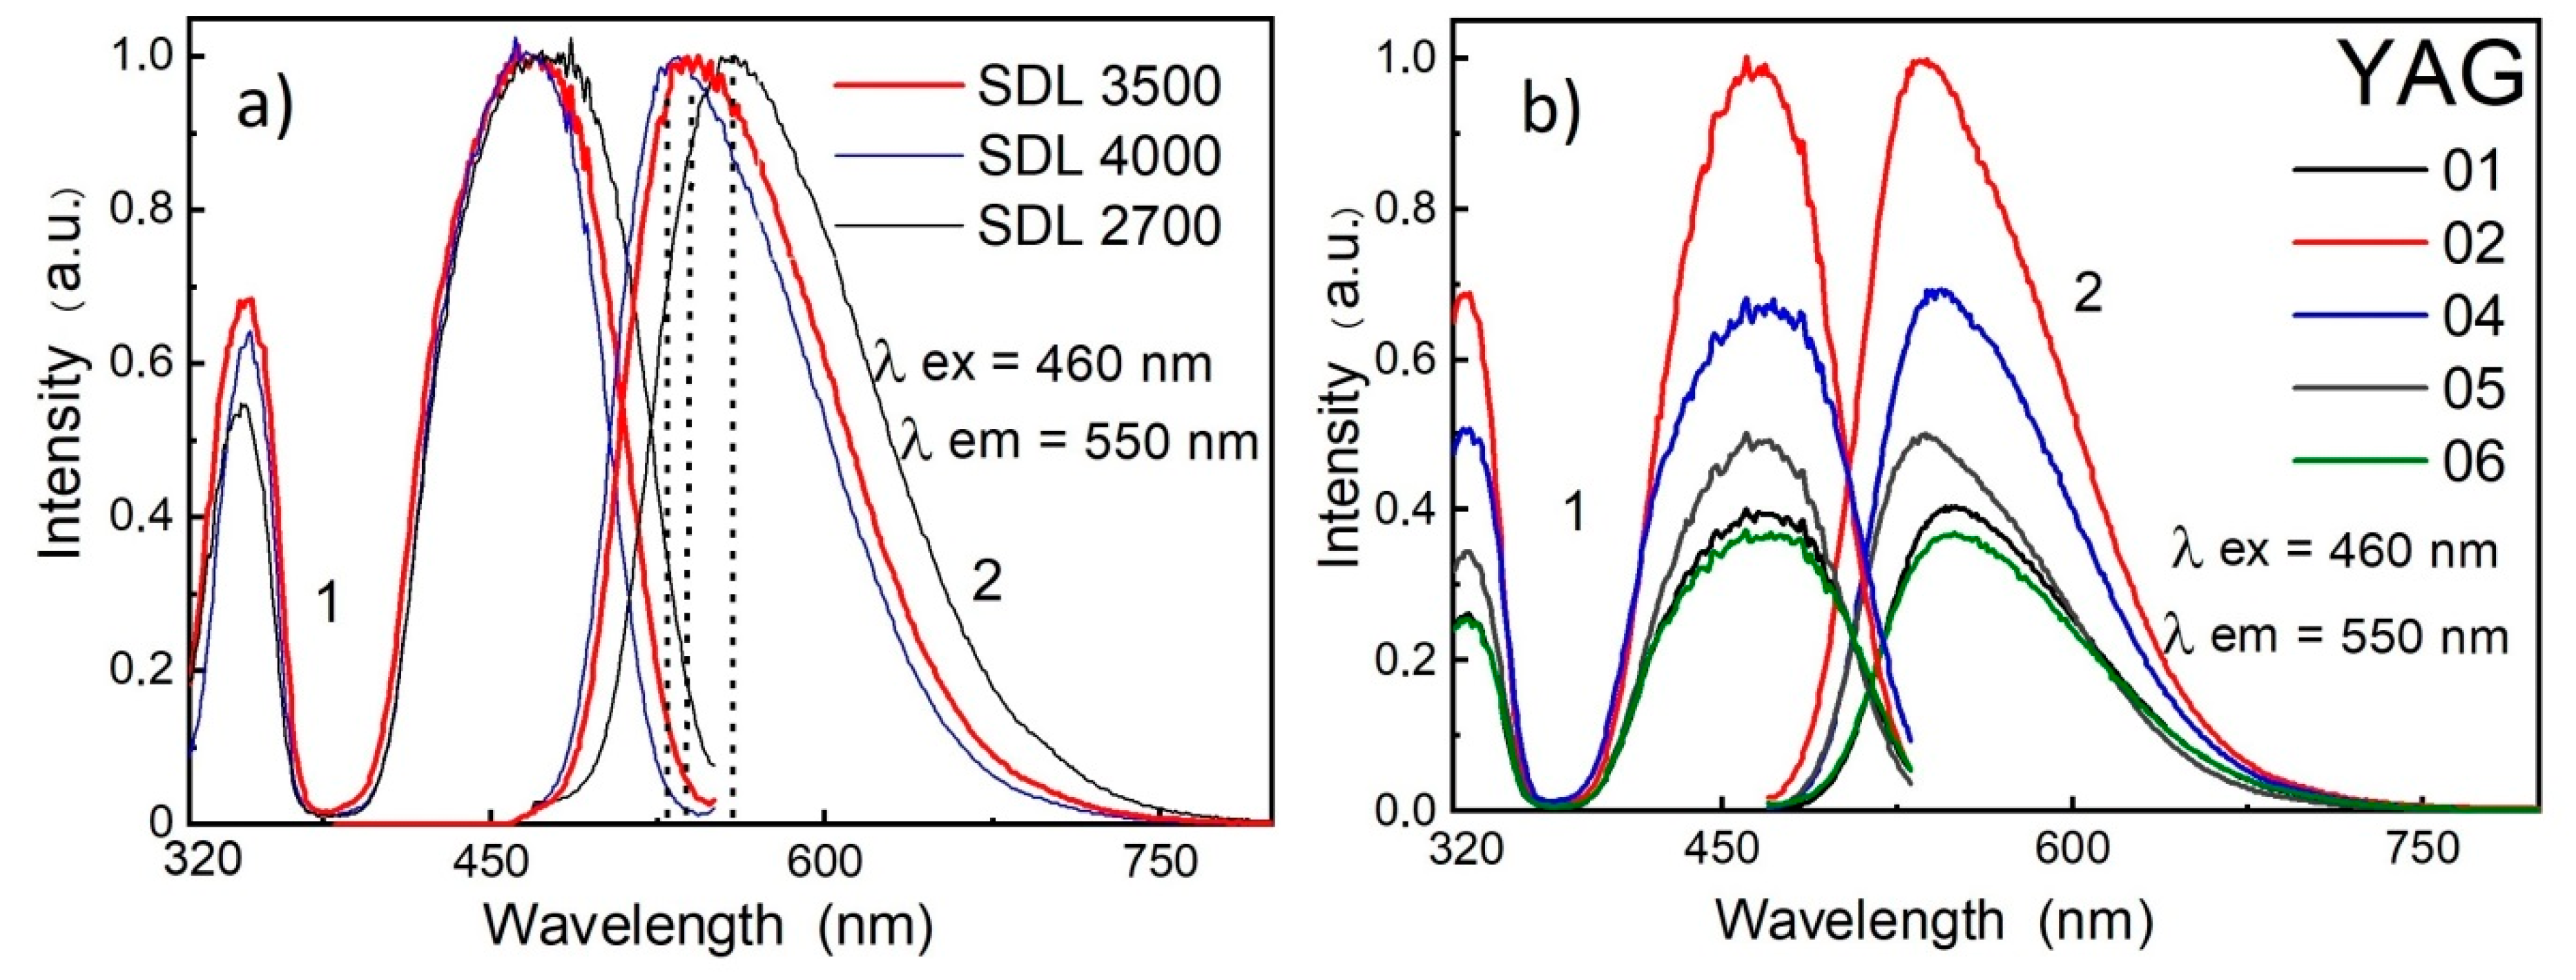
Figure 3.
Kinetics of photoluminescence (PL) decay in the region of 530−560 nm in C-YAG phosphors.

Figure 4.
(a) Excitation spectra of luminescence in the visible region (LV; λem = 540 nm); (b) excitation spectra of luminescence in the ultraviolet region (LUV; λem = 370 nm) in C-YAG phosphors.
Figure 4.
(a) Excitation spectra of luminescence in the visible region (LV; λem = 540 nm); (b) excitation spectra of luminescence in the ultraviolet region (LUV; λem = 370 nm) in C-YAG phosphors.

Figure 5.
Luminescence spectra of SDL phosphors under excitation by excimer lamp radiation with (a) λ = 222, (b) 282, and (c) 308 nm; (d) luminescence spectra in phosphor SDL 2700 under excitation by different excilamp radiation.
Figure 5.
Luminescence spectra of SDL phosphors under excitation by excimer lamp radiation with (a) λ = 222, (b) 282, and (c) 308 nm; (d) luminescence spectra in phosphor SDL 2700 under excitation by different excilamp radiation.

Figure 6.
Luminescence spectra of C-YAG phosphors under excitation by radiation of KrCl (λ = 222 nm) and XeBr (λ = 282 nm) excilamps. The insets (a,b) provide enlarged luminescence spectra in the UV region.
Figure 6.
Luminescence spectra of C-YAG phosphors under excitation by radiation of KrCl (λ = 222 nm) and XeBr (λ = 282 nm) excilamps. The insets (a,b) provide enlarged luminescence spectra in the UV region.
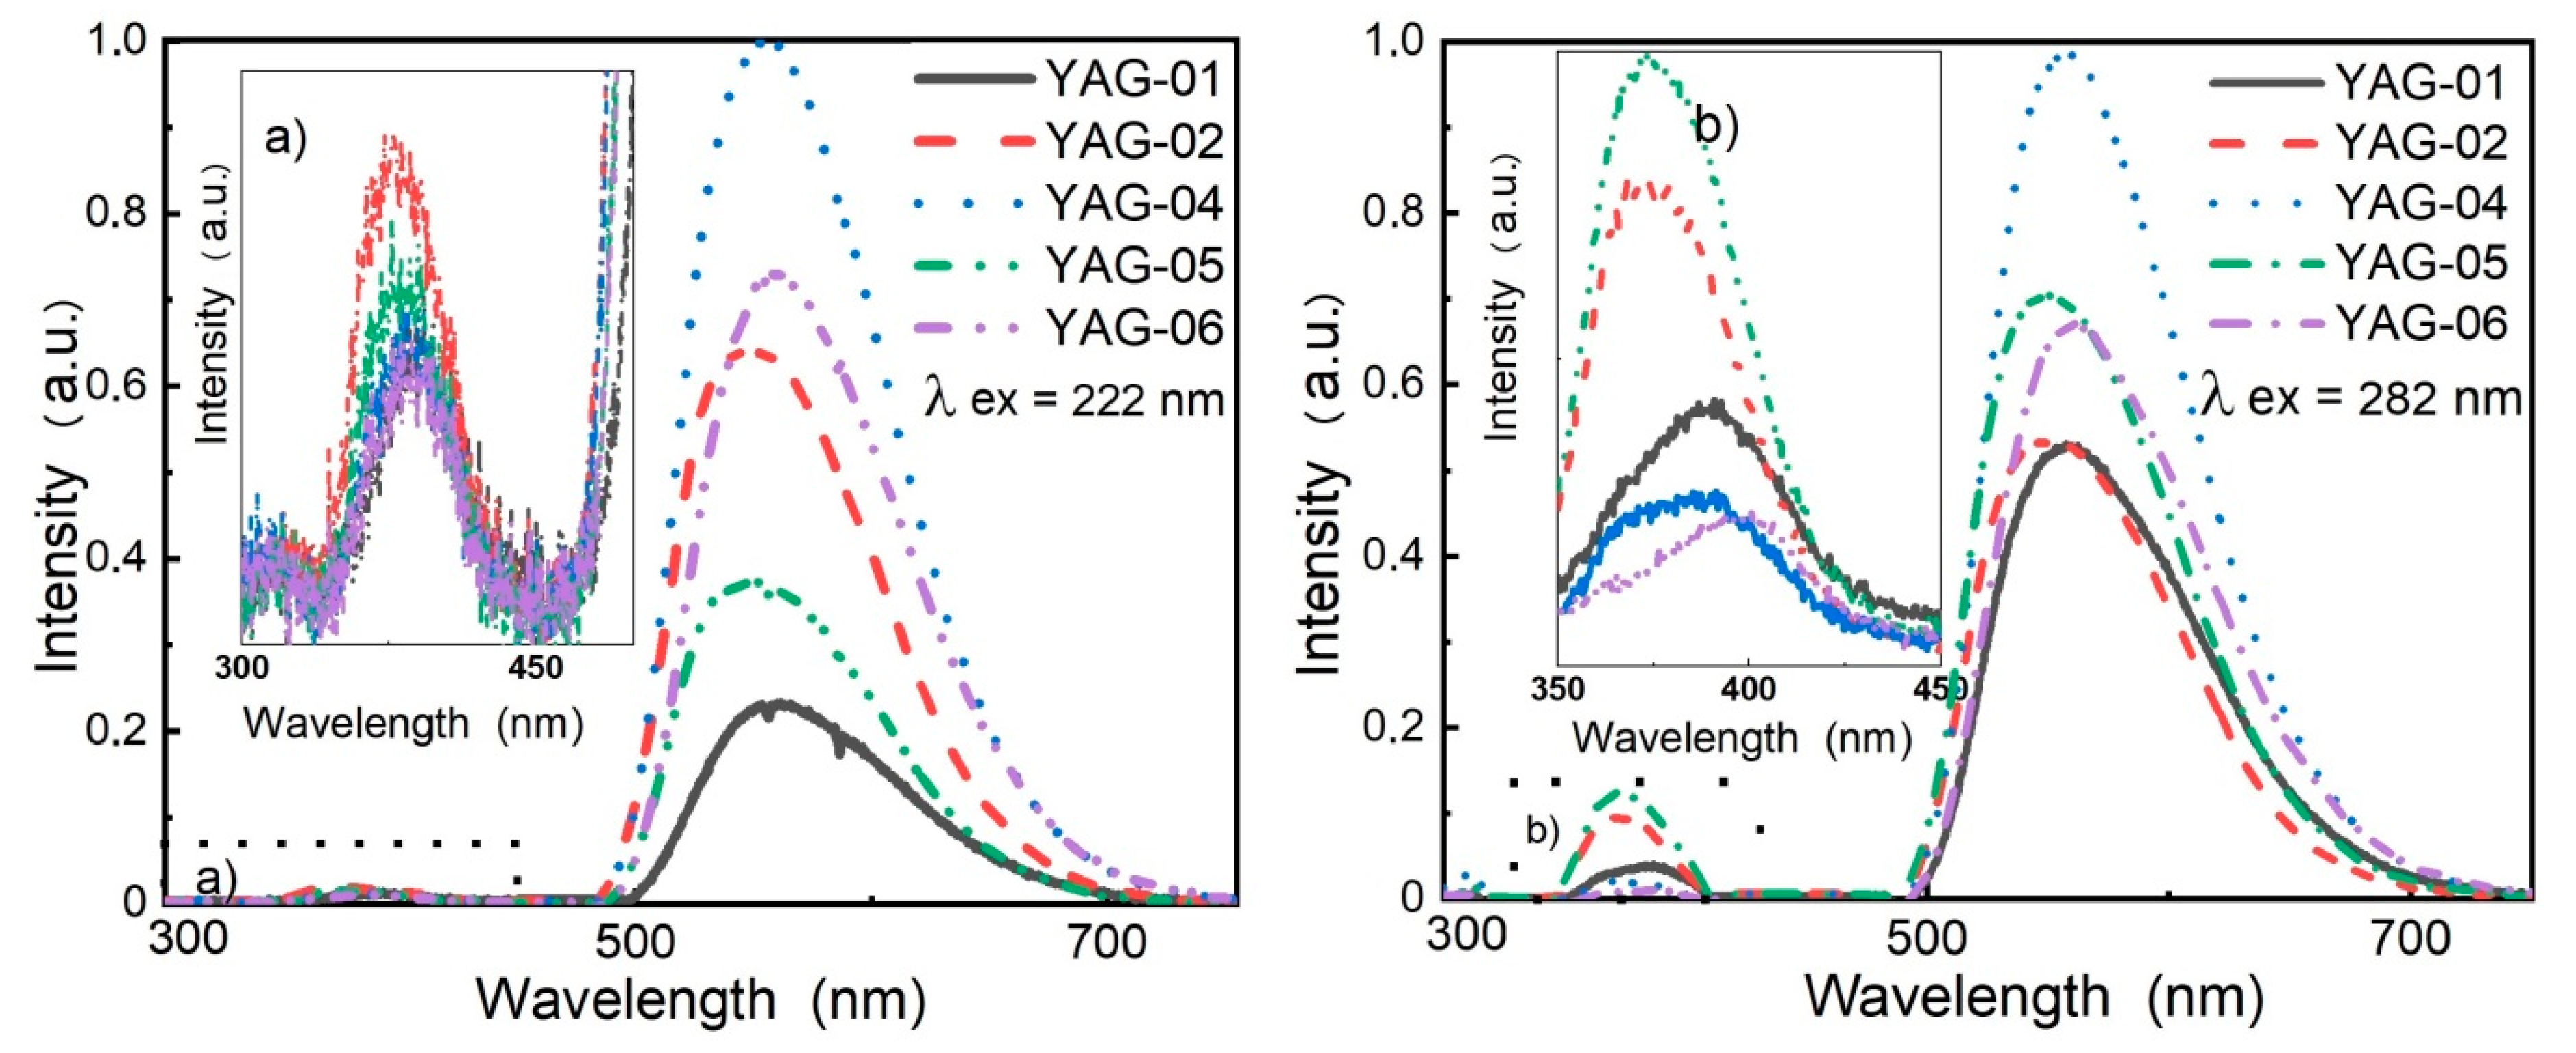
Figure 7.
Cathodoluminescence (CL) spectra of SDL and C-YAG phosphors (a); enlarged luminescence spectra in the UV region (b).
Figure 7.
Cathodoluminescence (CL) spectra of SDL and C-YAG phosphors (a); enlarged luminescence spectra in the UV region (b).

Figure 8.
(a) CL spectra in SDL phosphors; (b) dependence of the band intensity at 312 nm on the excitation power in SDL 3500 phosphor. The maximum energy density per pulse was 350 mJ/cm2.
Figure 8.
(a) CL spectra in SDL phosphors; (b) dependence of the band intensity at 312 nm on the excitation power in SDL 3500 phosphor. The maximum energy density per pulse was 350 mJ/cm2.

Figure 9.
Kinetic curves of CL decay in the region of 560 nm in phosphors of different types; (a) in the range 0−300 ns; (b) in the range 0−100 μs.
Figure 9.
Kinetic curves of CL decay in the region of 560 nm in phosphors of different types; (a) in the range 0−300 ns; (b) in the range 0−100 μs.

Figure 10.
Model representation of the band structure of phosphor with nanodefects.


Table 1.
Elemental composition of the SDL and C-YAG phosphors synthesized in 2016 (at.%).
| Phosphor | Y | Al | O | Gd | Ce |
|---|---|---|---|---|---|
| SDL 2700 | 3.5 | 24.6 | 52.8 | 19.1 | + |
| SDL 3500 | 13.8 | 26.0 | 57.3 | 2.5 | 0.4 |
| SDL 4000 | 13.8 | 27.0 | 58.8 | 0.4 | |
| YAG-01 | 12.5 | 29.4 | 54.0 | 2.7 | 1.4 |
| YAG-02 | 12.9 | 28.0 | 58.2 | 0.9 | |
| YAG-04 | 13.3 | 29.2 | 56.9 | 0.6 | |
| YAG-05 | 12.6 | 28.6 | 57.3 | 0.5 | 1.0 |
| YAG-06 | 11.3 | 29.6 | 55.3 | 2.9 | 0.9 |
Table 2.
Characteristics of photoluminescence (PL) at 530–560 nm in the SDL and C-YAG phosphors under excitation at 460 nm: the position of the luminescence peak (λmax), the full width at half maximum (FWHM) of the emission band (ΔE), the characteristic decay time (τ), and the energy yield of the energy conversion (ηe) at λex = 447 nm.
| Phosphor | λmax (nm) | ΔE (eV) | τ (ns) | ηe |
|---|---|---|---|---|
| SDL 2700 | 570 | 0.49 | 59 | 0.368 |
| SDL 3500 | 545 | 0.48 | 65 | 0.345 |
| SDL 4000 | 535 | 0.49 | 68 | 0.394 |
| YAG-01 | 560 | 0.30 | 81 | 0.346 |
| YAG-02 | 540 | 0.38 | 78 | 0.393 |
| YAG-04 | 540 | 0.36 | 62 | 0.400 |
| YAG-05 | 540 | 0.38 | 76 | 0.374 |
| YAG-06 | 555 | 0.32 | 76 | 0.397 |
Table 3.
Decay time (τi), amplitude (Ai), and light sum (Ai × τi) of slow components of the kinetics of cathodoluminescence (CL) in the visible spectral region in SDL phosphors at 300 K.
Table 3.
Decay time (τi), amplitude (Ai), and light sum (Ai × τi) of slow components of the kinetics of cathodoluminescence (CL) in the visible spectral region in SDL phosphors at 300 K.
| Parameter | SDL 2700 | SDL 3500 | SDL 4000 | ||||||
|---|---|---|---|---|---|---|---|---|---|
| Batch | Batch | Batch | |||||||
| 2015 | 2016 | 2018 | 2015 | 2016 | 2018 | 2015 | 2016 | 2018 | |
| τ2 (μs) | 2.38 | 2.4 | 2.37 | 3.44 | 3.35 | 3.33 | 2.58 | 2.59 | 2.64 |
| A2 | 1.1 | 1.1 | 1.1 | 1.08 | 1.09 | 1.09 | 1.07 | 1.07 | 1.09 |
| A2 × τ2 | 2.62 | 2.64 | 2.61 | 3.72 | 3.65 | 3.66 | 2.76 | 2.77 | 2.88 |
| τ3 (μs) | 19.9 | 20.0 | 21.9 | 27.9 | 27.3 | 28.9 | 22.2 | 21.3 | 23.0 |
| A3 | 0.02 | 0.02 | 0.02 | 0.06 | 0.05 | 0.05 | 0.03 | 0.03 | 0.04 |
| A3 × τ3 | 0.39 | 0.36 | 0.37 | 1.67 | 1.36 | 1.56 | 0.67 | 0.64 | 0.82 |
Table 4.
Decay time (τi), amplitude (Ai), and light sum (Ai × τi) of slow components of the CL kinetics in the visible spectral region in C-YAG phosphors at 300 K.
Table 4.
Decay time (τi), amplitude (Ai), and light sum (Ai × τi) of slow components of the CL kinetics in the visible spectral region in C-YAG phosphors at 300 K.
| Parameter | Phosphor Type | ||||
|---|---|---|---|---|---|
| 01 | 02 | 04 | 05 | 06 | |
| τ2 (μs) | 3.11 | 2.78 | 3.23 | 2.57 | 3.15 |
| A2 | 1.07 | 1.09 | 1.06 | 1.06 | 1.09 |
| A2 × τ2 | 3.29 | 3.02 | 3.42 | 2.74 | 3.44 |
| τ3 (μs) | 28.12 | 24.62 | 29.35 | 21.23 | 28.3 |
| A3 | 0.06 | 0.05 | 0.08 | 0.03 | 0.06 |
| A3 × τ3 | 1.74 | 0.98 | 2.34 | 0.68 | 1.75 |
Table 5.
Decay time of slow components of CL kinetics in the ultraviolet (UV) spectral region in C-YAG phosphors at 300 K.
Table 5.
Decay time of slow components of CL kinetics in the ultraviolet (UV) spectral region in C-YAG phosphors at 300 K.
| Peak of Emission | 312 nm | 380 nm | ||
|---|---|---|---|---|
| Decay Time | τ1 (ns) | τ2 (µs) | τ1 (ns) | τ2 (ns) |
| SDL 2700/2015 | 200 | 2.6 | 15 | 100 |
| SDL 2700/2016 | 200 | 2.6 | 15 | 100 |
| SDL 3500/2015 | 160 | 1.14 | 13 | 135 |
| SDL 3500/2016 | 160 | 1.14 | 15 | 100 |
| SDL 4000/2015 | 170 | 0.85 | 15 | 100 |
| SDL 4000/2016 | 170 | - | 15 | 100 |
© 2019 by the authors. Licensee MDPI, Basel, Switzerland. This article is an open access article distributed under the terms and conditions of the Creative Commons Attribution (CC BY) license (http://creativecommons.org/licenses/by/4.0/).
Share and Cite
MDPI and ACS Style
Lisitsyn, V.; Lisitsyna, L.; Tulegenova, A.; Ju, Y.; Polisadova, E.; Lipatov, E.; Vaganov, V. Nanodefects in YAG:Ce-Based Phosphor Microcrystals. Crystals 2019, 9, 476. https://doi.org/10.3390/cryst9090476
AMA Style
Lisitsyn V, Lisitsyna L, Tulegenova A, Ju Y, Polisadova E, Lipatov E, Vaganov V. Nanodefects in YAG:Ce-Based Phosphor Microcrystals. Crystals. 2019; 9(9):476. https://doi.org/10.3390/cryst9090476
Chicago/Turabian StyleLisitsyn, Victor, Ludmila Lisitsyna, Aida Tulegenova, Yangyang Ju, Elena Polisadova, Evgeniy Lipatov, and Vitaliy Vaganov. 2019. "Nanodefects in YAG:Ce-Based Phosphor Microcrystals" Crystals 9, no. 9: 476. https://doi.org/10.3390/cryst9090476
Note that from the first issue of 2016, this journal uses article numbers instead of page numbers. See further details here.