Article

Fluorescent Amorphous Distyrylnaphthalene-Based Polymers: Synthesis, Characterization and Thin-Film Nanomolar Sensing of Nitroaromatics in Water

INQUISUR, Departamento de Química, Universidad Nacional del Sur (UNS)-CONICET, Av. Alem 1253, Bahía Blanca B8000CPB, Argentina
*
Author to whom correspondence should be addressed.
Polymers 2018, 10(12), 1366; https://doi.org/10.3390/polym10121366
Submission received: 20 November 2018 / Revised: 5 December 2018 / Accepted: 6 December 2018 / Published: 10 December 2018

Abstract

:
Two new fluorescent segmented conjugated polymers with either 1,4- or 2,6-distyrylnaphthalene chromophores and their model compounds were synthesized and the chemosensing abilities of the polymeric thin films to detect nitroaromatics (NACs) in aqueous media were evaluated. The structural, thermal and optical properties of the polymers were correlated with those displayed by their corresponding model compounds. Changes in the connectivity of naphthylene units caused minor differences in optical properties, morphology and quenching efficiencies. Molecular modeling highlighted the extremely bent character of polymer microstructures that explains their high solubility and amorphous character. Polymeric films are amorphous, strongly fluorescent and showed remarkable quenching efficiencies in the nanomolar range with picric acid (PA) and trinitrotoluene (TNT). Quenching experiments using either different nitroaromatic quenchers, excitation wavelengths, excitation beam path-lengths, or time of exposure of the film to the quenching solution evidenced the dominant role of inner filter effects (IFE) in the polymer response to NACs in the micromolar range. The sensing response towards PA, a quencher that strongly absorbs at the excitation wavelength, has an IFE contribution even at the nanomolar range, while the response towards the non-absorbing TNT depends only on the quenching occurring after diffusion of the analyte into the film.

Graphical Abstract

1. Introduction

Fluorescent organic materials have a broad range of sensing applications [1,2] and exist in a variety of architectures [3], ranging from small molecules [4] to chromophoric assemblies, such as monolayers [5], macromolecules [6] or dendrimers [7]. Among them, thin films of fluorescent polymers have raised much interest for chemo-/bio-sensing [8] due to their ease of fabrication, mechanical and chemical stability, tunable shape and portability, as well as their success in detecting vapors of explosive compounds as a result of an amplified response [9]. In addition to the intrinsic electro-optical properties of the polymer, permeation of analytes across polymer films, that depends on both morphology and polymer-analyte interactions, is essential in solid-state sensing configurations where luminescent films respond to trace amounts of analytes which are either in the vapor phase or in solution [8,9].
We have previously evaluated the capabilities of thin films of segmented conjugated polymers (SCPs) to detect environmental pollutants presenting a hazard to ecological and human health that are present in water bodies of industrial and city areas, such as nitroaromatic compounds (NACs) [10,11]. In order to obtain amorphous morphologies that could favor diffusion of the analyte from the aqueous solution into the polymeric film, we knitted semi-rigid fluorophores with isopropylene units, which confer a highly twisted nature to the main chain. We found that thin films of these disordered assemblies of fluorophores proved to be very sensitive towards NACs in aqueous media [12,13]. Indeed, we and many others have found that different fluorescent materials [14,15,16,17,18,19,20,21,22,23,24], despite their huge disparity in chemical structure, are very responsive in aqueous media towards picric acid (PA) and show no, or a small, responses to trinitrotoluene (TNT) and related nitrotoluenes. Nevertheless, it has been difficult to establish general structure-property relationships for the quenching responses of NACs that could be used to improve the performance and selectivity of the materials by rational design. Some of the difficulties arise from the occurrence of different or competing quenching mechanisms other than photoinduced electron transfer (ET) [3], such as resonance energy transfer (RET) [3,16] or inner filter effects (IFE) [25,26,27].
In this report, we first describe the synthesis and characterization of the fluorescent segmented conjugated polymers P14 and P26, with either 1,4- or 2,6-distyrylnaphthalene chromophores, and their model compounds M14 and M26 (Scheme 1). In addition to showing remarkable photophysical properties, the distyrylnaphthalene moieties can be tethered onto the main chain with different regio-connectivity, which could modify optical properties, morphology and quenching efficiencies. The new polymers and their model compounds were characterized by gel permeation chromatography (GPC), differential scanning calorimetry (DSC), NMR spectroscopy, FT-IR spectroscopy, UV-Vis spectroscopy, and fluorescence spectroscopy. The structural, thermal and optical properties of the polymers were correlated with those displayed by their corresponding model compounds. Finally, we evaluated the chemosensing abilities of the polymeric thin films to detect various hydrophilic and hydrophobic nitroaromatics in aqueous media.

2. Materials and Methods

2.1. General Methods and Instrumentation

The general methods and instrumentation used in the structural, thermal and optical characterization are reported in Supplementary Materials. Several hydrophobic (i.e., 2,4,6-trinitrotoluene, TNT; 2,4-dinitrotoluene, DNT; 4-nitrotoluene, NT) and hydrophilic (i.e., picric acid, PA; 2,4-dinitrophenol, DNP; 4-nitrophenol, NP) nitroaromatics were used. Fluorescence control experiments were previously done by checking during 24 h the occurrence of polymer leakage from the film towards the aqueous media; P14 and P26 films supported on quartz or glass plates showed no bleeding.

2.2. Materials and Synthesis

Reagents (Sigma-Aldrich, Darmstadt, Germany) were used without further purification. DMF was dried over molecular sieves and stored under argon atmosphere. THF was distilled from Na/benzophenone. 1,4-Bis(bromomethyl)naphthalene and 2,6-Bis(bromomethyl)naphthalene were obtained by radical bromination of 1,4-dimethylnaphthalene and 2,6-dimethylnaphthalene, respectively. The reaction of the dibromides with triethylphosphite afforded the bisphosphonates 1a and 1b [28]. Aldehyde 2 and dialdehyde 3 were prepared according to the literature [13]. The details of the synthesis and characterization of the synthetic precursors, monomer, model compounds M14 and M26 and the polymers P14 and P26 are presented in Supplementary Materials.

2.3. Molecular Modeling

The ORCA 4.0 program package (Max Planck Institute for Coal Research, Mülheim, Germany) [29] and the graphical interface Gabedit 2.4.8 (Université Claude Bernard Lyon1, Villeurbanne, France) [30] were used. Initial structures were obtained with the AM1 method and then structure optimization was carried out using the PBEh-3c method [31]. This DFT method is based in a modified PBE functional, uses Ahlrichs-DZ basis sets and the “3c” stands for the use of a gCP correction, a dispersion correction (D3) and minor modifications of the basis sets. It has been designed to compute structures and interaction energies of large systems and could reach results close to that of the MP2/TZ level with a small fraction of the computational cost.

3. Results and Discussion
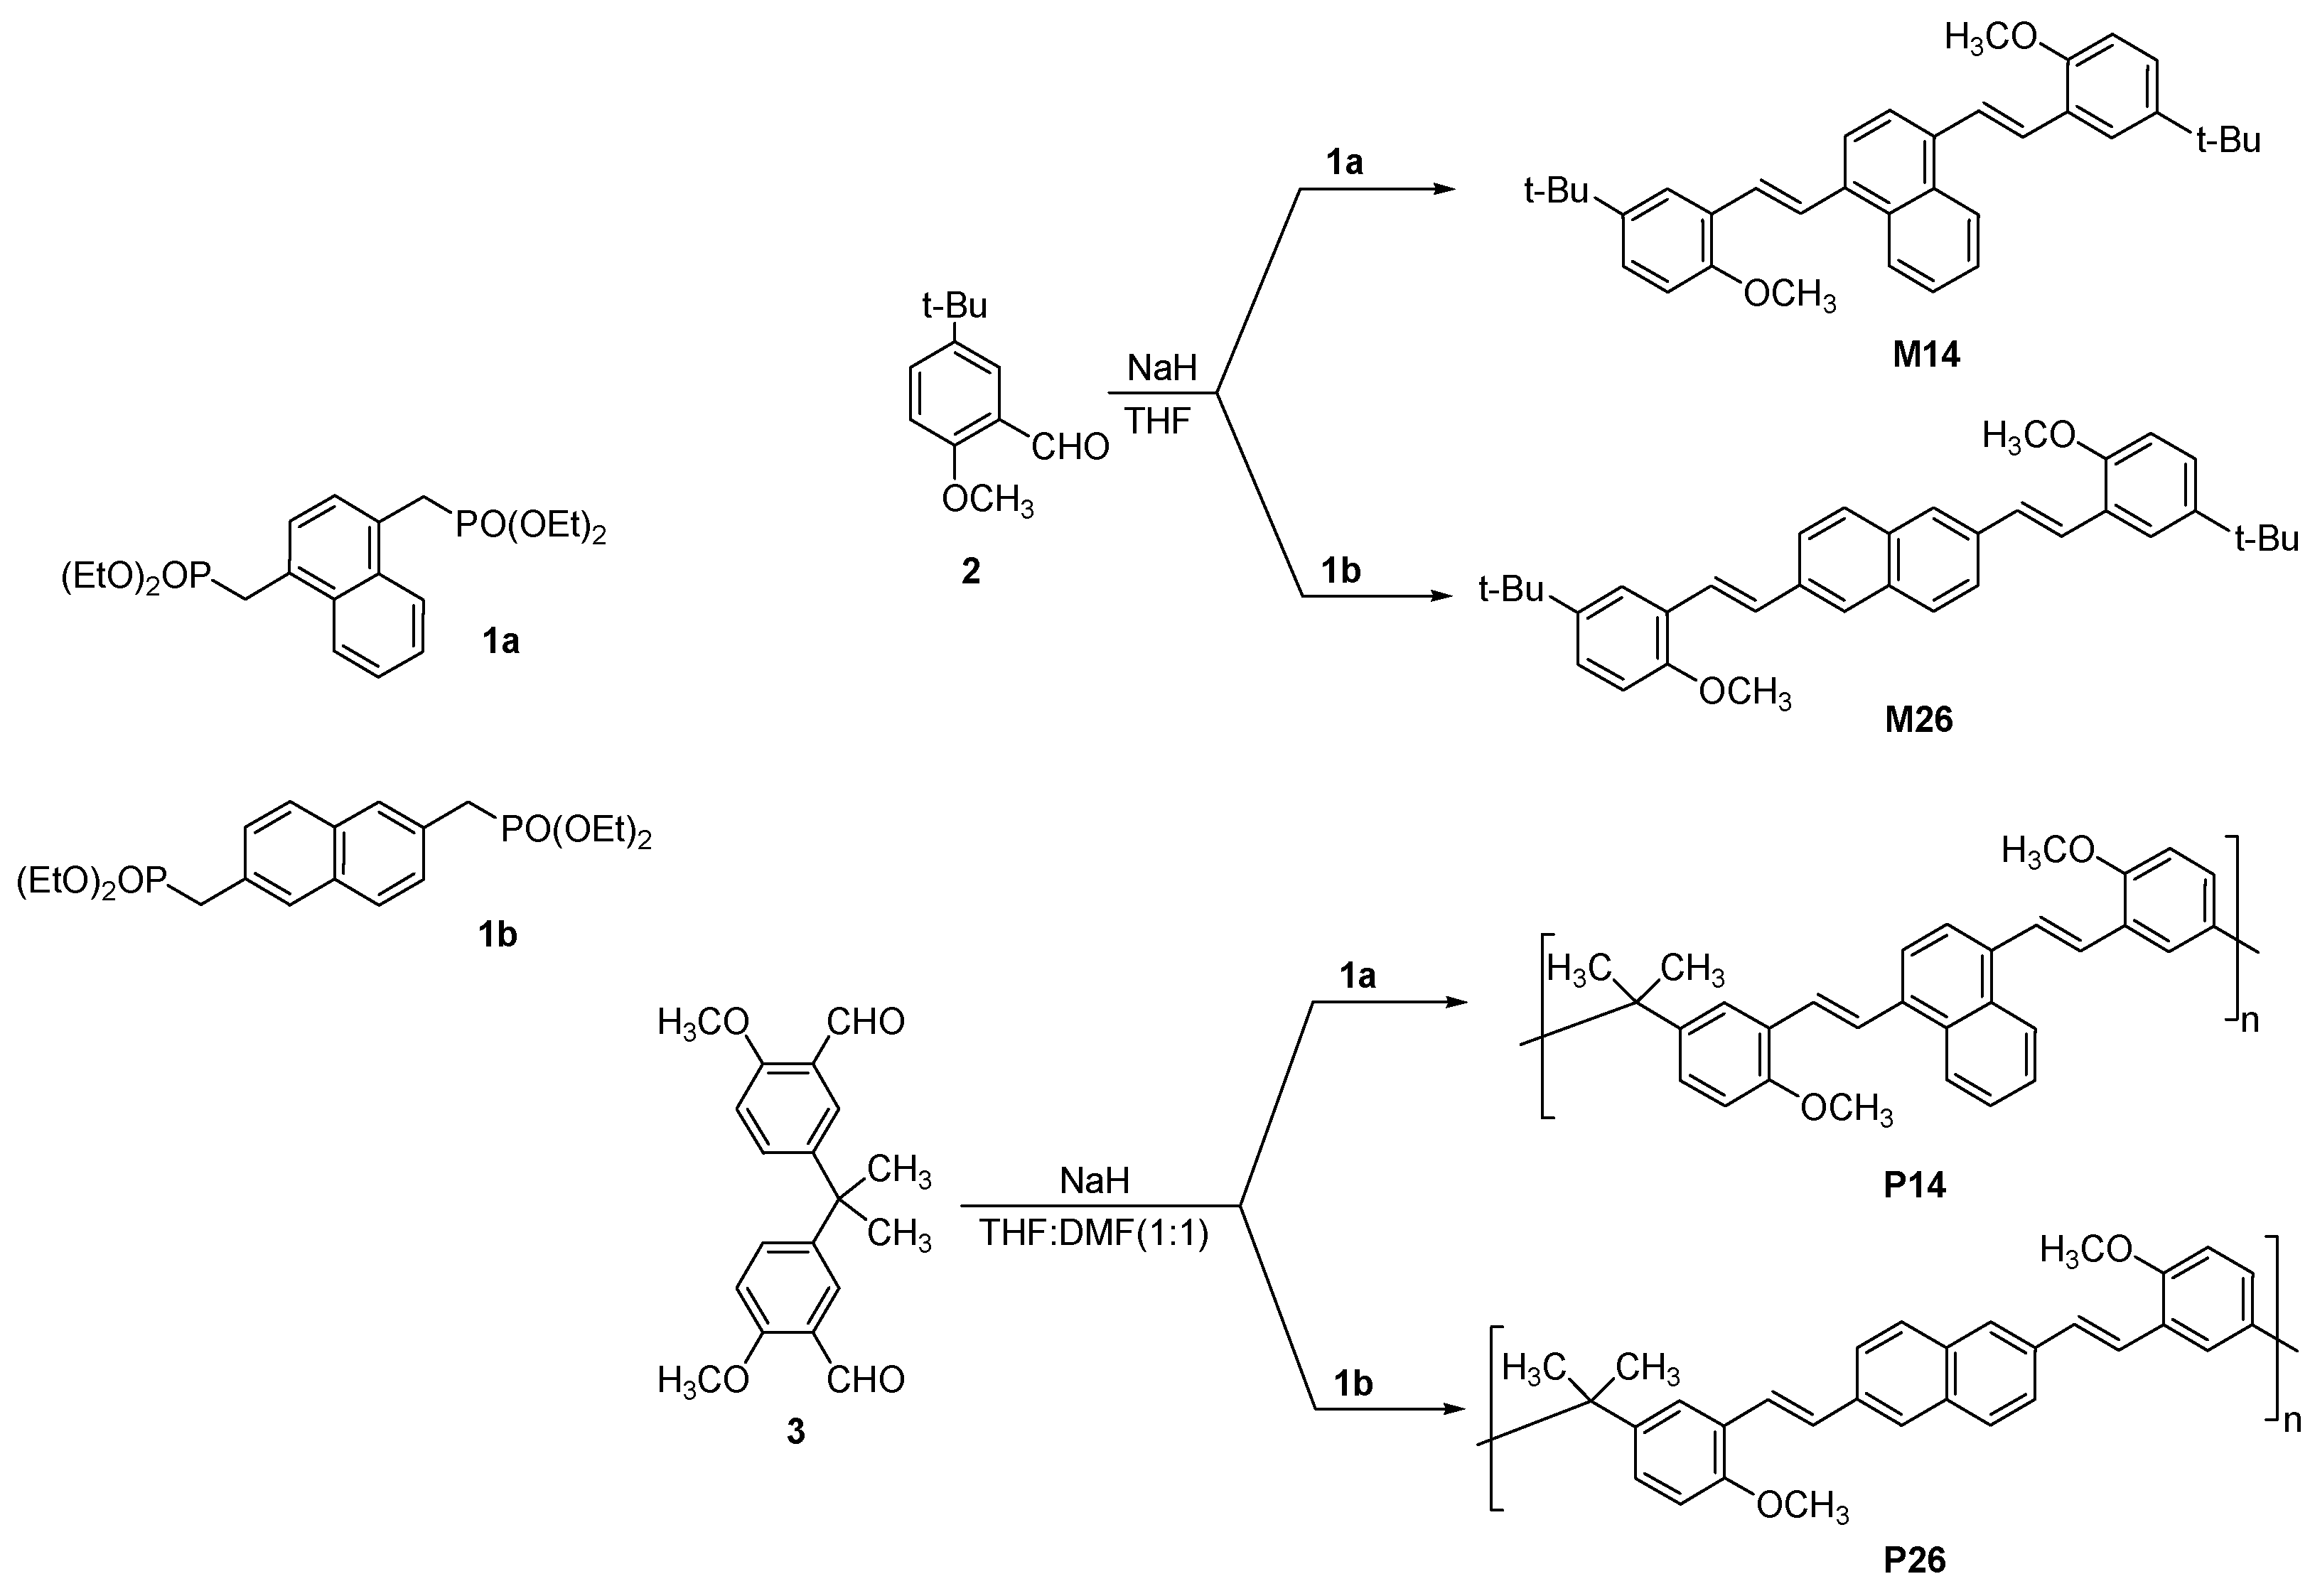
3.1. Synthesis

Synthetic routes for the new polymers P14 and P26 with bis(styrylnaphthylene) units tethered by isopropylene units and its model compounds M14 and M26 are shown in Scheme 1. The Horner-Emmons-Wittig coupling to obtain carbon-carbon double bonds with predominant E configuration was used. First, bisphosphonates 1a and 1b were prepared from the 1,4- and 2,6-bis(bromomethylene)naphthalenes, respectively. Then, monoaldehyde 2 and dialdehyde 3 were used as coupling partners of 1a and 1b to obtain M14 and M26 and the polymers P14 and P26. No precipitate or gel formation was detected when THF:DMF (1:1) was used as the polymerization reaction media. But early precipitation and lower degrees of polymerization were observed when the coupling reaction was run in pure THF. Benzaldehyde and diethyl benzylphosphonate were used as end-capping compounds to terminate polymerizations. Despite the lack of solubilizing long alkyl side chains, P14 and P26 were soluble in organic solvents such as CHCl3, CH2Cl2, DMF, toluene or THF so the crude polymers were precipitated from their chloroform solutions with methanol to give yellow solids.
GPC analysis indicated that good degrees of polymerization were reached (P14, Mn = 18.7 kDa, Mn/Mw = 2.4, DPn = 43; P26, Mn = 5.5 kDa, Mn/Mw = 2.4, DPn = 13). NMR and FTIR spectroscopies confirmed the all-trans stereochemistry and chemical structures of the coupling products (Figure 1). The 1H spectra of P14 and P26 showed ethenyl CH signals above 7.00 ppm with coupling constants Jtrans = 16.1 Hz in P14 and Jtrans = 13.5 Hz in P26, while no signals were observed in the region of 6.5 ppm which would correspond to their cis-counterparts (Figure 1). Likewise, when compared to their respective polymeric counterparts, the expanded aromatic regions of the model compounds M14 and M26 showed quite similar values of chemical shifts and Jtrans coupling constants and no cis-ethylenic signals at ca. 6.5 ppm, thus confirming the structural regularity of the polymeric structures (Figure 1, expanded aromatic regions). Besides, the presence in all coupling products of an intense IR band at ≈960 cm−1 (out-of-plane C–H deformation band) of trans-substituted vinylene groups and the absence of the characteristic absorbance of cis-substituted alkene at ≈730 cm−1 were additional indications of the high content of trans-configurations.

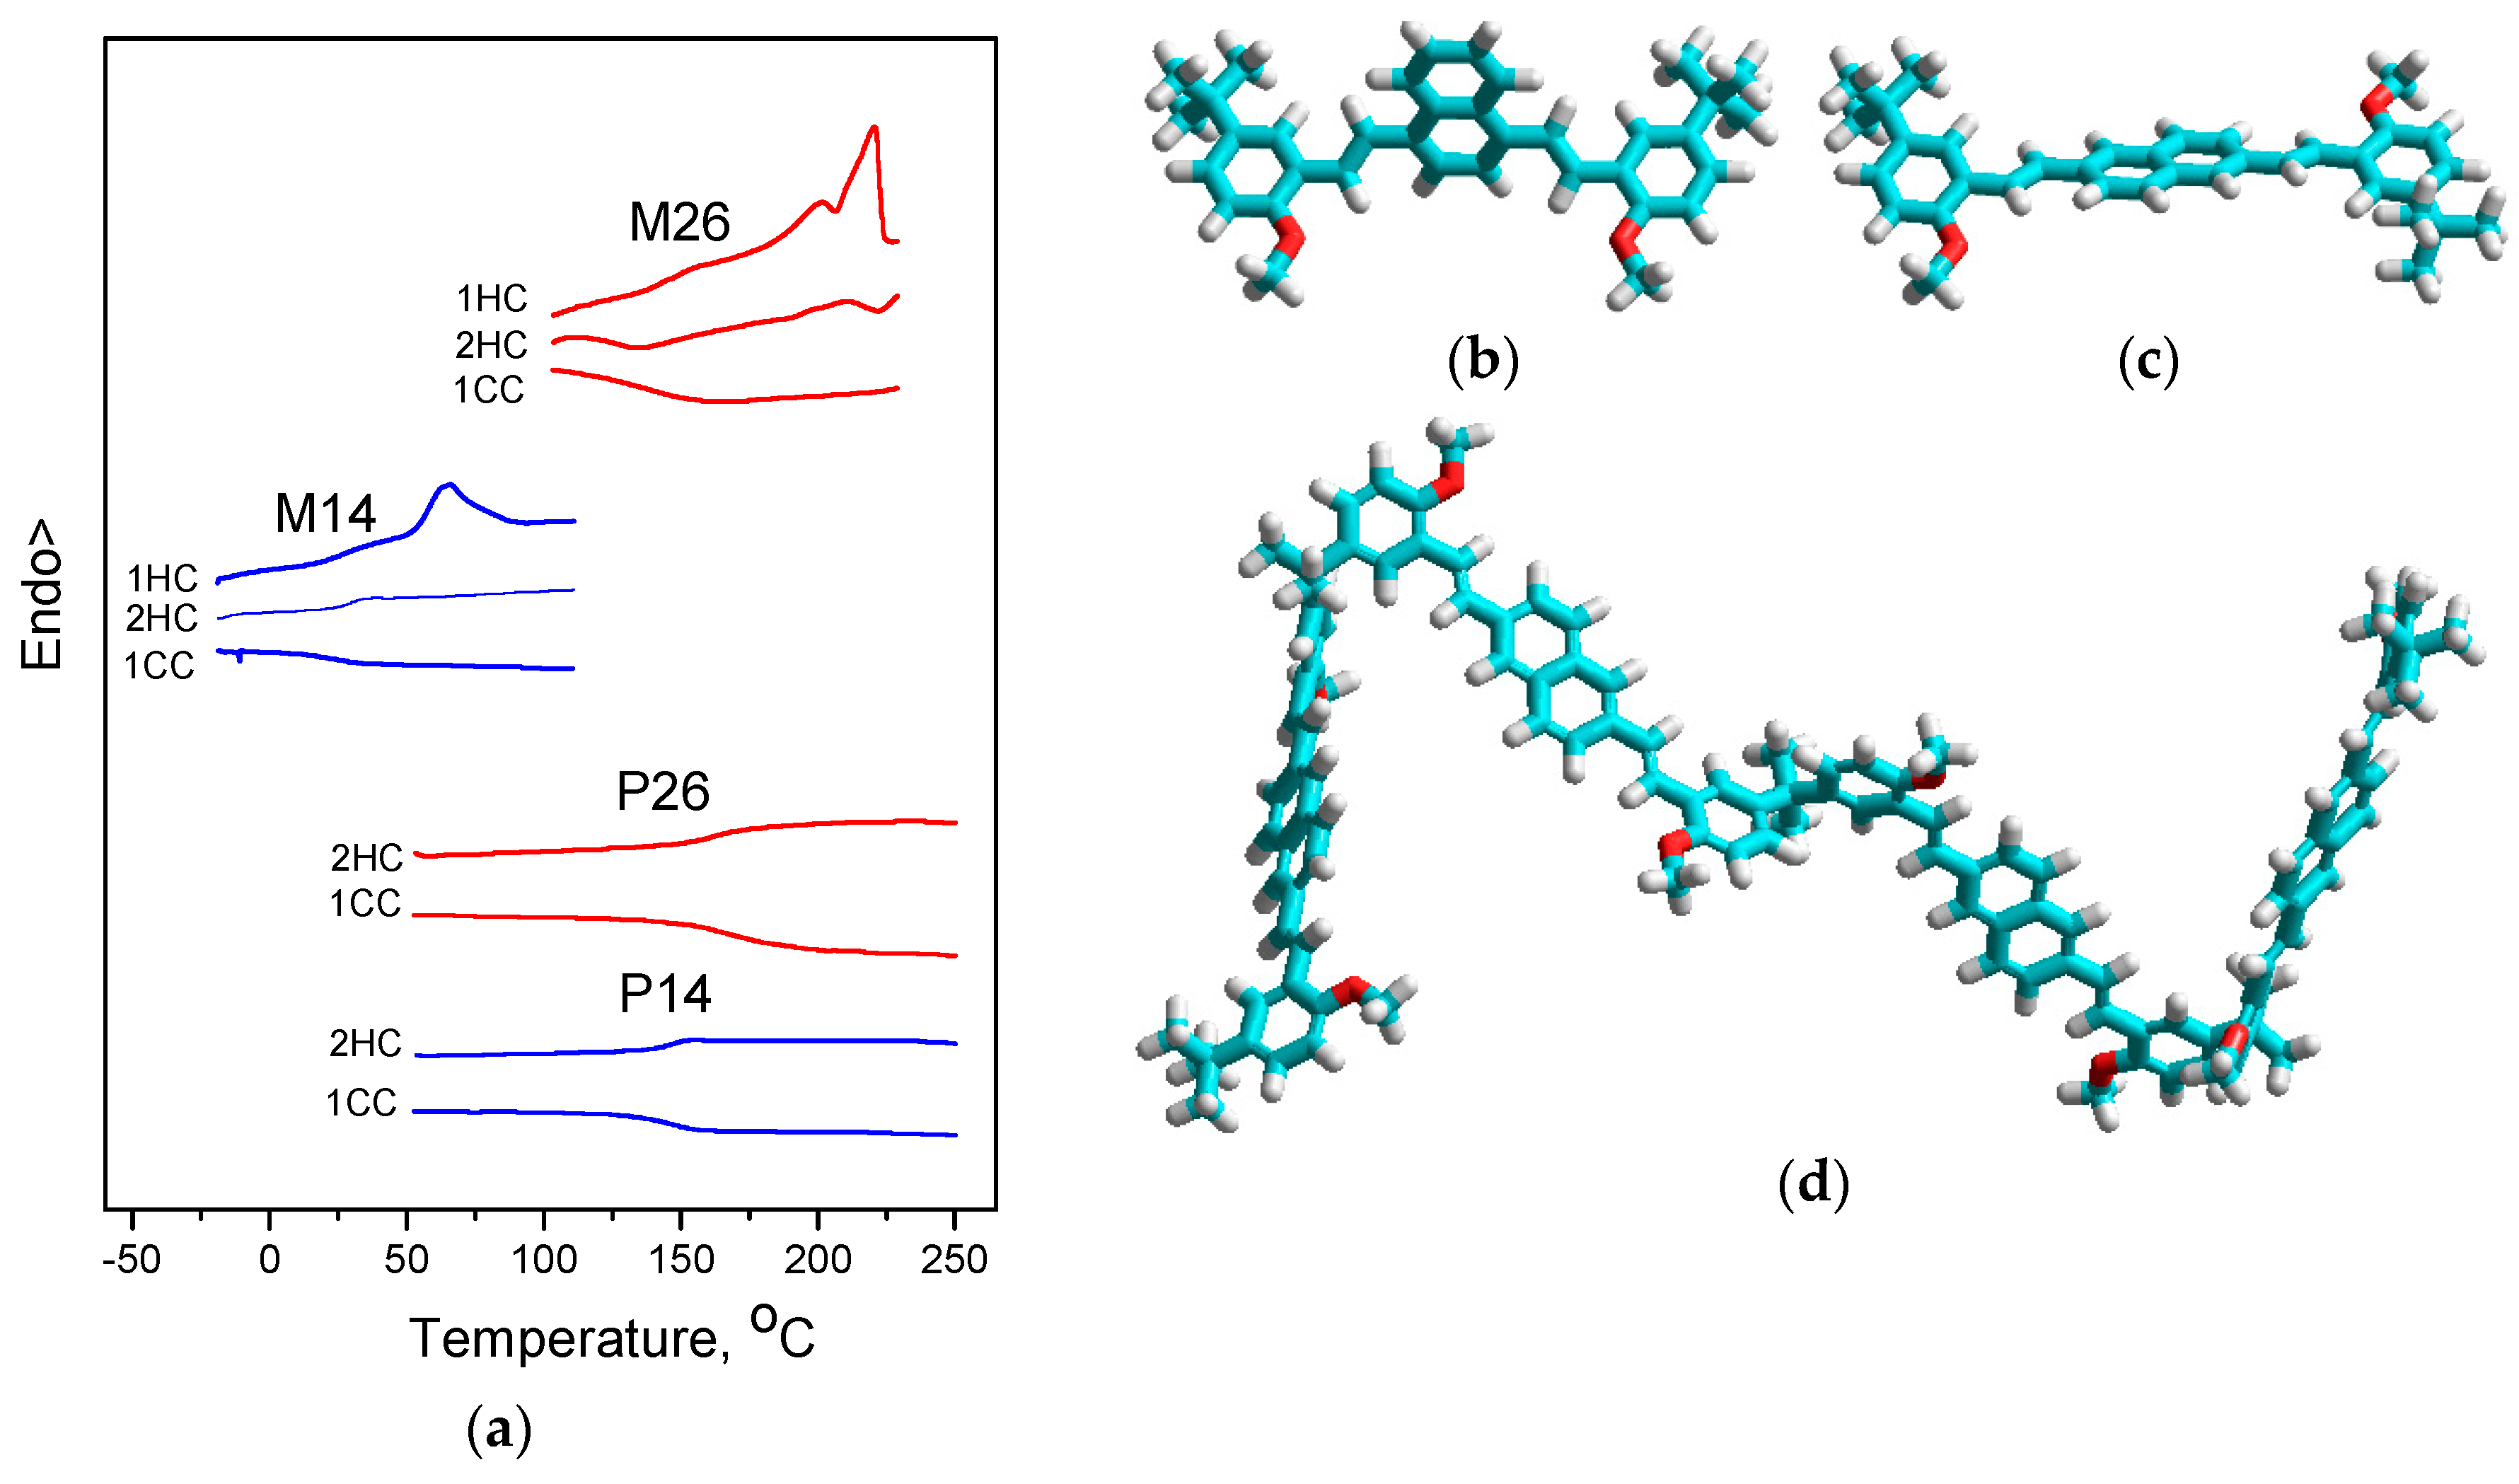
3.2. Morphology. Thermal and Optical Properties

The results of the DSC analysis are shown in Figure 2a and Table S1 (Supplementary Materials). The new distyrylnaphthylene M14 exhibited a strong glass transition (29 °C) and a broad melting endotherm (74 °C) in the first heating cycle, but cooling of the melt led to the formation of a glassy state (19 °C) which persisted in the subsequent heating cycles. M26 showed a strong glass transition (140 °C) and a broad melting endotherm (220 °C) in the first heating cycle. A broad crystallization exotherm (167 °C) was present only in the first cooling which was followed by the glass transition. Then, M26 exhibited only strong glass transitions upon repetitive heating and cooling cycles in DSC plots. Occasionally, weak cold crystallization followed by weak melting transitions was observed in the heating cycles. Both compounds bearing bulky tert-butyl groups have strong tendencies to form disordered gatherings that render kinetically stable amorphous glasses, though their differences in molecular structure are manifested in that M14 forms amorphous glasses after the first heating cycle while M26 achieves the amorphous state after the second heating cycle. On the whole, the longer and more planar M26 (Figure 2b) displayed higher transition temperatures than the shorter and bulgy M14 (Figure 2c). DSC traces of polymers P14 and P26 showed only noticeable glass transitions at 155 and 170 °C respectively, these transition values reflect the difference in connectivity of naphthylene groups in the semi-rigid moiety of the polymers again. Moreover, the films appeared completely black when observed by POM with cross polarizers in the temperature range between 50 and 300 °C thus indicating the occurrence of optically isotropic phases (Figure S1, Supplementary Materials). Thin films (thickness range = 30 to 200 nm) cast from chloroform solutions were transparent, homogeneous and appropriate for optical measurements. Likewise, thicker films continued to be transparent without a sign of birefringence even after several weeks at room temperature. Evidently, the high solubility and amorphous nature of the polymers P14 and P26 are rooted in the twisted chain conformations that the polymer microstructure must adopt by virtue of the angle imposed to the gem-chromophores by the saturated isopropylene spacer. The DFT/PBEh-3c molecular model of a tetramer of P26 shown in Figure 2d highlights its highly bent character.
The morphological information from DSC and POM was complemented with UV-Vis and fluorescence spectroscopy data that provided information about the interaction and local ordering of the chromophores [32,33]. Absorption and emission spectra of P14 in chloroform exhibited small red shifts in comparison to those of M14 (Figure 3a and Table S1, Supplementary Materials). Therefore, the interaction of adjacent chromophores along the isolated polymer chains is quite small. Both absorption spectra, which are usually very informative about the degree of order-disorder present in the solid state, of M14max,abs = 383 nm) and P14max,abs = 382 nm) films overlap in the condensed phase and show no distinctive differences against those recorded in solution (Figure 3b). Hence, no significant amounts of chromophores in either the monomeric or the polymeric assemblies form local ground-state aggregates within films. Moreover, the fluorescence spectra of a P14max,em = 472 nm) film exhibits a small blue-shift against that of M26max,em = 482 nm), which is due to a shift in the relative weight of the vibronic bands, revealing that excited species generated by chromophores locked in random orientations by the twisted nature of the polymer chains exist in an environment less ordered than that generated by the monomeric chromophores [32,33]. The same conclusions were reached by a similar comparative analysis of the optical properties of chloroform solutions and films of M26 and P26 (Figure 3c,d). Remarkably, all absorption transitions, as well as the emission transitions, of these distyrylnaphthalene-based model compounds and polymers lie roughly in the same spectroscopic region in the thin films showing that the different connectivity did not bring profound changes to their optical behavior. Calculations at the DFT level also indicate that minimal differences in the frontier molecular orbital (FMO) energies of the fluorophores are brought by either the different connectivity of the aromatic moieties in P14 and P26 or the monomeric versus the oligomeric structure (Figure 5a).

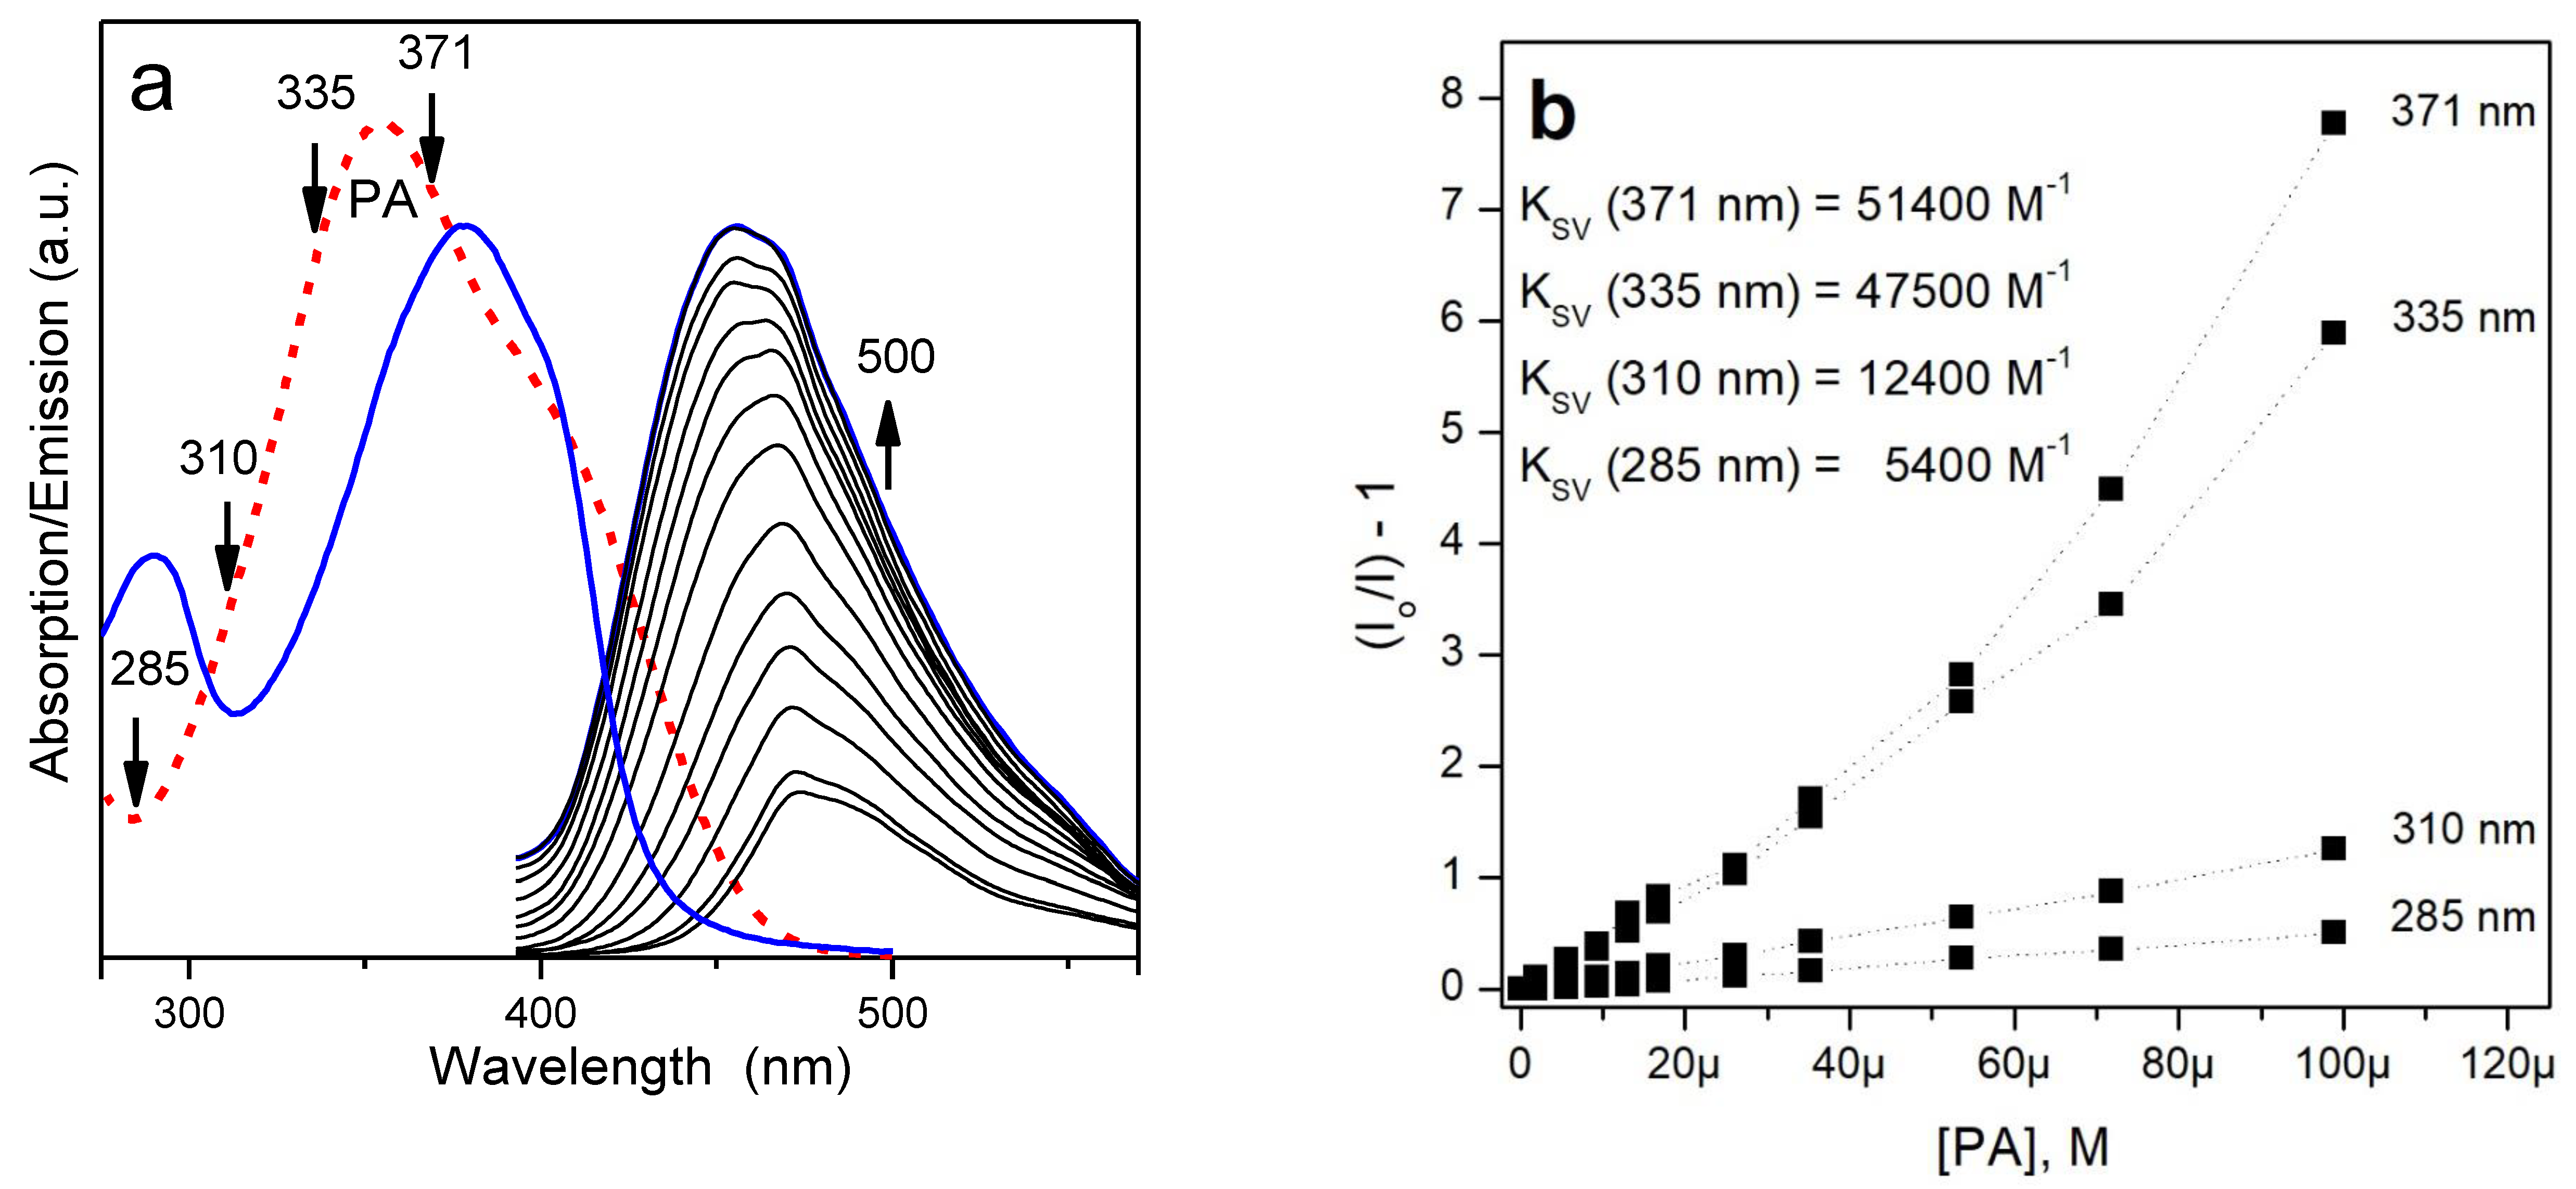
3.3. Fluorescence Response to Nitroaromatic Compounds

Quenching experiments were performed on polymer thin films supported on quartz or glass substrates which were immersed in water, and their fluorescence response to increasing concentrations of NACs was recorded. Data presented in Figure 4 were obtained from fluorescence intensities recorded after signal stabilization in the conditions commonly used to gather fluorescence data, that is, films were irradiated (λexc) at or near the maximum of the lowest energy absorption band (λmax,abs) and fluorescence intensities were observed (λobs) at or near the wavelength corresponding to the maximum in the emission spectra (λmax,em) of the sensing polymer. The Stern–Volmer (S–V) relationship, (Io/I) − 1 = KSV [NAC], between the ratio of the fluorescence intensity with and without the NAC, I and Io, and the added analyte concentration, [NAC], was used to quantify the quenching efficiencies for various NACs. Thus, Figure 4 shows plots of the S–V equation for P14 and P26 with nitrophenols and nitrotoluenes in the 0–450 µM concentration range. Table S2 (Supplementary Materials) lists the S–V constant (KSV) obtained from the linear part of the curves presented in Figure 4, which corresponded to regions between 5%–30% to 55%–65% of the total quenching, and the values of half of the maximum quench, Q50%, that is, the quencher concentration needed to reach (Io/I) − 1 = 1.
Polymers P14 and P26 showed high sensitivity to increased concentrations of NACs. Despite their microstructural differences, but in line with the similarity of the optical and morphological properties of their films, both polymers displayed fairly comparable responses. The quenching response to nitrophenols is distinctively higher than that to nitrotoluenes for both polymers, with PA and DNP showing the highest sensitivities. Thus, we found that the quenching efficiency order for the most studied NACs is PA >> TNT, as has been frequently observed in many other systems [14,15,16,17,18,19,20,21,22,23,24]. We also noticed that non-linear S–V relationships with upward curvature occurred with nitrophenols at the higher end of quencher concentrations. While with most nitrotoluenes, a rather steep increase of the efficiency in the low micromolar region is followed by a downward curvature at higher concentrations, this phenomena is more noticeable in P26 (Figure S2, Supplementary Materials). Moreover, in this region quenching efficiencies were comparable, i.e., TNT ≥ PA.
The non-linearity of S–V plots and the variation in quenching efficiencies between the low micromolar and high micromolar range imply that concurrent quenching mechanisms are operative. In electron-rich structures such as P14 and P26, fluorescence quenching by nitroaromatics that follows their optical excitation is generally attributed to electron-transfer quenching (ET) occurring from the excited polymer to the LUMO of the electron deficient nitroaromatic molecule. In our case, the results of the DFT calculations (see Figure 5a) indicate that ET from the excited polymer to the ground state of the nitroaromatics is thermodynamically favorable for all quenchers. Another mechanism of non-radiative excited state depletion involves radiationless energy transfer processes (FRET) [3,34]. Thus, fluorescence quenching could result from either ET or FRET or a combination of both processes. The latter process requires spectral superposition of the absorption spectrum of the quenchers and the fluorescence spectra of the fluorophores. Figure 5b presents the absorption spectra of the nitrophenols and the nitrotoluenes obtained at the same quencher concentration and the fluorescence spectra of both P14 and P26. There it can be observed that among the NACs tested here only the strongly acidic DNP and PA present intense absorption bands with λmax,abs ≈ 355 nm, which partially overlap the fluorescence spectra of P14 and P26, indicating that FRET could be contributing to quenching with these two NACs. On the contrary, no such overlap occurs with NP and the other nitrotoluenes tested here. Moreover, inner filter effects (IFE) must also be considered for absorbing quenchers. Although IFE is not strictly a fluorescence quenching process, a non-fluorescent quencher could absorb either the excitation beam (primary IFE) or the emitted beam (secondary IFE) of the fluorophores or both. Such attenuation of the excitation and emission beams results in an additional contribution to the total response of the polymers to NACs [34]. The quenching efficiency order for P26 (see Figure 4 and Table S1, Q50% = PA > DNP > NP >> NT > DNT > TNT) follows the intensity of their optical densities (OD) at the excitation wavelength of P26exc = 371 nm) as highlighted by the dashed vertical bar in Figure 5b. It also can be appreciated in Figure 5b that the red shift in the λexc used for P14exc = 384 nm) reduces the OD of the quencher NP at the λexc significantly, and its quenching efficiency also drops accordingly.
Thus, the role of the excitation wavelength in the quenching efficiencies was examined in more detail. Figure 6b shows the S–V plots of the fluorescence response of P26 to PA, which were obtained with four different excitation wavelengths, λexc, as shown in Figure 6a. Assuming that Kasha–Vavilov’s rule holds [34], the S–V plots should be somewhat similar in magnitude and shape if FRET is dominant since this phenomenon occurs from the lowest excited state whose quantum yield is independent of the excitation wavelength. Indeed, the S–V plots and magnitudes of Ksv values are entirely different, and they distinctly depend on the molar extinction coefficient ε of the quencher PA at each excitation wavelength (See Figure 6a). Thus, the smaller response is obtained at λexc = 285 nm and the larger at λexc = 371 nm, thus reflecting the growing contribution of primary IFE. The increase of the optical density of the quencher solution as the excitation wavelength approaches the maximum of the absorption spectra of PA (λmax,abs = 355 nm) results in increased absorption of the excitation beam. No second IFE contribution is expected in this case because we observe the decreasing fluorescence intensities at a wavelength (λobs = 500 nm) where PA absorbance is null. Moreover, S–V plots become increasingly non-linear as the optical density of the solution at the excitation wavelength increases. Likewise, we observed that changing the path-length of the absorption and emission beams inside the cuvette, by placing the film in different sensing geometries, also influenced the film response (Figure S3, Supplementary Materials). Therefore, while the shorter path-length (60°S) into the quencher solution yields a linear S–V plot, longer path-lengths (60°L and 30°) corresponded to higher quenching efficiencies and increasingly non-linear S–V plots, a typical behavior observed when inner filter effects are operative. Therefore, the increase of the optical density either by changing the excitation wavelength or the path-length of the excitation beam results in an upward curvature. In principle, amplified quenching observed in extended conjugated systems [9], or combined quenching that occurs in environments where the fluorophores are confined in a membrane [35], could lead to positive deviations from linearity. In our case, amplified quenching can be ruled out due to the segmented nature of the conjugated system of the polymer P26 that prevents exciton mobility along the polymer backbone. Although we cannot rigorously exclude that combined quenching occurs after the quencher diffuses into the film, the fact that the above observations and the quenching efficiency order of NACs are correlated with the optical density intensities suggests that IFE plays a dominant role in determining the quenching efficiency order of the polymers at the micromolar concentration range.
Next, in order to study the sub-and low micromolar region, thinner films of P26 (thickness = 35 ± 3 nm) were used to improve quenching efficiencies (Figure S4, Supplementary Materials). Although the effect of thickness of P26 films on efficiency was not systematically investigated in the present study, we observed the expected improvement in performance by decreasing film thickness, with both quenchers showing remarkable quenching efficiencies in the nanomolar region, as well as similarity in the response towards TNT and PA (Figure 7). Though the non-linear nature of the responses complicates the calculation of the limit of detection (LOD) by linear regression, we observe that 10% of the fluorescence was quenched by 50 nM concentrations of either PA or TNT, so the LOD should be below these concentration values (see insets in Figure 7). Thus, the sensitivities of P26 are among the best reported in the literature for polymeric solutions or films [25,36,37,38,39].
Besides, fluorescence intensities were measured at 1, 10, 20 and 30 min after the addition of the aliquot of the quencher solution to estimate both the true quenching (ET and/or FRET) and IFE contributions to the total response. Figure 7a shows that the response of the P26 film to TNT can be exclusively assigned to quenching since the last measurement of fluorescence intensity (after 30 min) at a given concentration and the first (after 1 min) at the next concentration have nearly the same value indicating that there is no sudden signal attenuation due to quencher absorption (i.e., no IFE) after the quencher addition. For each quencher concentration, the film response increases in time due to quenching by diffusion of the NAC into the film. On the other hand, steep growth in the film response occurs immediately after each increment of PA concentration (Figure 7b), which is then followed by slow growth of the response with time due to quenching following diffusion of the NAC into the film. These sudden increments of quenching began to be noticeable at concentrations of 0.3–0.8 µM and already become very important at the low end of the micromolar region. By adding up the quenching increments at each concentration, we estimated that quenching contributes to nearly 50% of the overall response needed to reach Q50% at [PA] = 10 µM while for TNT, which is devoid of IFE, Q50% is reached at [TNT] = 16 µM (Figure 7). The observed IFE contributions of PA are rooted in the high molar attenuation coefficient of PA in water at λexc = 371 nm, which is 13,680 M−1 cm−1 (Figure S5, Supplementary Materials). Therefore, a 5 µM solution would already have an optical density of 0.07, which is significant considering that for analytical studies it is recommended to correct IFE above optical densities of 0.02 [40]. As a result, the sensing response of P26 towards PA, a quencher that strongly absorbs at the excitation wavelength, has an IFE contribution even at the nanomolar range, while the response towards the non-absorbing TNT depends only on quenching.

4. Conclusions

Two new fluorescent segmented conjugated polymers with distyrylnaphthalene chromophores and their model compounds were synthesized. No marked differences in optical properties, morphology or quenching efficiencies were produced by changing the connectivity of naphthylene units. Supported films of both P14 and P26 were amorphous, strongly fluorescent with no aggregation of the chromophores in the solid state and highly sensitive towards NACs in water. In particular, PA and TNT showed remarkable quenching efficiencies at the nanomolar level. Quenching experiments using either different nitroaromatic quenchers, excitation wavelengths, excitation beam path-lengths, or time of exposure of the film to the quenching solution point to a dominant role of inner filter effects (IFE) in the quenching efficiency order of the polymer response to PA, TNT, and other NACs in the micromolar concentration range. It was also observed that the sensing response of P26 towards PA, a quencher that strongly absorbs at the excitation wavelength, has an IFE contribution in addition to quenching even at the nanomolar range, while the response towards the non-absorbing TNT depends only on the quenching occurring after diffusion of the analyte into the film. Finally, we point out here that the adjustment of the optical properties (λabs and λem) of the polymer by structural design and the judicious selection of experimental conditions (λex and λobs) could be used to maximize or minimize IFE as an additional criteria in order to enhance sensitivity or selectivity towards the NAC of interest.

Supplementary Materials

The following are available online at https://www.mdpi.com/2073-4360/10/12/1366/s1, Experimental 1. General methods and instrumentation, Experimental 2. Synthesis, Figure S1. Optical micrograph (cross polarizers) of P26 between glass substrates al 196 °C, Figure S2. Expansion of the scale close to the origin of Figure 4. Stern–Volmer plots for a PN26 film with nitrotoluenes, Figure S3. Stern–Volmer plots for a PN26 film with PA (λexc = 371 nm, λem = 500 nm). The path-lengths of the excitation (blue) and emission (red) beams inside of the cuvette were changed by placing the film in different sensing geometries: 60°L, 30° and 60°S, Figure S4. Fluorescence spectra change (λex = 371 nm) of P26 films as a function of (a) added TNT in water; [TNT] = 0.05–189 µM (top to bottom). (b) added PA in water; [PA] = 0.05 –194 µM (top to bottom), Figure S5. Calculation of the molar attenuation coefficient of PA at λ371, Table S1. Thermal and optical properties of model compounds and polymers, Table S2. Data analysis of Stern–Volmer plots and quenching efficiencies, Q50%, of the fluorescence responses of P14 and P26 to NACs in water.

Author Contributions

Experiments were performed by A.B.S. (film formation and quenching studies), M.F.A. (synthesis, fluorescence characterization), M.J.R. (quenching studies), P.G.D.R. (structural characterization), R.S.M. (DSC and optical characterization). All authors contributed to the data analysis. The paper was written and the project was conceived by R.O.G.

Funding

This research was funded by SGCYT-UNS grant number 24/Q055 and CIC-PBA grant numbers 1707/15 and MFA/16.

Acknowledgments

Financial support from SGCyT-UNS and CIC-PBA is acknowledged. A.B.S. and M.J.R. thank CONICET for a fellowship. M.F.A. is a member of the research staff of CIC-PBA. P.G.D.R. and R.O.G. are members of the research staff of CONICET.

Conflicts of Interest

The authors declare no conflict of interest.

References

  1. Islam, M.R.; Lu, Z.; Li, X.; Sarker, A.K.; Hu, L.; Choi, P.; Li, X.; Hakobyan, N.; Serpe, M.J. Responsive polymers for analytical applications: A review. Anal. Chim. Acta 2013, 789, 17–32. [Google Scholar] [CrossRef] [PubMed]
  2. Juang, R.-S.; Wen, H.-W.; Chen, M.-T.; Yang, P.-C. Enhanced sensing ability of fluorescent chemosensors with triphenylamine-functionalized conjugated polyfluorene. Sens. Actuators B 2016, 231, 399–411. [Google Scholar] [CrossRef]
  3. Sun, X.; Wang, Y.; Lei, Y. Fluorescence based explosive detection: From mechanisms to sensory materials. Chem. Soc. Rev. 2015, 44, 8019–8061. [Google Scholar] [CrossRef] [PubMed]
  4. Shanmugaraju, S.; Mukherjee, P.S. π-Electron rich small molecule sensors for the recognition of nitroaromatics. Chem. Commun. 2015, 51, 16014–16032. [Google Scholar] [CrossRef]
  5. Ding, L.; Fang, Y. Chemically assembled monolayers of fluorophores as chemical sensing materials. Chem. Soc. Rev. 2010, 39, 4258–4273. [Google Scholar] [CrossRef] [PubMed]
  6. Squeo, B.M.; Gregoriou, V.G.; Avgeropoulos, A.; Baysec, S.; Allard, S.; Scherf, U.; Chochos, C.L. BODIPY-based polymeric dyes as emerging horizon materials for biological sensing and organic electronic applications. Prog. Polym. Sci. 2017, 71, 26–52. [Google Scholar] [CrossRef]
  7. Ali, M.A.; Chen, S.S.Y.; Cavaye, H.; Smith, A.R.G.; Burn, P.L.; Gentle, I.R.; Meredith, P.; Shaw, E. Diffusion of nitroaromatic vapours into fluorescent dendrimer films for explosives detection. Sens. Actuators B 2015, 210, 550–557. [Google Scholar] [CrossRef] [Green Version]
  8. Guan, W.; Zhou, W.; Lu, J.; Lu, C. Luminescent films for chemo-and biosensing. Chem. Soc. Rev. 2015, 44, 6981–7009. [Google Scholar] [CrossRef] [PubMed]
  9. Rochat, S.; Swager, T.M. Conjugated amplifying polymers for optical sensing applications. ACS Appl. Mater. Interfaces 2013, 5, 4488–4502. [Google Scholar] [CrossRef] [PubMed]
  10. Schwarzenbach, R.P.; Egli, T.; Hofstetter, T.B.; Von Gunten, U.; Wehrli, B. Global water pollution and human health. Annu. Rev. Environ. Resour. 2010, 35, 109–136. [Google Scholar] [CrossRef]
  11. Rodgers, J.D.; Bunce, N.J. Treatment methods for the remediation of nitroaromatic explosives. Water Res. 2001, 35, 2101–2111. [Google Scholar] [CrossRef]
  12. Del Rosso, P.G.; Romagnolli, M.J.; Almassio, M.F.; Barbero, C.A.; Garay, R.O. Diphenylanthrylene and diphenylfluorene-based segmented conjugated polymer films as fluorescent chemosensors for nitroaromatics in aqueous solution. Sens. Actuators B 2014, 203, 612–620. [Google Scholar] [CrossRef]
  13. Almassio, M.F.; Romagnoli, M.J.; Schvval, A.B.; Del Rosso, P.G.; Garay, R.O. Distyrylbenzene-based segmented conjugated polymers: Synthesis, thin film morphology and chemosensing of hydrophobic and hydrophilic nitroaromatics in aqueous media. Polymer 2017, 113, 167–179. [Google Scholar] [CrossRef] [Green Version]
  14. Mazumdar, P.; Maity, S.; Shyamal, M.; Das, D.; Sahoo, G.P.; Misra, A. Proton triggered emission and selective sensing of picric acid by the fluorescent aggregates of 6, 7-dimethyl-2, 3-bis-(2-pyridyl)-quinoxaline. Phys. Chem. Chem. Phys. 2016, 18, 7055–7067. [Google Scholar] [CrossRef] [PubMed]
  15. Geng, T.; Zhu, Z.; Wang, X.; Xia, H.; Wang, Y.; Li, D. Poly{tris[4-(2-Thienyl)phenyl] amine} fluorescent conjugated microporous polymer for selectively sensing picric acid. Sens. Actuators B 2017, 244, 334–343. [Google Scholar] [CrossRef]
  16. Chowdhury, A.; Mukherjee, P.S. Electron-rich triphenylamine-based sensors for picric acid detection. J. Org. Chem. 2015, 80, 4064–4075. [Google Scholar] [CrossRef] [PubMed]
  17. Guo, L.; Cao, D.; Yun, J.; Zeng, X. Highly selective detection of picric acid from multicomponent mixtures of nitro explosives by using COP luminescent probe. Sens. Actuators B 2017, 243, 753–760. [Google Scholar] [CrossRef]
  18. Tian, X.; Qi, X.; Liu, X.; Zhang, Q. Selective detection of picric acid by a fluorescent ionic liquid chemosensor. Sens. Actuators B 2016, 229, 520–527. [Google Scholar] [CrossRef]
  19. Duraimurugan, K.; Balasaravanan, R.; Siva, A. Electron rich triphenylamine derivatives (D-π-D) for selective sensing of picric acid in aqueous media. Sens. Actuators B 2016, 231, 302–312. [Google Scholar] [CrossRef]
  20. Wang, B.; Mu, Y.; Zhang, C.; Li, J. Blue photoluminescent carbon nanodots prepared from zeolite as efficient sensors for picric acid detection. Sens. Actuators B 2017, 253, 911–917. [Google Scholar] [CrossRef]
  21. Sun, X.; He, J.; Meng, Y.; Zhang, L.; Zhang, S.; Ma, X.; Lei, Y. Microwave-assisted ultrafast and facile synthesis of fluorescent carbon nanoparticles from a single precursor: Preparation, characterization and their application for the highly selective detection of explosive picric acid. J. Mater. Chem. A 2016, 4, 4161–4171. [Google Scholar] [CrossRef]
  22. Liang, H.; Yao, Z.; Ge, W.; Qiao, Y.; Zhang, L.; Cao, Z.; Wu, H.C. Selective and sensitive detection of picric acid based on a water-soluble fluorescent probe. RSC Adv. 2016, 6, 38328–38331. [Google Scholar] [CrossRef]
  23. Sahoo, J.; Waghmode, S.B.; Subramanian, P.S.; Albrecht, M. Specific Detection of Picric Acid and Nitrite in Aqueous Medium Using Flexible Eu (III)-Based Luminescent Probe. ChemistrySelect 2016, 1, 1943–1948. [Google Scholar] [CrossRef]
  24. Bagheri, M.; Masoomi, M.Y.; Morsali, A.; Schoedel, A. Two Dimensional Host–Guest Metal–Organic Framework Sensor with High Selectivity and Sensitivity to Picric Acid. ACS Appl. Mater. Interfaces 2016, 8, 21472–21479. [Google Scholar] [CrossRef] [PubMed]
  25. Tanwar, A.S.; Hussain, S.; Malik, A.H.; Afroz, M.A.; Iyer, P.K. Inner filter effect based selective detection of nitroexplosive-picric acid in aqueous solution and solid support using conjugated polymer. ACS Sens. 2016, 1, 1070–1077. [Google Scholar] [CrossRef]
  26. Li, W.; Wang, D.; Han, D.; Sun, R.; Zhang, J.; Feng, S. New Polyhedral Oligomeric Silsesquioxanes-Based Fluorescent Ionic Liquids: Synthesis, Self-Assembly and Application in Sensors for Detecting Nitroaromatic Explosives. Polymers 2018, 10, 917. [Google Scholar] [CrossRef]
  27. Ganiga, M.; Mani, N.P.; Cyriac, J. Synthesis of Organophilic Carbon Dots, Selective Screening of Trinitrophenol and a Comprehensive Understanding of Luminescence Quenching Mechanism. ChemistrySelect 2018, 3, 4663–4668. [Google Scholar] [CrossRef]
  28. Benfaremo, N.; Sandman, D.J.; Tripathy, S.; Kumar, J.; Yang, K.; Rubner, M.F.; Lyons, C. Synthesis and characterization of luminescent polymers of distyrylbenzenes with oligo (ethylene glycol) spacers. Macromolecules 1998, 31, 3595–3599. [Google Scholar] [CrossRef]
  29. Neese, F.; The ORCA program system. Wiley Interdiscip. Rev. Comput. Mol. Sci. 2012, 2, 73–78. [Google Scholar] [CrossRef]
  30. Allouche, A.R. Gabedit—A graphical user interface for computational chemistry softwares. J. Comput. Chem. 2011, 32, 174–182. [Google Scholar] [CrossRef]
  31. Grimme, S.; Brandenburg, J.G.; Bannwarth, C.; Hansen, A. Consistent structures and interactions by density functional theory with small atomic orbital basis sets. J. Chem. Phys. 2015, 143, 054107. [Google Scholar] [CrossRef] [PubMed]
  32. Bencheikh, F.; Duché, D.; Ruiz, C.M.; Simon, J.J.; Escoubas, L. Study of Optical Properties and Molecular Aggregation of Conjugated Low Band Gap Copolymers: PTB7 and PTB7-Th. J. Phys. Chem. C 2015, 119, 24643–24648. [Google Scholar] [CrossRef]
  33. Lampert, Z.E.; Reynolds, C.L., Jr.; Papanikolas, J.M.; Aboelfotoh, M.O. Controlling morphology and chain aggregation in semiconducting conjugated polymers: The role of solvent on optical gain in MEH-PPV. J. Phys. Chem. B 2012, 116, 12835–12841. [Google Scholar] [CrossRef] [PubMed]
  34. Lakowicz, J.R. Principles of Fluorescence Spectroscopy, 3rd ed.; Springer: New York, NY, USA, 2006. [Google Scholar] [CrossRef]
  35. Schibilla, F.; Stegemann, L.; Strassert, C.A.; Rizzo, F.; Ravoo, B.J. Fluorescence quenching in β-cyclodextrin vesicles: Membrane confinement and host–guest interactions. Photochem. Photobiol. Sci. 2016, 15, 235–243. [Google Scholar] [CrossRef] [PubMed]
  36. Ghorpade, T.K.; Palai, A.K.; Rath, S.K.; Sharma, S.K.; Sudarshan, K.; Pujari, P.K.; Patri, M.; Mishra, S.P. Pentiptycene-tbutylpyrene based poly (arylene-ethynylene) s: Highly sensitive and selective TNT sensor in aqueous as well as vapor phase. Sens. Actuators B 2017, 252, 901–911. [Google Scholar] [CrossRef]
  37. Dong, W.; Fei, T.; Scherf, U. Conjugated polymers containing tetraphenylethylene in the backbones and side-chains for highly sensitive TNT detection. RSC Adv. 2018, 8, 5760–5767. [Google Scholar] [CrossRef] [Green Version]
  38. Han, T.; Zhang, Y.; He, B.; Lam, J.; Tang, B. Functional Poly (dihalopentadiene) s: Stereoselective Synthesis, Aggregation-Enhanced Emission and Sensitive Detection of Explosives. Polymers 2018, 10, 821. [Google Scholar] [CrossRef]
  39. Mondal, S.; Jana, A.; Bera, R.; Das, N. Design and synthesis of triptycene based fluorescent polymer with pendent triazole: Effect of functionality on host–guest interaction. J. Polym. Sci. Part A Polym. Chem. 2017, 55, 3725–3735. [Google Scholar] [CrossRef]
  40. Borissevitch, I.E. More about the inner filter effect: Corrections of Stern–Volmer fluorescence quenching constants are necessary at very low optical absorption of the quencher. J. Lumin. 1999, 81, 219–224. [Google Scholar] [CrossRef]
Scheme 1. Synthetic routes to polymers and their model compounds.
Polymers 10 01366 sch001
Figure 1. 1H NMR (CDCl3) (top) and 13C NMR (CDCl3 with 5% DMF) (bottom) spectra of polymers (a) P14 and (b) P26. The 1H NMR spectra of the expanded aromatic region of both model compounds and polymers are also shown. * 13C signal from DMF-d7.
Polymers 10 01366 g001
Figure 2. (a) Differential scanning calorimetry (DSC) traces of model compounds and polymers. (b) DFT/PBEh-3c relaxed geometry of M14, (c) M26 and (d) a tetramer of P26.
Polymers 10 01366 g002
Figure 3. Absorption (left) and emission (right) spectra. (a,c) CHCl3 solutions, (b,d) Thin films.
Polymers 10 01366 g003
Figure 4. The Stern–Volmer plots with nitrophenols and nitrotoluenes (a) for P14 films (λexc = 384 nm, λobs = 470 nm) and (b) for P26 films (λexc = 371 nm, λobs = 461 nm). The graphs include a visual aid to indicate the half of the maximum quench, Q50%.
Polymers 10 01366 g004
Figure 5. (a) Frontier molecular orbitals energies (DFT/PBEh-3c) of M14, M26 and tetramers (P14T and P26T) of P14 and P26. Values for the frontier molecular orbitals (FMOs) of the quenchers are also included. (b) UV-Vis absorption spectra, [NAC] = 56 mM. Fluorescence spectra of P14 and P26 are also included. Vertical dashed lines indicate the excitation wavelengths used to record fluorescence spectra.
Polymers 10 01366 g005
Figure 6. (a) Absorption spectrum of the picric acid in water (red dashed line). Absorption spectrum of a P26 film (solid line) and fluorescence spectra change (λexc = 371 nm) as a function of increasing concentrations of picric acid (PA) in water, fluorescence spectra were recorded 1 min after the quencher addition. Down arrows indicate the λexc used to gather data presented in (b) while the up arrow indicates the λem used to observe the fluorescence decrease. (b) The Stern–Volmer plots for a P26 film (λem = 500 nm) and PA obtained with λexc = 285, 310, 335, and 371 nm.
Polymers 10 01366 g006
Figure 7. The Stern–Volmer plots for PN26 films (λexc = 361 nm, λobs = 500 nm) with (a) picric acid (PA) and (b) trinitrotoluene (TNT). Dotted lines are guides to the eye. Dotted lines join the last measurement (after 30 min) at a given concentration and the first (after 1 min) at the next concentration. Insets in the graphs show an expansion of the scale close to the origin.
Polymers 10 01366 g007

