Cargo Release from Polymeric Vesicles under Shear


Abstract
:
1. Introduction
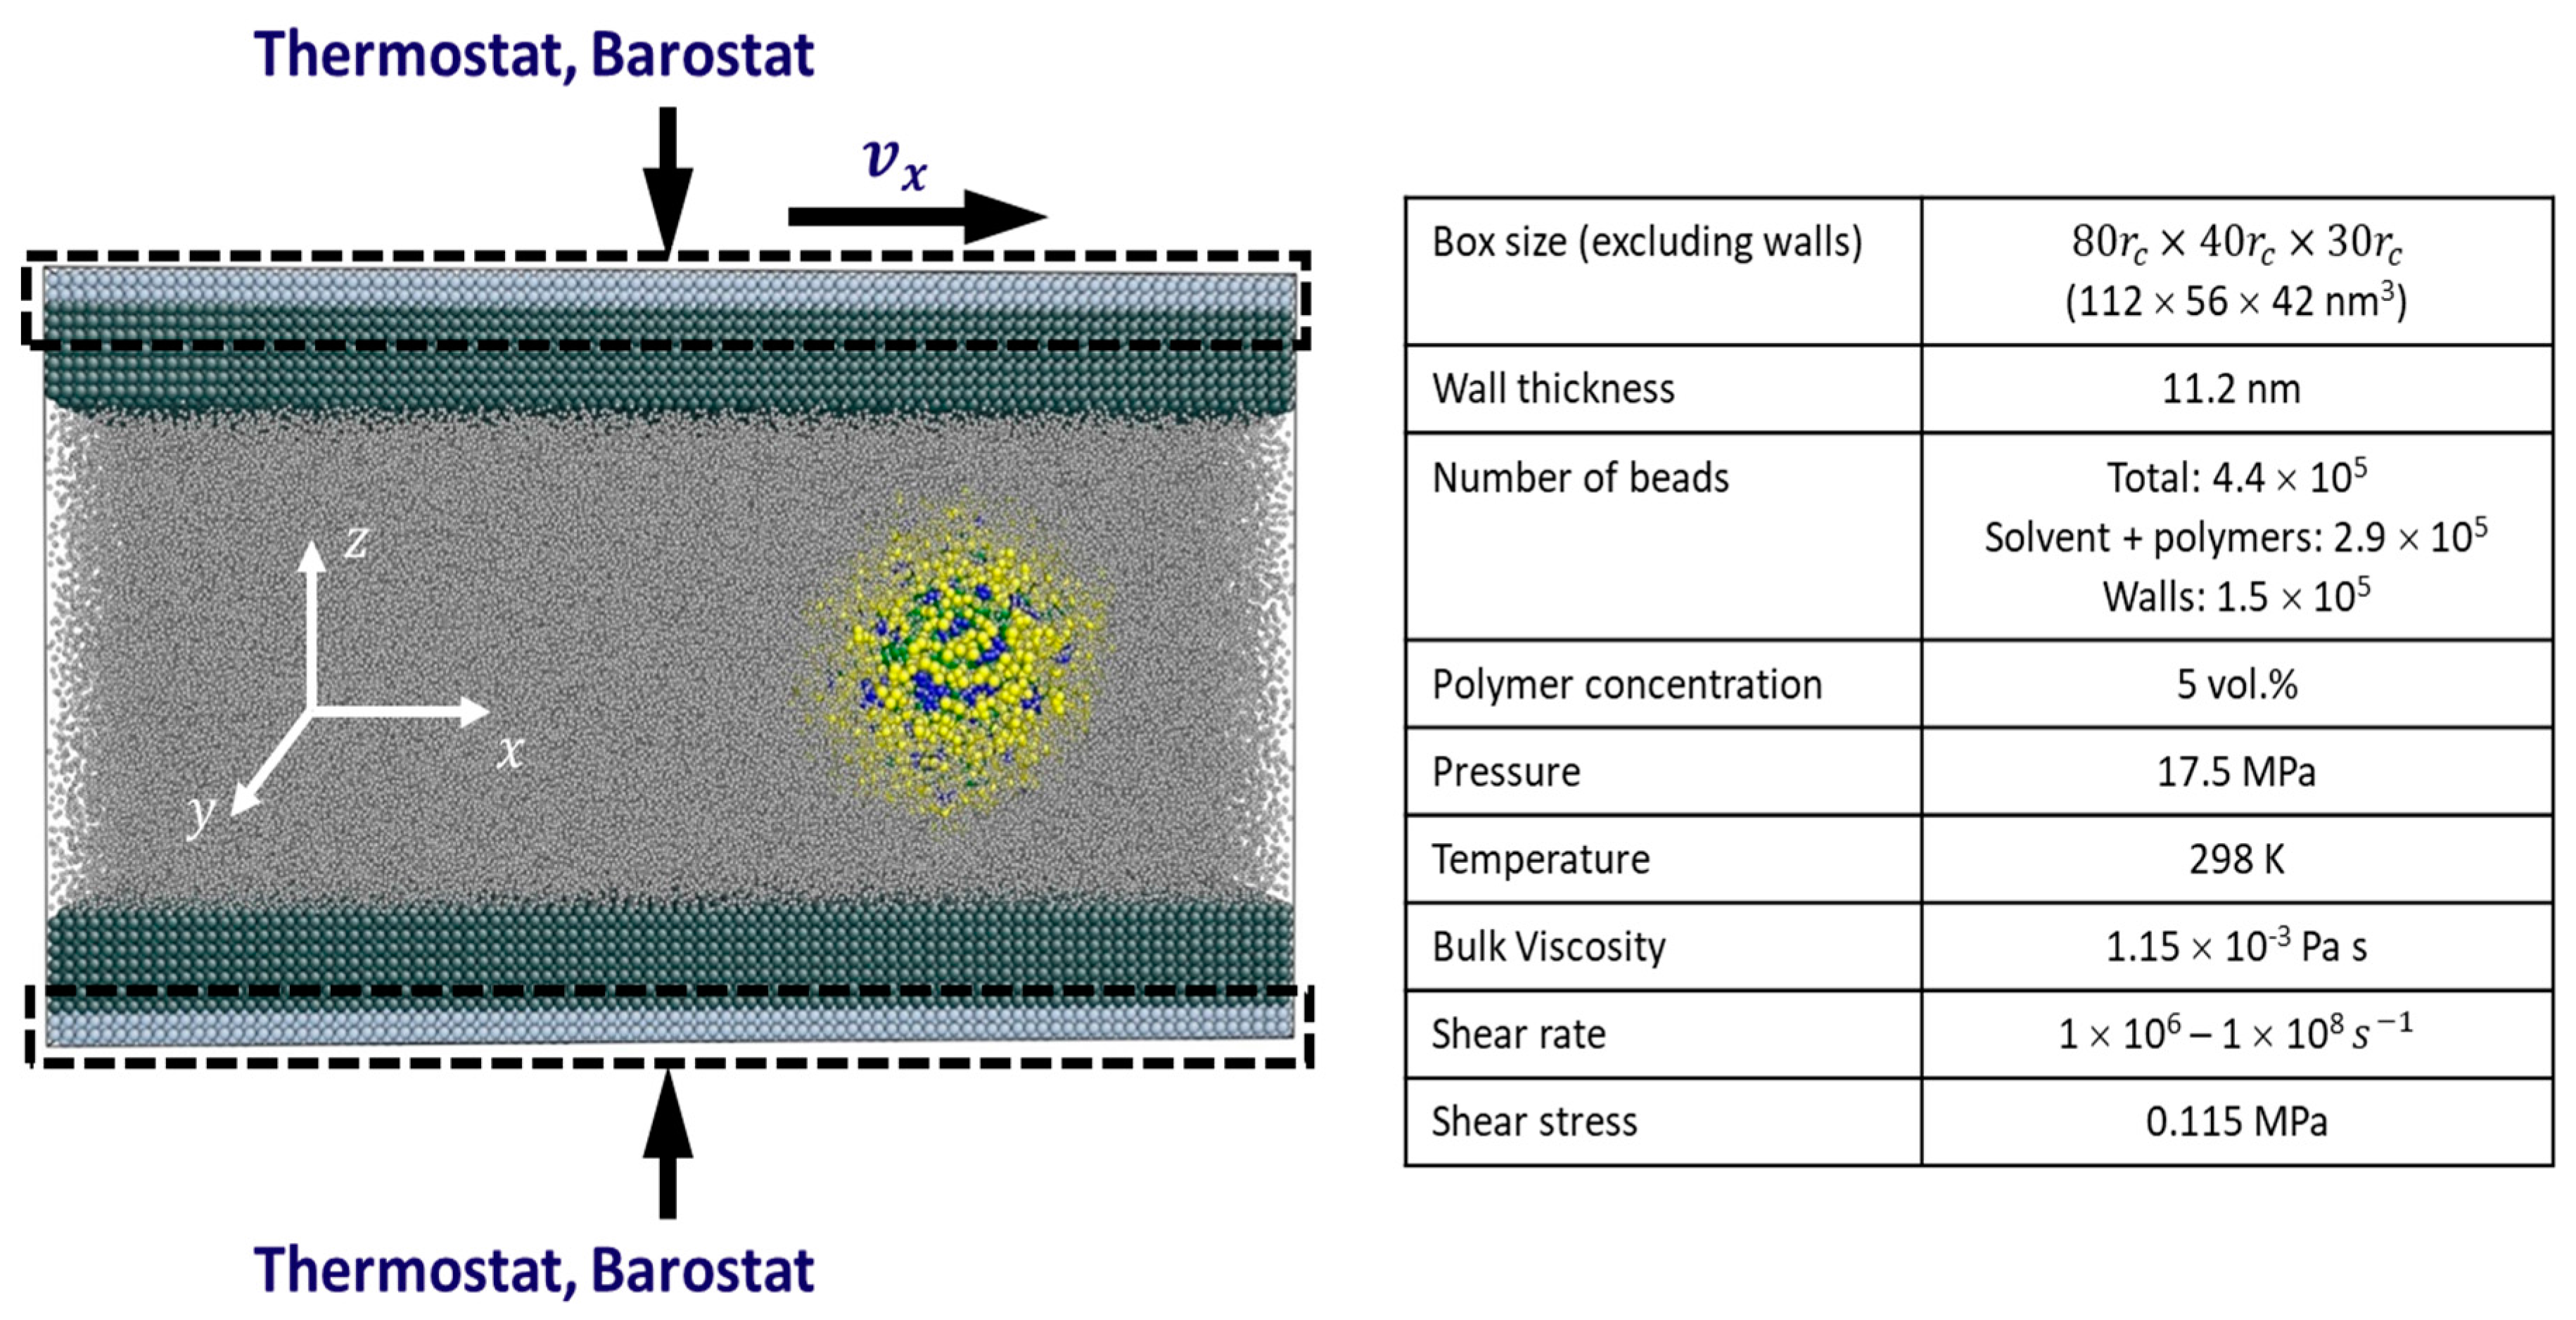
2. Methodology
3. Results and Discussions
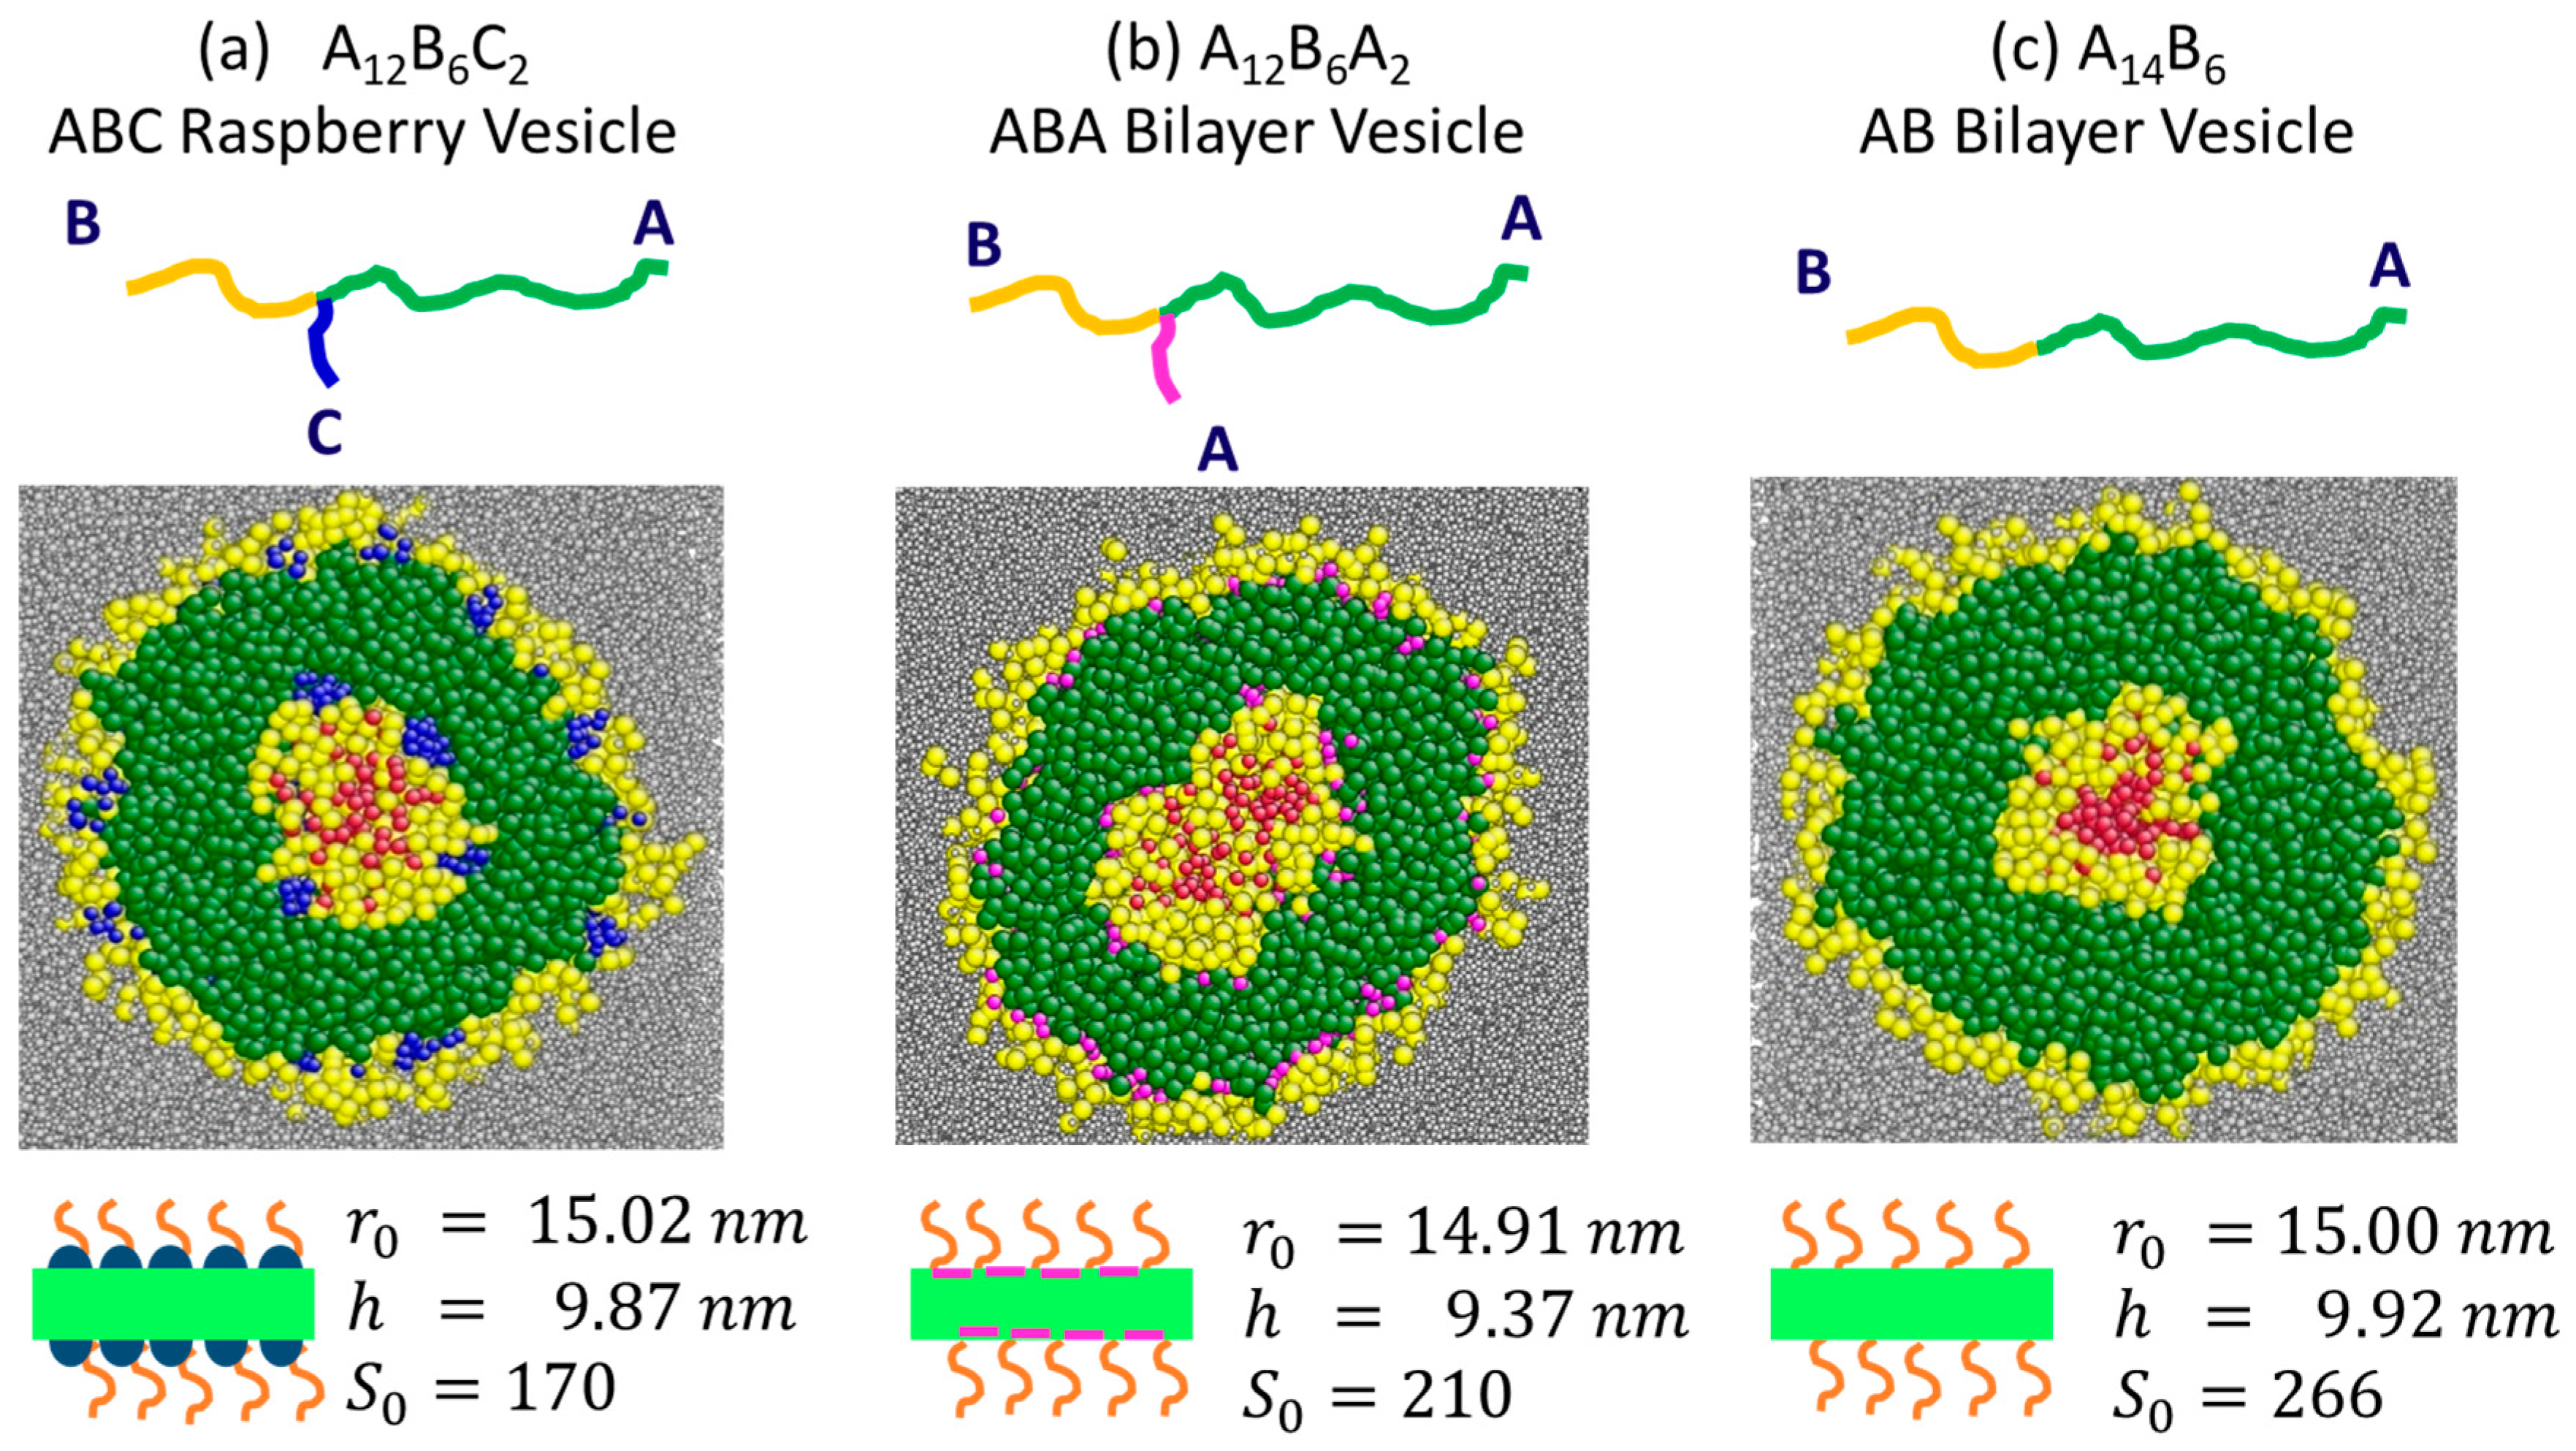
3.1. Characterisation of Vesicle Structure at Equilibrium
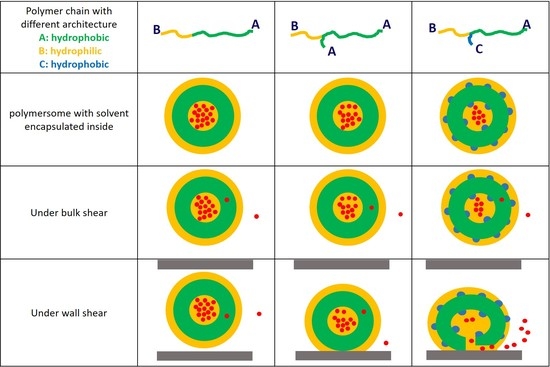
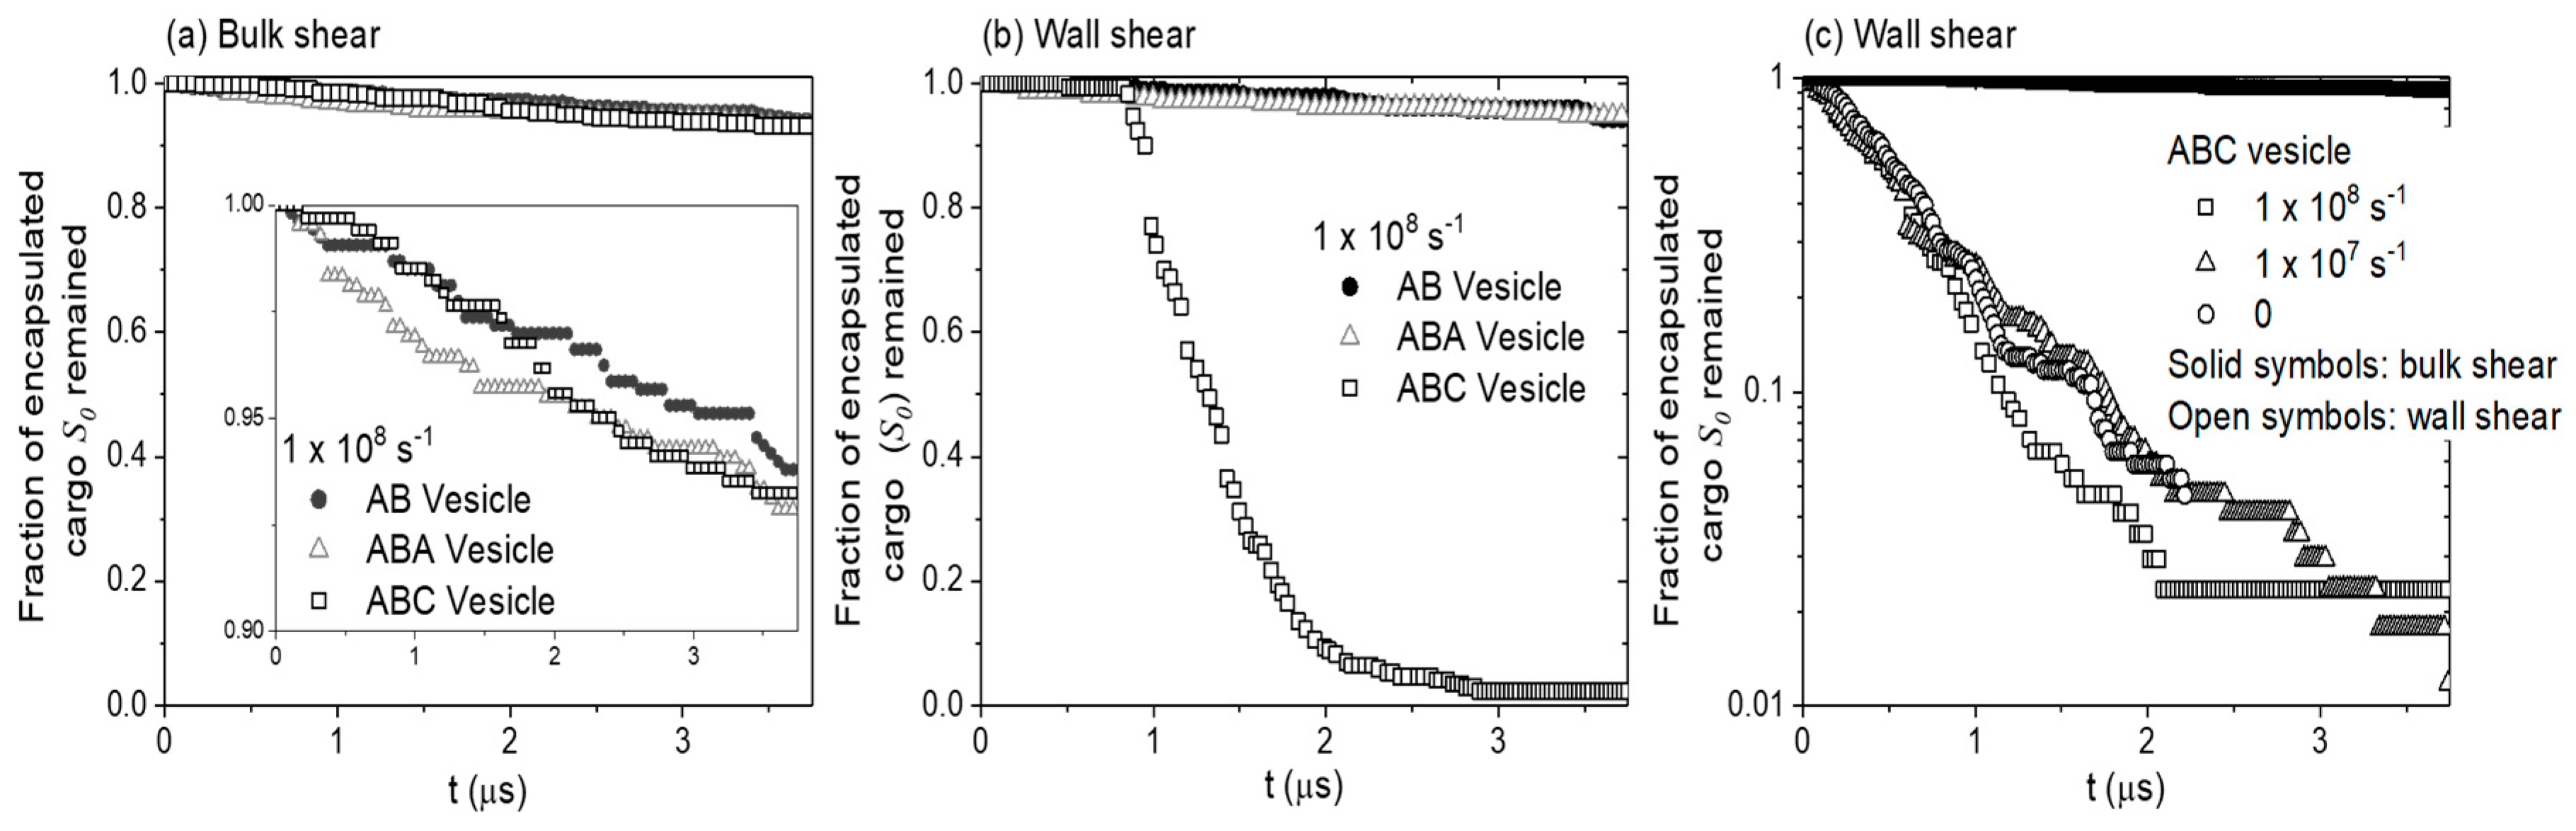
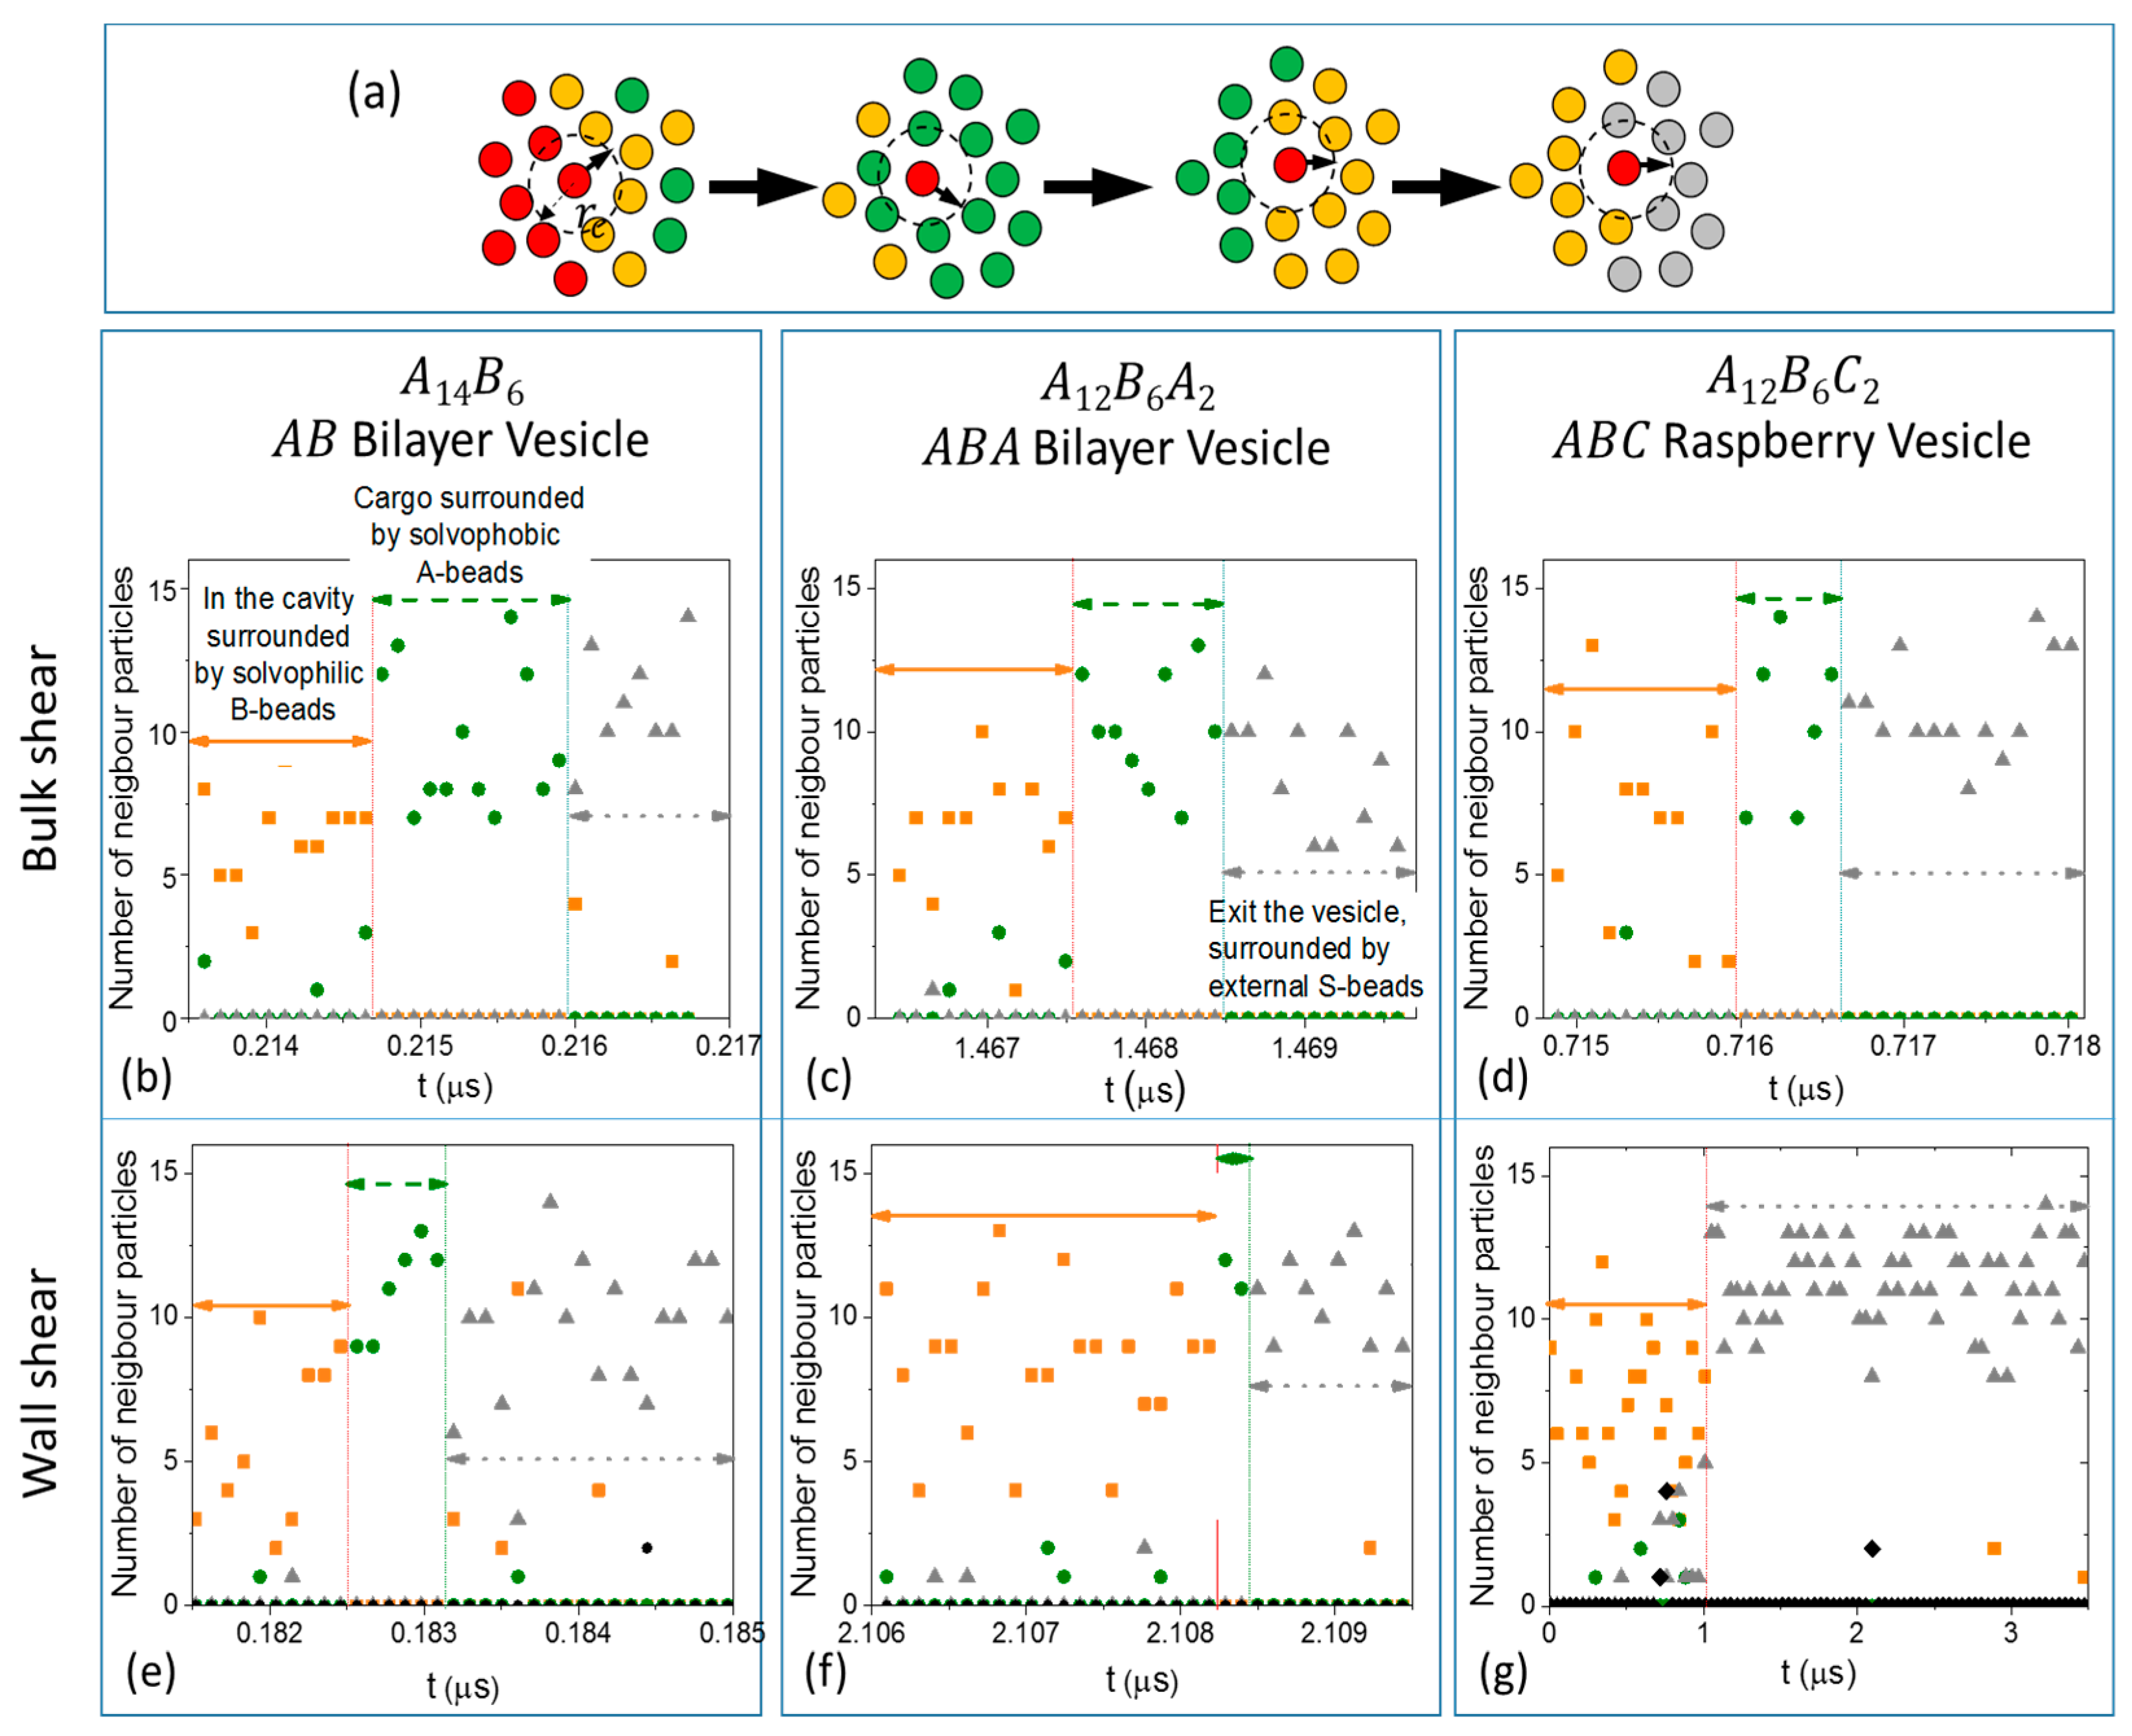
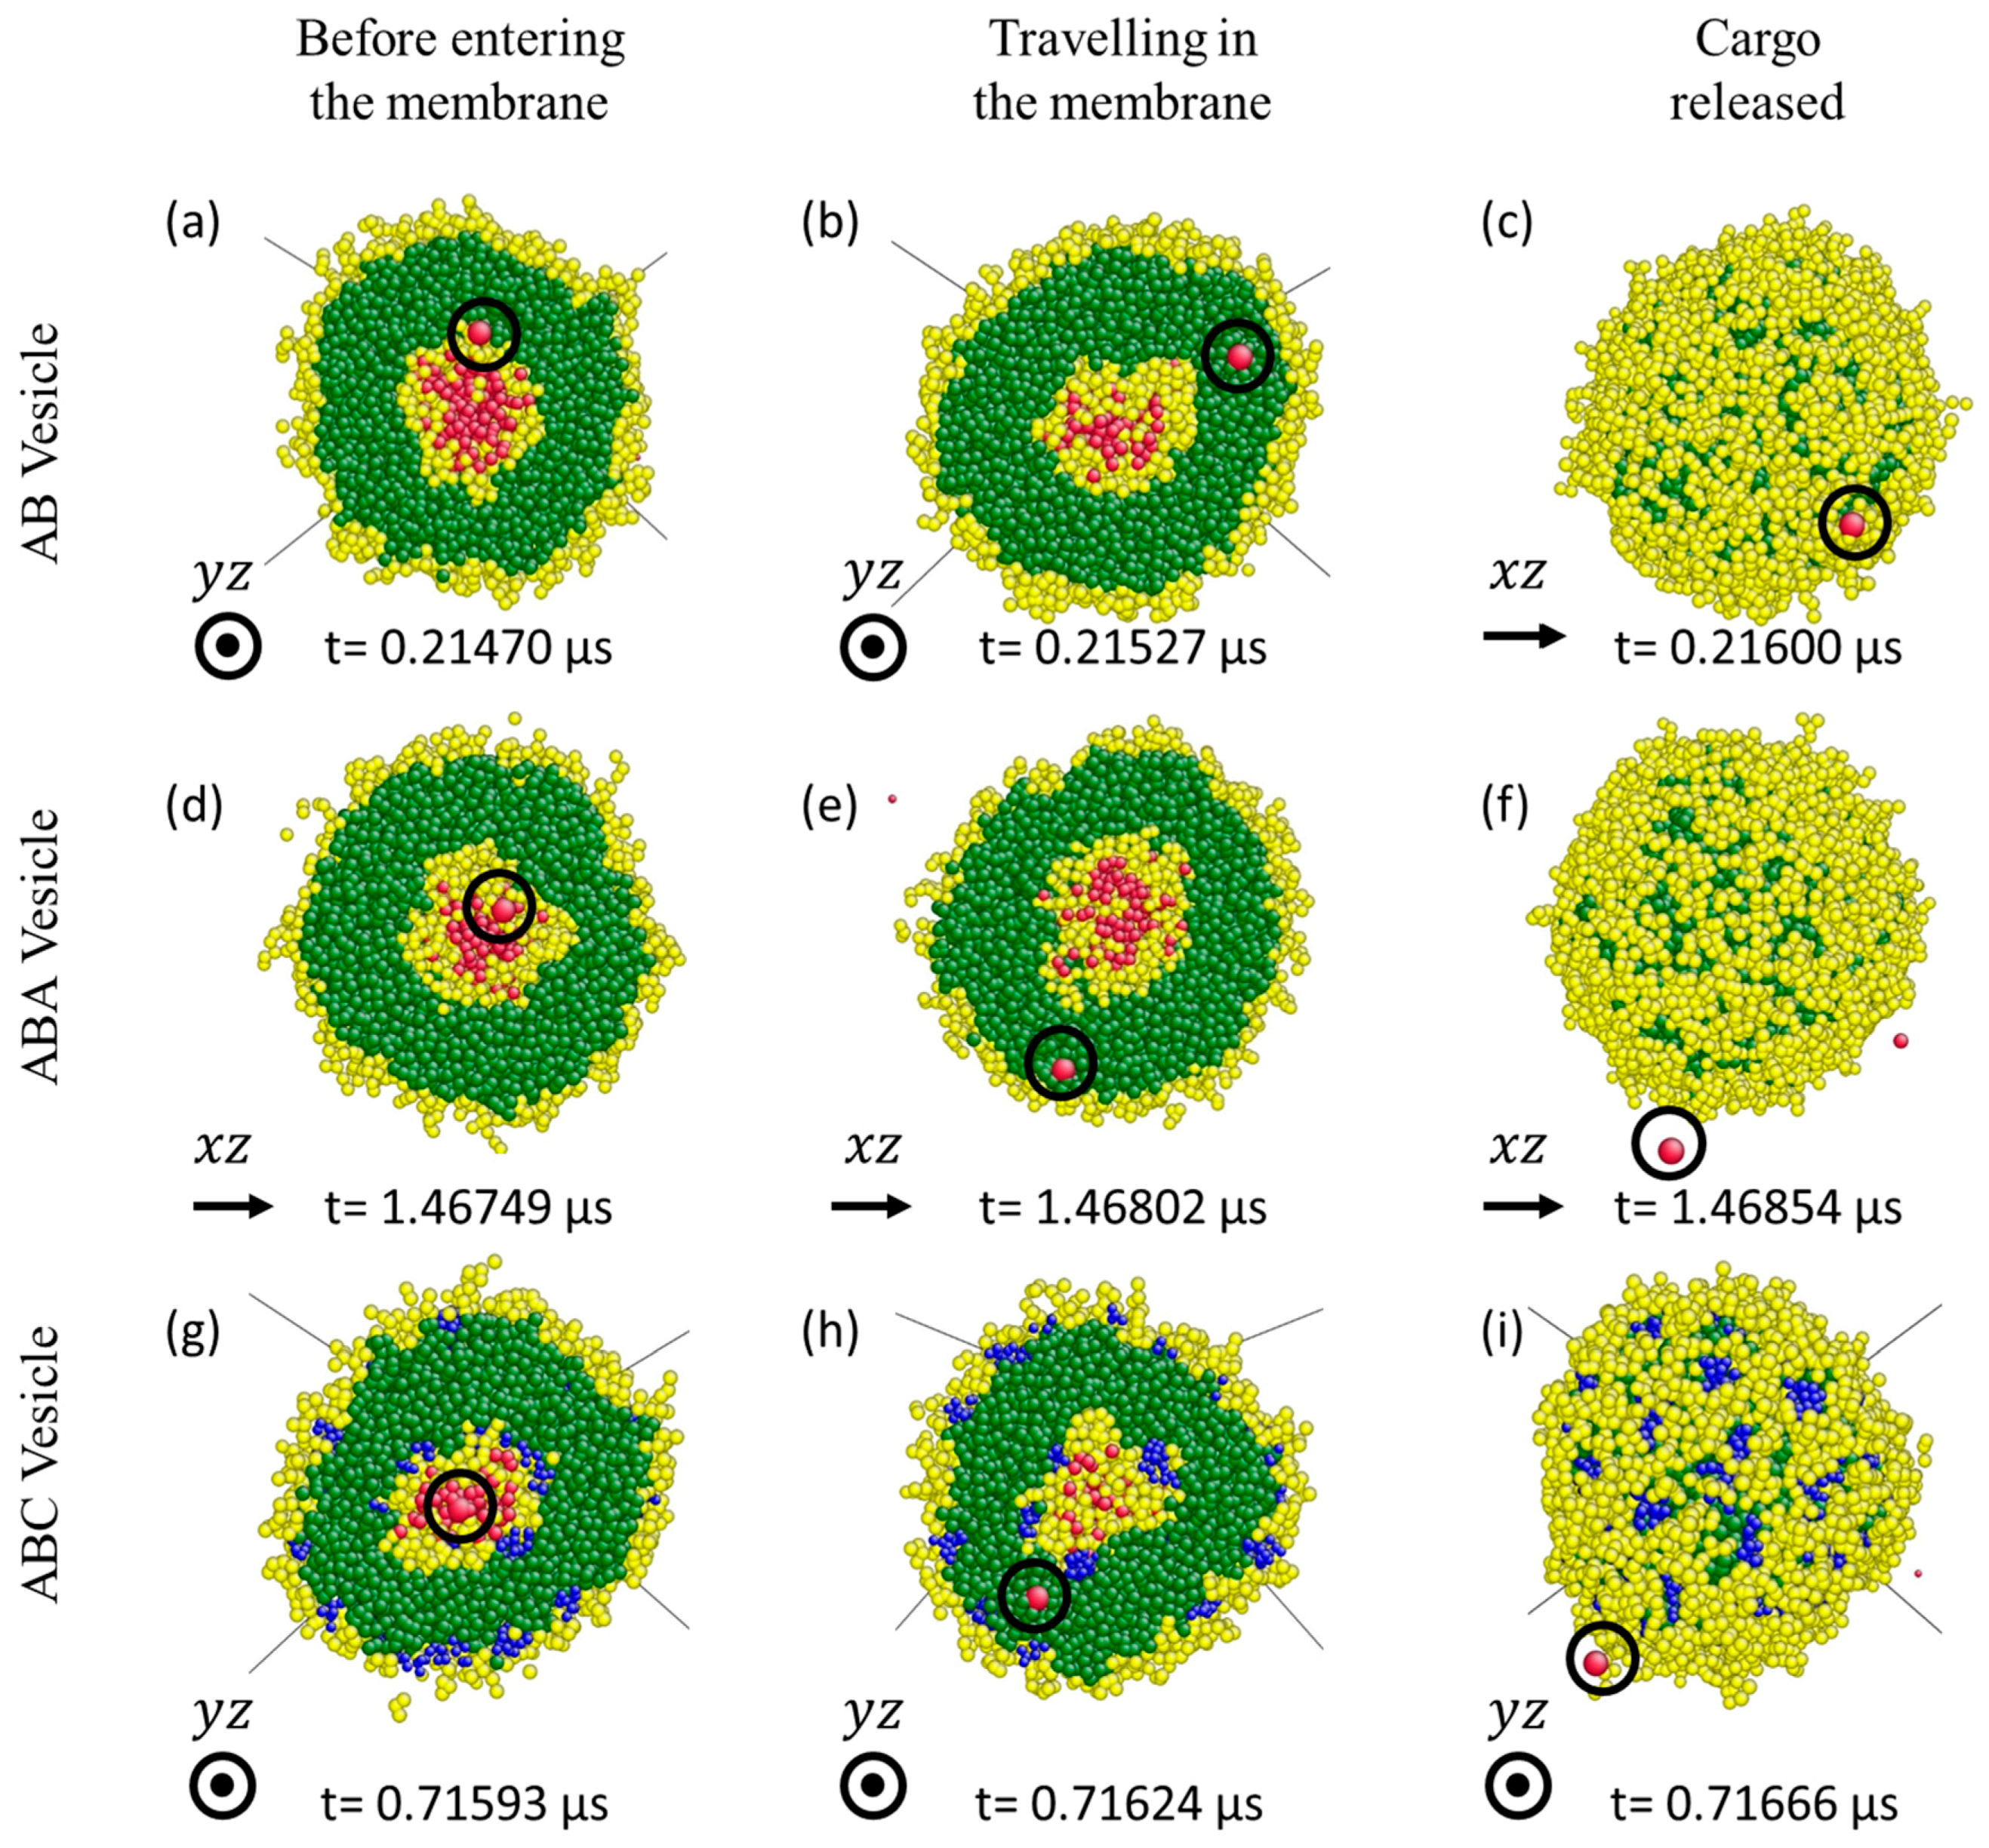
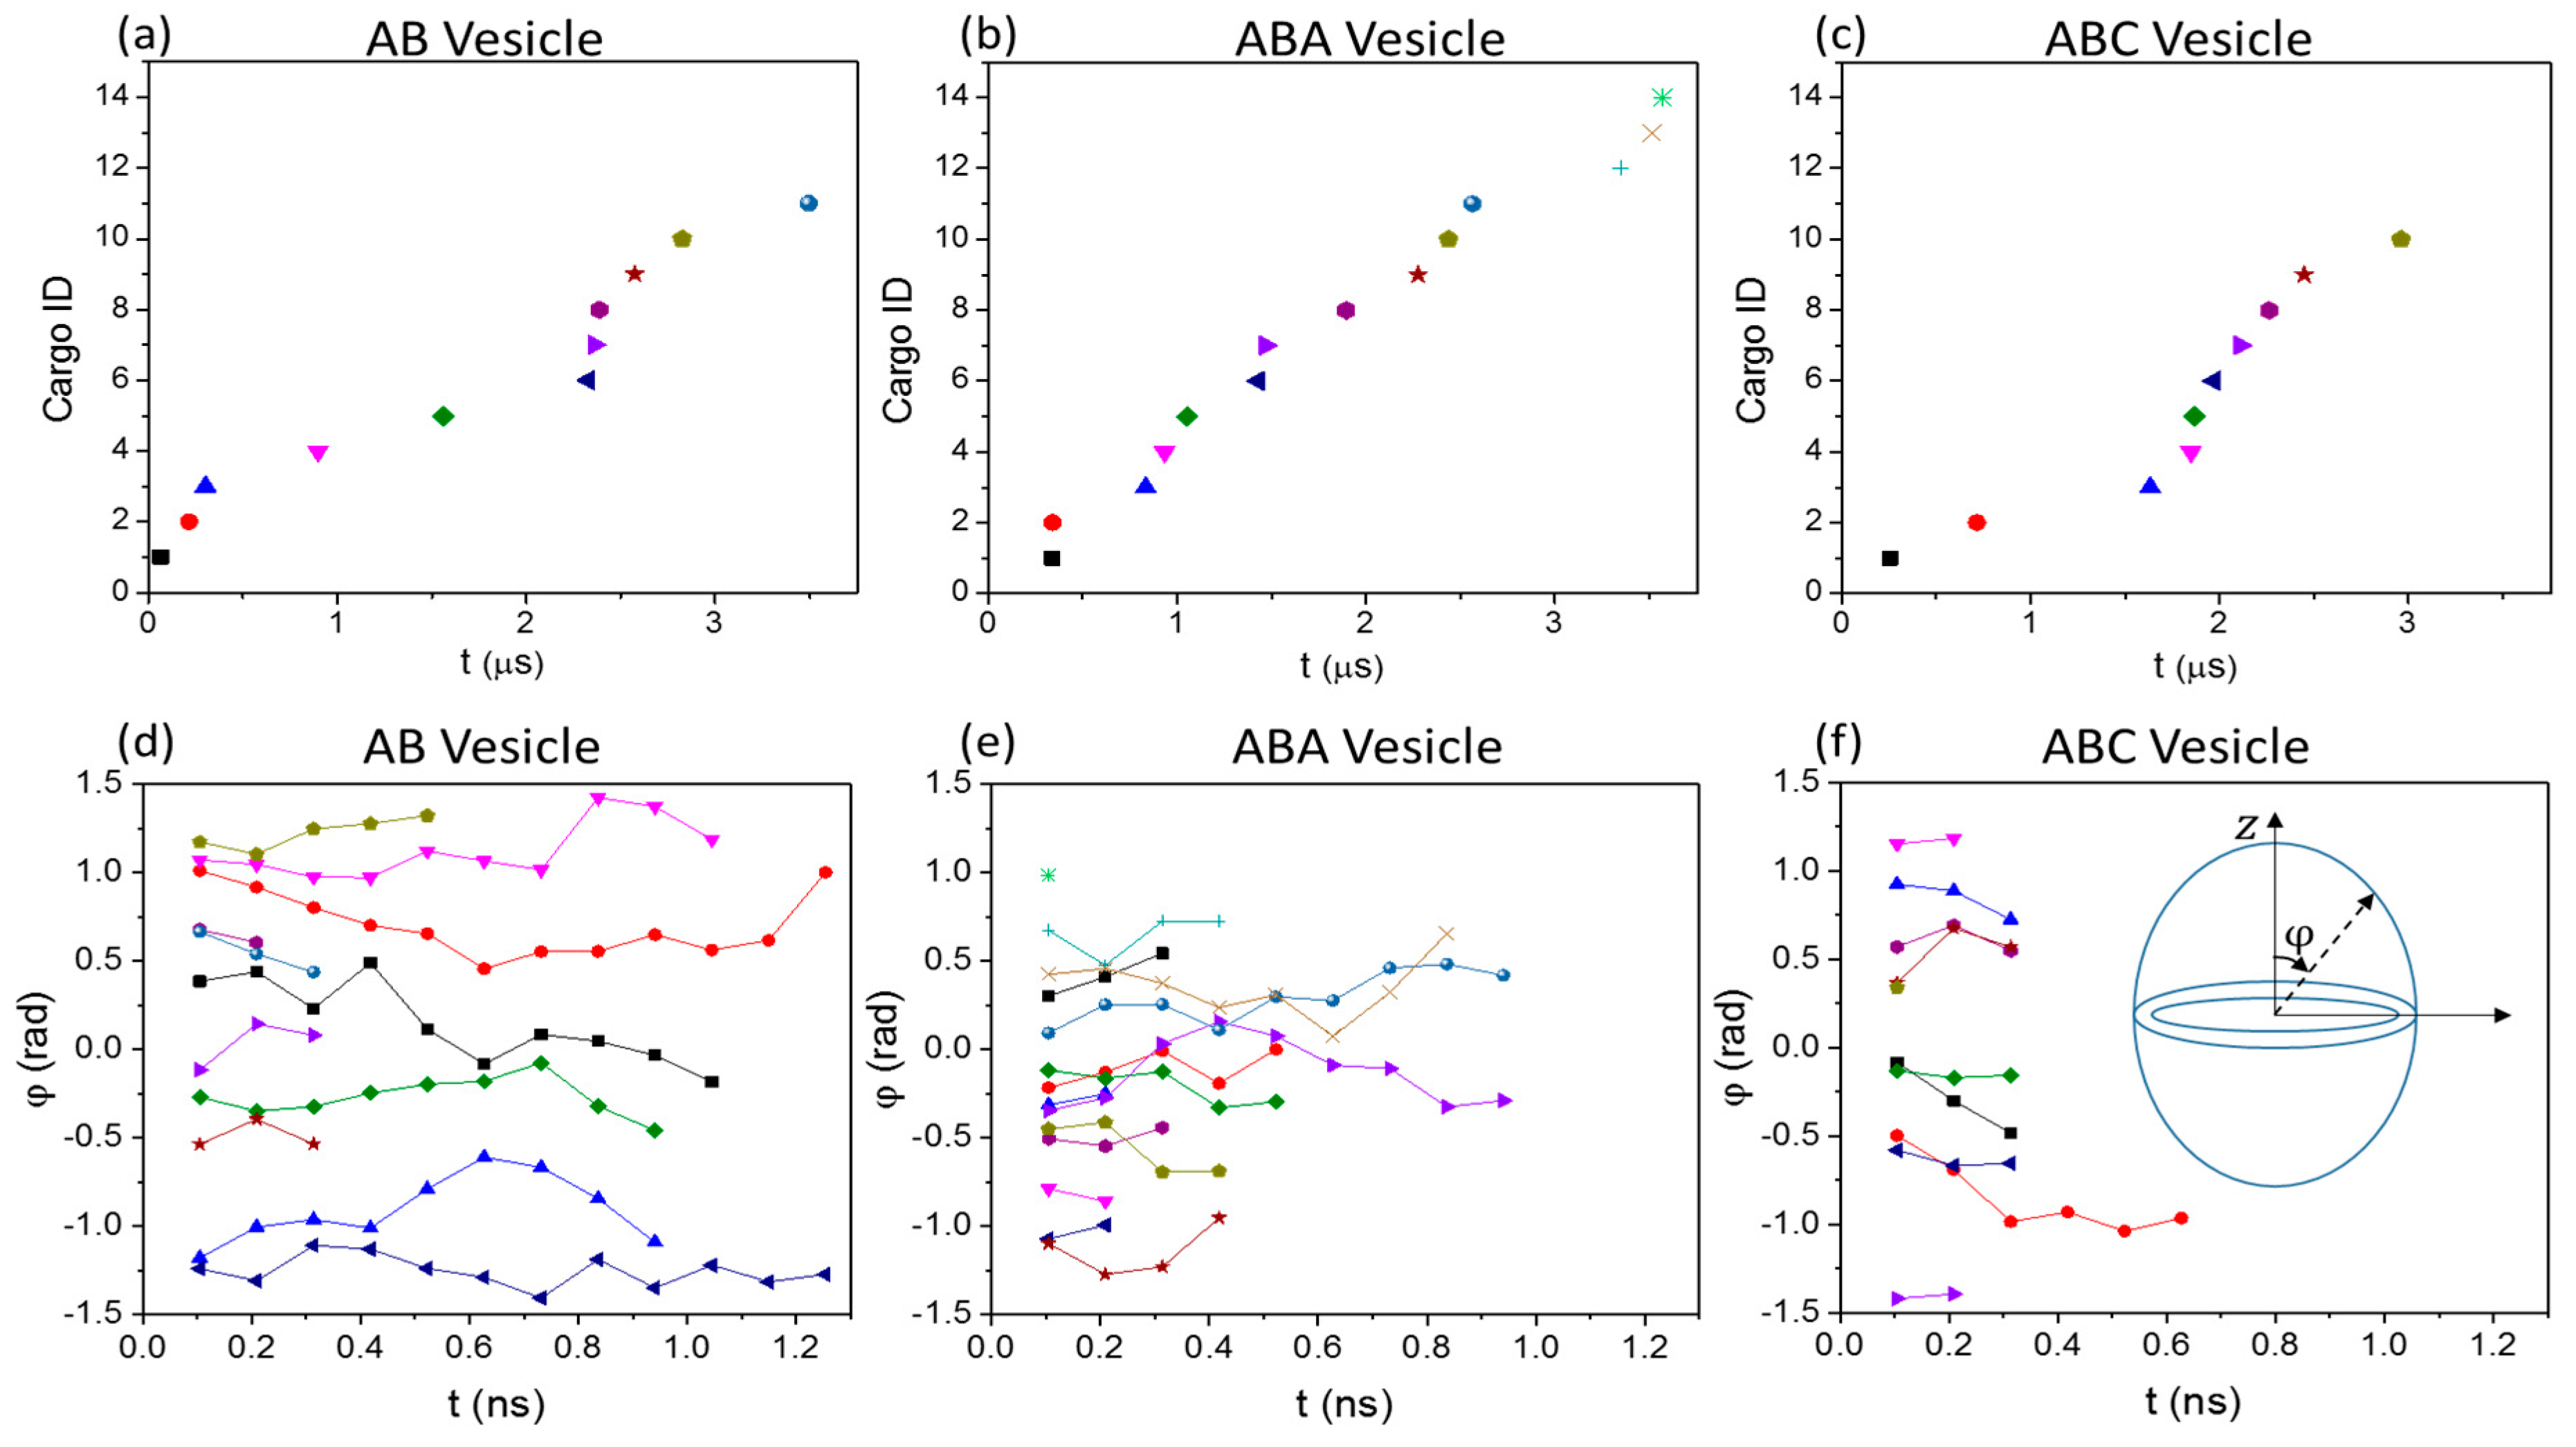
3.2. Cargo Release in Bulk Shear Condition
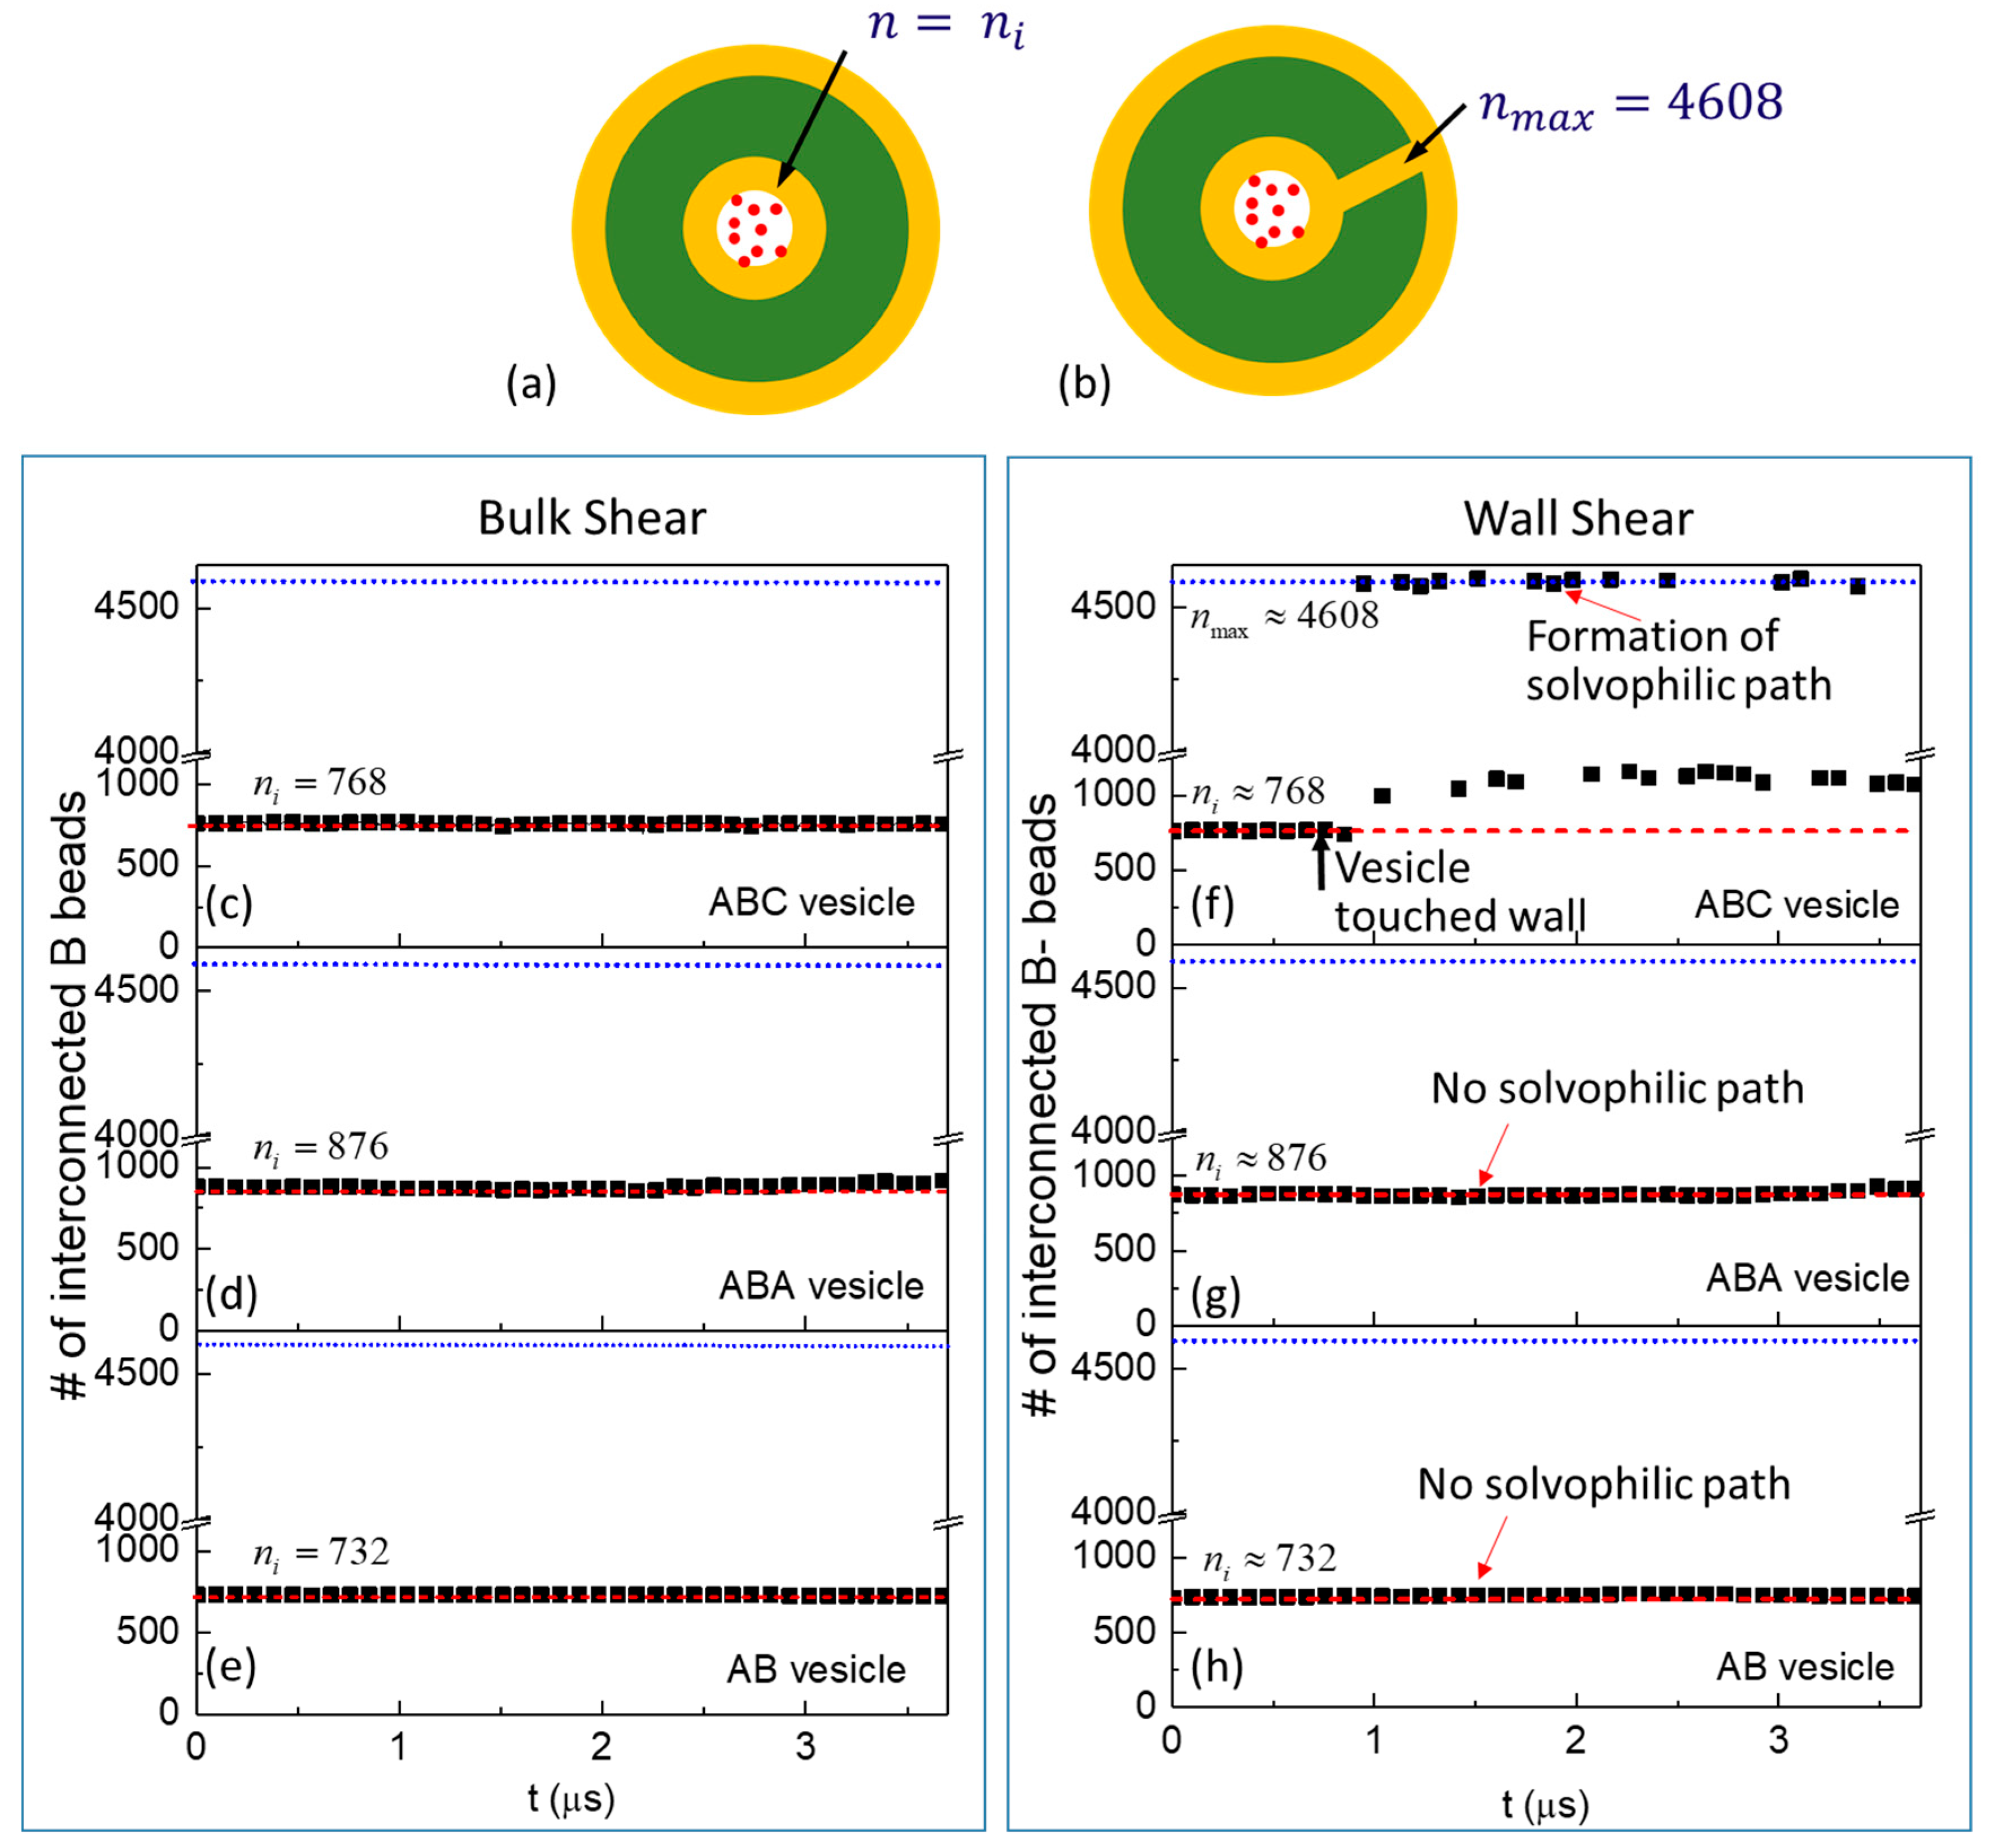
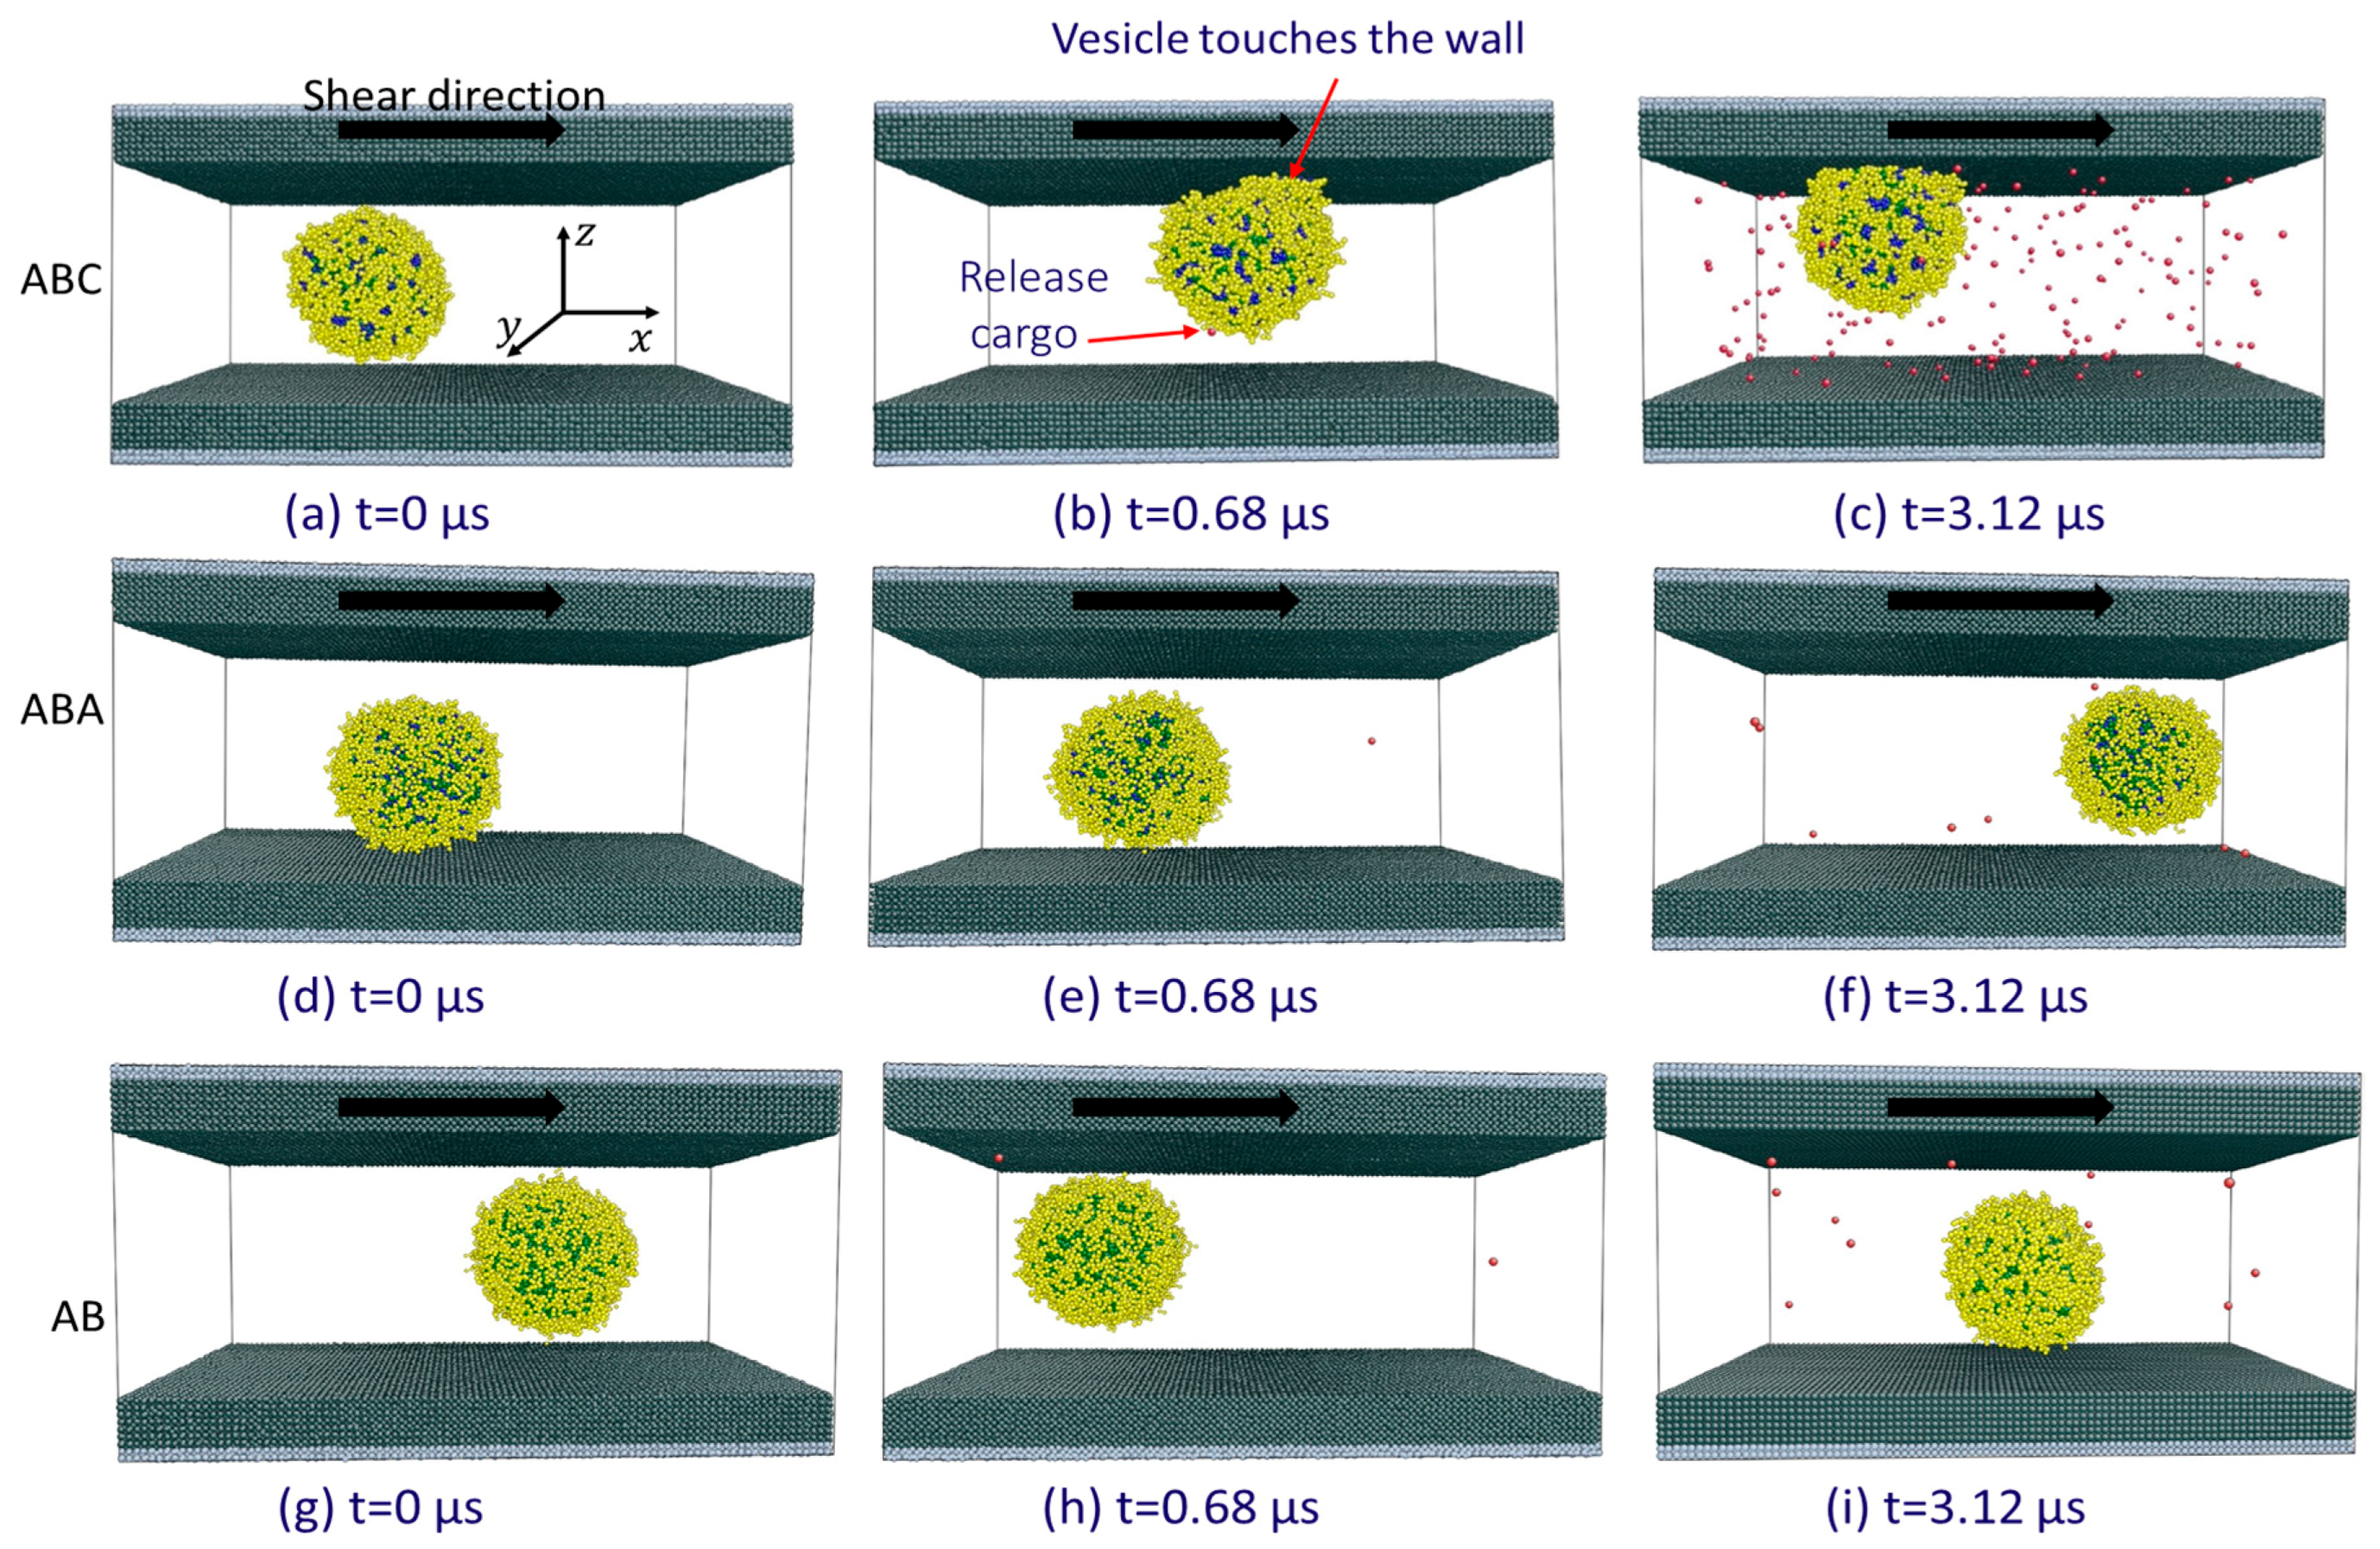
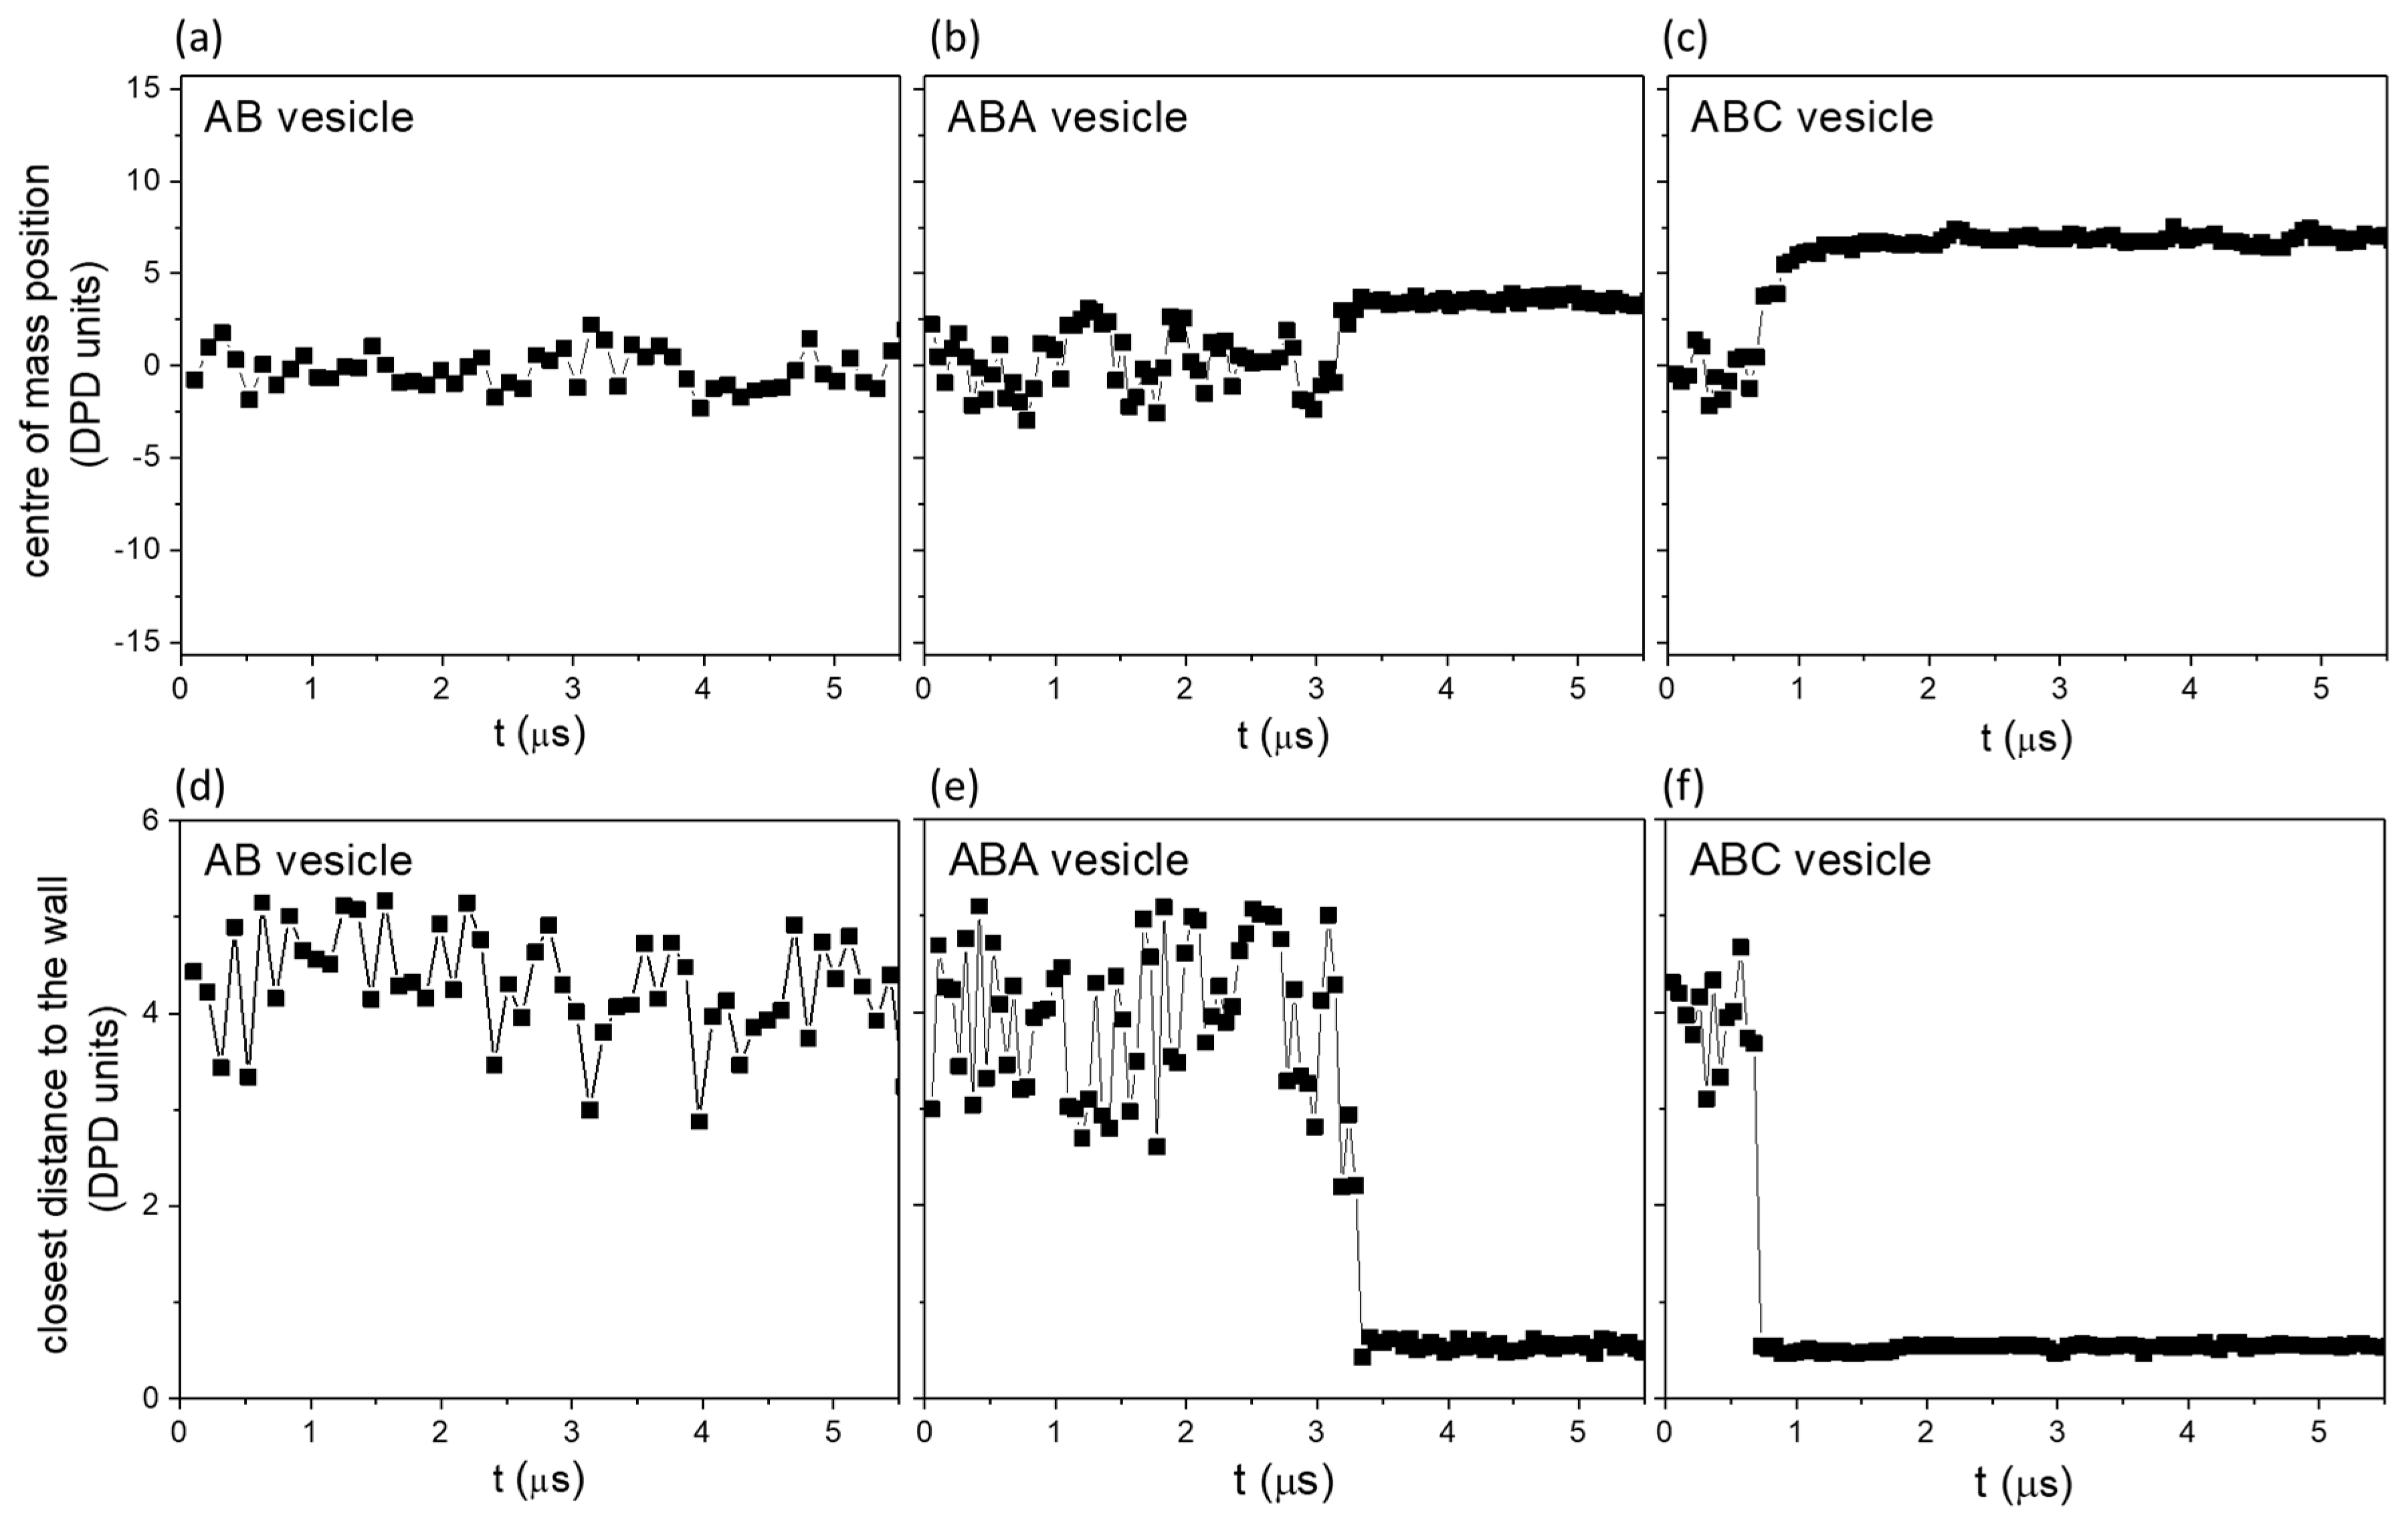
3.3. Cargo Release under Wall Shear
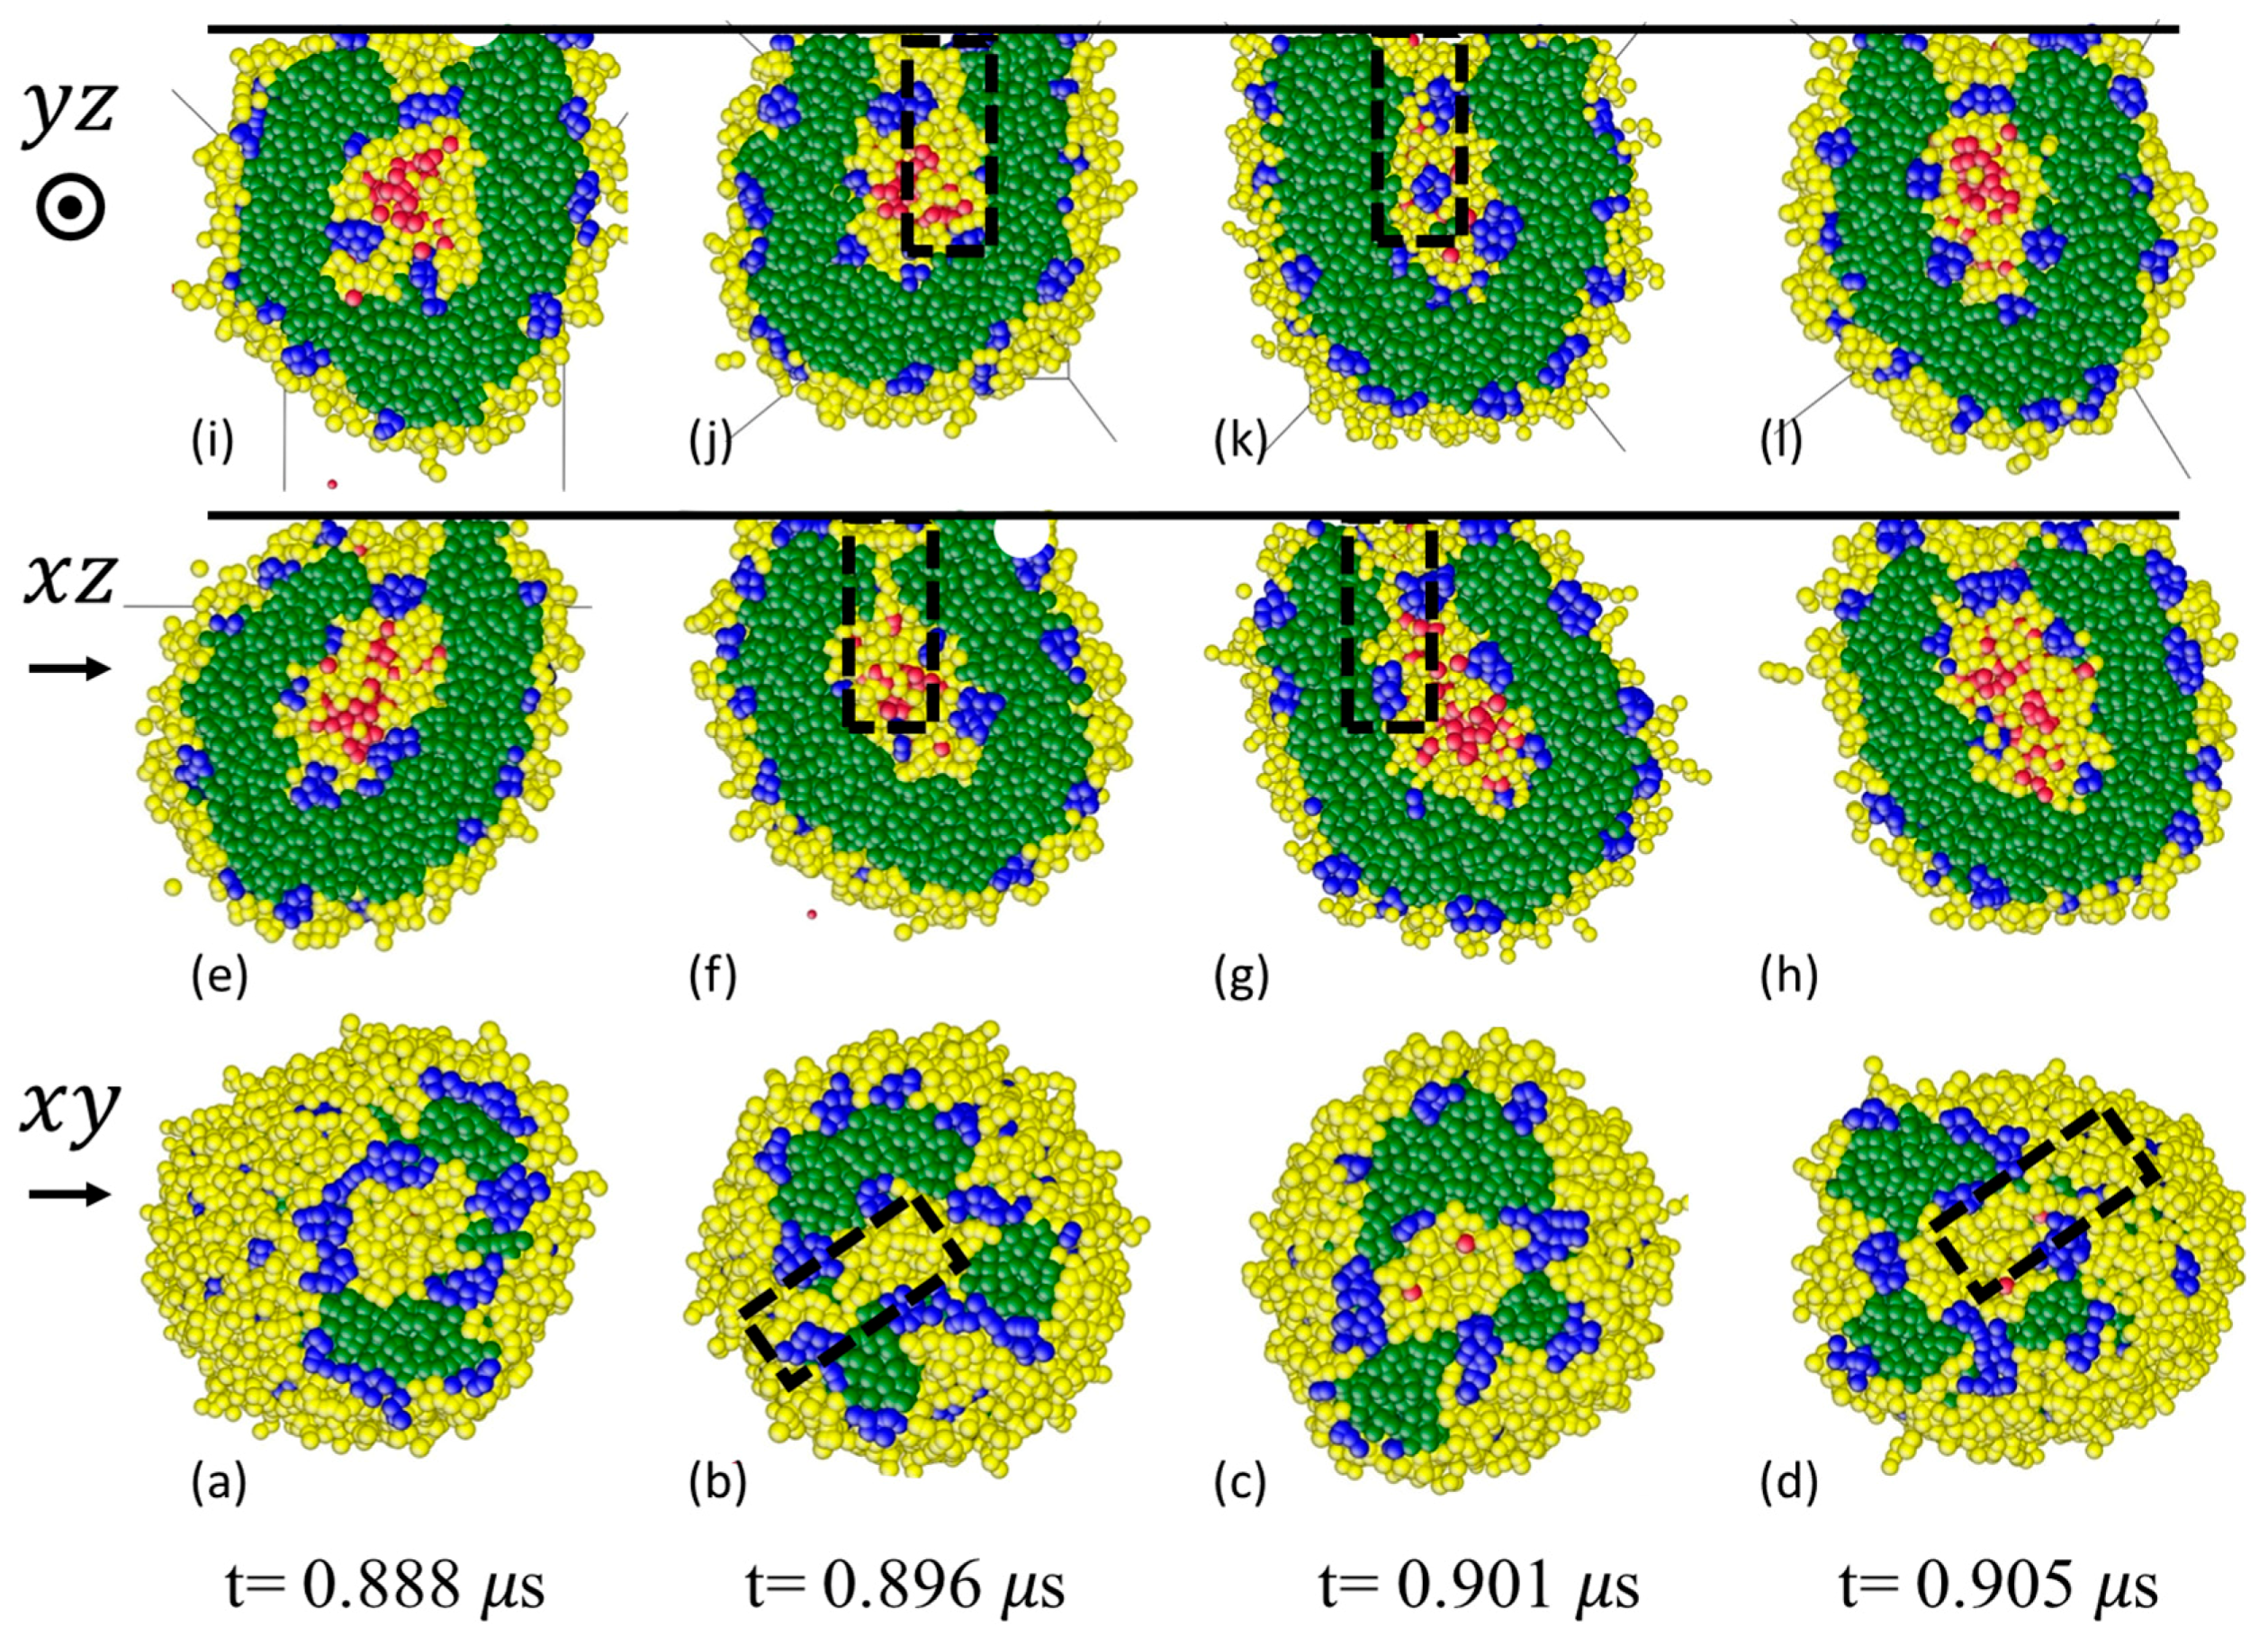
3.3.1. Formation of Solvophilic Pathway in ABC Vesicles
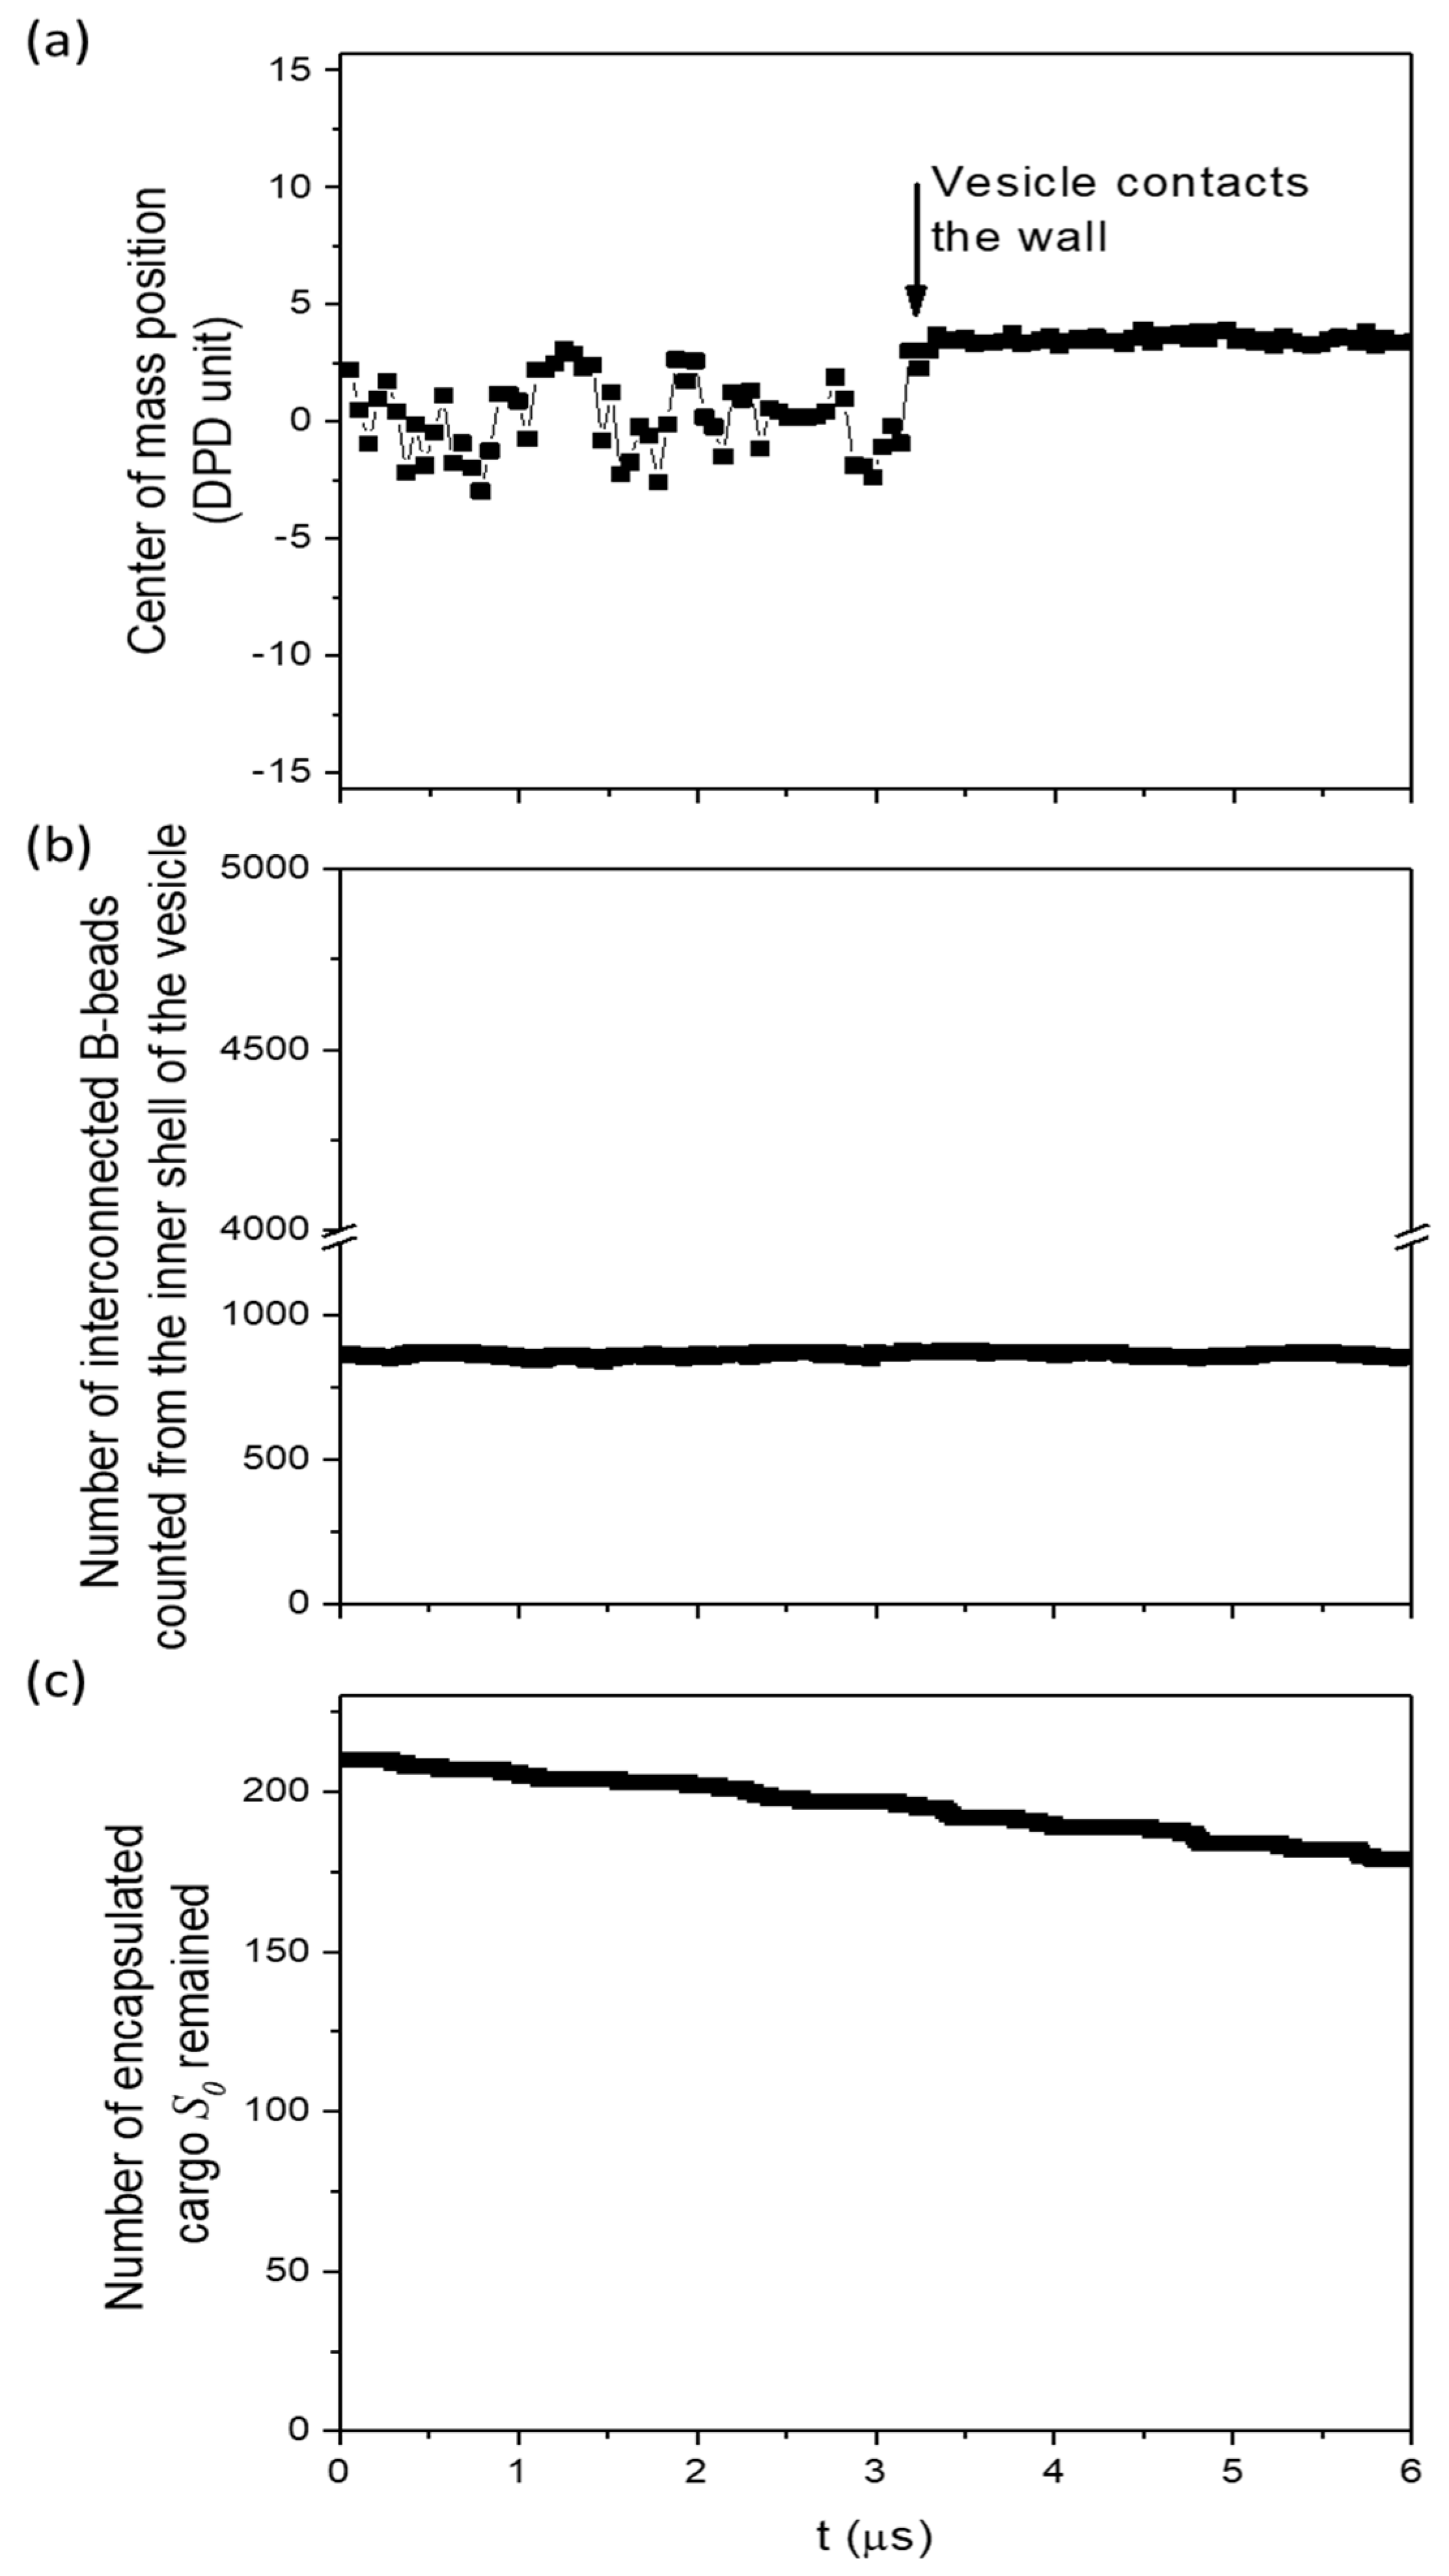
3.3.2. The Significance of the Shearing Wall
4. Conclusions
Supplementary Materials
Acknowledgments
Author Contributions
Conflicts of Interest
References
- Kim, S.H.; Shum, H.C.; Kim, J.W.; Cho, J.C.; Weitz, D.A. Multiple polymersomes for programmed release of multiple components. J. Am. Chem. Soc. 2011, 133, 15165–15171. [Google Scholar] [CrossRef] [PubMed]
- Müller, S.S.; Wurm, F.R. Nanovesicles as drug delivery vehicles: Liposomes and polymersomes. In Encyclopedia of Polymeric Nanomaterials; Kobayashi, S., Müllen, K., Eds.; Springer: Berlin/Heidelberg, Germany, 2014; pp. 1–6. [Google Scholar]
- Chen, W.Q.; Du, J.Z. Ultrasound and ph dually responsive polymer vesicles for anticancer drug delivery. Sci. Rep. 2013, 3, 2162. [Google Scholar] [CrossRef] [PubMed]
- Holme, M.N.; Fedotenko, I.A.; Abegg, D.; Althaus, J.; Babel, L.; Favarger, F.; Reiter, R.; Tanasescu, R.; Zaffalon, P.L.; Ziegler, A.; et al. Shear-stress sensitive lenticular vesicles for targeted drug delivery. Nat. Nanotechnol. 2012, 7, 536–543. [Google Scholar] [CrossRef] [PubMed]
- Liu, F.; Kozlovskaya, V.; Medipelli, S.; Xue, B.; Ahmad, F.; Saeed, M.; Cropek, D.; Kharlampieva, E. Temperature-sensitive polymersomes for controlled delivery of anticancer drugs. Chem. Mater. 2015, 27, 7945–7956. [Google Scholar] [CrossRef]
- Wu, Y.P.; Liu, S.W.; Tao, Y.C.; Ma, C.P.; Zhang, Y.; Xu, J.R.; Wei, Y. New strategy for controlled release of drugs. Potential pinpoint targeting with multiresponsive tetraaniline diblock polymer vesicles: Site-directed burst release with voltage. ACS Appl. Mater. Interface 2014, 6, 1470–1480. [Google Scholar] [CrossRef] [PubMed]
- Nuruzzaman, M.; Rahman, M.M.; Liu, Y.J.; Naidu, R. Nanoencapsulation, nano-guard for pesticides: A new window for safe application. J. Agric. Food Chem. 2016, 64, 1447–1483. [Google Scholar] [CrossRef] [PubMed]
- Mable, C.J.; Derry, M.J.; Thompson, K.L.; Fielding, L.A.; Mykhaylyk, O.O.; Armes, S.P. Time-resolved saxs studies of the kinetics of thermally triggered release of encapsulated silica nanoparticles from block copolymer vesicles. Macromolecules 2017, 50, 4465–4473. [Google Scholar] [CrossRef] [PubMed]
- Mable, C.J.; Gibson, R.R.; Prevost, S.; McKenzie, B.E.; Mykhaylyk, O.O.; Armes, S.P. Loading of silica nanoparticles in block copolymer vesicles during polymerization-induced self-assembly: Encapsulation efficiency and thermally triggered release. J. Am. Chem. Soc. 2015, 137, 16098–16108. [Google Scholar] [CrossRef] [PubMed]
- Hocine, S.; Cui, D.; Rager, M.N.; Di Cicco, A.; Liu, J.M.; Wdzieczak-Bakala, J.; Brulet, A.; Li, M.H. Polymersomes with peg corona: Structural changes and controlled release induced by temperature variation. Langmuir 2013, 29, 1356–1369. [Google Scholar] [CrossRef] [PubMed]
- Borchert, U.; Lipprandt, U.; Bilang, M.; Kimpfler, A.; Rank, A.; Peschka-Suss, R.; Schubert, R.; Lindner, P.; Forster, S. Ph-induced release from p2vp-peo block copolymer vesicles. Langmuir 2006, 22, 5843–5847. [Google Scholar] [CrossRef] [PubMed]
- Scherer, M.; Kappel, C.; Mohr, N.; Fischer, K.; Heller, P.; Forst, R.; Depoix, F.; Bros, M.; Zentel, R. Functionalization of active ester-based polymersomes for enhanced cell uptake and stimuli-responsive cargo release. Biomacromolecules 2016, 17, 3305–3317. [Google Scholar] [CrossRef] [PubMed]
- Gaitzsch, J.; Appelhans, D.; Wang, L.G.; Battaglia, G.; Voit, B. Synthetic bio-nanoreactor: Mechanical and chemical control of polymersome membrane permeability. Angew. Chem. Int. Ed. 2012, 51, 4448–4451. [Google Scholar] [CrossRef] [PubMed]
- Wang, X.R.; Hu, J.M.; Liu, G.H.; Tian, J.; Wang, H.J.; Gong, M.; Liu, S.Y. Reversibly switching bilayer permeability and release modules of photochromic polymersomes stabilized by cooperative noncovalent interactions. J. Am. Chem. Soc. 2015, 137, 15262–15275. [Google Scholar] [CrossRef] [PubMed]
- Mabrouk, E.; Cuvelier, D.; Brochard-Wyart, F.; Nassoy, P.; Li, M.H. Bursting of sensitive polymersomes induced by curling. Proc. Natl. Acad. Sci. USA 2009, 106, 7294–7298. [Google Scholar] [CrossRef] [PubMed]
- Giorgio, T.D.; Yek, S.H. The effect of bilayer composition on calcium-ion transport facilitated by fluid shear-stress. Biochim. Biophys. Acta 1995, 1239, 39–44. [Google Scholar] [CrossRef]
- Marmottant, P.; Biben, T.; Hilgenfeldt, S. Deformation and rupture of lipid vesicles in the strong shear flow generated by ultrasound-driven microbubbles. Proc. R. Soc. A Math. Phys. 2008, 464, 1781–1800. [Google Scholar] [CrossRef]
- Bernard, A.L.; Guedeau-Boudeville, M.A.; Marchi-Artzner, V.; Gulik-Krzywicki, T.; di Meglio, J.M.; Jullien, L. Shear-induced permeation and fusion of lipid vesicles. J. Colloid Interface Sci. 2005, 287, 298–306. [Google Scholar] [CrossRef] [PubMed]
- Poschenrieder, S.T.; Schiebel, S.K.; Castiglione, K. Stability of polymersomes with focus on their use as nanoreactors. Eng. Life Sci. 2018, 18, 101–113. [Google Scholar] [CrossRef]
- Kataoka-Hamai, C.; Yamazaki, T. Induced rupture of vesicles adsorbed on glass by pore formation at the surface bilayer interface. Langmuir 2015, 31, 1312–1319. [Google Scholar] [CrossRef] [PubMed]
- Oliveira, H.; Perez-Andres, E.; Thevenot, J.; Sandre, O.; Berra, E.; Lecommandoux, S. Magnetic field triggered drug release from polymersomes for cancer therapeutics. J. Control. Release 2013, 169, 165–170. [Google Scholar] [CrossRef] [PubMed]
- Lomas, H.; Johnston, A.P.R.; Such, G.K.; Zhu, Z.Y.; Liang, K.; van Koeverden, M.P.; Alongkornchotikul, S.; Caruso, F. Polymersome-loaded capsules for controlled release of DNA. Small 2011, 7, 2109–2119. [Google Scholar] [CrossRef] [PubMed]
- Kumar, M.; Grzelakowski, M.; Zilles, J.; Clark, M.; Meier, W. Highly permeable polymeric membranes based on the incorporation of the functional water channel protein aquaporin z. Proc. Natl. Acad. Sci. USA 2007, 104, 20719–20724. [Google Scholar] [CrossRef] [PubMed]
- Nallani, M.; Benito, S.; Onaca, O.; Graff, A.; Lindemann, M.; Winterhalter, M.; Meier, W.; Schwaneberg, U. A nanocompartment system (synthosome) designed for biotechnological applications. J. Biotechnol. 2006, 123, 50–59. [Google Scholar] [CrossRef] [PubMed]
- Kim, A.J.; Kaucher, M.S.; Davis, K.P.; Peterca, M.; Imam, M.R.; Christian, N.A.; Levine, D.H.; Bates, F.S.; Percec, V.; Hammer, D.A. Proton transport from dendritic helical-pore-incorporated polymersomes. Adv. Funct. Mater. 2009, 19, 2930–2936. [Google Scholar] [CrossRef]
- Yan, L.; Higbee, E.; Tsourkas, A.; Cheng, Z.L. A simple method for the synthesis of porous polymeric vesicles and their application as mr contrast agents. J. Mater. Chem. B 2015, 3, 9277–9284. [Google Scholar] [CrossRef] [PubMed]
- Discher, D.E.; Ortiz, V.; Srinivas, G.; Klein, M.L.; Kim, Y.; David, C.A.; Cai, S.S.; Photos, P.; Ahmed, F. Emerging applications of polymersomes in delivery: From molecular dynamics to shrinkage of tumors. Prog. Polym. Sci. 2007, 32, 838–857. [Google Scholar] [CrossRef] [PubMed]
- Srinivas, G.; Discher, D.E.; Klein, M.L. Key roles for chain flexibility in block copolymer membranes that contain pores or make tubes. Nano Lett. 2005, 5, 2343–2349. [Google Scholar] [CrossRef] [PubMed]
- Itel, F.; Chami, M.; Najer, A.; Lorcher, S.; Wu, D.L.; Dinu, I.A.; Meier, W. Molecular organization and dynamics in polymersome membranes: A lateral diffusion study. Macromolecules 2014, 47, 7588–7596. [Google Scholar] [CrossRef]
- Le Meins, J.F.; Sandre, O.; Lecommandoux, S. Recent trends in the tuning of polymersomes' membrane properties. Eur. Phys. J. E Soft Matter 2011, 34, 14. [Google Scholar] [CrossRef] [PubMed]
- Discher, B.M.; Won, Y.Y.; Ege, D.S.; Lee, J.C.M.; Bates, F.S.; Discher, D.E.; Hammer, D.A. Polymersomes: Tough vesicles made from diblock copolymers. Science 1999, 284, 1143–1146. [Google Scholar] [CrossRef] [PubMed]
- Anajafi, T.; Mallik, S. Polymersome-based drug-delivery strategies for cancer therapeutics. Ther. Deliv. 2015, 6, 521–534. [Google Scholar] [CrossRef] [PubMed]
- Xie, H.T.; Lu, W.S.; Wang, J.D.; Wang, W. Ph responsive vesicles with tunable size formed by single-tailed surfactants with a dendritic headgroup. RSC Adv. 2017, 7, 22079–22085. [Google Scholar] [CrossRef]
- Hoogerbrugge, P.J.; Koelman, J.M.V.A. Simulating microscopic hydrodynamic phenomena with dissipative particle dynamics. Europhys. Lett. 1992, 19, 155–160. [Google Scholar] [CrossRef]
- Groot, R.D.; Madden, T.J. Dynamic simulation of diblock copolymer microphase separation. J. Chem. Phys. 1998, 108, 8713–8724. [Google Scholar] [CrossRef]
- Groot, R.D.; Rabone, K.L. Mesoscopic simulation of cell membrane damage, morphology change and rupture by nonionic surfactants. Biophys. J. 2001, 81, 725–736. [Google Scholar] [CrossRef]
- Guo, Y.Y.; Ma, Z.W.; Ding, Z.J.; Li, R.K.Y. Kinetics of laterally nanostructured vesicle formation by self-assembly of miktoarm star terpolymers in aqueous solution. Langmuir 2013, 29, 12811–12817. [Google Scholar] [CrossRef] [PubMed]
- Guo, Y.Y.; di Mare, L.; Li, R.K.Y.; Wong, J.S.S. Structure of amphiphilic terpolymer raspberry vesicles. Polymers 2017, 9, 275. [Google Scholar] [CrossRef]
- Li, Z.B.; Hillmyer, M.A.; Lodge, T.P. Morphologies of multicompartment micelles formed by abc miktoarm star terpolymers. Langmuir 2006, 22, 9409–9417. [Google Scholar] [CrossRef] [PubMed]
- Forst, P.; Werner, F.; Delgado, A. The viscosity of water at high pressures—Especially at subzero degrees centigrade. Rheol. Acta 2000, 39, 566–573. [Google Scholar] [CrossRef]
- Lin, Y.Q.; Pan, D.Y.; Li, J.M.; Zhang, L.X.; Shao, X.M. Application of berendsen barostat in dissipative particle dynamics for nonequilibrium dynamic simulation. J. Chem. Phys. 2017, 146, 124108. [Google Scholar] [CrossRef] [PubMed]
- Moga, S.A.; Goga, N.; Baoukina, S.; Secuianu, C.; Hadar, A. Simulations on dpd thermostat and standard md for different systems. Mater. Plast. 2014, 51, 340–342. [Google Scholar]
- Gaitzsch, J.; Chudasama, V.; Morecroft, E.; Messager, L.; Battaglia, G. Synthesis of an amphiphilic miktoarm star terpolymer for self-assembly into patchy polymersomes. ACS Macro Lett. 2016, 5, 351–354. [Google Scholar] [CrossRef]
- Chambon, P.; Blanazs, A.; Battaglia, G.; Armes, S.P. Facile synthesis of methacrylic abc triblock copolymer vesicles by raft aqueous dispersion polymerization. Macromolecules 2012, 45, 5081–5090. [Google Scholar] [CrossRef]


| Interaction Parameter, aij (in DPD Units) | A | B | C | S (Water) | W (Wall) |
|---|---|---|---|---|---|
| A | 25.0 | ||||
| B | 38.5 | 25.0 | |||
| C | 78.0 | 89.4 | 25.0 | ||
| S (water) | 97.9 | 26.0 | 125.0 | 25.0 | |
| W (Wall) | 200 | 200 | 200 | 200 | 18 |
| Number of monomer in one coarse-grained bead (900 Å3) | 7.3 | 14 | 6 | 30 |
© 2018 by the authors. Licensee MDPI, Basel, Switzerland. This article is an open access article distributed under the terms and conditions of the Creative Commons Attribution (CC BY) license (http://creativecommons.org/licenses/by/4.0/).
Share and Cite
Guo, Y.; Di Mare, L.; Li, R.K.Y.; Wong, J.S.S. Cargo Release from Polymeric Vesicles under Shear. Polymers 2018, 10, 336. https://doi.org/10.3390/polym10030336
Guo Y, Di Mare L, Li RKY, Wong JSS. Cargo Release from Polymeric Vesicles under Shear. Polymers. 2018; 10(3):336. https://doi.org/10.3390/polym10030336
Chicago/Turabian StyleGuo, Yingying, Luca Di Mare, Robert K. Y. Li, and Janet S. S. Wong. 2018. "Cargo Release from Polymeric Vesicles under Shear" Polymers 10, no. 3: 336. https://doi.org/10.3390/polym10030336