3.1. Experimental Results
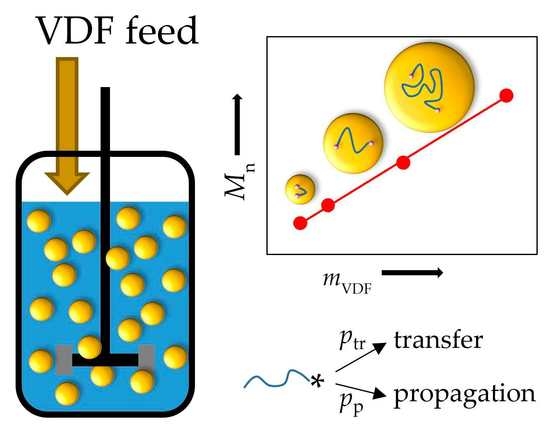
The semi-batch polymerizations were carried out at a constant pressure ranging from 10 to 30 bar and at a temperature of 75 °C. Due to the continuous addition of monomer the progress of the reaction is conveniently described by the mass of VDF introduced to the polymerization reactor (given by the mass flow controller) rather than by the reaction time or monomer conversion. To evaluate the variation of the molar mass distributions throughout the reaction samples of a volume of 15 mL were taken. The polymers were analyzed via SEC. As an example,
Figure 1 shows the MMDs obtained from a polymerization at 15 bar and 75 °C with 7.5 mmol C
4F
8I
2. The MMDs are shifted to higher molar masses with increasing amount of VDF fed to the reactor. The dispersities range from 1.18 to 1.41 for 10 and 100 g VDF polymerized, respectively, indicating very good control of the molar masses.
If the number average molar masses (
Mn) are considered the picture is not as ideal, as shown on the left-hand side in
Figure 2 for polymerizations carried out at 75 °C and 20 bar for three CTA concentrations indicated. While
Mn increases almost linearly with the VDF mass consumed, at all three CTA concentrations, extrapolation of the linear region to low VDF masses does not lead to a line crossing the ordinate at a value representing the molar mass of the initial CTA. As previously reported for VDF copolymerization controlled by C
6F
13I this finding may be due to non-ideality in the very early stages of the polymerization, e.g., in the initialization phase of the CTA [
37]. To get a better understanding of the initial polymerization stage additional experiments (samples 4 to 6) were carried out with sampling at very low VDF masses fed into the system. The data are presented on the right-hand side of
Figure 2. The data indicate that at 10 g of VDF fed to the reactor the
Mn data coincide with the data at higher VDF masses. The curves were obtained from kMC modeling described in
Section 3.2.
Theoretically,
Mn is calculated as a function of the initial amount of CTA (
nCTA0) and the amount of VDF polymerized (
nVDF or
mVDF) in a semi-batch polymerization according to Equation (1):
In the special case of a VDF emulsion polymerization the CTA may not only serve as a transfer agent inside the particle. In fact, due to a partition equilibrium small amounts of the fluorinated CTA may also be found in the aqueous phase and on the surface of the particles, contributing to the stabilization of the particles [
32]. For example, for a polymerization system particle diameters of 20 nm were estimated via dynamic light scattering after sampling. If a CTA is used, the particle diameter increased to 40 nm, suggesting that the CTA is also participating in the stabilization of the particles allowing for larger sizes. Thus, only a fraction of the CTA introduced into the reactor is actually available for the chain transfer reaction. The amount of CTA available inside the particle was estimated from the slopes of linear fits to the experimental data on the left-hand side of
Figure 2. The effective CTA concentrations are 4.2 mmol, 7.5 mmol, and 14.1 mmol. These quantities are considered to be
nCTA0. On average 57% of the CTA are available for chain transfer reactions. The low dispersity values and the linear increase in
Mn with the mass of VDF fed to the system throughout most of the reaction indicate that the concentration of effective CTA does not change to a large extent during the polymerization.
Ideally, the number of I polymer end groups in ITP stays constant. However, it is well known that the number of I end groups is gradually decreasing with increasing degree of polymerization [
38,
39]. The loss of I end groups depends on the polymerization conditions. Thus, it is important to study how the I end group functionality varies throughout the emulsion polymerizations considered in this contribution. As an example,
Figure 3 shows how the amount I end groups is varying with the amount of VDF polymerized. The amount and type of I end group functionality of PVDF chains is accessible from
1H NMR spectroscopy. As previously detailed due to head to tail, tail to tail, and head to head addition of the monomer VDF to the propagating chain two types of iodine end groups are found in ITP [
10]: –CH
2–CF
2–I and –CF
2–CH
2–I. The protons in both types of end groups are associated with
1H NMR signals at 3.71 ppm and 3.97 ppm [
10]. For PVDF obtained from a reaction at 75 °C and 20 bar with 7.5 mmol CTA 93% of iodine end groups are –CF
2–CH
2–I. The finding of an increasing fraction of CF
2–CH
2–I end group with an increase in chain length is in good agreement with previous work, e.g., by the group of Ameduri [
11,
40]. Using C
6F
13I as CTA the fraction of CF
2–CH
2–I end groups increased from 25% at a chain length of 6 to 72% for a chain length of 25. The emulsion polymerization at 75 °C and 20 bar with 7.5 mmol C
4F
8I
2 results in 96% of the CH
2–I end group already at a degree of polymerization of 88, which is associated with the data point at the lowest amount of VDF polymerized in
Figure 3.
Figure 3 clearly shows a linear decrease of I end group functionality during the course of the polymerization. The more VDF is polymerized the lower the amount of I end groups. The reason for this lowering is suggested to be due to an irreversible deactivation of the I end groups via H transfer from initiator or surfactant as well as via bimolecular termination. This type of deactivation was already reported for RAFT VDF polymerizations [
6]. Since both RAFT and ITP are considered to be polymerizations with degenerative transfer, the linear correlation between the decreasing amount of I end groups and the amount of VDF consumed may be interpreted as a measure for the irreversible deactivation of I polymer end groups or in other words the loss of I end groups. The inverse of the slope of the linear fit in
Figure 3 yields the average number of propagation steps after which one of the above-listed deactivation reactions occurs. The diagram allows for identification of the proportionality of two reaction pathways: deactivation and propagation. Transfer reactions do not impact the graph in
Figure 3. The linear fit of the data is associated with an absolute value of 0.00225 for the slope, which may be interpreted as the probability that irreversible deactivation of an I end group occurs at the radical chain end rather than addition of a monomer unit in a propagation reaction. The linear fit suggests an initial value of the molar amount of I end groups of 14.1 mmol, which is slightly lower than the theoretical value of 15 mmol for
nCTA0 = 7.5 mmol of sample 2 in
Table 1. The reason may be seen in a degradation of the CTA agent during storage. In the kinetic modeling described below the concentration of active CTA molecules present in the particles was considered.
3.2. Kinetic Monte Carlo Simulation
In order to get a better understanding of the ITP process—in particular in the initial phase of the reaction—the deactivation–activation equilibrium of the initial CTA and the polymeric species is investigated via kinetic Monte Carlo (kMC) modeling of the polymerization inside the particles. In case of a monofunctional CTA the following equilibria are considered:
The first equilibrium describes the transformation of the initial CTA I–X via reaction with a radical of chain length m. The radical, X
•, initiates a new chain leading to a polymeric radical. This process is frequently referred to as the initialization period. Equation (3) describes the main equilibrium of the ITP process. For details on ITP the reader is referred to the literature [
10,
11,
38]. Equations (2) and (3) refer to the use of a CTA with a single iodine atom, as for example in C
6F
13I (X = C
6F
13). In the case of bifunctional CTAs with two iodine end groups the reaction mechanism is more complex. In this contribution I–X–I with X = C
4F
8 is considered. As shown in Equations (4) and (5) firstly one of the I atoms undergoes a chain transfer reaction to yield I–X followed by addition of monomer to this radical. After transfer with an I atom a mixed intermediate I–XP
n–I is formed. Equations (6) and (7) illustrate the activation of the second I atom of the original CTA resulting in I-P
nX
• and subsequent propagation yielding a radical with two polymeric segments, I–P
nXP
k•. Finally, in Equation 8 the main equilibrium between species containing two polymeric segments is shown.
A clear distinction between pre-equilibrium and main equilibrium is not feasible. For example, the intermediate species I–XP
n–I contains an I atom in the neighborhood of X, the fluorinated fragment of the initial CTA, and a second I next to a polymer segment. Thus, I–XP
n–I may undergo two different chain transfer reactions. Equations (4)–(8) represent only a small selection of reactions occurring during ITP with C
4F
8I
2. For example, instead of P
m• in Equations (4) and (6) the radicals I–XP
n• or I–P
nXP
k• may be in equilibrium with I–X–I or I–XP
n–I, respectively. The full set of 63 reactions occurring is given in the
Supplementary Materials.
The kMC simulation accounts for a large ensemble of discrete molecules. The number of molecules for all reactants of the model is proportional to the number of each species inside the latex particles. The molar amount of the gaseous monomer VDF inside the particles depends on the pressure inside the reactor and may be considered constant due to the semi-batch mode. To estimate this quantity experimentally the reactor filled with water and surfactant was pressurized with 20 bar of VDF for one hour to dissolve VDF in the micelles. Then, the reactor was slowly depressurized and VDF dissolved inside the particles was polymerized at ambient pressure. The reaction resulted in 2 g of PVDF, which is associated with the consumption of 31.2 mmol VDF.
At the beginning of the polymerization, bifunctional CTA is contained in the micelles. The model accounted for 6% of the iodine atoms being already deactivated (end group D instead of I) due to aging, which was identified via
19F NMR spectroscopy. For this purpose in addition to the CTA I–X–I a CTA with one deactivated group D–X–I is introduced in the simulation. According to the molar amounts of VDF, I–X–I and D–X–I these species are distributed to 10
7 molecules. Contrary to a kinetic Monte Carlo simulation of an emulsion polymerization with discrete particles and a corresponding control volume [
20], in the simulation described here only the propagation and transfer reactions inside the particles are considered. The reactions inside the water phase and the radical transport into the particle are not part of the model. This approach is justified since due to the semi-batch process the molar amount of monomer (
nM) inside the particle is constant. Consequently, the number of VDF molecules in the simulation is also constant. According to the ITP mechanism, the CTA molecules and the resulting polymer species with I end groups control the radical polymerization inside the particles. It may be assumed that the transfer and propagation reactions inside the particles are dominant due to the comparably high CTA concentration. Thus, the molar amount of dead polymer molecules generated due to bimolecular termination is negligible compared to the amount of propagating chains. The experimentally observed linear increase in
Mn as a function of the polymerized mass of VDF and low dispersities support this assumption. Therefore, the termination reactions are not contained in the kinetic model and
Mn is simulated on the basis of propagation and transfer reactions.
Consideration of all the reactions mentioned the species listed in
Table 2 have to be accounted for. For the macromolecular species #2, #3, #5 to #9, in addition to the number of molecules the chain lengths of each molecule is registered in the simulation. The simulation starts in a first Monte Carlo step with the reaction of a radical of type I–X
•, which is formed upon activation of a CTA molecule I-X-I. The equations for the probabilities of individual transfer reactions contained in
Table 2 are given by the reaction rate of this individual transfer reaction divided by the reaction rates of all other reactions: propagation and transfer reactions of I–X and I–P. In addition, the individual rate coefficients
kp,
ktr und
kex were substituted by
Ctr and
Cex.
A single Monte Carlo step in the kMC simulations accounts for the execution of a reaction according to the actual reaction probabilities. As an example for a Monte Carlo step
Scheme 1 depicts the reactions that may occur with a radical of type I–P
mXP
k•. The radical I–P
mXP
k• (i) may add a monomer unit in a propagation reaction leading to the radical I–P
mXP
k+1•, (ii) may be irreversibly deactivated resulting in species I–P
mXP
k–D, (iii) or may be reversibly deactivated due to a transfer reaction with an I end group of another molecule resulting in I–P
mXP
k–I. The actual reaction path is selected in step 1 of
Scheme 1 using a random number r being in the interval 0 ≤ r ≤ 1. The random number r is a pseudo random number, which is generated using the Mersenne-Twister algorithm [
35]. The probability of the propagation reaction
pp is calculated according to Equation (9) using the molar amount,
nM, of the monomer VDF, the molar amount, Σ
nX-I, of the I end groups of the original CTA (I–X–I) or the partially initialized CTA (I–XP
n–I), and the molar amount, Σ
nP-I, of the I end groups of the PVDF segments. It is important to note that the type of I end groups is different: CF
2–I is the I end group in the original CTA, whereas –CH
2–I is the predominant I end group of the PVDF segment. The transfer activities of both chain ends are expected to differ significantly [
10] and, thus, within the ITP mechanism two different transfer constants,
Ctr and
Cex, are defined by Equations (11) and (12), respectively.
Ctr refers to the transfer reaction of –CF
2–I and
Cex to the transfer reaction of the –CH
2–I end group. Both transfer constants were determined by a fit of the simulation to the experimental data shown in
Figure 2 assuming that the transfer constants are not significantly affected by the slightly different reaction pressure.
The overall probability of all reactions in an MC step equals one and is given by Equation (13). It is calculated as the sum of
pp, the probability for irreversible deactivation
pd, and the sum of probabilities of the transfer reactions of the seven I end groups containing species accounted for in the mechanism. The transfer probabilities
ptr,I (I = 1 to 7) of species #1 to #7 are listed in
Table 2. For all species the number and type of end groups is considered. Therefore, the transfer probability of the deactivated species #8 and #9, which contain no I, is zero. Since the random number r and the probability vector in
Scheme 1 (the sum of
pp to
ptr,7 in Equation (13) are in the value range from zero to one, the random number r allows for an easy selection of a reaction path. Starting with sector
pp it is tested, to which sector r belongs.
If the random number generated in step 1 of
Scheme 1 is r ≤
pP, transfer reactions do not take place and the simulation reaches stage 2p in the next step. The notation 2p refers to step 2 and the propagation path. In case of a propagation reaction the length of the macroradical is increased by one (I–P
mXP
k+1•) and the radical is transferred to the next MC step of the simulation.
If the random number fulfills
pp < r ≤ (
pp +
pd) an irreversible deactivation reaction occurs at the chain end (2d). A molecule of type I–P
mXP
k–D is generated and a new MC step is started. To provide a new radical for the execution of the next MC step, a molecule is selected from the reservoir of reversibly deactivated species (#1 to #7 in
Table 2) according to statistical weighting based on the actual number of molecules and the number of I end groups (1 and 2 in
Table 2) with a random number. The selected molecule is activated by taking off the I end group. Subsequently, the radical keeping its chain length is introduced into the next MC step.
In case of the random number being r > (pp + pd) in the first step (2tr) a transfer reaction is carried out. The initially growing radical is reversibly deactivated and is stored with its chain length as a species of type I–PmXPk–I. The reaction partner is determined in step 3tr with the random number r and the transfer probabilities ptr,1 to ptr,7. For example, transfer with species #2 (I–XPn–I) occurs, which is activated by removal of an I end group, if r is in the interval (pp + pd + ptr,1) < r ≤ (pp + pd + ptr,1 + ptr,2). The radical generated is then used in the next MC step. If transfer to a low molar mass species (I–X–I or D–X–I) occurs, in the next MC step a new propagating chain is generated.
The results are logged at fixed intervals of VDF consumed; e.g., a simulation run up to a conversion of 120 g VDF and data export every 0.05 g affords a simulation time of 18 min. If data are logged only every 1 g of consumed VDF the simulation runs only for 1 min. This finding indicates that the time-determining step is the analysis of the chain length distributions required for the calculation of Mn. The MC steps are not rate determining for the simulation. Within a Monte Carlo simulation the system size is an important parameter with respect to obtaining reproducible results. Here, the number of molecules used is 107, which represents the molar ratio of monomer and CTA at the beginning of the simulation. This number was selected to be sufficiently large to generate reproducible results with a moderate demand of computing time. Averaging of the simulation runs is not required. Even an enhancement of the molecular number from 107 to 108 does not lead to significant variations in the simulation results.
The kMC modeling yields the variation of all deactivated species during the polymerization. In the initial phase of the reaction the original CTA (I–X–I), the partially transformed CTA (I–XP
n–I) and the fully transformed CTA species (I–P
mXP
k–I) are of particular interest. The disappearance of the original CTA and the appearance of the fully transformed species indicates how quickly the main equilibrium required for molar mass control during the polymerization is established. The data are shown in
Figure 4. It is clearly seen that the original CTA is fully consumed at a VDF consumption of 2 g. Considering a total VDF consumption of 110 g at the end of the reaction the transformation may be considered very fast. The mixed species I–XP
n–I given in black is consumed after consumption of 4 g of VDF. At this point the bifunctional deactivated polymeric species reaches its maximum followed by a slight decrease due to irreversible deactivation. Further, the red data in
Figure 4 refer to the evolution of the number average molar masses for an ideal ITP (dashed) as well as the experimentally derived and modeled data. The polymeric species occurring throughout the entire reaction are depicted in
Figure 5. As seen in
Figure 5, the maximum content of the bifunctional deactivated polymeric species (I–P
mXP
k–I) is quickly formed followed by a steady decay due to irreversible deactivation reactions. After 120 g of VDF are consumed, around 40% of the species contain two iodine end groups. The fraction of the fully transformed species with only a single iodine atom (D–P
mXP
k–I) is gradually increasing until a value of almost 40% is reached at the end of the simulation. Moreover, around 10% of the species resemble irreversible deactivation of one side of the original CTA during the initialization of the original CTA (D–XP
n–I). The figure clearly indicates that the fraction of polymeric species without an iodine atom is rather small. At the end of the simulation around 10% of the species are irreversibly deactivated. The red data refer to the overall functionality; that is, the sum of mono- and bifunctional deactivated species. It is clearly shown that around 70% of the initially present iodine end groups are present at the end of the reaction. Moreover, excellent agreement between experimental simulation results is reached.
3.3. Discussion
The simulations result in
Ctr = 7.1 and
Cex = 0.094 by fitting the experimental data in
Figure 2.
Figure S1 of the Supplementary Material gives the joint confidence intervals for the parameters and
Figure S2 demonstrates the sensitivity of the parameters. These data are compared with literature values for ITP and RAFT polymerization listed in
Table 3. Boyer et al. reported transfer constants for the –CF
2–I end group in VDF telomerizations ranging from 7.4 to 7.9 [
10]. These values are in very good agreement with the value of 7.1 for
Ctr determined in this contribution and lie within the confidence interval depicted in
Figure S1. In addition, a transfer constant of 0.3 was estimated by Boyer et al. [
10] for a model compound with –CH
2–I end group. This value is significantly higher than the value for
Cex determined in this contribution. In addition, it was stated that transfer constants higher than one are required for a well-controlled polymerization [
10]. In the following it is explained why good control of the polymerization up to high degrees of polymerization of around 400 was still achieved.
In
Figure 4 it is seen that after polymerization of only 10 g VDF the transformation of –CF
2–I to –CH
2–I is complete. Thus, from this stage on only end groups with the lower transfer constant of 0.094 are available for iodine transfer. In order to achieve good control in reversible deactivation transfer polymerizations, the probability for reversible transfer at the chain end has to be high compared to the probability of the propagation reaction. This is reflected in the definition of the transfer constant in Equation (12) as the ratio of the rate coefficients for the transfer and propagation reaction. Since both reactions are of second order, additionally, the ratio of the initial concentrations of monomer and CTA,
cmon0/
cCTA0, determines the reaction path. Thus, an evaluation of the transfer constants has to be accompanied by a consideration of the concentrations present. For this task the transfer probability,
ptransfer, given in Equation (14) may be calculated. In the case of a bifunctional CTA, such as C
4F
8I
2, c
CTA0 in Equation (14) has to be doubled. The use of
ptransfer is rather convenient since only the initial concentrations and the transfer constants are required. The transfer probabilities,
ptr, introduced above in the section on kMC simulations refer to the situation at a certain instant throughout the polymerization with momentary concentrations or molar amounts of individual species. Here, the notation
Ctransfer is used to distinguish that literature data generally refer to the overall transfer activity in ITP and RAFT polymerizations.
The values for
ptransfer in
Table 3 were calculated according to the information in the original publications. It is clearly seen that
ptransfer values for ITP with –CF
2–I end groups (entries #1 and #2) are at least one order of magnitude higher than the values for the RAFT systems. These high probabilities are due to rather small ratios of
cmon0/
cCTA0, which limit the accessible number average degrees of polymerization,
DPn, at complete conversion in batch polymerizations. With
cmon0/
cCTA0 = 100/6.6 (entry #1 in
Table 3), a maximum value of
DPn = 15 may be reached. On the contrary in semi-batch polymerizations this limit is not operative since monomer is continuously fed to the system. Despite a rather low transfer constant of 0.094 for ITP with –CH
2–I end groups a rather high transfer probability of 0.043 is reached in semi-batch polymerization mode. For comparison, ITP of VDF with HCF
2CF
2CH
2–I is associated with a transfer probability of 0.019. To judge these transfer probabilities it is instructive to consider more common systems, such as RAFT polymerizations of styrene. For example, Ran et al. reported transfer constants for trithiocarbonates as RAFT agents ranging from 4.32 to 23.2 [
42]. Two examples are given in
Table 3 (entries #7 and #8). While insufficient control was achieved for #8 with
Ctransfer = 4.32 and
ptransfer = 0.009, system #7 with
Ctransfer = 23.2 and
ptransfer = 0.044 is very well-controlled. The ratio of concentrations
cmon0/
cCTA0 = 100/0.2 is associated with a maximum
DPn of 500. The comparison indicates that despite a low transfer constant of 0.094 the use of a bifunctional CTA in semi-batch ITP of VDF yields a similar
ptransfer of 0.043 compared to 0.044 in the well-controlled styrene RAFT polymerizations. These values are significantly higher than
ptransfer = 0.007 for ITP of styrene, and clarifies why this system is not very well controlled. This discussion explains why semi-batch emulsion ITP of VDF may be carried out and well controlled up to rather high
DPn despite the low transfer constant.
In semi-batch emulsion polymerizations of VDF the pressure controls the monomer concentration inside the particles. According to Henry’s law, the molar amount of VDF increases from
nVDF0 = 15.6 mmol at 10 bar, to 31.2 mmol at 20 bar, and to 46.8 mmol at 30 bar. As shown on the left-hand side of
Figure 6, the variation of pressure is associated with a significant increase in rate of polymerization. While at 30 bar 100 g PVDF are obtained after 2 h, at 10 bar only 40 g PVDF are obtained in 4 h. These numbers refer to polymerization rates of 0.78 mol·h
–1 and 0.16 mol·h
−1 at 30 and 10 bar, respectively. The impact of pressure on
Mn is depicted on the right-hand side of
Figure 6 at 10 bar a steady increase in
Mn with mass of consumed VDF is observed. At 30 bar, at the beginning of the reaction rather high
Mn values of 16,000 g∙mol
−1 are reached. With further polymerization this value gradually increases. As discussed above, the rather high
Mn value at the beginning of the reaction is due to the fact that the transformation of the original CTA C
4F
8I
2 is slow compared to the propagation rate. While the equilibria of the various species with I end groups have to be established until only polymeric species with I end groups are present (in particular, at 30 bar), significant propagation occurs due to the higher VDF content in the particles. At 10 bar, the equilibria also have to be established. However, at 10 bar, the amount of VDF inside the particles is significantly lower, thus, less propagation occurs during this stage of the polymerization, in which the system is not yet well controlled. If
ptransfer listed in
Table 4 is considered, the lower molar amount of VDF directly leads to a higher transfer probability. If the molar amount of VDF is increased the transfer probability is reduced. Of course,
ptransfer may also be increased due to an increase in CTA concentration.
Based on this discussion a polymerization process was inferred that allows for high polymerization rates at high pressure and, at the same time, well-controlled molar mass distributions are obtained up to high degrees of polymerization. For this purpose, a pressure profile was used: in the initial phase of the polymerization a low pressure of 10 bar was chosen to reach a high transfer probability. Once the main equilibrium is established the pressure is increased to 30 bar to take advantage of the higher monomer content in the particles and the associated higher polymerization rate. To further enhance the transfer probability, the CTA amount was increased to 6.8 mmol. Thus, in the initial phase of the polymerization, ptransfer of 0.861 is reached leading to better control of the activation of the CTA. Later, after increasing the pressure to 30 bar, ptransfer is reduced to 0.026.
The evolution of VDF consumed with time is depicted on the left-hand side of
Figure 6. For the first hour, a pressure of 10 bar is chosen, which leads to a consumption of 10 g of VDF. Then, within the next 20 min, the pressure is slowly increased to 30 bar. When the final pressure is reached around 35 g of VDF are consumed. In the following period, the consumption of VDF with time is very similar to the polymerization carried out at 30 bar from the beginning. The number average molar masses given on the right-hand side of
Figure 6 indicate that a slower increase of
Mn with amount of VDF consumed is found. The data indicate that the low transfer probability of 0.026 is sufficient to keep the well-controlled polymerization conditions established in the initial phase.


