Enhanced Mechanical and Water Absorption Properties of Rice Husk-Derived Nano-SiO2 Reinforced PHBV Composites

Abstract
:
1. Introduction
2. Experimental
2.1. Materials
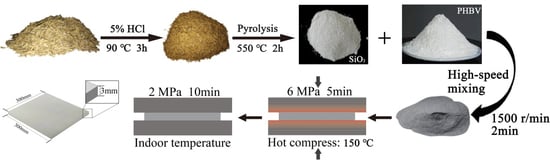
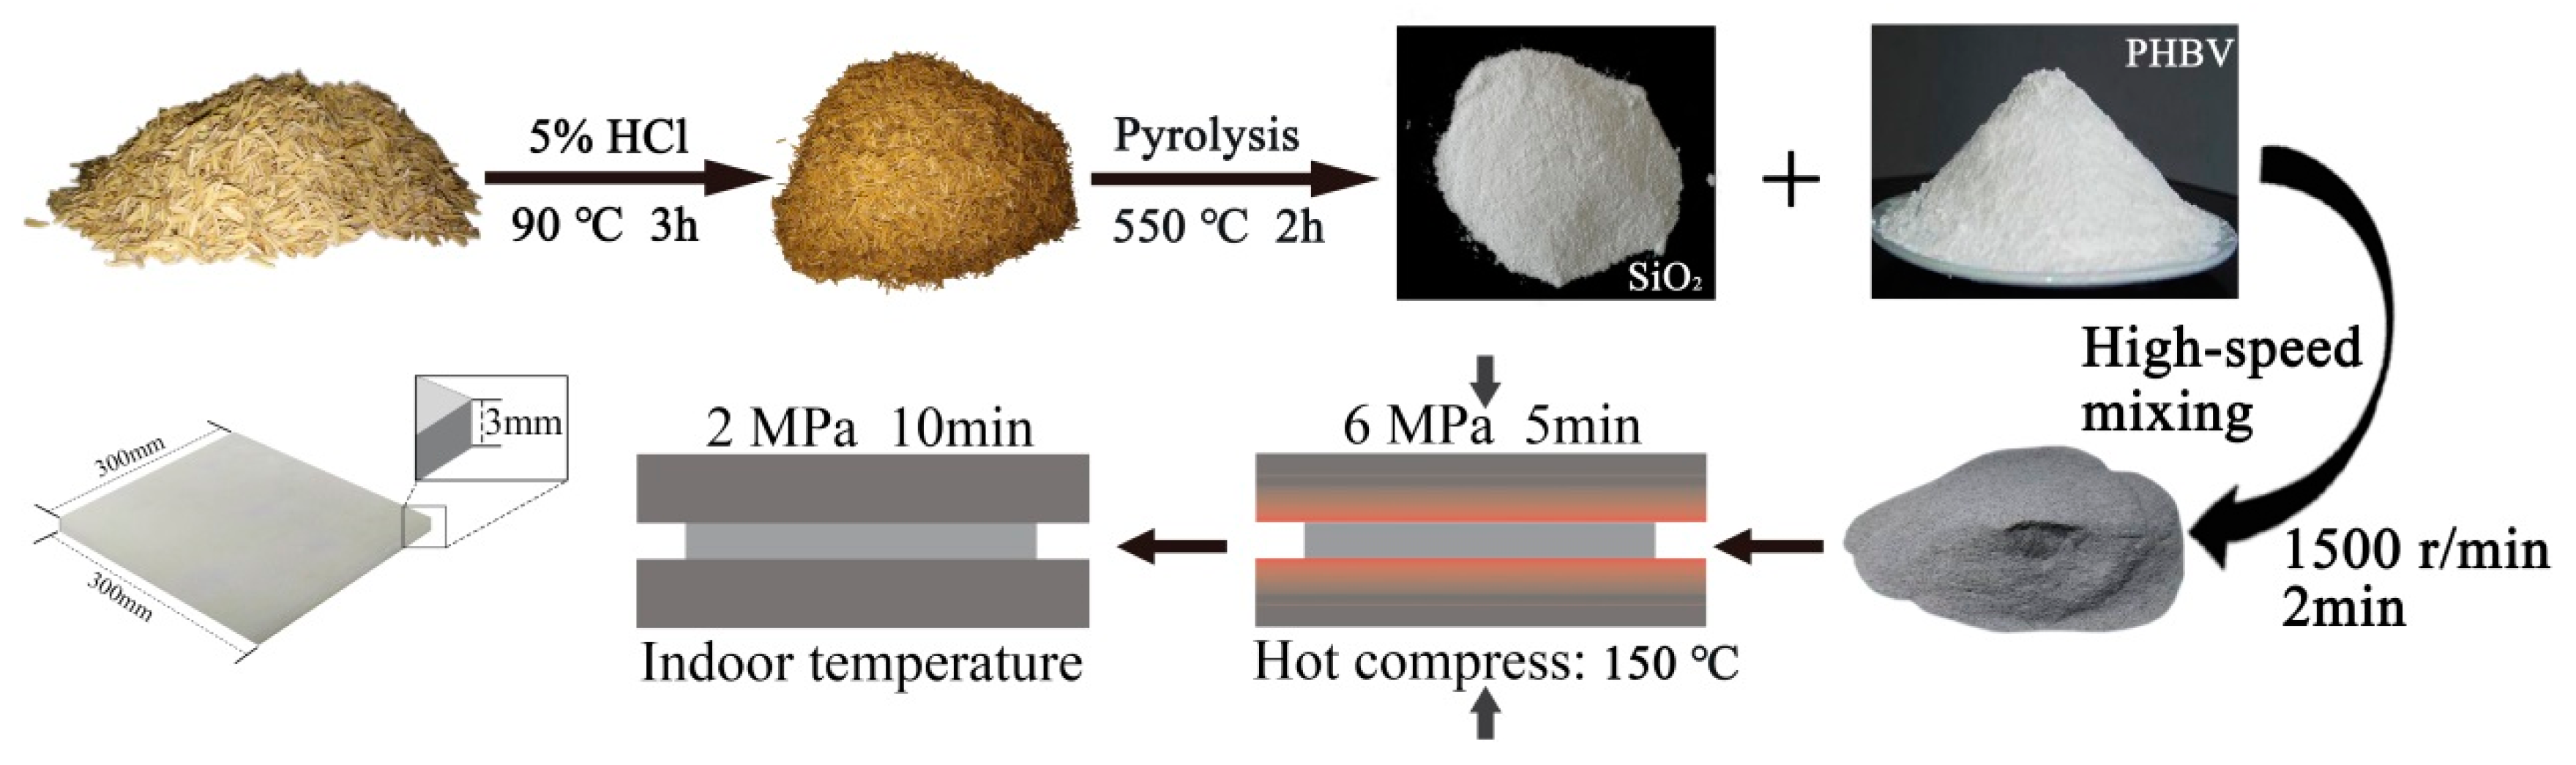
2.2. RHNS Synthesis
2.3. Fabrication of RHNS/PHBV Composites
2.4. Material Characteristics
3. Results and Discussion
3.1. RHNS Characterization
3.2. RHNS/PHBV Composite Characterization
3.2.1. Mechanical Properties
3.2.2. Water Absorption Performance
3.2.3. Thermal Stability
3.2.4. Differential Scanning Calorimetry
3.2.5. Ex-Situ Morphological Analysis
4. Conclusions
Author Contributions
Funding
Conflicts of Interest
References
- Olaitan, A.J. Comparative Assessment of Mechanical Properties of Groundnut Shell and Rice Husk Reinforced Epoxy Composites. Am. J. Mech. Eng. 2017, 5, 76–86. [Google Scholar] [CrossRef]
- Al-Oqla, F.M.; Zainudin, E.S.; Sapuan, S.M.; Aridi, N.A.M. A Review of Rice Husk Bio-Based Composites. Curr. Org. Synth. 2017, 14, 263–271. [Google Scholar]
- Shen, Y.; Zhao, P.; Shao, Q.; Takahashi, F.; Yoshikawa, K. In situ catalytic conversion of tar using rice husk char/ash supported nickel–iron catalysts for biomass pyrolytic gasification combined with the mixing-simulation in fluidized-bed gasifier. Appl. Energy 2015, 160, 808–819. [Google Scholar] [CrossRef]
- Xu, M.; Yin, P.; Liu, X.; Tang, Q.; Qu, R.; Xu, Q. Utilization of rice husks modified by organomultiphosphonic acids as low-cost biosorbents for enhanced adsorption of heavy metal ions. Bioresour. Technol. 2013, 149, 420–424. [Google Scholar] [CrossRef] [PubMed]
- John, K.L.; Mohan, K.; Sekaran, G. Integrated biological and catalytic oxidation of organics/inorganics in tannery wastewater by rice husk based mesoporous activated carbon––Bacillus sp. Carbon 2004, 42, 2399–2407. [Google Scholar] [CrossRef]
- Kalderis, D.; Bethanis, S.; Paraskeva, P.; Diamadopoulos, E. Production of activated carbon from bagasse and rice husk by a single-stage chemical activation method at low retention times. Bioresour. Technol. 2008, 99, 6809–6816. [Google Scholar] [CrossRef] [PubMed]
- Dutta, N.; Mukhopadhyay, A.; Dasgupta, A.K.; Chakrabarti, K. Improved production of reducing sugars from rice husk and rice straw using bacterial cellulase and xylanase activated with hydroxyapatite nanoparticles. Bioresour. Technol. 2014, 153, 269–277. [Google Scholar] [CrossRef] [PubMed]
- Chareonlimkun, A.; Champreda, V.; Shotipruk, A.; Laosiripojana, N. Catalytic conversion of sugarcane bagasse, rice husk and corncob in the presence of TiO2, ZrO2 and mixed-oxide TiO2-ZrO2 under hot compressed water (HCW) condition. Bioresour. Technol. 2010, 101, 4179–4186. [Google Scholar] [CrossRef] [PubMed]
- Savita, R.; Kamath, A.P. Silica Gel from Rice Hull Ash: Preparation and Characterization. Cereal Chem. 1998, 75, 484–487. [Google Scholar]
- Oksman, K.; Skrifvars, M.; Selin, J.F. Natural fibres as reinforcement in polylactic acid (PLA) composites. Compos. Sci. Technol. 2003, 63, 1317–1324. [Google Scholar] [CrossRef]
- Dimzoski, B.; Gordana, B.-G.; Gentile, G.; Avella, M.; Errico, M.E.; Srebrenkoska, V. Preparation and characterization of poly(lactic acid)/rice hulls based biodegradable composite. J. Polym. Eng. 2008, 28, 369–383. [Google Scholar]
- Della, V.P.; Kühn, I.; Hotza, D. Rice husk ash as an alternate source for active silica production. Mater. Lett. 2002, 57, 818–821. [Google Scholar] [CrossRef]
- CHAKRAVERTY, A.; Mishra, P.; Banerjee, H.D. Investigation of combustion of raw and acid-leached rice husk for production of pure amorphous white silica. J. Mater. Sci. 1988, 23, 21–24. [Google Scholar] [CrossRef]
- Lee, J.H.; Kwon, J.H.; Lee, J.-W.; Lee, H.-S.; Chang, J.H.; Sang, B.-I. Preparation of high purity silica originated from rice husks by chemically removing metallic impurities. J. Ind. Eng. Chem. 2017, 50, 79–85. [Google Scholar] [CrossRef]
- Muniandy, L.; Adam, F.; Mohamed, A.R.; Ng, E.-P. The synthesis and characterization of high purity mixed microporous/mesoporous activated carbon from rice husk using chemical activation with NaOH and KOH. Microporous Mesoporous Mater. 2014, 197, 316–323. [Google Scholar] [CrossRef]
- Mejía, J.M.; Gutiérrez, R.M.; Montes, C. Rice husk ash and spent diatomaceous earth as a source of silica to fabricate a geopolymeric binary binder. J. Clean. Prod. 2016, 118, 133–139. [Google Scholar] [CrossRef]
- Samuel Owoeye, S. Effects of Extraction Temperature and Time on the Physical Properties of Soluble Sodium Silicate from Rice Husk Ash. Sci. J. Chem. 2017, 5, 8–11. [Google Scholar] [CrossRef]
- Bathla, A.; Narula, C.; Chauhan, R.P. Hydrothermal synthesis and characterization of silica nanowires using rice husk ash: an agricultural waste. J. Mater. Sci. Mater. Electron. 2018, 29, 6225–6231. [Google Scholar] [CrossRef]
- Klaassien, J.G.; Annechien, H.; Martin, H.A.; Wim, K.; Anton, J.M.; Anton, S.U. Upgrading of organic waste: production of the copolymer poly-3-hydroxybutyrate-co-valerate by Ralstonia eutrophus with organic waste as sole carbon source. J. Clean. Prod. 1999, 413–419. [Google Scholar]
- Wu, L.; Wang, L.; Weng, Y. Research Progress on Blending Modification of PHBV. Plast. Sci. Technol. 2012, 40, 96–102. [Google Scholar]
- Avella, M.; Rota, G.L.; Martuscelli, E.; Raimo, M. Poly(3-hydroxybutyrate-co-3-hydroxyvalerate) and wheat straw fibre composites: thermal, mechanical properties and biodegradation behaviour. J. Mater. Sci. 2000, 35, 825–836. [Google Scholar]
- Lai, M.; Li, J.; Yang, J.; Liu, J.; Tong, X.; Cheng, H. The morphology and thermal properties of multi-walled carbon nanotube and poly(hydroxybutyrate-co-hydroxyvalerate) composite. Polym. Int. 2004, 53, 1479–1484. [Google Scholar] [CrossRef]
- Li, H.; Chang, J. Fabrication and characterization of bioactive wollastonite/PHBV composite scaffolds. Biomaterials 2004, 25, 5473–5480. [Google Scholar] [CrossRef] [PubMed]
- Ambrosio-Martín, J.; Gorrasi, G.; Lopez-Rubio, A.; Fabra, M.J.; Mas, L.C.; López-Manchado, M.A.; Lagaron, J.M. On the use of ball milling to develop PHBV-graphene nanocomposites (I)-Morphology, thermal properties, and thermal stability. J. Appl. Polym. Sci. 2015, 132, 1097–4628. [Google Scholar] [CrossRef]
- Sheykh, M.J.; Tarmian, A.; Doosthoseini, K.; abdulkhani, A. Wear resistance and friction coefficient of nano-SiO2 and ash-filled HDPE/lignocellulosic fiber composites. Polym. Bull. 2017, 74, 4537–4547. [Google Scholar] [CrossRef]
- Fenglin, Y.; Vladimir, H. Improvement of PVC wearability by addition of additives. Powder Technol. 1999, 103, 182–188. [Google Scholar]
- Ahmed, A.; Moosa, B.F.S. Synthesis and Characterization of Nanosilica from Rice Husk with Applications to Polymer Composites. Am. J. Mater. Sci. 2017, 7, 223–231. [Google Scholar] [CrossRef]
- Salari, A.; Tabarsa, T.; Khazaeian, A.; Saraeian, A. Improving some of applied properties of oriented strand board (OSB) made from underutilized low quality paulownia (Paulownia fortunie) wood employing nano-SiO2. Ind. Crops Prod. 2013, 42, 1–9. [Google Scholar] [CrossRef]
- Guo, S.; Feng, B.; Zhang, J.; Liu, P.; Chen, Y.; Wei, S. Preparation and Modification of Nano-silica from Rice Husk as Biomass Silicon Source. Guangdong Chem. Ind. 2017, 44, 9–10. [Google Scholar]
- Antoniadis, G.; Paraskevopoulos, K.M.; Bikiaris, D.; Chrissafis, K. Non-isothermal crystallization kinetic of poly(ethylene terephthalate)/fumed silica (PET/SiO2) prepared by in situ polymerization. Thermochim. Acta 2010, 510, 103–112. [Google Scholar] [CrossRef]
- BARHAM, P.J.; Keller, A.; Otun, E.L.; Holmes, P.L. Crystallization and morphology of a bacterial thermoplastic: poly-3-hyd roxybutyrate. J. Mater. Sci. 1984, 19, 2781–2794. [Google Scholar] [CrossRef]
- Sankar, S.; Sharma, S.K.; Kaur, N.; Lee, B.; Kim, D.Y.; Lee, S.; Jung, H. Biogenerated silica nanoparticles synthesized from sticky, red, and brown rice husk ashes by a chemical method. Ceram. Int. 2016, 42, 4875–4885. [Google Scholar] [CrossRef]
- Wang, W.; Martin, J.C.; Fan, X.; Han, A.; Luo, Z.; Sun, L. Silica nanoparticles and frameworks from rice husk biomass. ACS Appl. Mater. Interfaces 2012, 4, 977–981. [Google Scholar] [CrossRef] [PubMed]
- Gu, S.; Zhou, J.; Luo, Z.; Wang, Q.; Ni, M. A detailed study of the effects of pyrolysis temperature and feedstock particle size on the preparation of nanosilica from rice husk. Ind. Crops Prod. 2013, 50, 540–549. [Google Scholar] [CrossRef]
- Hu, S.; Hsieh, Y.-L. Preparation of Activated Carbon and Silica Particles from Rice Straw. ACS Sustain. Chem. Eng. 2014, 2, 726–734. [Google Scholar] [CrossRef] [Green Version]
- Torki, A.M.; Stojanović, D.B.; Živković, I.D.; Marinković, A.; Škapin, S.D.; Uskoković, P.S.; Aleksić, R.R. The viscoelastic properties of modified thermoplastic impregnated multiaxial aramid fabrics. Polym. Compos. 2012, 33, 158–168. [Google Scholar] [CrossRef]
- Midhun, D.C.; Begum, P.M.S.; Joseph, R.; Joseph, D.; Kumar, P.; Ayswarya, E.P. Characterization and appilcation of rice husk nanosilica in natural rubber. Int. J. Sci. Environ. Technol. 2013, 2, 5. [Google Scholar]
- Müller, C.M.; Molinelli, A.; Karlowatz, M.; Aleksandrov, A.; Orlando, T.; Mizaikoff, B. Infrared Attenuated Total Reflection Spectroscopy of Quartz and Silica Micro- and Nanoparticulate Films. J. Phys. Chem. C 2011, 116, 37–43. [Google Scholar] [CrossRef]
- Bakar, R.A.; Yahya, R.; Gan, S.N. Production of High Purity Amorphous Silica from Rice Husk. Procedia Chem. 2016, 19, 189–195. [Google Scholar] [CrossRef]
- Chen, H.; Sun, Z.; Shao, T. Investigation on FT-IR Spectroscopy for Eight Different Sources of SiO2. Bull. Chin. Ceram. Soc. 2011, 30, 934–937. [Google Scholar]
- Nagendra, B.; Mohan, K.; Gowd, E.B. Polypropylene/Layered Double Hydroxide (LDH) Nanocomposites: Influence of LDH Particle Size on the Crystallization Behavior of Polypropylene. ACS Appl. Mater. Interfaces 2015, 7, 12399–12410. [Google Scholar] [CrossRef] [PubMed]
- Lu, T.; Jiang, M.; Xu, X.; Zhang, S.; Hui, D.; Gou, J.; Zhou, Z. The effects on mechanical properties and crystallization of poly (l-lactic acid) reinforced by cellulosic fibers with different scales. J. Appl. Polym. Sci. 2014, 131, 1097–4628. [Google Scholar] [CrossRef]
- Pan, M.; Mei, C. Effects of nano SiO2-ammonium polyphosphate on the interfacial and mechanical properties of wood fiber-polyethylene composites. J. Beijing For. Univ. 2013, 35, 117–122. [Google Scholar] [CrossRef]
- Liu, M.; Guo, B.; Du, M.; Jia, D. Drying induced aggregation of halloysite nanotubes in polyvinyl alcohol/halloysite nanotubes solution and its effect on properties of composite film. Appl. Phys. A 2007, 88, 391–395. [Google Scholar] [CrossRef]
- Khosravi, A.; Sadeghi, M.; Banadkohi, H.Z.; Talakesh, M.M. Polyurethane-Silica Nanocomposite Membranes for Separation of Propane/Methane and Ethane/Methane. Ind. Eng. Chem. Res. 2014, 53, 2011–2021. [Google Scholar] [CrossRef]
- Das, S.; Mohanty, S.; Nayak, S.K. Synthesis and Characterization of Green Polyurethane/Nanosilica Composite: Study of Thermomechanical, Surface Topography and Physicochemical Properties. Mater. Focus 2018, 7, 172–181. [Google Scholar] [CrossRef]
- Hu, Y.; Zhang, J.; Sato, H.; Noda, I.; Ozaki, Y. Multiple melting behavior of poly(3-hydroxybutyrate-co-3-hydroxyhexanoate) investigated by differential scanning calorimetry and infrared spectroscopy. Polymer 2007, 48, 4777–4785. [Google Scholar] [CrossRef]


| Sample | m0/g | m1/g | W/% |
|---|---|---|---|
| RHNS/PHBV-0 | 7.99 | 8.011 | 0.26 ± 0.02 |
| RHNS/PHBV-1.5 | 7.783 | 7.805 | 0.28 ± 0.01 |
| RHNS/PHBV-3 | 7.659 | 7.681 | 0.28 ± 0.01 |
| RHNS/PHBV-4.5 | 8.052 | 8.075 | 0.29 ± 0.01 |
| RHNS/PHBV-6 | 8.255 | 8.284 | 0.35 ± 0.04 |
| Sample | Tinitial/°C | Tmax/°C | RM at 700 °C/% |
|---|---|---|---|
| RHNS/PHBV-0 | 363 | 393.1 | 0 |
| RHNS/PHBV-1.5 | 365.3 | 396.7 | 2.07 |
| RHNS/PHBV-3 | 366.8 | 395.4 | 3.48 |
| RHNS/PHBV-4.5 | 367.8 | 396.2 | 3.79 |
| RHNS/PHBV-6 | 363.8 | 393 | 4.44 |
| Sample | Tc/°C | Tm1/°C | Tm2/°C | ∆Hf(J/g) | Xc/% |
|---|---|---|---|---|---|
| RHNS/PHBV-0 | 70 | 104.3 | 110.6 | 65.45 | 44.83 |
| RHNS/PHBV-1.5 | 72.6 | 104.4 | 110.6 | 79.42 | 55.23 |
| RHNS/PHBV-3 | 73.9 | 104.5 | 110.7 | 65.98 | 46.59 |
| RHNS/PHBV-4.5 | 73.8 | 104.5 | 110.3 | 60.47 | 43.37 |
| RHNS/PHBV-6 | 74.9 | 105 | 110.8 | 61.28 | 44.65 |
© 2018 by the authors. Licensee MDPI, Basel, Switzerland. This article is an open access article distributed under the terms and conditions of the Creative Commons Attribution (CC BY) license (http://creativecommons.org/licenses/by/4.0/).
Share and Cite
Wang, L.; Guo, Y.; Chen, Y.; Chen, T.; Zhu, S.; Zhang, T.; Liu, S. Enhanced Mechanical and Water Absorption Properties of Rice Husk-Derived Nano-SiO2 Reinforced PHBV Composites. Polymers 2018, 10, 1022. https://doi.org/10.3390/polym10091022
Wang L, Guo Y, Chen Y, Chen T, Zhu S, Zhang T, Liu S. Enhanced Mechanical and Water Absorption Properties of Rice Husk-Derived Nano-SiO2 Reinforced PHBV Composites. Polymers. 2018; 10(9):1022. https://doi.org/10.3390/polym10091022
Chicago/Turabian StyleWang, Li, Yong Guo, Yuxia Chen, Tong Chen, Shiliu Zhu, Tingting Zhang, and Shengquan Liu. 2018. "Enhanced Mechanical and Water Absorption Properties of Rice Husk-Derived Nano-SiO2 Reinforced PHBV Composites" Polymers 10, no. 9: 1022. https://doi.org/10.3390/polym10091022