Thermoplastic Dynamic Vulcanizates with In Situ Synthesized Segmented Polyurethane Matrix


Abstract
:1. Introduction
- the interfacial tension of the constituents is small,
- the crosslink density of the rubber phase is relatively high,
2. Materials and Methods
2.1. Materials and Processing
2.2. Testing Methods
3. Results
3.1. Synthesis of Thermoplastic Polyurethanes (TPUs)
3.2. Thermoplastic Dynamic Vulcanizates (TDVs)
3.2.1. Production of TDVs
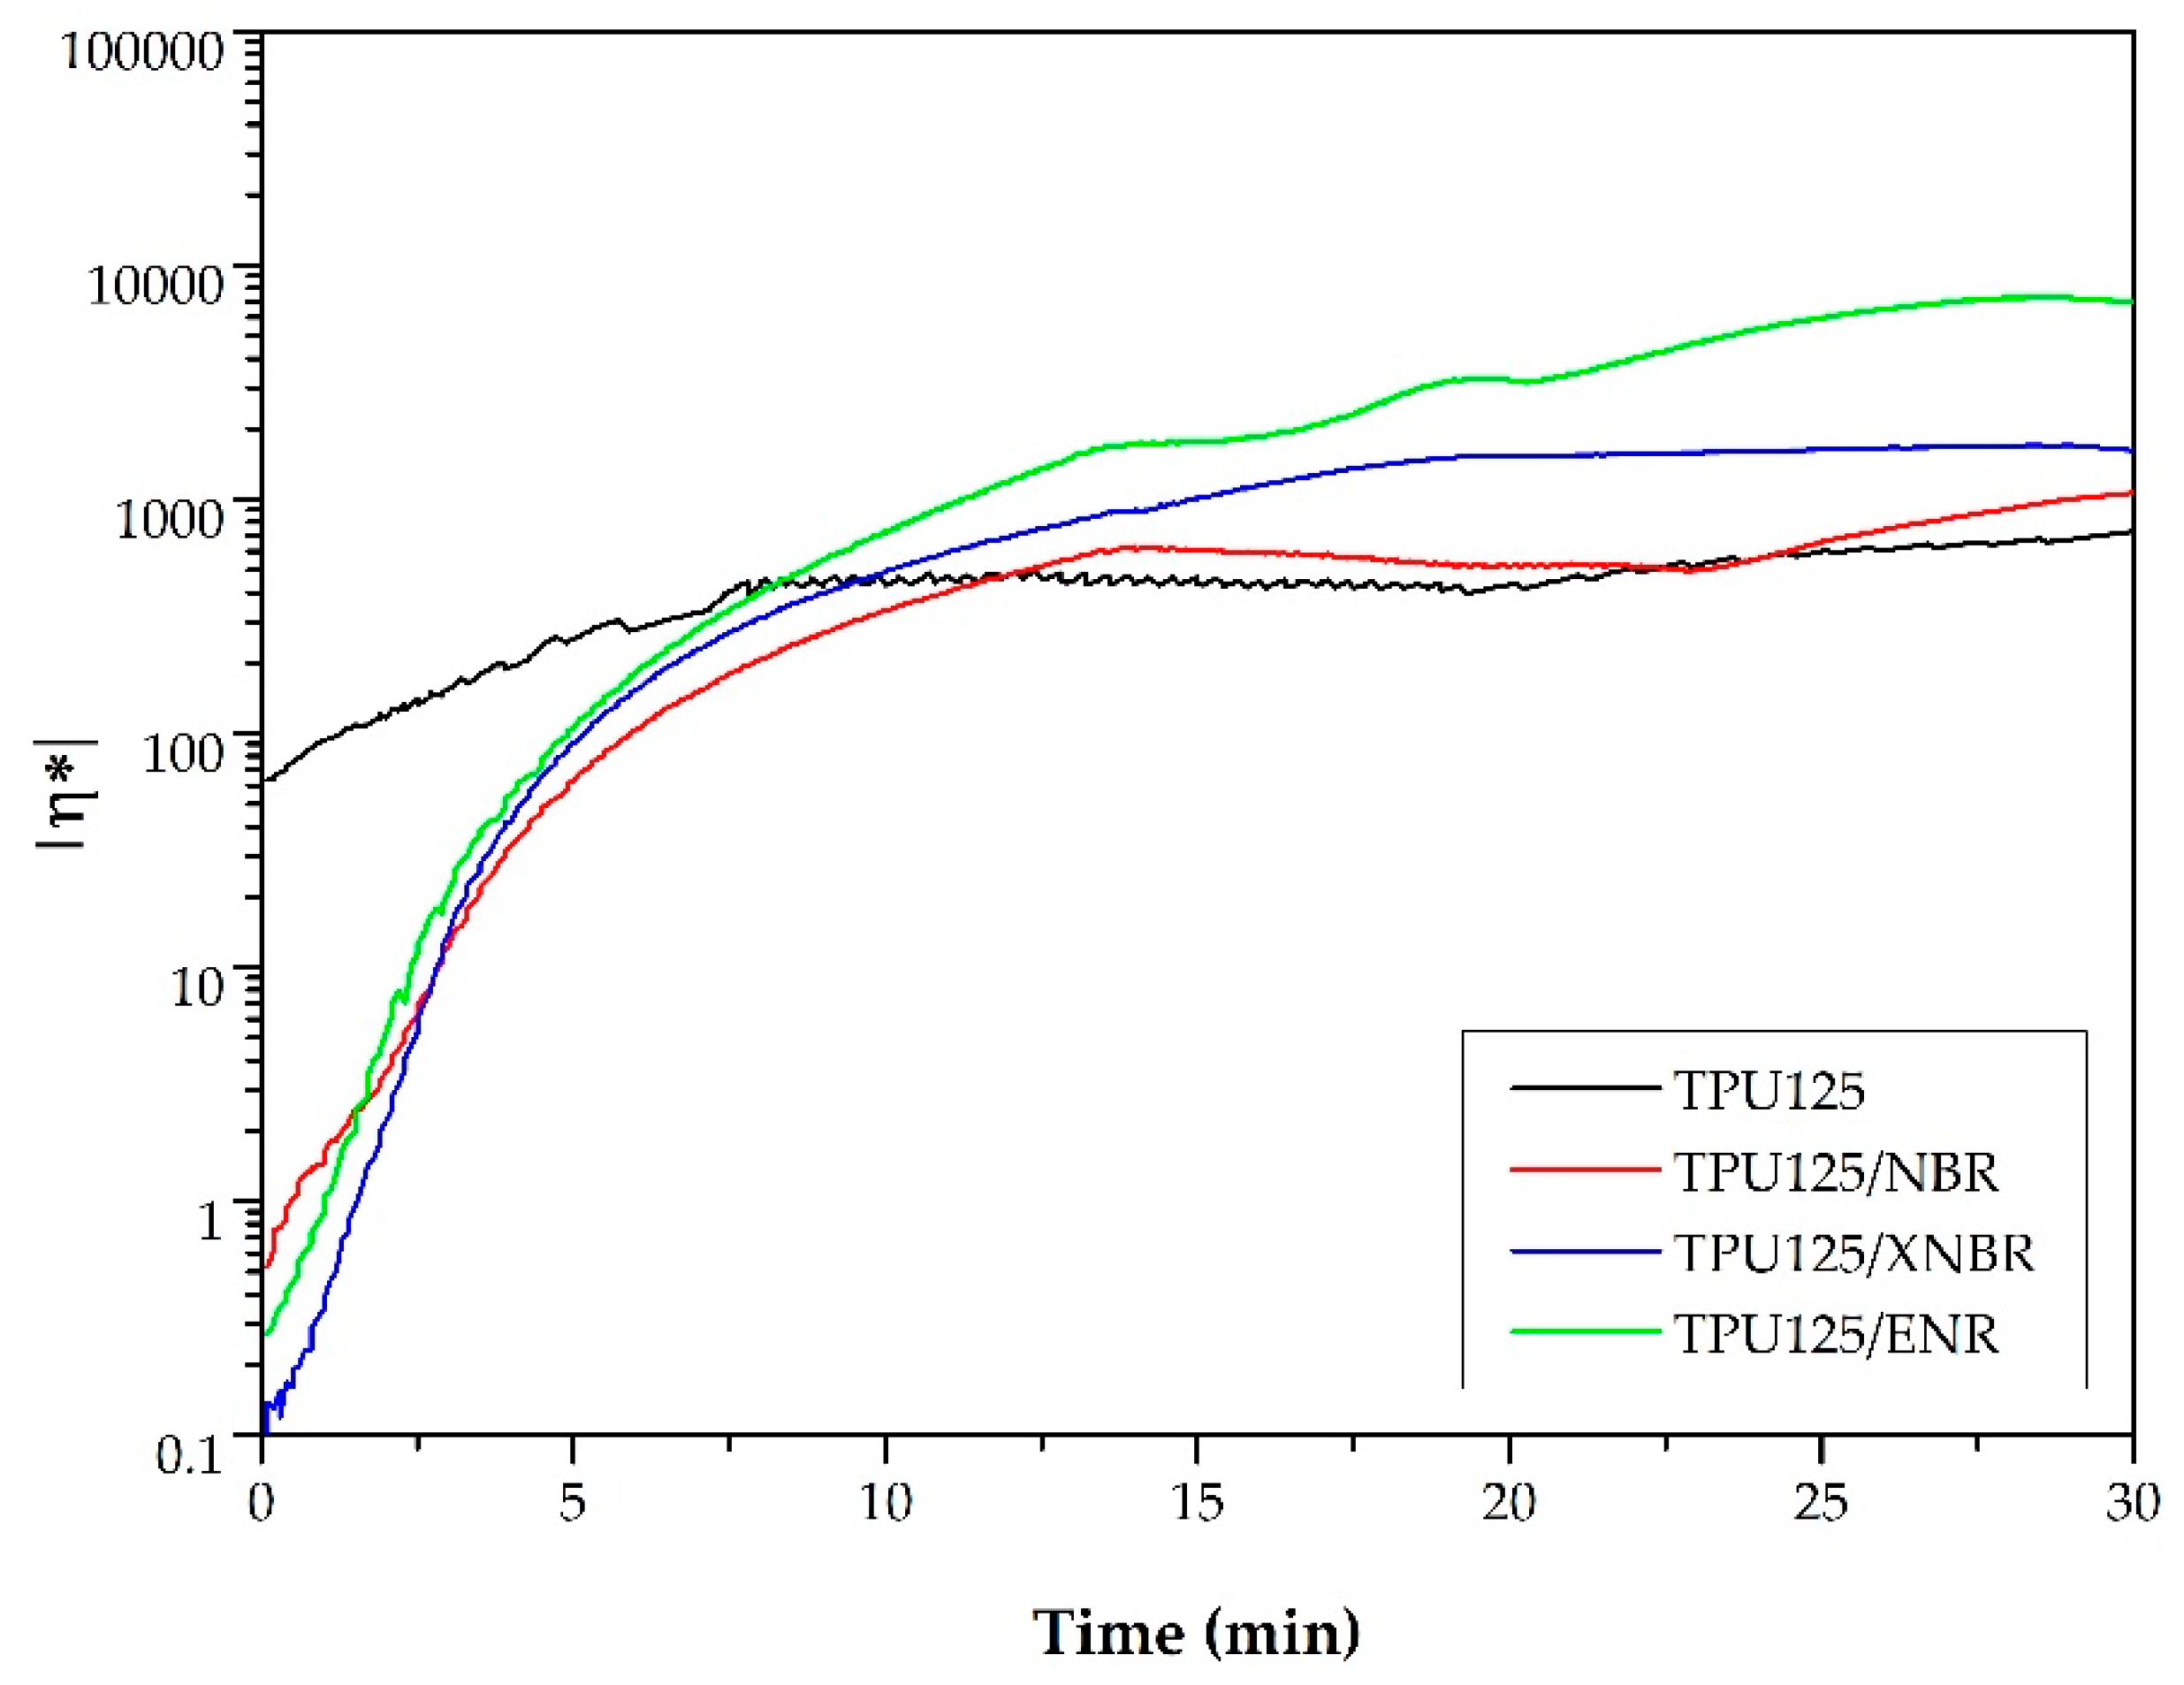
Isothermal Curing Properties
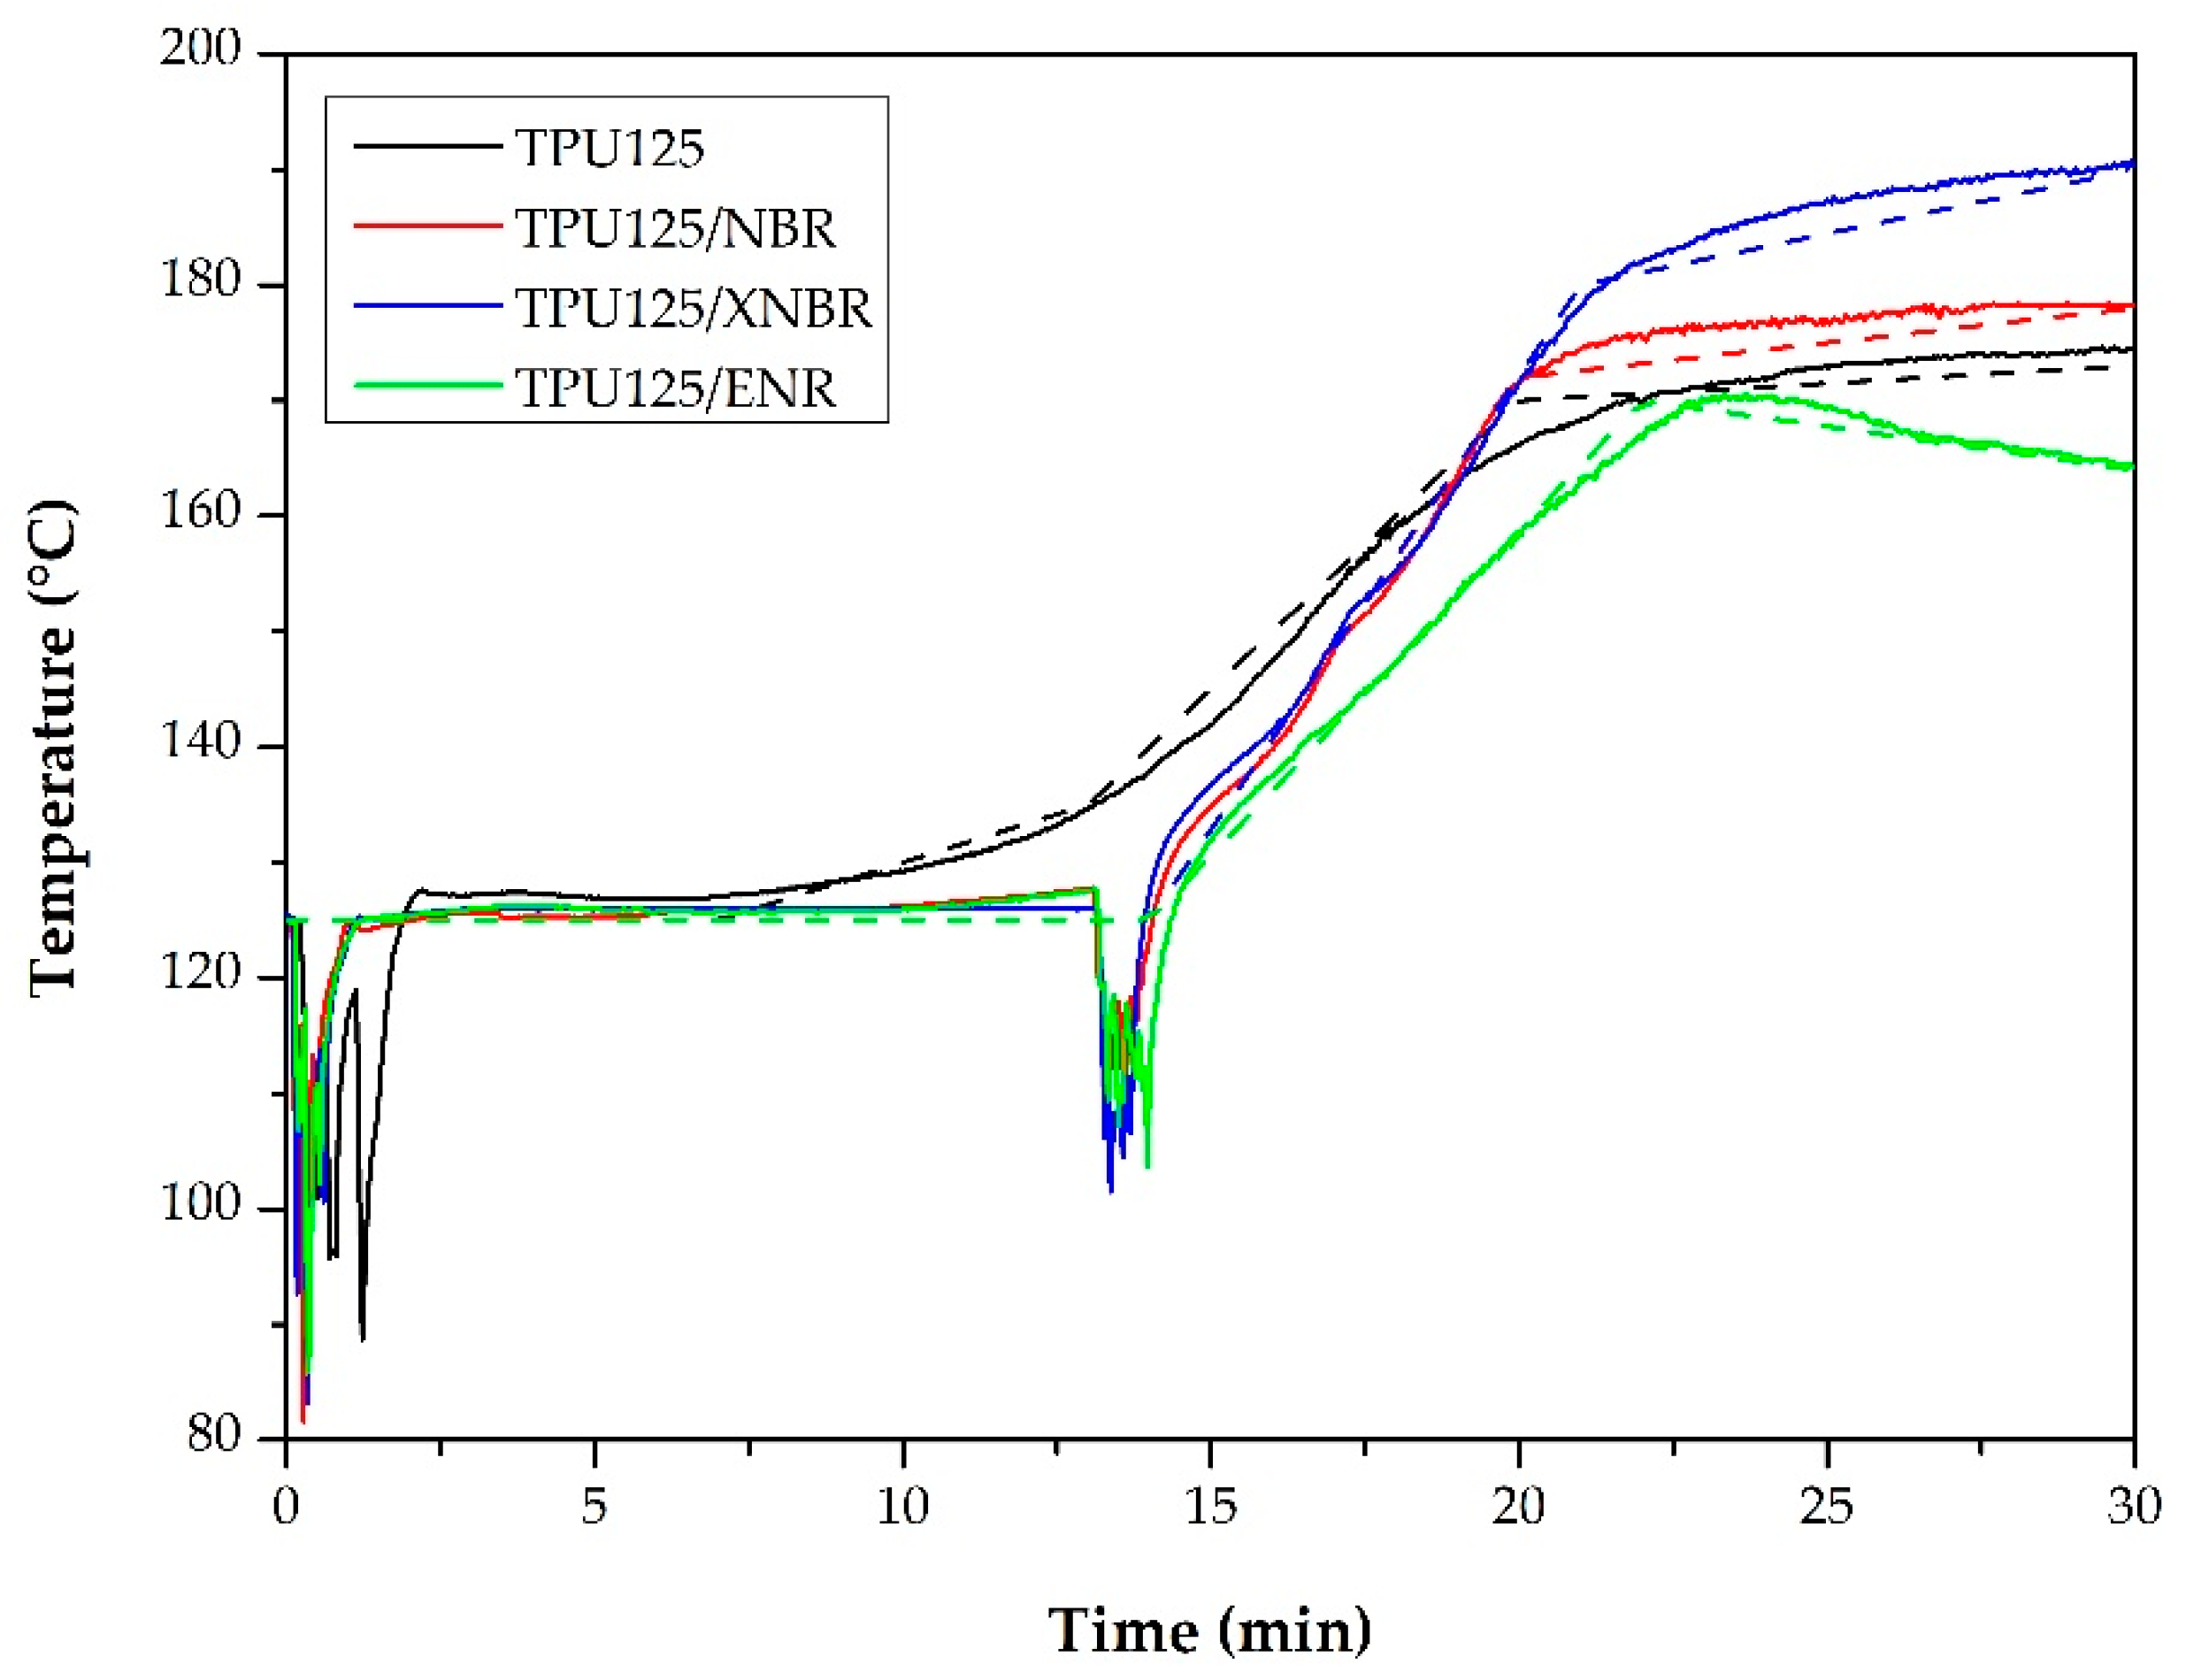
Torque and Temperature Curves
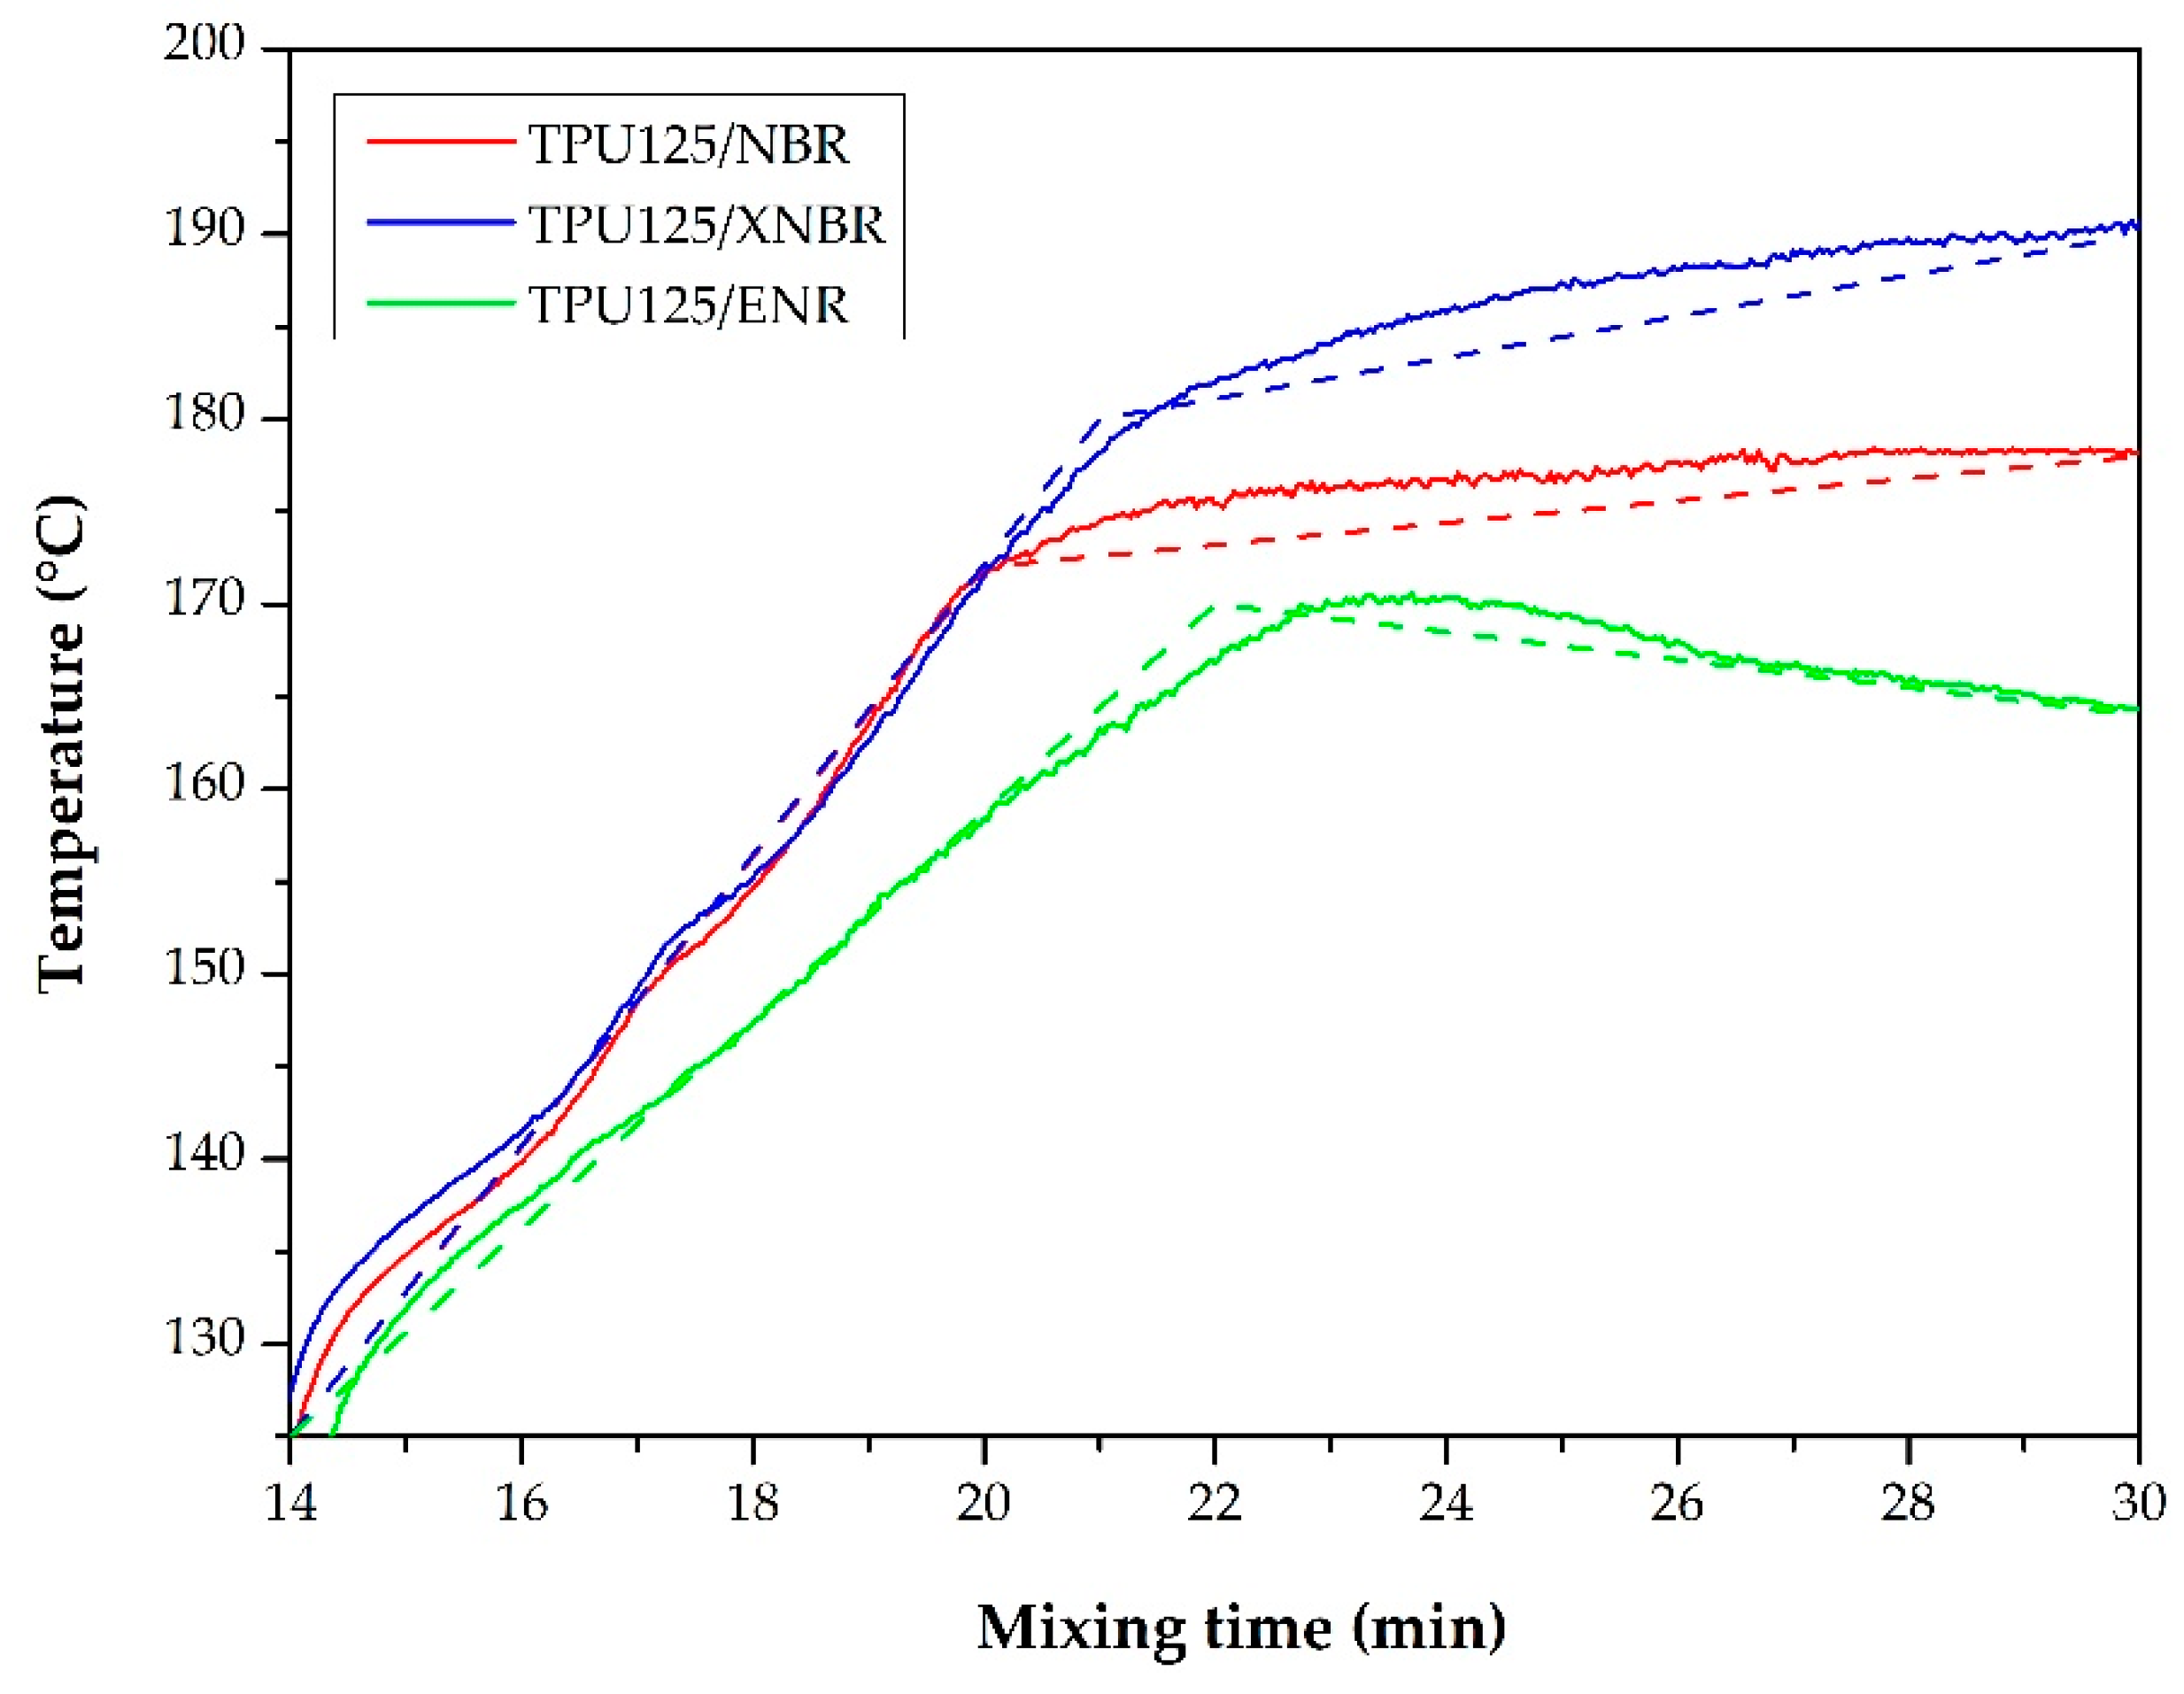
Non-Isothermal Curing Properties
The Investigation of Matrix Polymerization
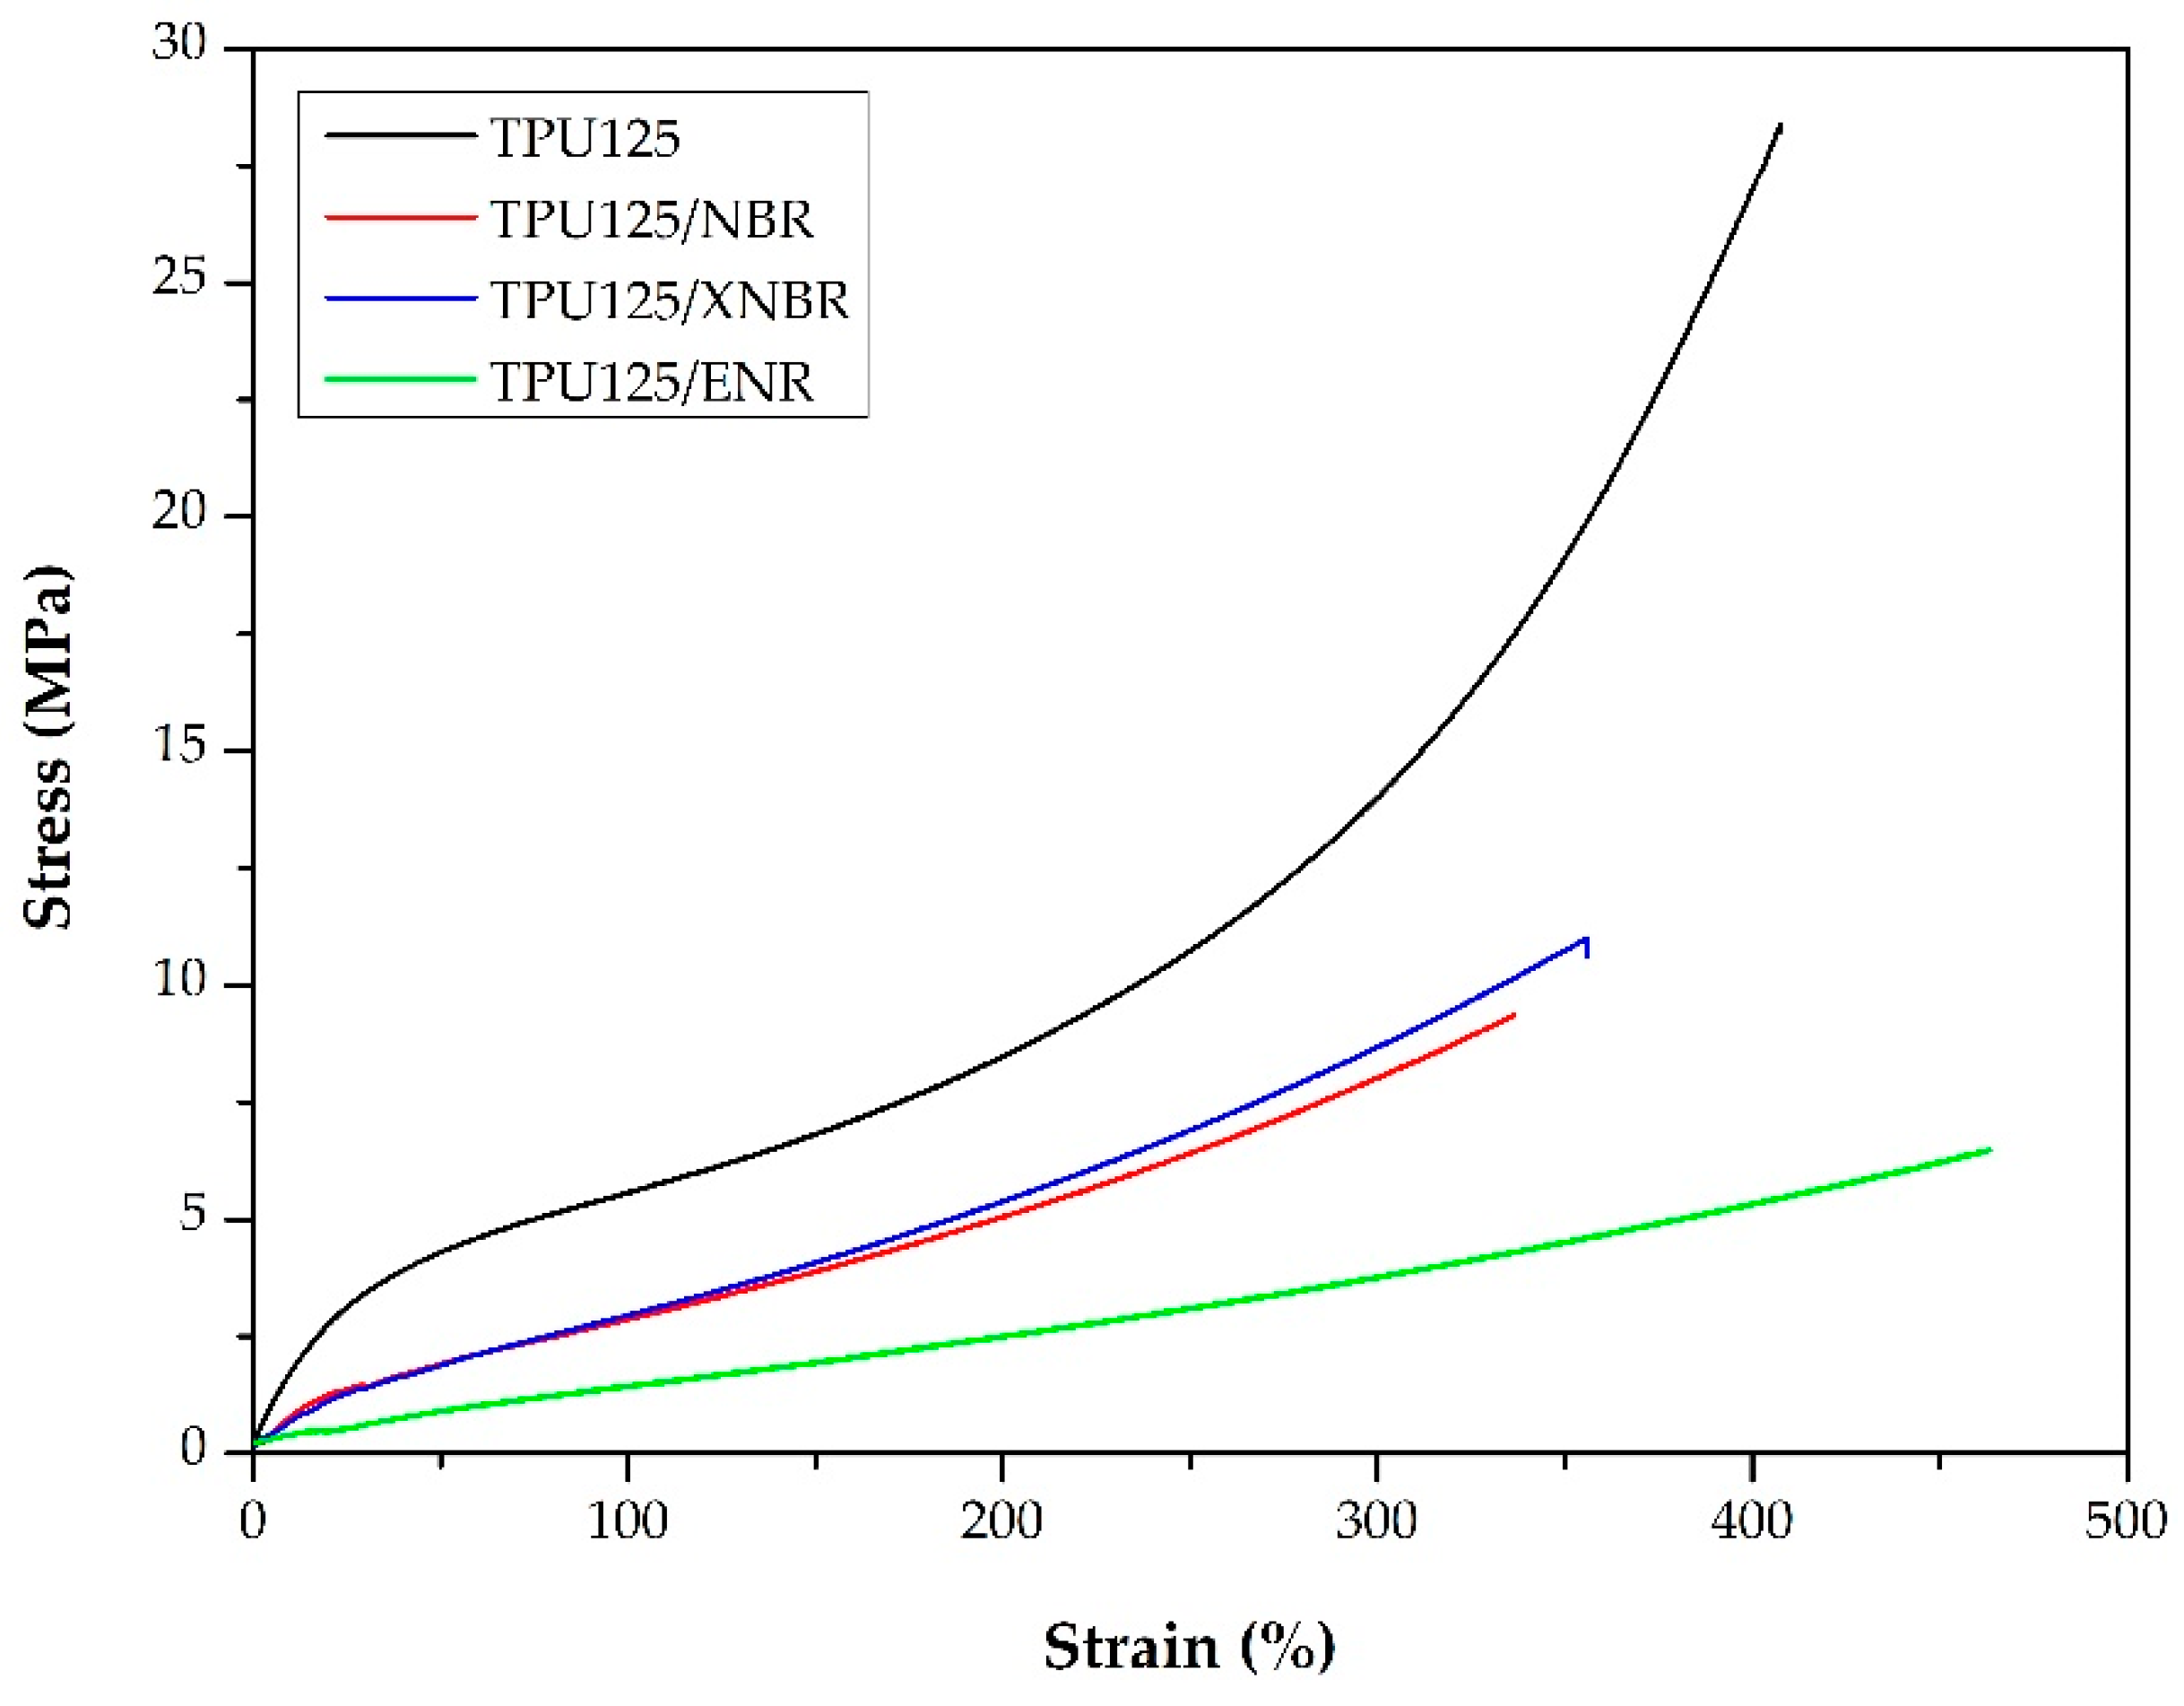
3.2.2. Mechanical Properties
3.2.3. Dynamical Mechanical Analysis
3.2.4. Differential Scanning Calorimetry
3.2.5. Fourier-Transform Infrared Spectroscopy
3.2.6. Morphology
Atomic Force Microscopy (AFM)
Scanning Electron Microscopy (SEM)
4. Conclusions
Author Contributions
Funding
Acknowledgments
Conflicts of Interest
References
- Karger-Kocsis, J. Thermoplastic dynamic vulcanizates. In Polypropylene: An A-Z Reference; Kluwer Publisher: Dordrecht, The Netherlands, 1999; Volume 2, pp. 853–858. [Google Scholar]
- Legge, N.R.; Schroder, E.H. Thermoplastic Elastomers; Hanser University Press: New York, NY, USA, 1987. [Google Scholar]
- Mülhaupt, R. Metallocene catalyst and tailor-made polyolefins. In Polypropylene: An A–Z Reference; Karger-Kocsis, J., Ed.; Kluwer Publisher: Dodrecht, The Netherlands, 1999; pp. 454–475. [Google Scholar]
- Karger-Kocsis, J. Thermoplastic rubbers via dynamic vulcanization. In Polymer Blends and Alloys; Shonaike, G.O., Simon, G.P., Eds.; Marcel Dekker: New York, NY, USA, 1999; pp. 125–153. [Google Scholar]
- Karger-Kocsis, J.; Kalló, A.; Kuleznev, V.N. Phase structure of impact-modified polypropylene blends. Polymer 1984, 25, 279–286. [Google Scholar] [CrossRef]
- Wu, S. A generalized criterion for rubber toughening: The critical matrix ligament thickness. J. Appl. Polym. Sci. 1988, 35, 549–561. [Google Scholar] [CrossRef]
- Dao, K.C. Mechanical properties of polypropylene/crosslinked rubber blends. J. Appl. Polym. Sci. 1982, 27, 4799–4806. [Google Scholar] [CrossRef]
- Coran, A.Y.; Patel, R. Rubber-thermoplastic compositions. Part IV. Thermoplastic vulcanizates from various rubber-plastic combinations. Rubber. Chem. Technol. 1981, 54, 892–903. [Google Scholar] [CrossRef]
- Coran, A.Y.; Patel, R.; Williams, D. Rubber-Thermoplastic Compositions. Part V. Selecting Polymers for Thermoplastic Vulcanizates. Rubber. Chem. Technol. 1982, 55, 116–136. [Google Scholar] [CrossRef]
- Akiba, M.; Hashim, A.S. Vulcanization and crosslinking in elastomers. Prog. Polym. Sci. 1997, 22, 475–521. [Google Scholar] [CrossRef]
- Tahir, M.; Stöckelhuber, K.W.; Mahmood, N.; Komber, H.; Heinrich, G. Reactive blending of nitrile butadiene rubber and in situ synthesized thermoplastic polyurethane-urea: Novel preparation method and characterization. Macromol. Mater. Eng. 2015, 300, 242–250. [Google Scholar] [CrossRef]
- Tahir, M.; Stöckelhuber, K.W.; Mahmood, N.; Komber, H.; Formanek, P.; Wiessner, S.; Heinrich, G. Highly reinforced blends of nitrile butadiene rubber and in-situ synthesized polyurethane–urea. Europ. Polym. J. 2015, 73, 75–87. [Google Scholar] [CrossRef]
- Berezkin, Y.; Urick, M. Modern Polyurethanes: Overview of Structure Property Relationship. In Polymers for Personal Care and Cosmetics; American Chemical Society: Washington, WA, USA, 2013; Volume 1148, pp. 65–81. [Google Scholar]
- Oertal, G. Polyurethane Handbook; Hanser University Press: New York, NY, USA, 1994. [Google Scholar]
- Petrovic, Z.S. Polyurethanes. In Handbook of Polymer Synthesis, 2nd ed.; Kircheldorf, H.R.N.O., Swift, G., Eds.; Marcel Dekker: New York, NY, USA, 1994; pp. 503–539. [Google Scholar]
- Woods, G.; Pattison, J.B. The ICI Polyurethanes Book, 2nd ed.; John Wiley & Sons: Hoboken, NJ, USA, 1990. [Google Scholar]
- Szycher, M. Handbook of Polyurethanes; CRC Press: New York, NY, USA, 2013. [Google Scholar]
- Prisacariu, C. Polyurethane Elastomers: From Morphology to Mechanical Aspects; Springer: New York, NY, USA, 2011. [Google Scholar]
- Dimitrievski, I.S.; Marinovic, T. Effect of PU-NBR interactions on blends’ dynamic properties. In Proceedings of the 5th European Rheology Conference, Portoroz, Slovenia, 8–11 April 2019; pp. 73–74. [Google Scholar]
- Desai, S.; Thakore, I.M.; Brennan, A.; Devi, S. Polyurethane-Nitrile Rubber Blends. J. Macromol. Sci. A 2001, 38, 711–729. [Google Scholar] [CrossRef]
- Im, H.G.; Ka, K.R.; Kim, C.K. Characteristics of polyurethane elastomer blends with poly(acrylonitrile-co-butadiene) rubber as an encapsulant for underwater sonar devices. Ind. Eng. Chem. Res. 2010, 49, 7336–7342. [Google Scholar] [CrossRef]
- Demma, G.; Martuscelli, E.; Zanetti, A.; Zorzetto, M. Morphology and properties of polyurethane-based blends. J. Mater. Sci. 1983, 18, 89–102. [Google Scholar] [CrossRef]
- Pukánszky, B.; Bagdi, K.; Tóvölgyi, Z.; Varga, J.; Botz, L.; Hudak, S.; Dóczi, T.; Pukánszky, B. Nanophase separation in segmented polyurethane elastomers: Effect of specific interactions on structure and properties. Europ. Polym. J. 2008, 44, 2431–2438. [Google Scholar] [CrossRef]
- Ning, N.; Qin, H.; Wang, M.; Sun, H.; Tian, M.; Zhang, L. Improved dielectric and actuated performance of thermoplastic polyurethane by blending with XNBR as macromolecular dielectrics. Polymer 2019, 179, 121646. [Google Scholar] [CrossRef]
- Guénaëlle, A.L.V.; Noël, P.G.R.; Marc, O.D.M. Easy Identification of Plastics and Rubbers; Rapra Technology Limited: Shawbury, UK, 2001. [Google Scholar]
- Kalkornsurapranee, E.; Vennemann, N.; Kummerlöwe, C.; Nakason, C. Novel thermoplastic natural rubber based on thermoplastic polyurethane blends: Influence of modified natural rubbers on properties of the blends. Iran. Polym. J. 2012, 21, 689–700. [Google Scholar] [CrossRef]
- Hossieny, N.; Shaayegan, V.; Ameli, A.; Saniei, M.; Park, C.B. Characterization of hard-segment crystalline phase of thermoplastic polyurethane in the presence of butane and glycerol monosterate and its impact on mechanical property and microcellular morphology. Polymer 2017, 112, 208–218. [Google Scholar] [CrossRef]
- Eceiza, A.; Larrañaga, M.; de la Caba, K.; Kortaberria, G.; Marieta, C.; Corcuera, M.A.; Mondragon, I. Structure–property relationships of thermoplastic polyurethane elastomers based on polycarbonate diols. J. Appl. Polym. Sci. 2008, 108, 3092–3103. [Google Scholar] [CrossRef]
- Wu, H.; Tian, M.; Zhang, L.; Tian, H.; Wu, Y.; Ning, N.; Chan, T.W. New understanding of morphology evolution of thermoplastic vulcanizate (TPV) during dynamic vulcanization. ACS Sustainable Chem. Eng. 2014, 3, 26–32. [Google Scholar] [CrossRef]


| TPU125 | TPU125/NBR | TPU125/XNBR | TPU125/ENR | |
|---|---|---|---|---|
| Elongation at break (%) | 377 ± 52 | 316 ± 35 | 328 ± 38 | 447 ± 21 |
| Modulus at 10% (MPa) | 1.73 ± 0.05 | 0.84 ± 0.05 | 0.77 ± 0.08 | 0.45 ± 0.08 |
| 50% (MPa) | 4.35 ± 0.06 | 1.98 ± 0.06 | 2.23 ± 0.22 | 1.04 ± 0.10 |
| 100% (MPa) | 5.64 ± 0.05 | 2.92 ± 0.14 | 3.18 ± 0.23 | 1.60 ± 0.15 |
| 200% (MPa) | 8.63 ± 0.09 | 5.04 ± 0.17 | 5.79 ± 0.38 | 2.74 ± 0.26 |
| 300% (MPa) | 14.24 ± 0.17 | 7.92 ± 0.16 | 9.06 ± 0.48 | 4.09 ± 0.39 |
| Tensile strength (MPa) | 24.4 ± 7.8 | 8.9 ± 0.9 | 10.8 ± 1.7 | 6.6 ± 0.9 |
| Hardness (Shore A°) | 81.3 ± 0.9 | 66.4 ± 0.5 | 64.5 ± 0.7 | 55.9 ± 0.9 |
| Sample | Tg (°C) | E′23°C (MPa) |
|---|---|---|
| TPU125 | −15.82 | 21.82 |
| TPU125/NBR | −11.36 | 11.51 |
| TPU125/XNBR | −12.05 | 8.98 |
| TPU125/ENR | −10.23 | 6.70 |
| Sample | Tg, soft (°C) | Tg, rubber (°C) | Tg, hard (°C) | Tm (°C) |
|---|---|---|---|---|
| TPU125 | −42.1 | — | 56.5 | 211.3 |
| NBR | — | −23.0 | — | — |
| XNBR | — | −22.7 | — | — |
| ENR | — | −24.6 | — | — |
| TPU125/NBR | −43.1 | −21.5 | 53.7 | not visible |
| TPU125/XNBR | −43.0 | −20.2 | 57.6 | not visible |
| TPU125/ENR | −45.5 | −22.3 | 49.9 | 207.0 |
© 2019 by the authors. Licensee MDPI, Basel, Switzerland. This article is an open access article distributed under the terms and conditions of the Creative Commons Attribution (CC BY) license (http://creativecommons.org/licenses/by/4.0/).
Share and Cite
Kohári, A.; Halász, I.Z.; Bárány, T. Thermoplastic Dynamic Vulcanizates with In Situ Synthesized Segmented Polyurethane Matrix. Polymers 2019, 11, 1663. https://doi.org/10.3390/polym11101663
Kohári A, Halász IZ, Bárány T. Thermoplastic Dynamic Vulcanizates with In Situ Synthesized Segmented Polyurethane Matrix. Polymers. 2019; 11(10):1663. https://doi.org/10.3390/polym11101663
Chicago/Turabian StyleKohári, Andrea, István Zoltán Halász, and Tamás Bárány. 2019. "Thermoplastic Dynamic Vulcanizates with In Situ Synthesized Segmented Polyurethane Matrix" Polymers 11, no. 10: 1663. https://doi.org/10.3390/polym11101663
APA StyleKohári, A., Halász, I. Z., & Bárány, T. (2019). Thermoplastic Dynamic Vulcanizates with In Situ Synthesized Segmented Polyurethane Matrix. Polymers, 11(10), 1663. https://doi.org/10.3390/polym11101663