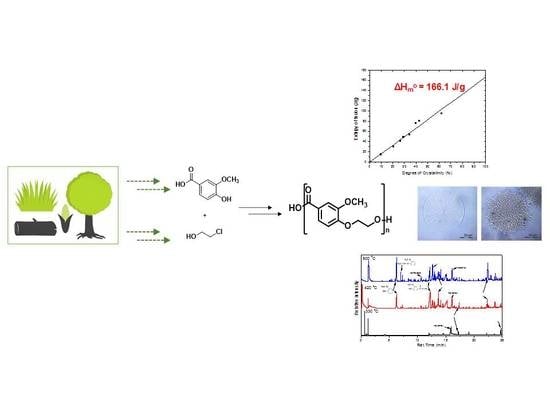
Synthesis, Thermal Properties and Decomposition Mechanism of Poly(Ethylene Vanillate) Polyester


 ,
,  ,
,  , , and
Abstract
:
1. Introduction
2. Materials and Methods
2.1. Materials
2.2. Synthesis of 4-(2-Hydroxyethoxy)-3-Methoxybenzoic Acid
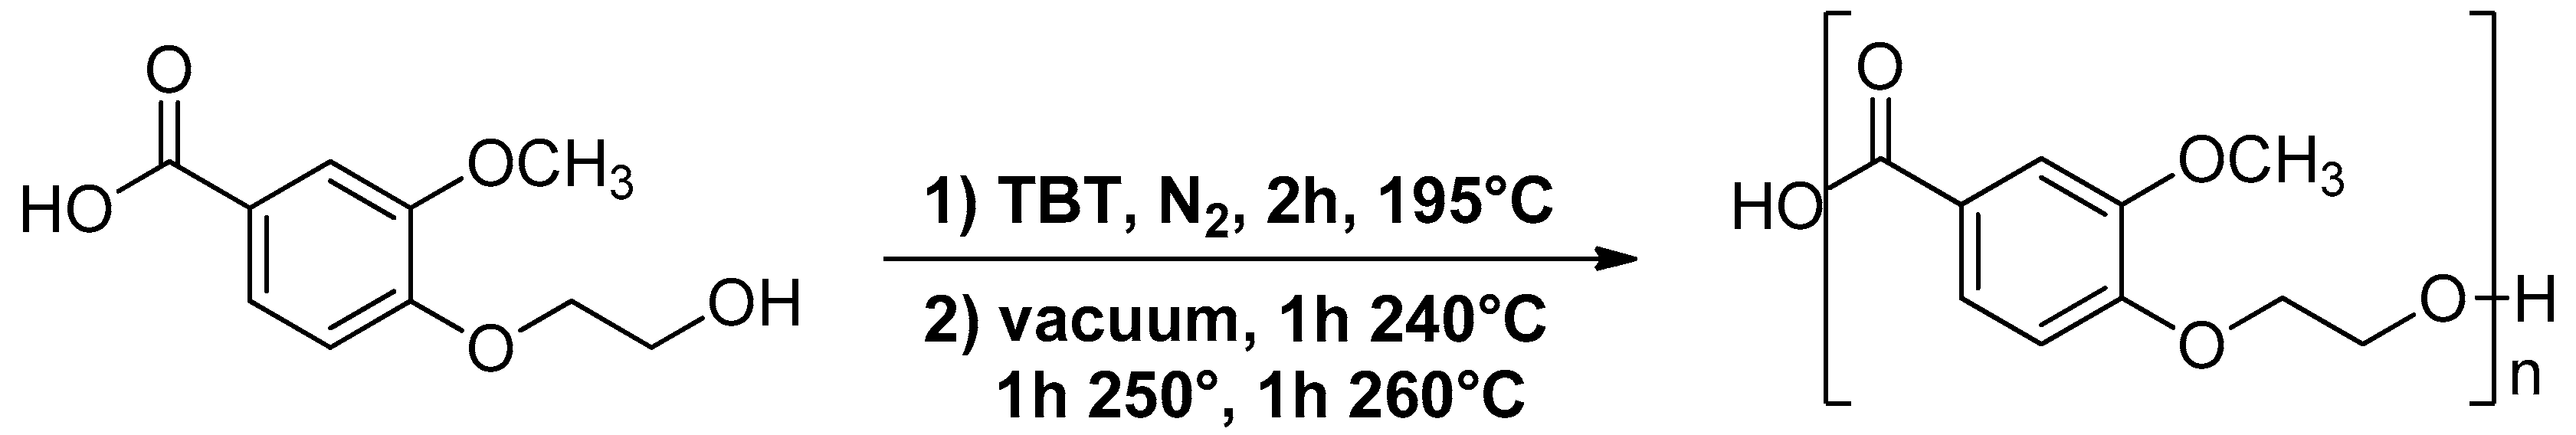
2.3. Synthesis of Poly(Ethylene Vanillate) (PEV)
2.4. Polyester Characterization
2.4.1. Intrinsic Viscosity Measurement
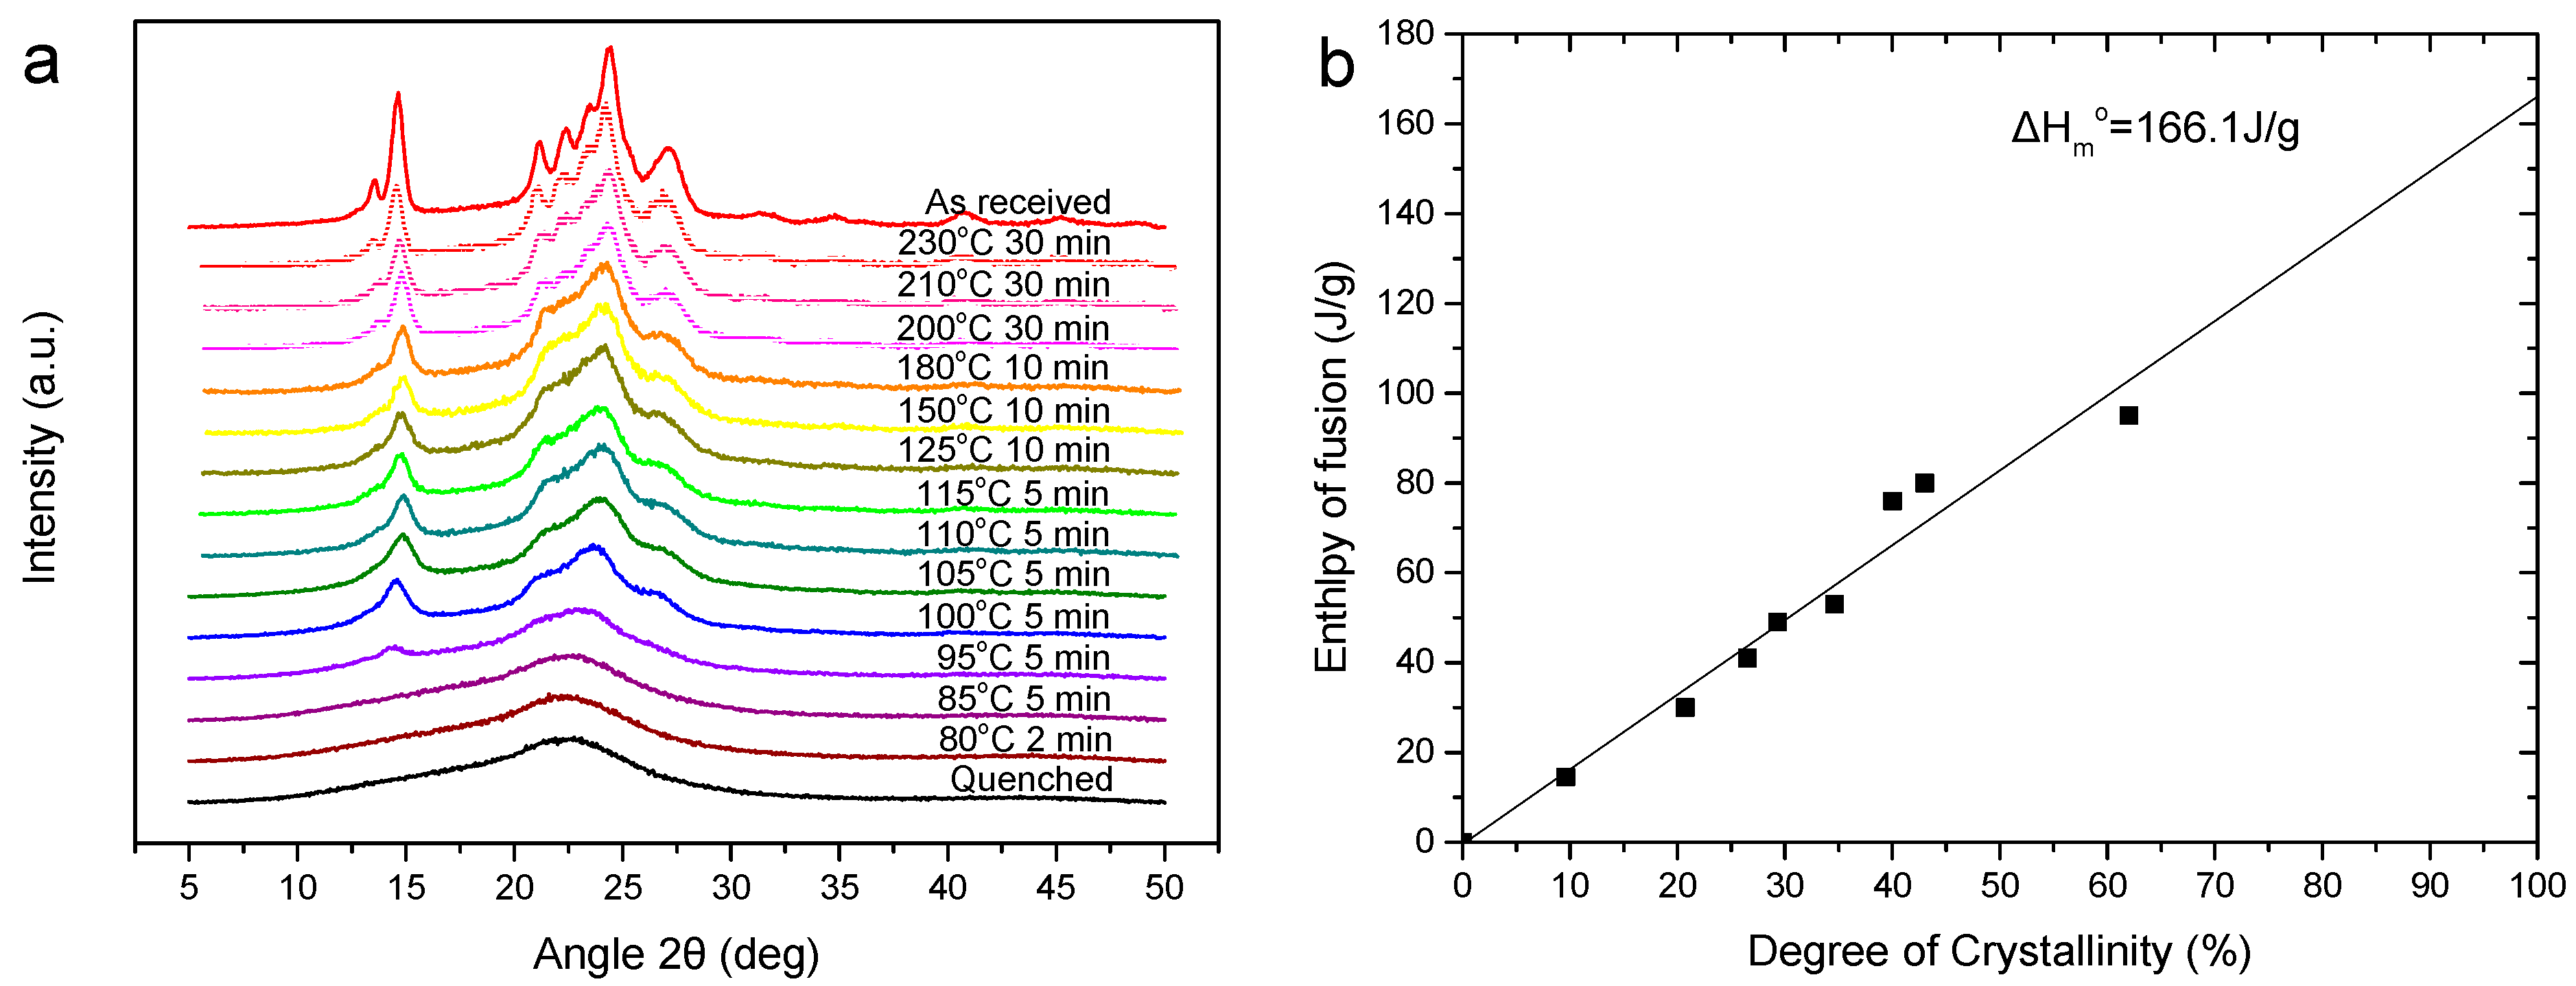
2.4.2. Wide Angle X-ray Diffraction Patterns (WAXD)
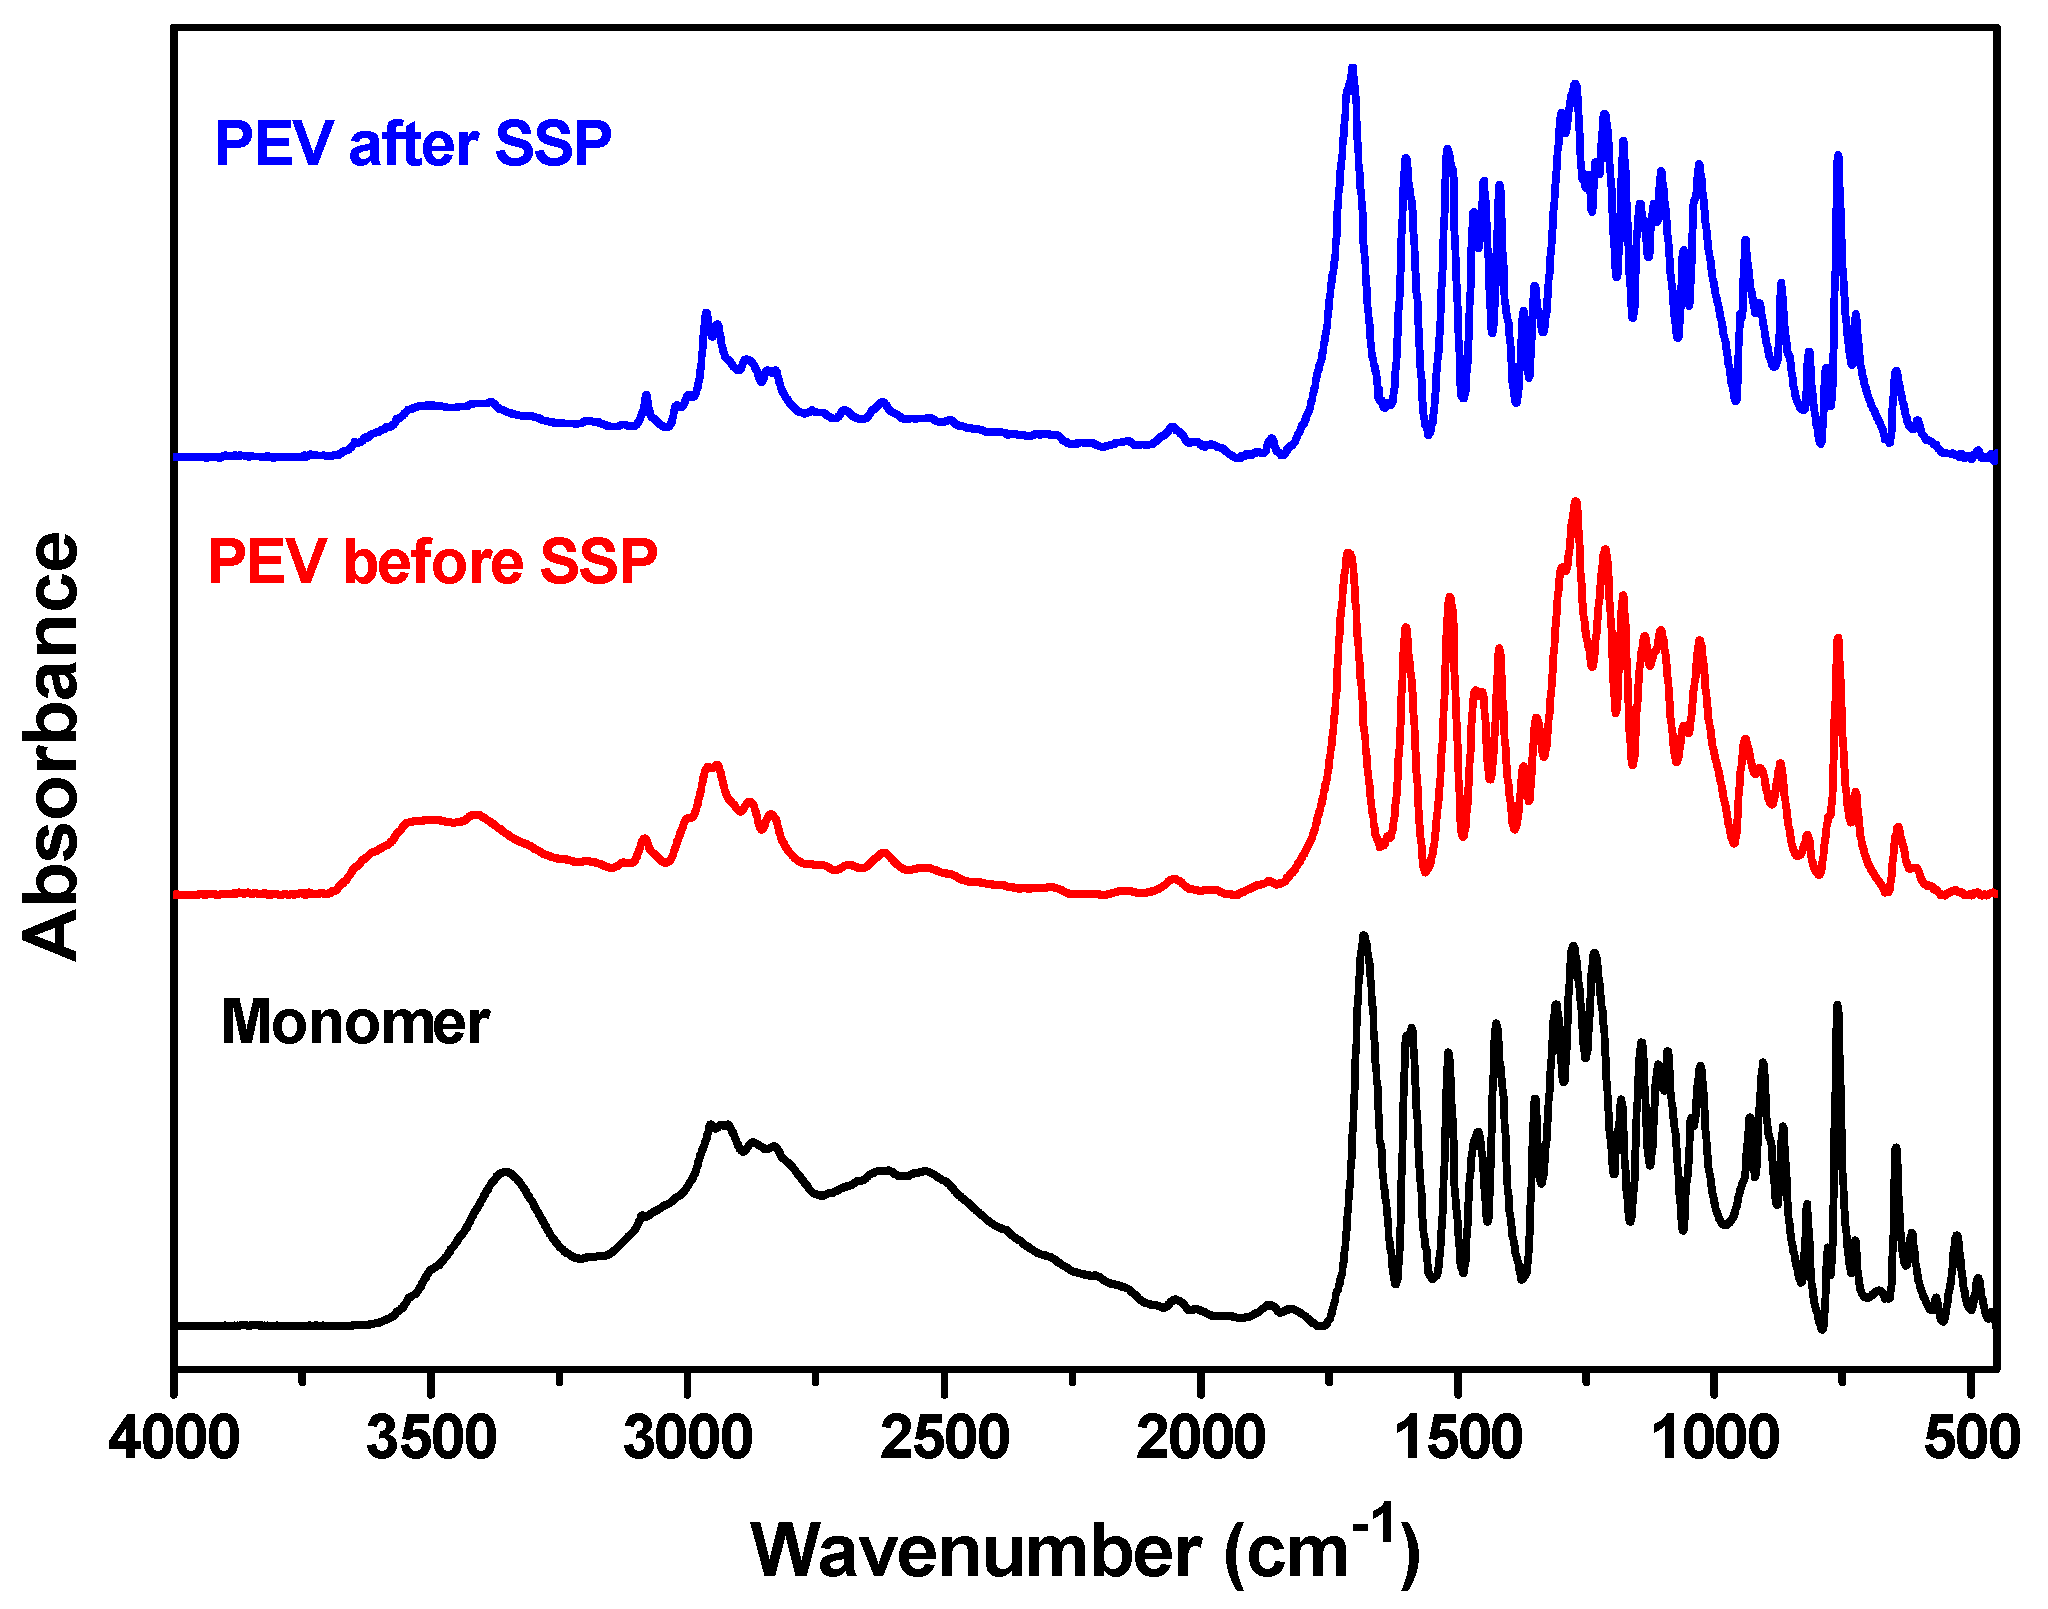
2.4.3. Fourier Transformed-Infrared Spectroscopy (FTIR)
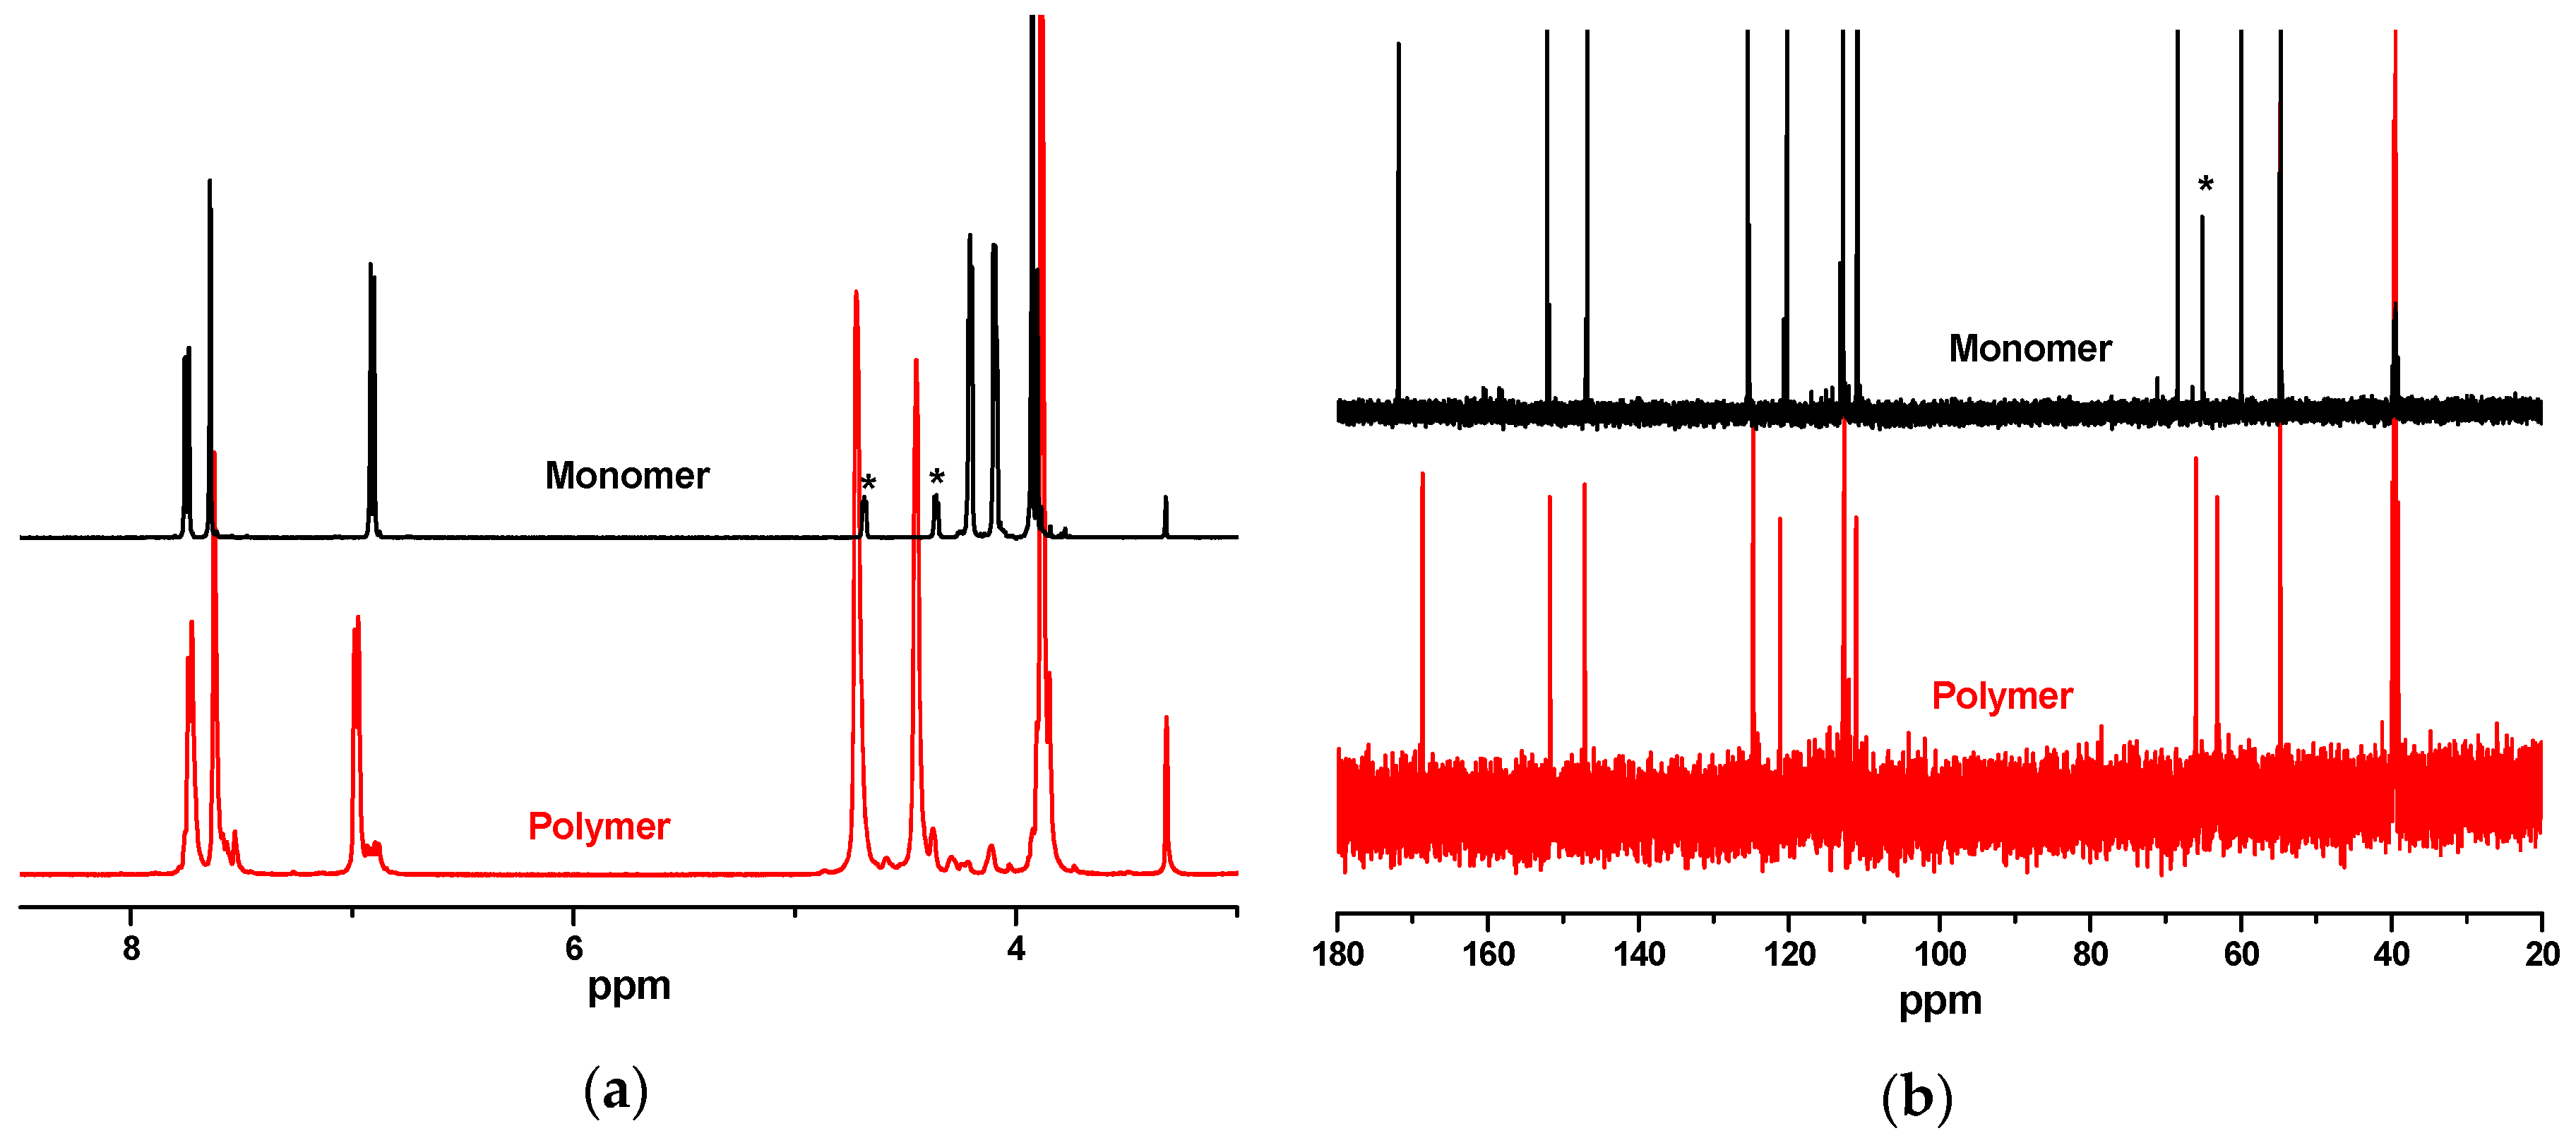
2.4.4. Nuclear Magnetic Resonance (NMR)
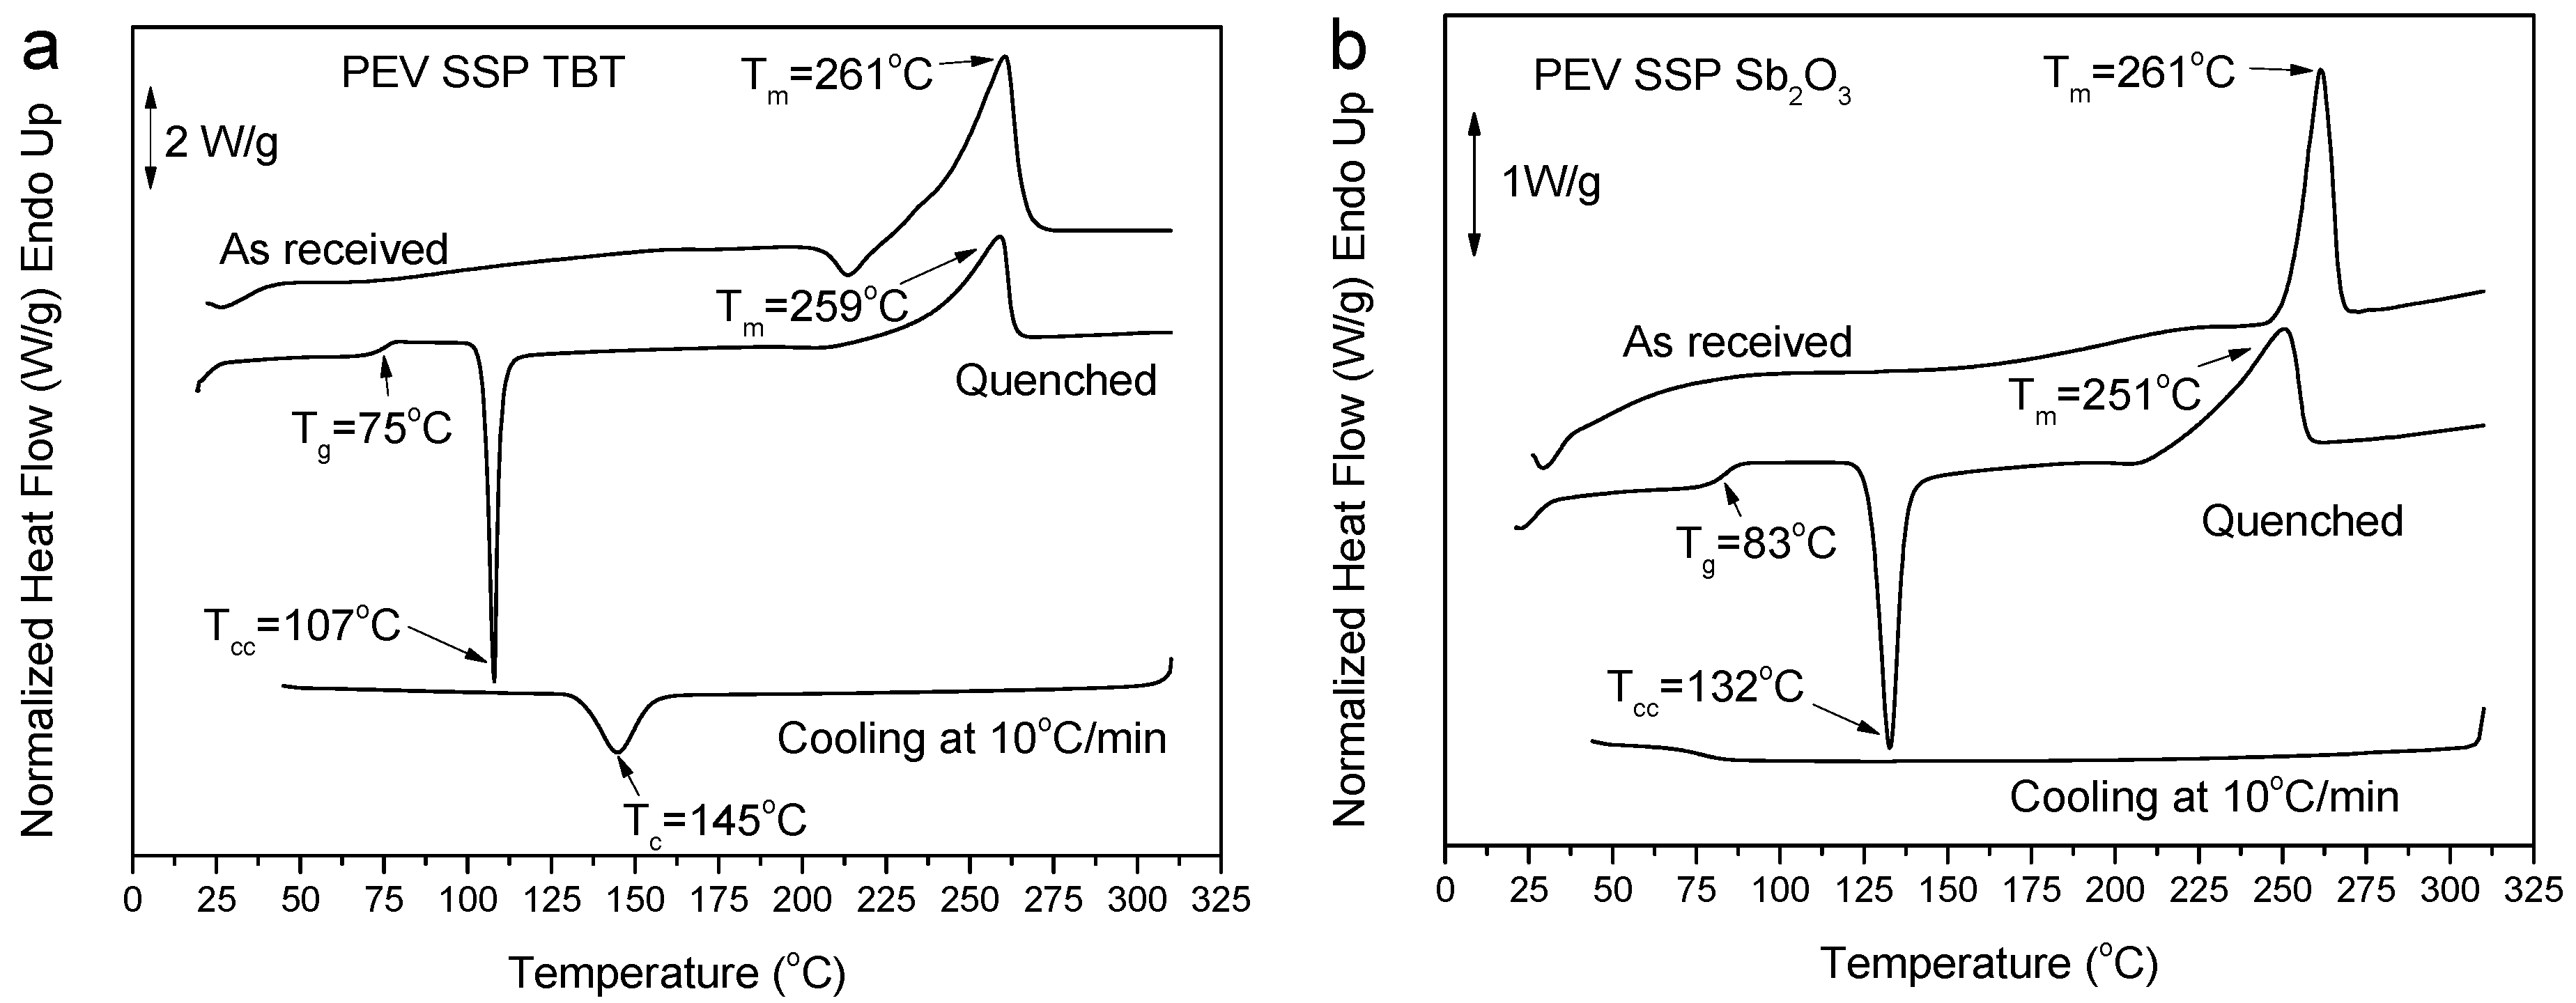
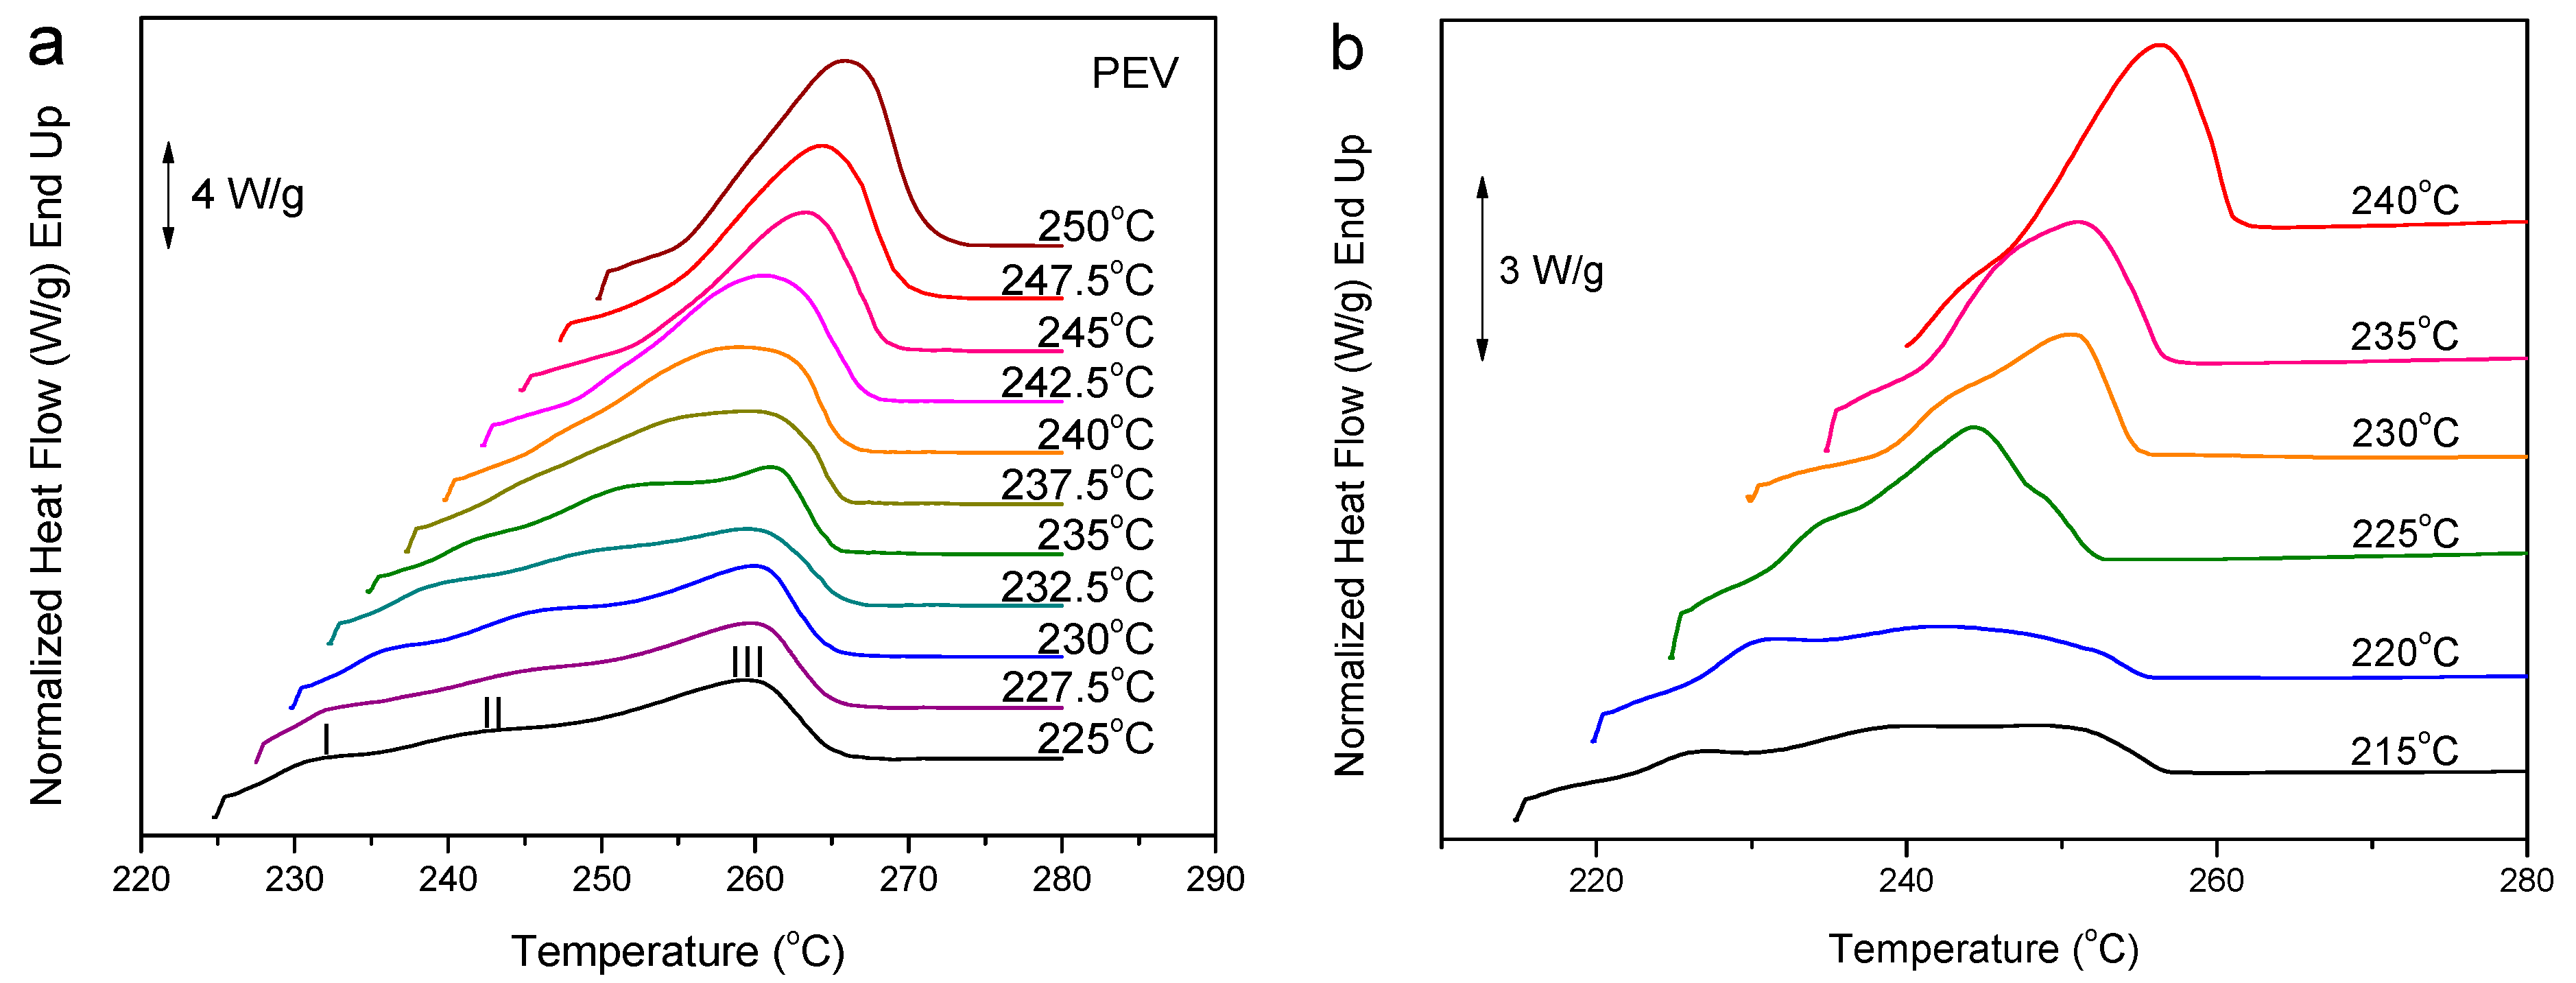
2.4.5. Differential Scanning Calorimetry (DSC)
2.4.6. Polarizing Light Microscopy (PLM)
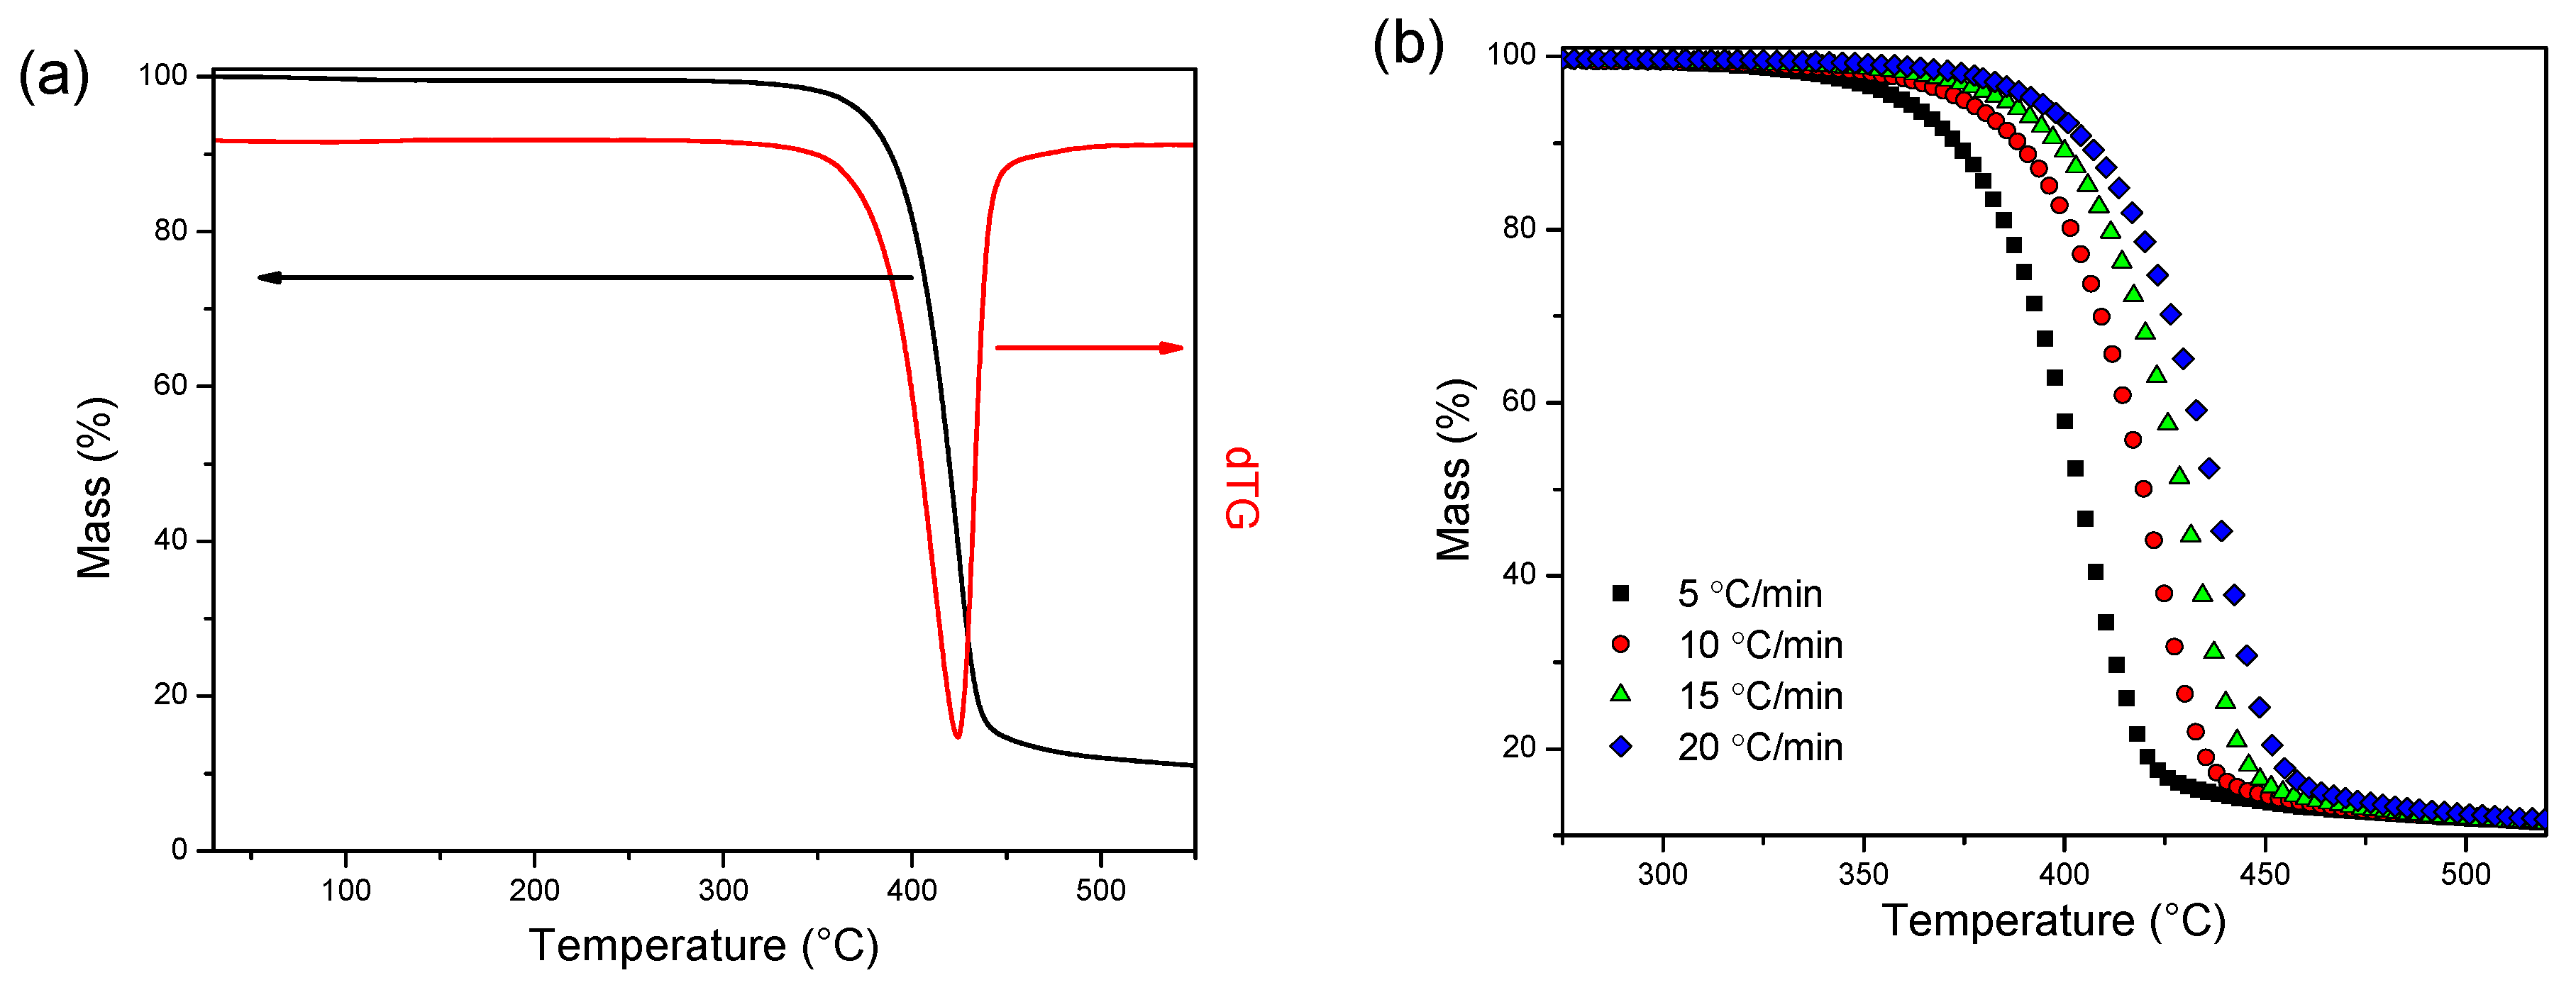
2.4.7. Thermogravimetric Analysis (TGA)
2.4.8. Pyrolysis-Gas Chromatography-Mass Spectroscopy (Py-GC/MS)
2.4.9. Nanoindentation
3. Results and Discussion
3.1. Synthesis and Structural Characterization of PEV
3.2. Thermal Properties and Crystallization Behavior of PEV
3.2.1. Evaluation of the Equilibrium Melting Temperature
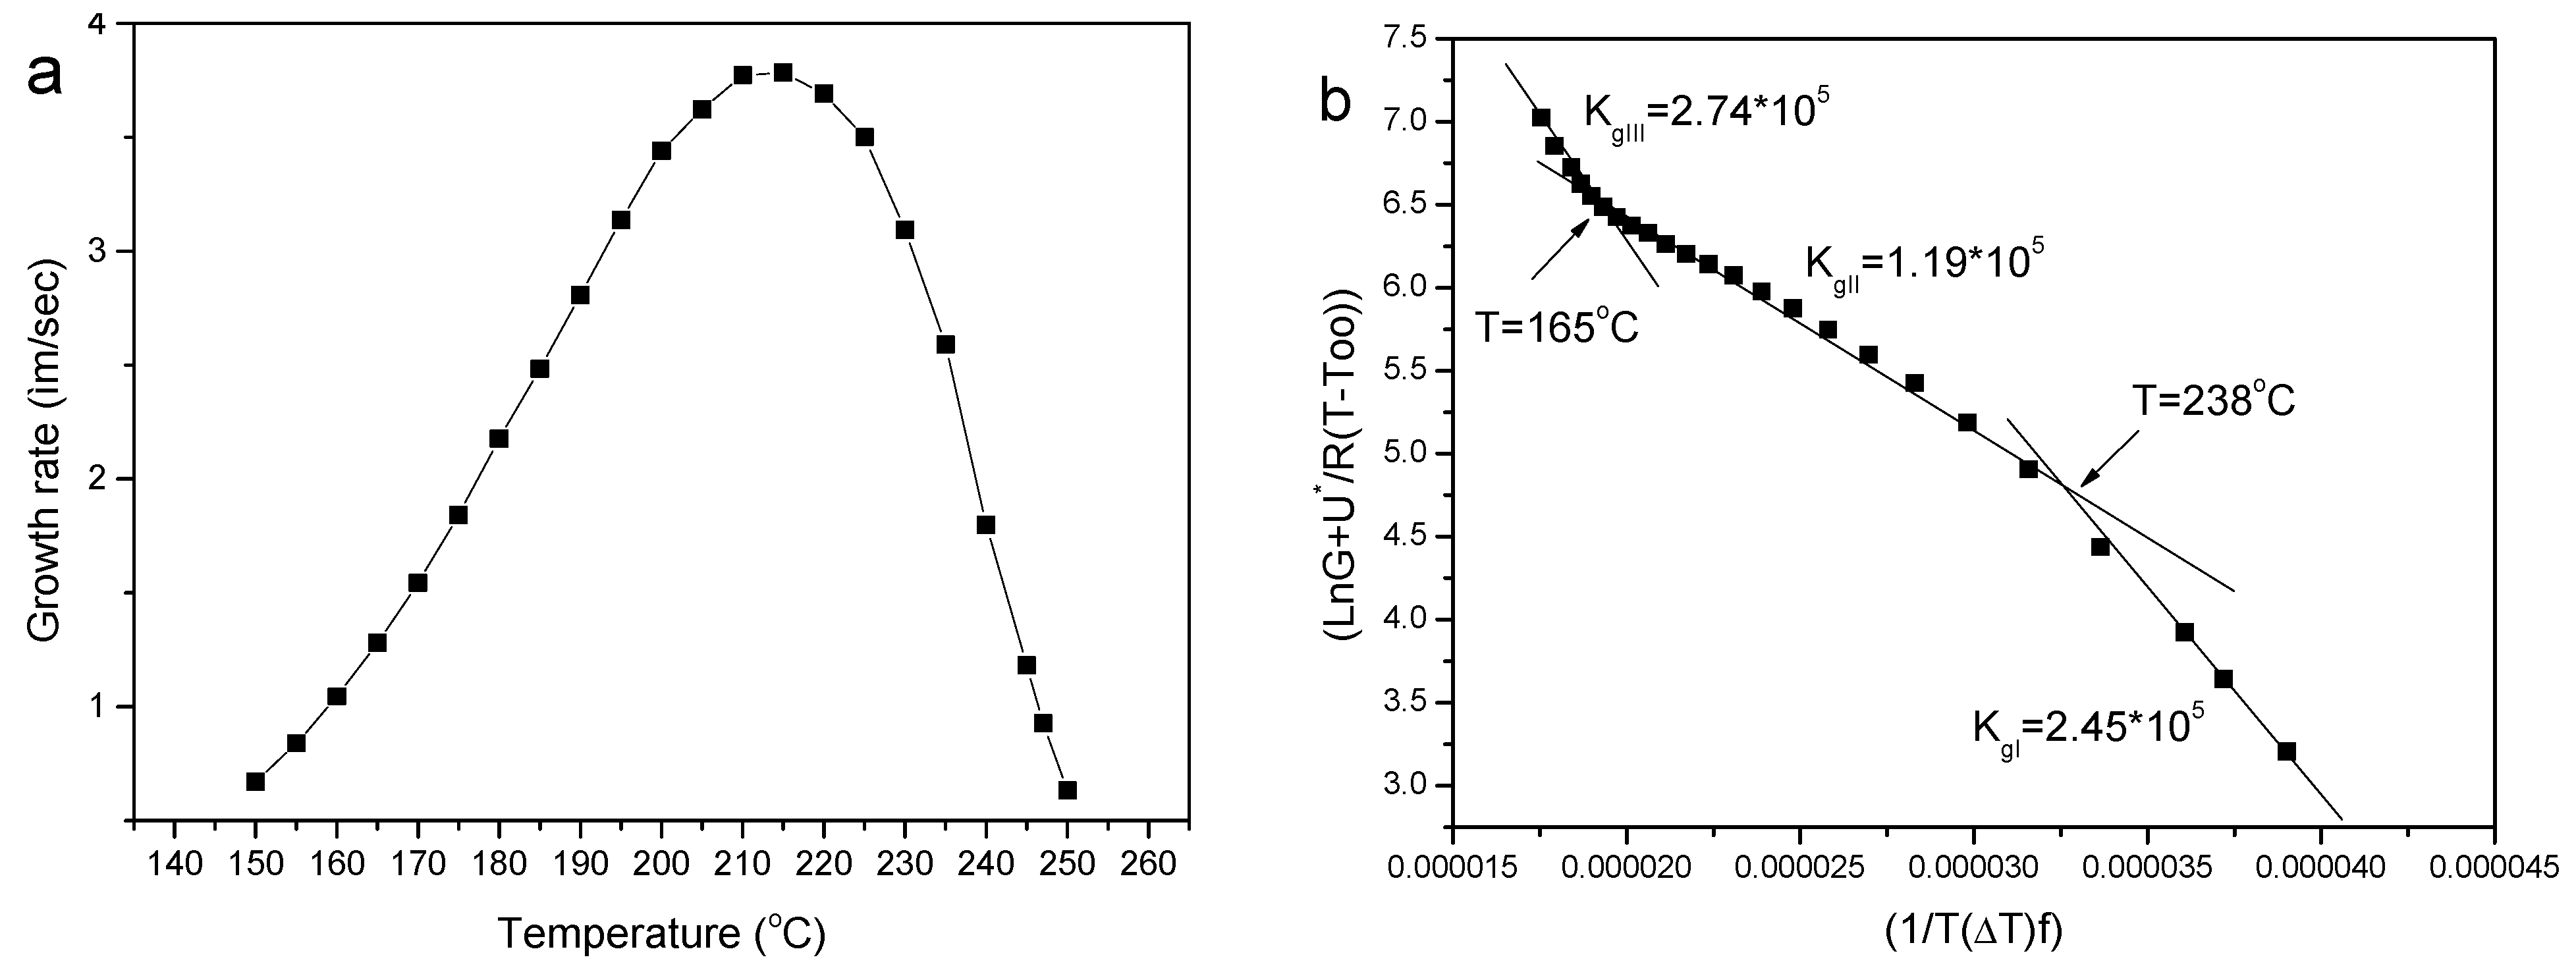
3.2.2. Spherulitic Morphology and Spherulite Growth Rates
3.2.3. Application of Secondary Nucleation Theory Using the Spherulitic Growth Rates
3.3. Thermal Degradation Kinetics
3.3.1. Isoconversional Kinetics
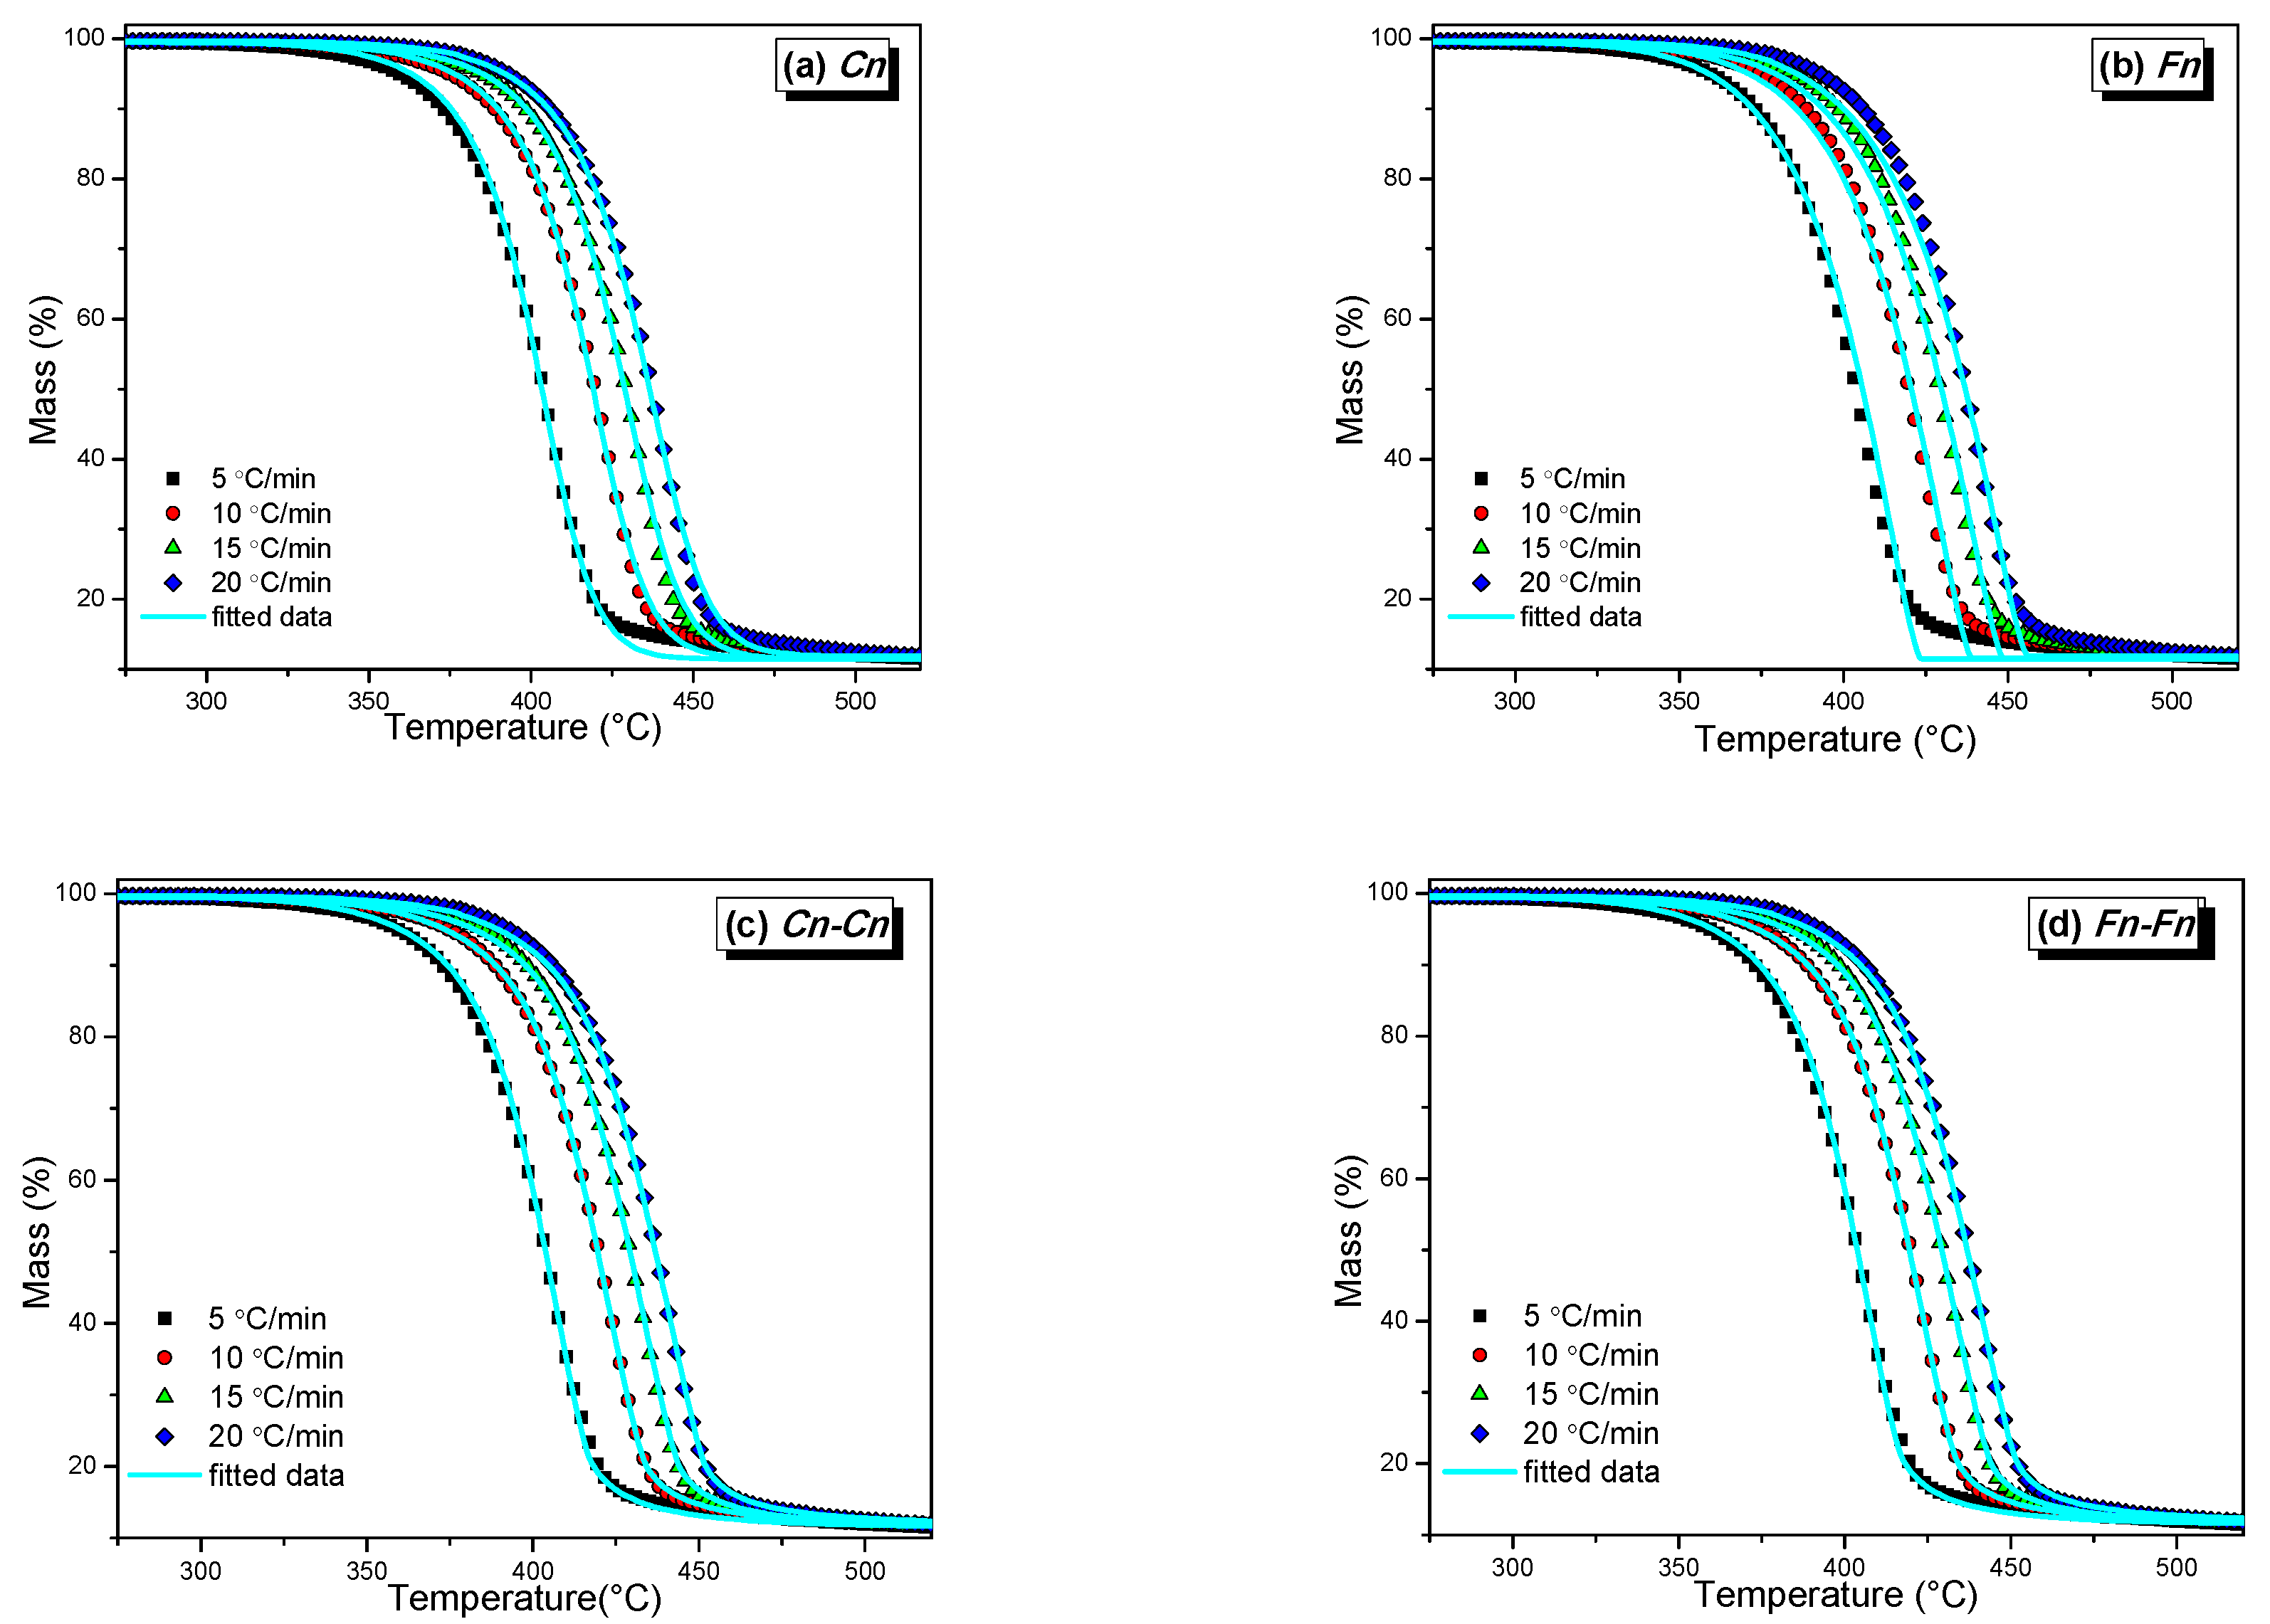
3.3.2. Model Fitting Kinetics
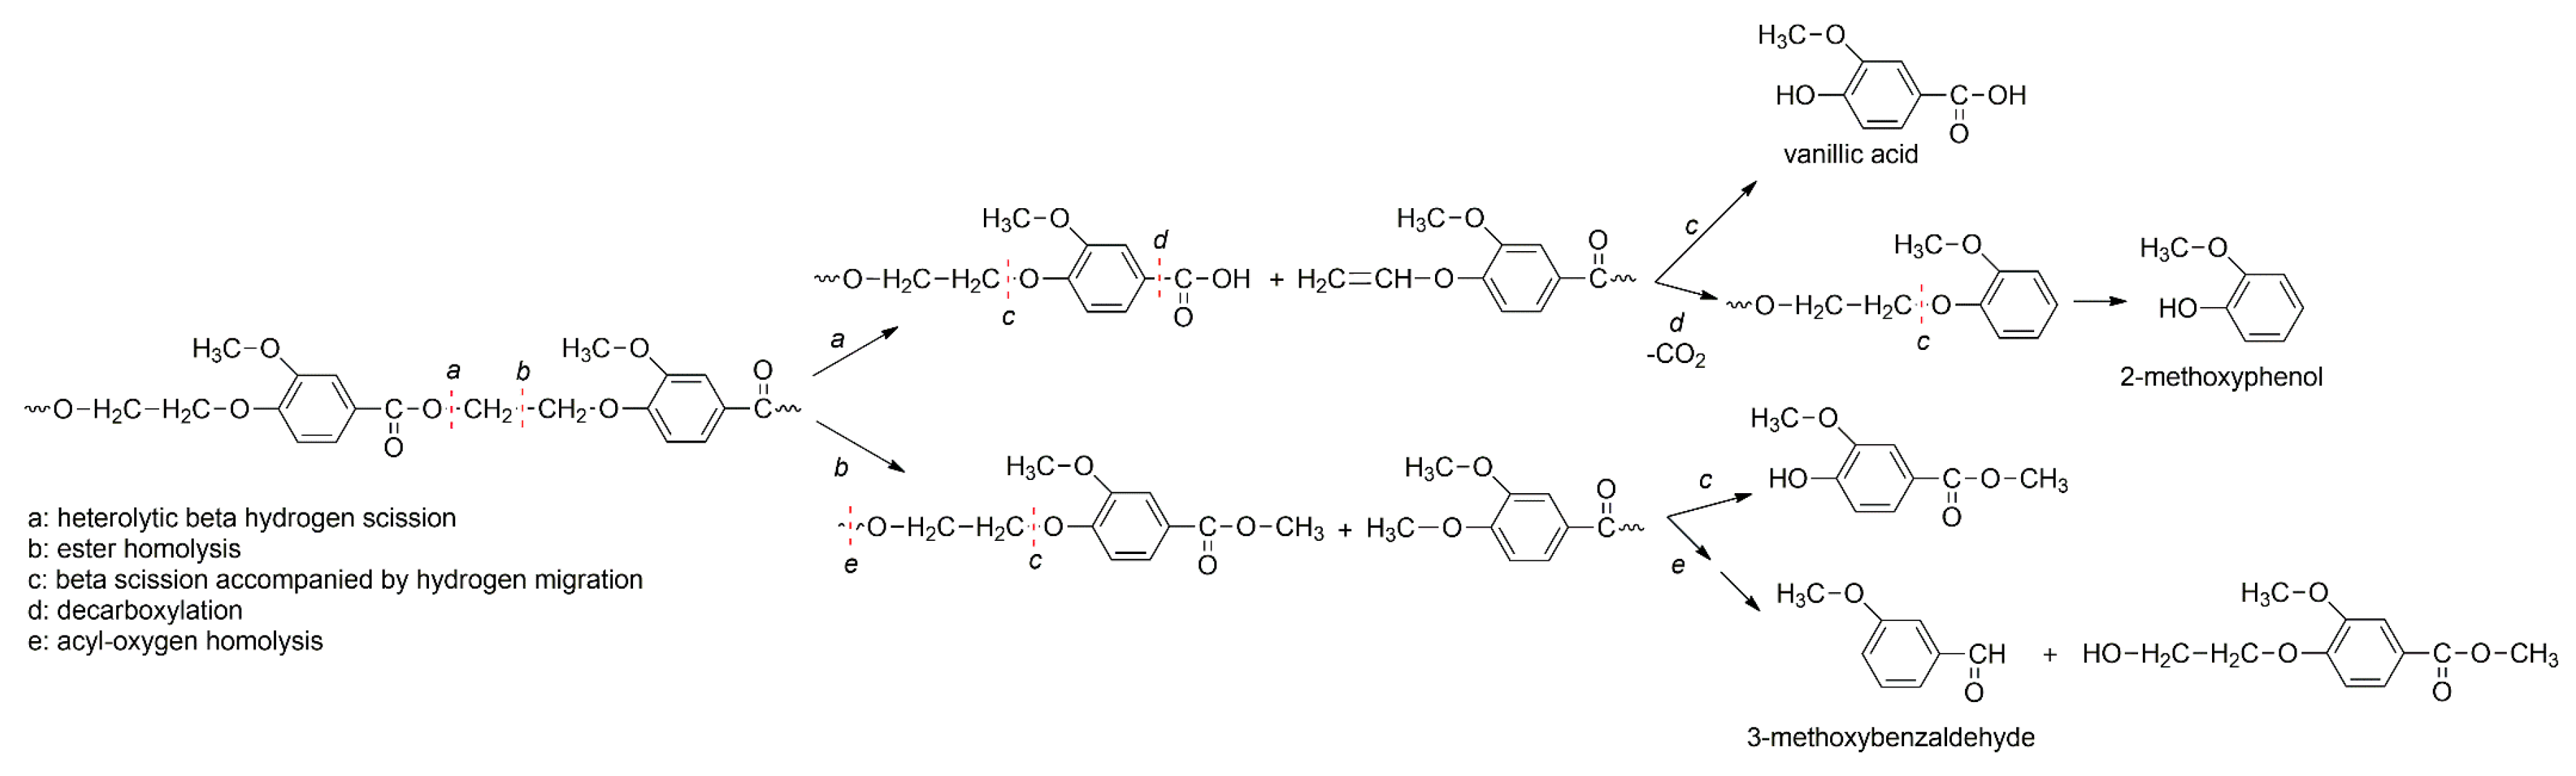
3.4. Thermal Degradation Mechanism
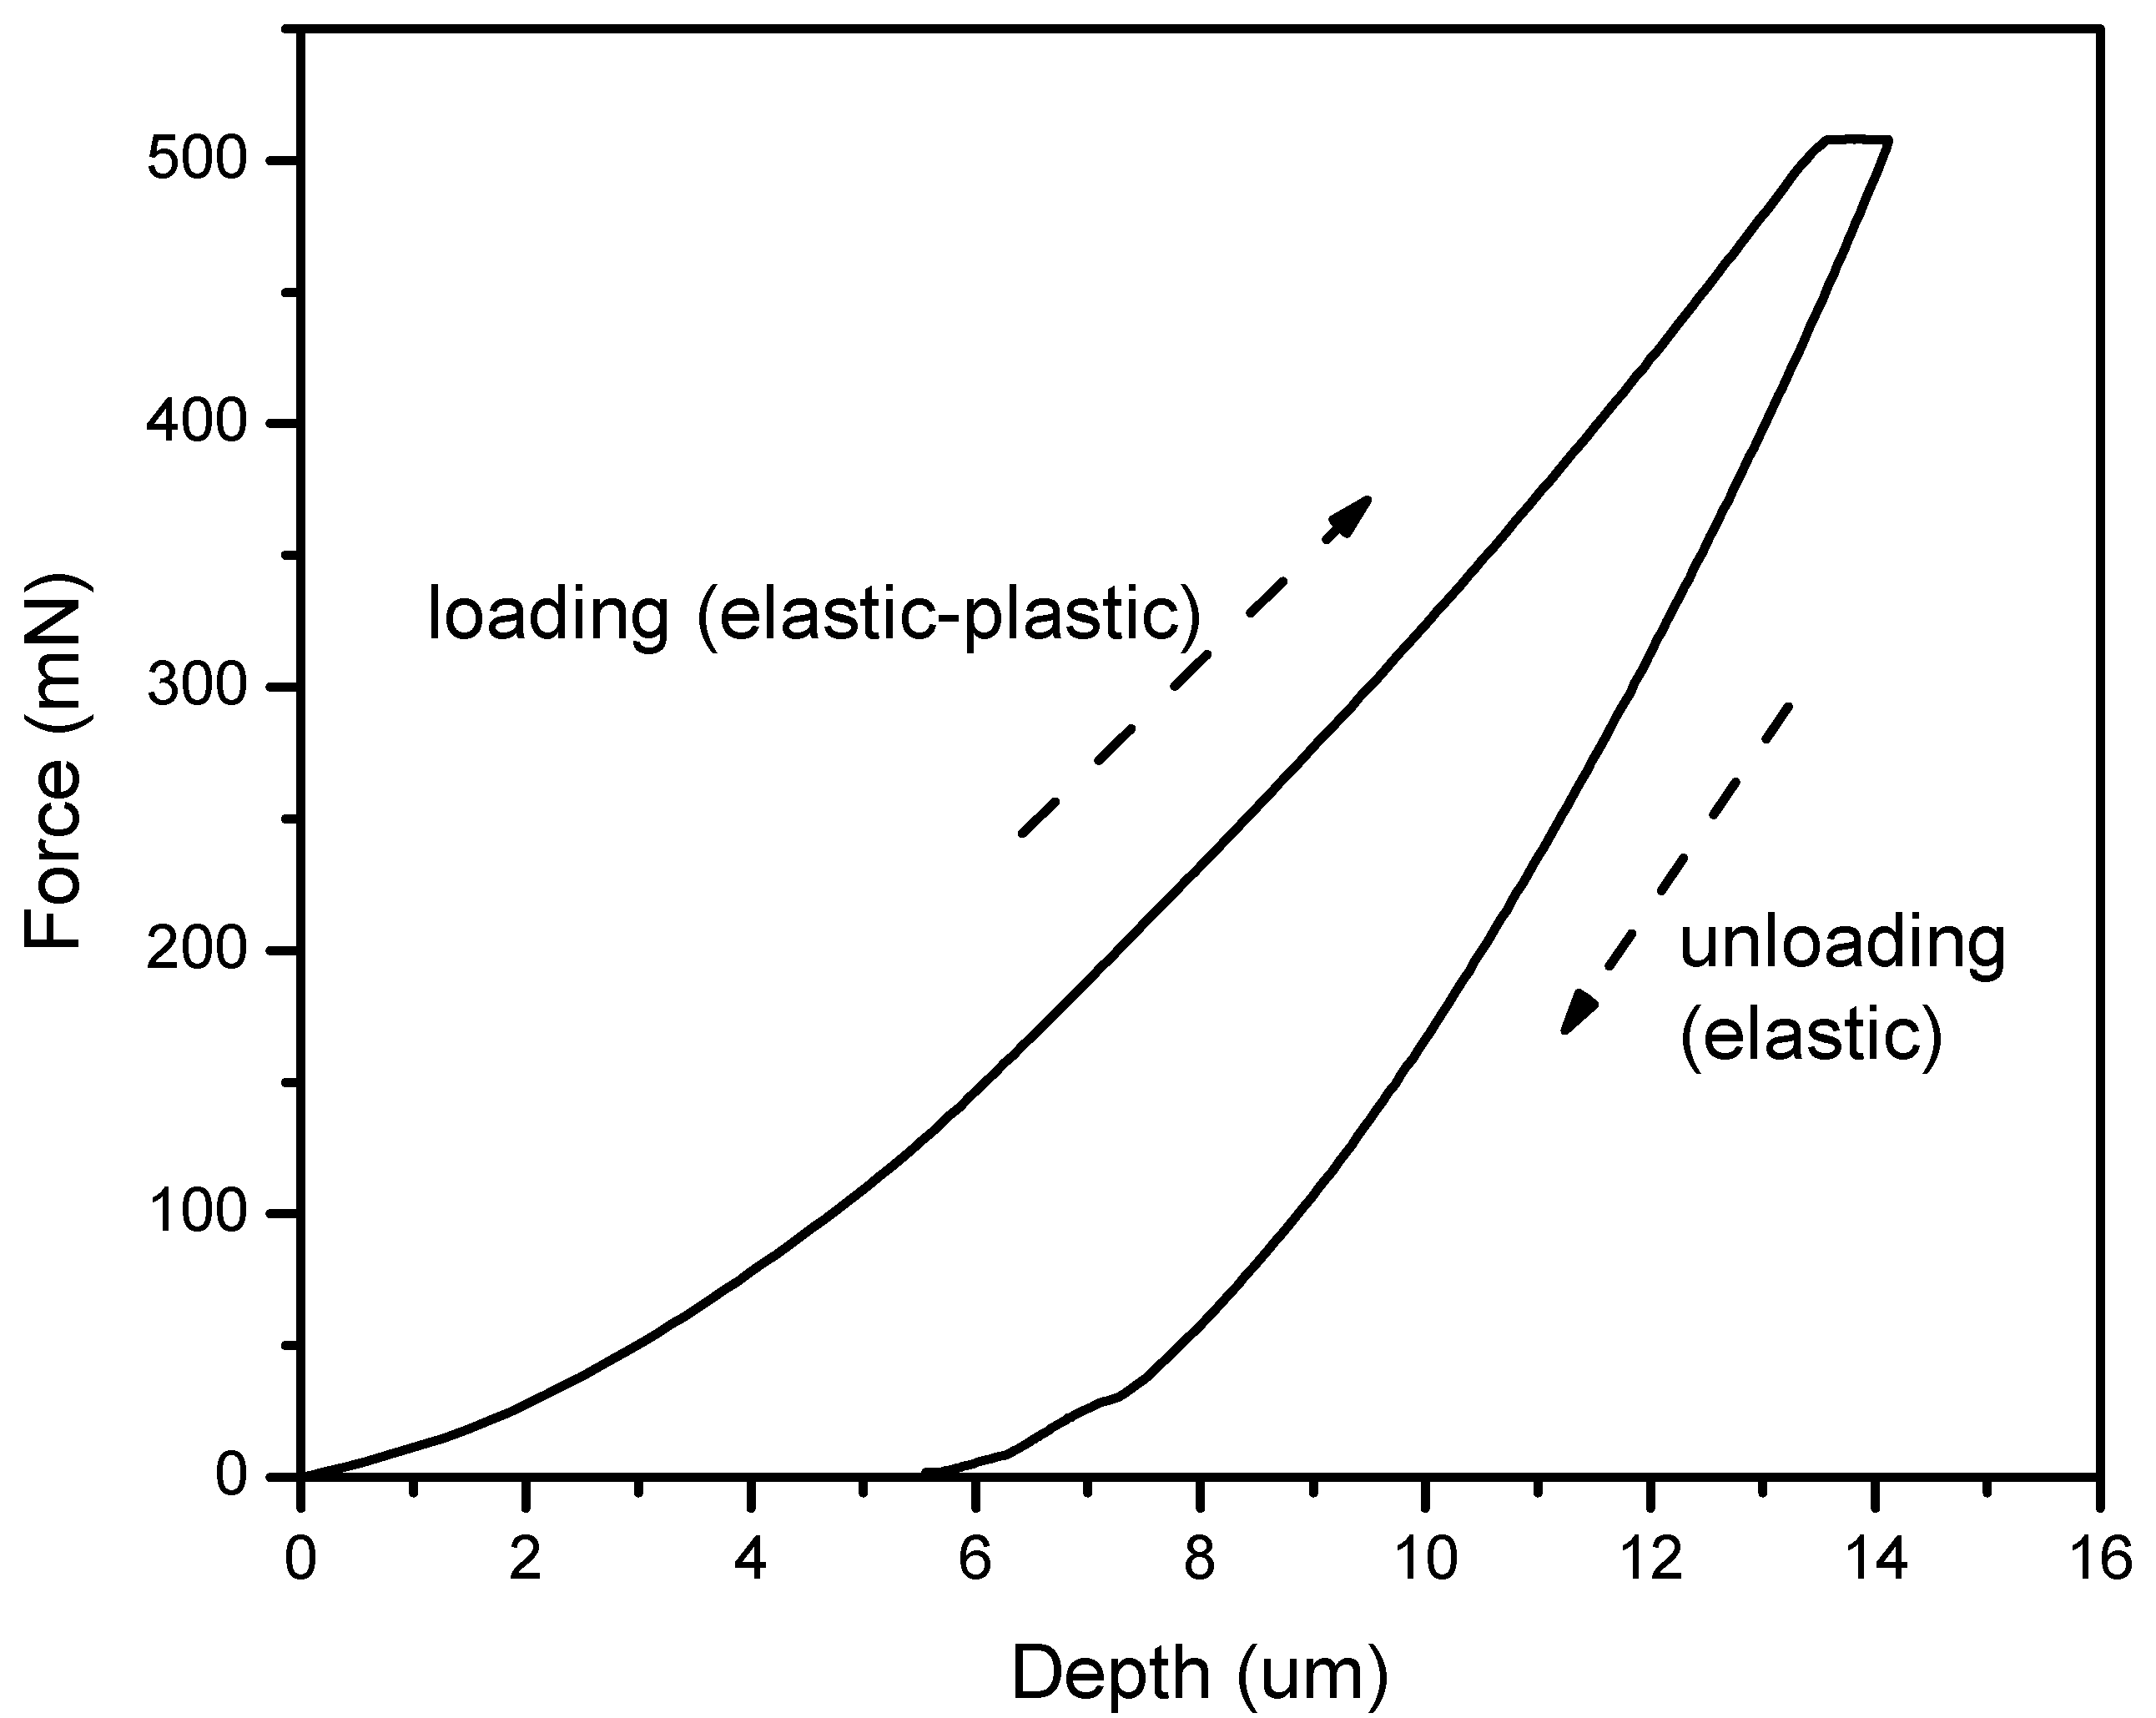
3.5. Nanoindentation
4. Conclusions
Author Contributions
Acknowledgments
Conflicts of Interest
Appendix A


References
- Schneiderman, D.K.; Hillmyer, M.A. 50th Anniversary Perspective: There Is a Great Future in Sustainable Polymers. Macromolecules 2017, 50, 3733–3749. [Google Scholar] [CrossRef]
- Haider, T.P.; Völker, C.; Kramm, J.; Landfester, K.; Wurm, F.R. Plastics of the Future? The Impact of Biodegradable Polymers on the Environment and on Society. Angew. Chem. Int. Ed. 2019, 58, 50–62. [Google Scholar] [CrossRef]
- Zhu, Y.; Romain, C.; Williams, C.K. Sustainable polymers from renewable resources. Nature 2016, 540, 354–362. [Google Scholar] [CrossRef]
- Hillmyer, M.A. The promise of plastics from plants. Science 2017, 358, 868–870. [Google Scholar] [CrossRef]
- Al-Salem, S.M.; Lettieri, P.; Baeyens, J. Recycling and recovery routes of plastic solid waste (PSW): A review. Waste Manag. 2009, 29, 2625–2643. [Google Scholar] [CrossRef] [PubMed]
- Papageorgiou, G.Z.; Tsanaktsis, V.; Bikiaris, D.N. Synthesis of poly(ethylene furandicarboxylate) polyester using monomers derived from renewable resources: Thermal behavior comparison with PET and PEN. Phys. Chem. Chem. Phys. 2014, 16, 7946–7958. [Google Scholar] [CrossRef] [PubMed]
- Terzopoulou, Z.; Karakatsianopoulou, E.; Kasmi, N.; Majdoub, M.; Papageorgiou, G.Z.; Bikiaris, D.N. Effect of catalyst type on recyclability and decomposition mechanism of poly(ethylene furanoate) biobased polyester. J. Anal. Appl. Pyrolysis 2017, 126, 357–370. [Google Scholar] [CrossRef]
- Kasmi, N.; Majdoub, M.; Papageorgiou, G.Z.; Achilias, D.S.; Bikiaris, D.N. Solid-state Polymerization of Poly(ethylene furanoate) Biobased Polyester, I: Effect of Catalyst Type on Molecular Weight Increase. Polymers 2017, 9, 607. [Google Scholar] [CrossRef]
- Kasmi, N.; Papageorgiou, G.Z.; Achilias, D.S.; Bikiaris, D.N. Solid-State polymerization of poly(Ethylene Furanoate) biobased Polyester, II: An efficient and facile method to synthesize high molecular weight polyester appropriate for food packaging applications. Polymers 2018, 10, 471. [Google Scholar] [CrossRef]
- Lotti, N.; Munari, A.; Gigli, M.; Gazzano, M.; Tsanaktsis, V.; Bikiaris, D.N.; Papageorgiou, G.Z. Thermal and structural response of in situ prepared biobased poly(ethylene 2,5-furan dicarboxylate) nanocomposites. Polymer 2016, 103, 288–298. [Google Scholar] [CrossRef]
- Konstantopoulou, M.; Terzopoulou, Z.; Nerantzaki, M.; Tsagkalias, J.; Achilias, D.S.; Bikiaris, D.N.; Exarhopoulos, S.; Papageorgiou, D.G.; Papageorgiou, G.Z. Poly(ethylene furanoate-co-ethylene terephthalate) biobased copolymers: Synthesis, thermal properties and cocrystallization behavior. Eur. Polym. J. 2017, 89, 349–366. [Google Scholar] [CrossRef]
- Papadopoulos, L.; Magaziotis, A.; Nerantzaki, M.; Terzopoulou, Z.; Papageorgiou, G.Z.; Bikiaris, D.N. Synthesis and characterization of novel poly(ethylene furanoate-co-adipate) random copolyesters with enhanced biodegradability. Polym. Degrad. Stab. 2018, 156, 32–42. [Google Scholar] [CrossRef]
- Papadopoulos, L.; Terzopoulou, Z.; Bikiaris, D.N.; Patsiaoura, D.; Chrissafis, K.; Papageorgiou, D.G.; Papageorgiou, G.Z. Synthesis and characterization of in-situ-prepared nanocomposites based on poly(propylene 2,5-furan dicarboxylate) and aluminosilicate clays. Polymers 2018, 10, 937. [Google Scholar] [CrossRef] [PubMed]
- Matos, M.; Sousa, A.F.; Silva, N.H.C.S.; Freire, C.S.R.; Andrade, M.; Mendes, A.; Silvestre, A.J.D. Furanoate-Based Nanocomposites: A Case Study Using Poly(Butylene 2,5-Furanoate) and Poly(Butylene 2,5-Furanoate)-co-(Butylene Diglycolate) and Bacterial Cellulose. Polymers 2018, 10, 810. [Google Scholar] [CrossRef] [PubMed]
- Sajid, M.; Zhao, X.; Liu, D. Production of 2,5-furandicarboxylic acid (FDCA) from 5-hydroxymethylfurfural (HMF): Recent progress focusing on the chemical-catalytic routes. Green Chem. 2018, 20, 5427–5453. [Google Scholar] [CrossRef]
- Fache, M.; Darroman, E.; Besse, V.; Auvergne, R.; Caillol, S.; Boutevin, B. Vanillin, a promising biobased building-block for monomer synthesis. Green Chem. 2014, 16, 1987–1998. [Google Scholar] [CrossRef]
- Fache, M.; Boutevin, B.; Caillol, S. Vanillin, a key-intermediate of biobased polymers. Eur. Polym. J. 2015, 68, 488–502. [Google Scholar] [CrossRef]
- Fabbri, P.; Viaggi, D.; Cavani, F.; Bertin, L.; Michetti, M.; Carnevale, E.; Velasquez Ochoa, J.; Martinez, G.A.; Degli Esposti, M.; Fischer, P.K.; et al. Top Emerging Bio-Based Products, Their Properties and Industrial Applications; Ecologic Institute: Berlin, Germany, 2018. [Google Scholar]
- Ren, T.; Qi, W.; Su, R.; He, Z. Promising Techniques for Depolymerization of Lignin into Value-added Chemicals. ChemCatChem 2019, 11, 639–654. [Google Scholar] [CrossRef]
- Gallage, N.J.; Møller, B.L. Vanillin-bioconversion and bioengineering of the most popular plant flavor and its de novo biosynthesis in the vanilla orchid. Mol. Plant 2015, 8, 40–57. [Google Scholar] [CrossRef]
- Banerjee, G.; Chattopadhyay, P. Vanillin biotechnology: The perspectives and future. J. Sci. Food Agric. 2019, 99, 499–506. [Google Scholar] [CrossRef]
- Heinrich, L.A. Future opportunities for bio-based adhesives-advantages beyond renewability. Green Chem. 2019, 21, 1866–1888. [Google Scholar] [CrossRef]
- Mialon, L.; Vanderhenst, R.; Pemba, A.G.; Miller, S.A. Polyalkylenehydroxybenzoates (PAHBs): Biorenewable aromatic/aliphatic polyesters from lignin. Macromol. Rapid Commun. 2011, 32, 1386–1392. [Google Scholar] [CrossRef]
- Gioia, C.; Banella, M.B.; Marchese, P.; Vannini, M.; Colonna, M.; Celli, A. Advances in the synthesis of bio-based aromatic polyesters: Novel copolymers derived from vanillic acid and ε -caprolactone. Polym. Chem. 2016, 7, 5396–5406. [Google Scholar] [CrossRef]
- Gioia, C.; Banella, M.B.; Totaro, G.; Vannini, M.; Marchese, P.; Colonna, M.; Sisti, L.; Celli, A. Biobased Vanillic Acid and Ricinoleic Acid: Building Blocks for Fully Renewable Copolyesters. J. Renew. Mater. 2018, 6, 126–135. [Google Scholar] [CrossRef]
- Nguyen, H.T.H.; Short, G.N.; Qi, P.; Miller, S.A. Copolymerization of lactones and bioaromatics: Via concurrent ring-opening polymerization/polycondensation. Green Chem. 2017, 19, 1877–1888. [Google Scholar] [CrossRef]
- Bock, L.H.; Anderson, J.K. Linear polyesters derived from vanillic acid. J. Polym. Sci. 1955, 17, 553–558. [Google Scholar] [CrossRef]
- Sazanov, Y.N.; Podeshvo, I.V.; Mikhailov, G.M.; Fedorova, G.N.; Goikhman, M.Y.; Lebedeva, M.F.; Kudryavtsev, V.V. Polymeric materials derived from vanillic acid. Russ. J. Appl. Chem. 2002, 75, 777–780. [Google Scholar] [CrossRef]
- Pang, C.; Zhang, J.; Wu, G.; Wang, Y.; Gao, H.; Ma, J. Renewable polyesters derived from 10-undecenoic acid and vanillic acid with versatile properties. Polym. Chem. 2014, 5, 2843–2853. [Google Scholar] [CrossRef]
- Pang, C.; Zhang, J.; Zhang, Q.; Wu, G.; Wang, Y.; Ma, J. Novel vanillic acid-based poly(ether-ester)s: From synthesis to properties. Polym. Chem. 2015, 6, 797–804. [Google Scholar] [CrossRef]
- Llevot, A.; Grau, E.; Carlotti, S.; Grelier, S.; Cramail, H. Renewable (semi)aromatic polyesters from symmetrical vanillin-based dimers. Polym. Chem. 2015, 6, 6058–6066. [Google Scholar] [CrossRef] [Green Version]
- Montes de Oca, H.; Wilson, J.E.; Penrose, A.; Langton, D.M.; Dagger, A.C.; Anderson, M.; Farrar, D.F.; Lovell, C.S.; Ries, M.E.; Ward, I.M.; et al. Liquid-crystalline aromatic-aliphatic copolyester bioresorbable polymers. Biomaterials 2010, 31, 7599–7605. [Google Scholar] [CrossRef]
- Wilsens, C.H.R.M.; Verhoeven, J.M.G.A.; Noordover, B.A.J.; Hansen, M.R.; Auhl, D.; Rastogi, S. Thermotropic polyesters from 2,5-furandicarboxylic acid and vanillic acid: Synthesis, thermal properties, melt behavior, and mechanical performance. Macromolecules 2014, 47, 3306–3316. [Google Scholar] [CrossRef]
- Wilsens, C.H.R.M.; Deshmukh, Y.S.; Liu, W.; Noordover, B.A.J.; Yao, Y.; Meijer, H.E.H.; Rastogi, S. Processing and performance of aromatic-aliphatic thermotropic polyesters based on vanillic acid. Polymer 2015, 60, 198–206. [Google Scholar] [CrossRef] [Green Version]
- Li, X.G.; Huang, M.R.; Guan, G.H.; Sun, T. Molecular structure of liquid-crystalline copolyesters of vanillic acid, 4-hydroxybenzoic acid and poly(ethylene terephthalate). Die Angew. Makromol. Chem. 1995, 227, 69–85. [Google Scholar] [CrossRef]
- Li, X.; Huang, M.; Guan, G.; Sun, T. Glass transition of thermotropic polymers based upon vanillic acid, p-hydroxybenzoic acid, and poly(ethylene terephthalate). J. Appl. Polym. Sci. 1996, 59, 1–8. [Google Scholar] [CrossRef]
- Tsanaktsis, V.; Papageorgiou, D.G.; Exarhopoulos, S.; Bikiaris, D.N.; Papageorgiou, G.Z. Crystallization and Polymorphism of Poly(ethylene furanoate). Cryst. Growth Des. 2015, 15, 5505–5512. [Google Scholar] [CrossRef]
- Fillon, B.; Wittmann, J.C.; Lotz, B.; Thierry, A. Self-nucleation and recrystallization of isotactic polypropylene (α phase) investigated by differential scanning calorimetry. J. Polym. Sci. Part B Polym. Phys. 1993, 31, 1383–1393. [Google Scholar] [CrossRef]
- Cavallo, D.; Gardella, L.; Portale, G.; Müller, A.J.; Alfonso, G.C. On cross- and self-nucleation in seeded crystallization of isotactic poly(1-butene). Polymer 2013, 54, 4637–4644. [Google Scholar] [CrossRef]
- Tzetzis, D.; Tsongas, K.; Mansour, G. Determination of the mechanical properties of epoxy silica nanocomposites through FEA-supported evaluation of ball indentation test results. Mater. Res. 2017, 20, 1571–1578. [Google Scholar] [CrossRef]
- Mansour, G.; Tzetzis, D.; Bouzakis, K.D. A nanomechanical approach on the measurement of the elastic properties of epoxy reinforced carbon nanotube nanocomposites. Tribol. Ind. 2013, 35, 190–199. [Google Scholar]
- Tzetzis, D.; Mansour, G.; Tsiafis, I.; Pavlidou, E. Nanoindentation measurements of fumed silica epoxy reinforced nanocomposites. J. Reinf. Plast. Compos. 2013, 32, 160–173. [Google Scholar] [CrossRef]
- Mansour, G.; Tzetzis, D. Nanomechanical characterization of hybrid multiwall carbon nanotube and fumed silica epoxy nanocomposites. Polym. Plast. Technol. Eng. 2013, 52, 1054–1062. [Google Scholar] [CrossRef]
- Belkov, M.V.; Brinkevich, S.D.; Samovich, S.N.; Skornyakov, I.V.; Tolstorozhev, G.B.; Shadyro, O.I. Infrared spectra and structure of molecular complexes of aromatic acids. J. Appl. Spectrosc. 2012, 78, 794–801. [Google Scholar] [CrossRef]
- Lu, X.; Hay, J. Isothermal crystallization kinetics and melting behaviour of poly(ethylene terephthalate). Polymer 2001, 42, 9423–9431. [Google Scholar] [CrossRef]
- van Krevelen, D.W.; te Nijensuis, K. Properties of Polymers—Their Correlation with Chemical Structure; Their Numerical Estimation and Prediction from Additive Group Contributions, 4th ed.; Elsevier Science: Amsterdam, The Netherlands, 2009; ISBN 9780080548197. [Google Scholar]
- Sauer, B.; Kampert, W.; Neal Blanchard, E.; Threefoot, S.; Hsiao, B. Temperature modulated DSC studies of melting and recrystallization in polymers exhibiting multiple endotherms. Polymer 2000, 41, 1099–1108. [Google Scholar] [CrossRef]
- Papageorgiou, G.Z.; Karayannidis, G.P. Multiple melting behaviour of poly(ethylene-co-butylene naphthalene-2,6-dicarboxylate)s. Polymer 1999, 40, 5325–5332. [Google Scholar] [CrossRef]
- Papageorgiou, G.Z.; Tsanaktsis, V.; Papageorgiou, D.G.; Chrissafis, K.; Exarhopoulos, S.; Bikiaris, D.N. Furan-based polyesters from renewable resources: Crystallization and thermal degradation behavior of poly(hexamethylene 2,5-furan-dicarboxylate). Eur. Polym. J. 2015, 67, 383–396. [Google Scholar] [CrossRef]
- Papageorgiou, G.Z.; Bikiaris, D.N. Crystallization and melting behavior of three biodegradable poly(alkylene succinates). A comparative study. Polymer 2005, 46, 12081–12092. [Google Scholar] [CrossRef]
- Minakov, A.A.; Mordvintsev, D.A.; Schick, C. Melting and reorganization of poly(ethylene terephthalate) on fast heating (1000 K/s). Polymer 2004, 45, 3755–3763. [Google Scholar] [CrossRef]
- Papageorgiou, D.G.; Papageorgiou, G.Z.; Zhuravlev, E.; Bikiaris, D.; Schick, C.; Chrissafis, K. Competitive Crystallization of a Propylene/Ethylene Random Copolymer Filled with a β-Nucleating Agent and Multi-Walled Carbon Nanotubes. Conventional and Ultrafast DSC Study. J. Phys. Chem. B 2013, 117, 14875–14884. [Google Scholar] [CrossRef]
- Hoffman, J.D.; Weeks, J.J. Melting process and the equilibrium melting temperature of polychlorotrifluoroethylene. J. Res. Natl. Bur. Stand. Sect. A Phys. Chem. 1962, 66, 13–28. [Google Scholar] [CrossRef]
- Hoffman, J.D.; Davis, G.T.; Lauritzen, J.I. Crystallization of Linear Polymers with Chain Folding. In Treatise on Solid State Chemistry; Hannay, N.B., Ed.; Springer: Boston, MA, USA, 1976; pp. 497–614. ISBN 978-1-4684-2666-3. [Google Scholar]
- Papageorgiou, G.Z.; Papageorgiou, D.G.; Tsanaktsis, V.; Bikiaris, D.N. Synthesis of the bio-based polyester poly(propylene 2,5-furan dicarboxylate). Comparison of thermal behavior and solid state structure with its terephthalate and naphthalate homologues. Polymer 2015, 62, 28–38. [Google Scholar] [CrossRef]
- Runt, J.; Miley, D.M.; Zhang, X.; Gallagher, K.P.; McFeaters, K.; Fishburn, J. Crystallization of poly(butylene terephthalate) and its blends with polyarylate. Macromolecules 1992, 25, 1929–1934. [Google Scholar] [CrossRef]
- Vyazovkin, S.; Burnham, A.K.; Criado, J.M.; Pérez-Maqueda, L.A.; Popescu, C.; Sbirrazzuoli, N. ICTAC Kinetics Committee recommendations for performing kinetic computations on thermal analysis data. Thermochim. Acta 2011, 520, 1–19. [Google Scholar] [CrossRef]
- Sbirrazzuoli, N. Determination of pre-exponential factors and of the mathematical functions f(α) or G(α) that describe the reaction mechanism in a model-free way. Thermochim. Acta 2013, 564, 59–69. [Google Scholar] [CrossRef]
- Friedman, H.L. Kinetics of thermal degradation of char-forming plastics from thermogravimetry. Application to a phenolic plastic. J. Polym. Sci. Part C Polym. Symp. 1964, 6, 183–195. [Google Scholar] [CrossRef]
- Flynn, J.H.; Wall, L.A. A quick, direct method for the determination of activation energy from thermogravimetric data. J. Polym. Sci. Part B Polym. Lett. 1966, 4, 323–328. [Google Scholar] [CrossRef]
- Vyazovkin, S. Model-free kinetics. J. Therm. Anal. Calorim. 2006, 83, 45–51. [Google Scholar] [CrossRef]
- Ozawa, T. A new method of analyzing thermogravimetric data. Bull. Chem. Soc. Jpn. 1965, 38, 1881–1886. [Google Scholar] [CrossRef]
- Chrissafis, K. Kinetics of thermal degradation of polymers. J. Therm. Anal. Calorim. 2009, 95, 273–283. [Google Scholar] [CrossRef]
- Sbirrazzuoli, N. Is the Friedman method applicable to transformations with temperature dependent reaction heat? Macromol. Chem. Phys. 2007, 208, 1592–1597. [Google Scholar] [CrossRef]
- Starink, M.J. The determination of activation energy from linear heating rate experiments: A comparison of the accuracy of isoconversion methods. Thermochim. Acta 2003, 404, 163–176. [Google Scholar] [CrossRef]
- Vyazovkin, S. Isoconversional Kinetics of Thermally Stimulated Processes; Springer: Berlin, Germany, 2015; ISBN 978-3-319-14174-9. [Google Scholar]
- Pielichowska, K.; Nowicka, K. Analysis of nanomaterials and nanocomposites by thermoanalytical methods. Thermochim. Acta 2019, 675, 140–163. [Google Scholar] [CrossRef]
- Sivasamy, P.; Palaniandavar, M.; Vijayakumar, C.T.; Lederer, K. The role of β-hydrogen in the degradation of polyesters. Polym. Degrad. Stab. 1992, 38, 15–21. [Google Scholar] [CrossRef]
- Degradation, P.; Mcneill, I.C. Thermal Degradation Studies of Terephthalate Polyesters: 1. Poly (alkylene terephthalates). Polym. Degrad. Stab. 1991, 34, 187–204. [Google Scholar]
- Montaudo, G.; Puglisi, C.; Samperi, F. Primary thermal degradation mechanisms of PET and PBT. Polym. Degrad. Stab. 1993, 42, 13–28. [Google Scholar] [CrossRef]
- Terzopoulou, Z.; Tsanaktsis, V.; Nerantzaki, M.; Achilias, D.S.; Vaimakis, T.; Papageorgiou, G.Z.; Bikiaris, D.N. Thermal degradation of biobased polyesters: Kinetics and decomposition mechanism of polyesters from 2,5-furandicarboxylic acid and long-chain aliphatic diols. J. Anal. Appl. Pyrolysis 2016, 117, 162–175. [Google Scholar] [CrossRef]
- Buxbaum, B. The Degradation of Poly (ethylene terephthalate ). Angew. Chem. Int. Ed. 1968, 7, 182–190. [Google Scholar] [CrossRef]
- Jiang, W.; Wu, S.; Lucia, L.A.; Chu, J. A comparison of the pyrolysis behavior of selected Β-O-4 type lignin model compounds. J. Anal. Appl. Pyrolysis 2017, 125, 185–192. [Google Scholar] [CrossRef]
- He, T.; Zhang, Y.; Zhu, Y.; Wen, W.; Pan, Y.; Wu, J.; Wu, J. Pyrolysis Mechanism Study of Lignin Model Compounds by Synchrotron Vacuum Ultraviolet Photoionization Mass Spectrometry. Energy Fuels 2016, 30, 2204–2208. [Google Scholar] [CrossRef]
- Kim, K.H.; Bai, X.; Brown, R.C. Pyrolysis mechanisms of methoxy substituted a-O-4 lignin dimeric model compounds and detection of free radicals using electron paramagnetic resonance analysis. J. Anal. Appl. Pyrolysis 2014, 110, 254–263. [Google Scholar] [CrossRef]
- Jiang, X.; Lu, Q.; Hu, B.; Liu, J.; Dong, C.; Yang, Y. A comprehensive study on pyrolysis mechanism of substituted β-O-4 type lignin dimers. Int. J. Mol. Sci. 2017, 18, 2364. [Google Scholar] [CrossRef] [PubMed]
- Elder, T.; Beste, A. Density functional theory study of the concerted pyrolysis mechanism for lignin models. Energy Fuels 2014, 28, 5229–5235. [Google Scholar] [CrossRef]
- Bounekhel, M.; McNeill, I.C. Thermal degradation studies of terephthalate polyesters: 2. Poly(ether-esters). Polym. Degrad. Stab. 1995, 49, 347–352. [Google Scholar] [CrossRef]
- Voorhees, K.J.; Baugh, S.F.; Stevenson, D.N. An investigation of the thermal degradation of poly (ethylene glycol). J. Anal. Appl. Pyrolysis 1994, 30, 47–57. [Google Scholar] [CrossRef]
- Varanasi, P.; Singh, P.; Auer, M.; Adams, P.D.; Simmons, B.A.; Singh, S. Survey of renewable chemicals produced from lignocellulosic biomass during ionic liquid pretreatment. Biotechnol. Biofuels 2013, 6, 14. [Google Scholar] [CrossRef] [PubMed]
- Flores, A.; Pieruccini, M.; Stribeck, N.; Funari, S.S.; Bosch, E.; Baltá-Calleja, F.J. Structure formation in poly (ethylene terephthalate) upon annealing as revealed by microindentation hardness and X-ray scattering. Polymer 2005, 46, 9404–9410. [Google Scholar] [CrossRef]
- Cruz, C.S.; Calleja, F.J.B.; Zachmann, H.G.; Stribeck, N.; Asano, T. Relating microhardness of poly (ethylene terephthalate) to microstructure. J. Polym. Sci. Part B Polym. Phys. 1991, 29, 819–824. [Google Scholar] [CrossRef]


| 1 Single Mechanism | 2 Consecutive Mechanisms | |||
|---|---|---|---|---|
| Mechanism | Cn | Fn | Cn–Cn | Fn–Fn |
| 1st Mechanism | ||||
| Cn | Fn | Cn | Fn | |
| log A1(s−1) | 10.00 | 11.16 | 10.09 | 10.09 |
| E1 (kJ/mol) | 166 | 178 | 162 | 162 |
| log Kcat1 | 0.81 | −15.47 | ||
| 2nd Mechanism | ||||
| Cn | Fn | |||
| log A2(s−1) | - | - | 14.58 | 14.22 |
| E2 (kJ/mol) | - | - | 207 | 202 |
| log Kcat2 | - | - | −6.99 | |
| Correlation Coefficient | 0.99972 | 0.99897 | 0.99994 | 0.99994 |
| Rt (min) | MW (amu) | Possible Compound | ||
|---|---|---|---|---|
| 330 | 420 | 500 | ||
| 0.62 | 0.18 | 0.33 | 28, 44 | CO/CO2 |
| 1.22 | 1.22 | 1.23 | 28, 44 | CO/CO2 |
| - | 6.31 | 6.33 | 124 |  guaiacol |
| - | 7.02 | 7.04 | 150 |  1-methoxy-2-(vinyloxy)benzene |
| - | 7.33 | 7.32 | 136 | 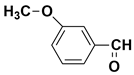 m-Anisaldehyde |
| - | 10.61 | 10.65 | 168 | 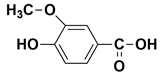 vanillic acid |
| 11.99 | 12.26 | 12.23 | 182 |  methyl 4-hydroxy-3-methoxybenzoate |
| - | 12.60 | 12.67 | 194 | 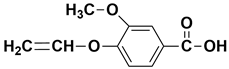 3-methoxy-4-(vinyloxy)benzoic acid |
| - | 12.66 | 12.69 | 208 | 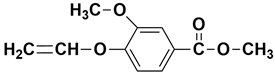 methyl 3-methoxy-4-(vinyloxy)benzoate |
| - | 12.97 | 12.99 | 196 | 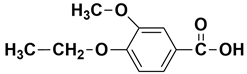 4-ethoxy-3-methoxybenzoic acid or 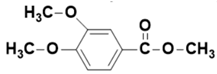 methyl 3,4-dimethoxybenzoate |
| 14.60 | 13.73 | 13.68 | 210 |  4-ethoxy-3-methoxybenzoic acid Or  ethyl 3,4-dimethoxybenzoate |
| - | - | 13.96 | 208 | 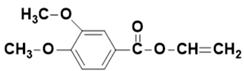 vinyl 3,4-dimethoxybenzoate |
| - | 14.13 | 14.15 | 206 |  vinyl 3-hydroxy-4-(vinyloxy)benzoate |
| - | 15.12 | 15.02 | 222 | 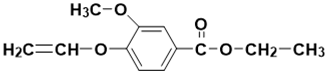 ethyl 3-methoxy-4-(vinyloxy)benzoate |
| 15.86 | 16.11 | 16.12 | 212 |  4-(2-hydroxyethoxy)-3-methoxybenzoic acid |
| 15.98 | 16.16 | 16.17 | 226 | 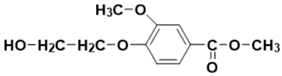 methyl 4-(2-hydroxyethoxy)-3-methoxybenzoate |
| 17.22 | 17.39 | 17.39 | 224 | 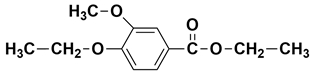 ethyl 4-ethoxy-3-methoxybenzoate |
| 19.12 | 19.13 | 19.20 | 256 | 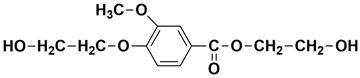 2-hydroxyethyl 4-(2-hydroxyethoxy)-3-methoxybenzoate |
| 22.25 | 22.37 | 22.49 | 318 | 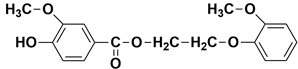 2-(2-methoxyphenoxy)ethyl 4-hydroxy-3-methoxybenzoate |
| - | 22.43 | 22.53 | 344 |  2-(2-methoxyphenoxy)ethyl 3-methoxy-4-(vinyloxy)benzoate |
| 24.74 | 24.77 | 24.79 | 388 |  3-methoxy-4-(2-((3-methoxy-4-(vinyloxy)benzoyl)oxy)ethoxy)benzoic acid |
| Max Displacement (μm) | Indentation Hardness (N/mm2) | Elastic Modulus (N/mm2) |
|---|---|---|
| 14.25 ± 0.26 | 177.81 ± 8.37 | 1506.00 ± 96.19 |
© 2019 by the authors. Licensee MDPI, Basel, Switzerland. This article is an open access article distributed under the terms and conditions of the Creative Commons Attribution (CC BY) license (http://creativecommons.org/licenses/by/4.0/).
Share and Cite
Zamboulis, A.; Papadopoulos, L.; Terzopoulou, Z.; Bikiaris, D.N.; Patsiaoura, D.; Chrissafis, K.; Gazzano, M.; Lotti, N.; Papageorgiou, G.Z. Synthesis, Thermal Properties and Decomposition Mechanism of Poly(Ethylene Vanillate) Polyester. Polymers 2019, 11, 1672. https://doi.org/10.3390/polym11101672
Zamboulis A, Papadopoulos L, Terzopoulou Z, Bikiaris DN, Patsiaoura D, Chrissafis K, Gazzano M, Lotti N, Papageorgiou GZ. Synthesis, Thermal Properties and Decomposition Mechanism of Poly(Ethylene Vanillate) Polyester. Polymers. 2019; 11(10):1672. https://doi.org/10.3390/polym11101672
Chicago/Turabian StyleZamboulis, Alexandra, Lazaros Papadopoulos, Zoi Terzopoulou, Dimitrios N. Bikiaris, Dimitra Patsiaoura, Konstantinos Chrissafis, Massimo Gazzano, Nadia Lotti, and George Z. Papageorgiou. 2019. "Synthesis, Thermal Properties and Decomposition Mechanism of Poly(Ethylene Vanillate) Polyester" Polymers 11, no. 10: 1672. https://doi.org/10.3390/polym11101672