Facile Synthesis of Nitrogen-Doped Carbon Quantum Dots with Chitosan for Fluorescent Detection of Fe3+


1
School of Chemistry and Chemical Engineering, Qingdao University, Qingdao 266071, China
2
State Key Laboratory of Bio-fibers and Eco-textiles, Shandong Collaborative Innovation Center of Marine Biobased Fibers and Ecological Textiles, Institute of Marine Biobased Materials, Qingdao University, Qingdao 266071, China
*
Author to whom correspondence should be addressed.
Polymers 2019, 11(11), 1731; https://doi.org/10.3390/polym11111731
Submission received: 7 September 2019
/
Revised: 17 October 2019
/
Accepted: 19 October 2019
/
Published: 23 October 2019
Abstract
:A facile, economical, and one-step hydrothermal method was used to prepare highly luminescent nitrogen-doped carbon quantum dots (N-CQDs) with chitosan as both carbon and nitrogen sources. The as-prepared N-CQDs have an average size of 2 nm and exhibit excitation wavelength-dependent fluorescence with a maximum excitation and emission at 330 and 410 nm, respectively. Furthermore, due to the effective quenching effect of Fe3+ ions, the prepared N-CQDs can be used as a fluorescent sensor for Fe3+ ion-sensitive detection with a detection limit of 0.15 μM. The selectivity experiments revealed that the fluorescent sensor is specific to Fe3+ even with interference by high concentrations of other metal ions. Most importantly, the N-CQD-based Fe3+ ion sensor can be successfully applied to the determination of Fe3+ in real water samples. With excellent sensitivity and selectivity, such stable and cheap carbon materials are potentially suitable for the monitoring of Fe3+ in environmental application.

1. Introduction
Carbon quantum dots (CQDs), a kind of novel zero-dimensional nanomaterial, have attracted great interest due to their unique optical properties, good water solubility, high stability, low toxicity, excellent biocompatibility, and low environmental impact [1]. This newly discovered material has a wide range of potential applications, including fluorescent inks [2], bioimaging [3], photocatalysis [4], medical diagnosis [5], sensing [6], and ion detection [7]. Since the discovery of carbon dots, various methods for synthesizing carbon dots have been discovered, such as arc discharge [8], laser ablation [9], electrochemical synthesis [10], and microwave heating [11], hydrothermal synthesis [12]. Among them, hydrothermal synthesis is considered to be the most accessible method because of its simple operating conditions, low energy consumption, and low-cost apparatus. Additionally, although the study on the preparation of CQDs has gradually matured, more and more researchers are paying attention to the preparation of CQDs by green, low-cost, natural precursors, especially waste biomass materials, because they have the advantages of low cytotoxicity, high biocompatibility, and lower price compared to traditional CQDs and organic fluorescent dyes.
The iron ion is one of the heavy metal ions that induce many environmental issues. After heavy metals are released into the environment, even at low concentrations, they can have serious effects on the surrounding environment and organisms [13]. Iron ions are one of the most abundant elements on earth and a necessary trace element for biological processes [14]. It plays an important role in environmental, industrial, human, and biological systems. As we all know, the Fe3+ ion is the basic element of the heme group and plays an important role in oxygen metabolism [15]. However, its deficiency, beyond the normal allowable limits, may interfere with the balance of cellular processes and may lead to serious diseases, such as organ failure, Alzheimer’s disease, inflammation, or even death. The U.S. Environmental Protection Agency (EPA) has set limits for iron in drinking water and food to 0.3 ppm (∼5.4 μM) [16]. Therefore, the development of an effective sensing system for selective and sensitive analysis of Fe3+ ions is of great significance for practical applications. To date, a variety of well-established methods for the detection of Fe3+ ions have been reported, such as inductively coupled plasma mass spectrometry (ICP-MS) [17], spectrophotometry [18], atomic absorption spectrometry (AAS) [19], and electrochemical methods [20]. However, these methods have their own limitations, for example, highly specialized instruments with complicated procedures that involve time-consuming analytical processes and high cost [21]. Due to the cheap equipment, simple operation, fast response, and high sensitivity, fluorescence spectroscopy has been widely used in the detection of iron ions [22].
Chitosan is a natural polysaccharide with excellent biocompatibility and biodegradability, consisting of β-(1-4)-linked D-glucosamine and N-acetyl-D-glucosamine, and is obtained by the partial deacetylation of chitin derived from crustacean shells [23,24]. Due to its unique properties such as biocompatibility, biodegradability, non-toxicity, antibacterial properties, heavy metal ion sequestration, and hydrophilicity, chitosan is widely used in biology, medicine, food, cosmetics, industry, and other fields [25,26,27]. Due to the large amount of amino groups (-NH2) and hydroxyl groups (-OH) present in the structure [28], it has natural chelating properties that can be combined and used to remove heavy metal ions from water. Therefore, there is growing interest to explore the use of chitosan in water treatment for the removal of heavy metals [29,30]. In this work, water-soluble nitrogen-doped carbon quantum dots (N-CQDs) were synthesized via the hydrothermal method with chitosan as carbon and nitrogen sources. The prepared N-CQDs could be used to selectively and sensitively detect Fe3+ in practical aqueous solutions.
2. Experimental Section
2.1. Materials
Chitosan (deacetylation degree 82.5%) was prepared in our lab with shrimp shell, which is usually discarded as shellfish waste in the fishing and seafood industries. The deacetylation degree was determined by the titration method [31]. All metal salts (CdCl2, MgCl2, FeCl3, FeCl2, CuCl2, Pb(NO3)2, Ni(NO3)2, AgNO3, ZnCl2, AlCl3, NaCl, Co(NO3)2, CaCl2, BaCl2, HgCl2) were purchased from Beijing Chemical Reagents Factory (Beijing, China). All chemicals were of analytical grade and used directly without further purification. Ultrapure water was used in all the experiments.
2.2. Synthesis of N-CQDs
Luminescent and biocompatible chitosan-based N-CQDs were prepared by a facile hydrothermal synthetic strategy. The detailed preparation process is supplied in the Supplementary Materials.
2.3. Material Characterization
Transmission electron microscopy (TEM) and high-resolution transmission electron microscopy (HRTEM) were performed on a JEM-1200 EX (JEOL, Tokyo, Japan) field-emission transmission electron microscope, operating at an accelerating voltage of 100 kV. X-ray diffraction (XRD) patterns were recorded on a powder X-ray diffractometer (D/MAX-RB, Tokyo, Japan) measured with CuKα radiation (λ = 0.15418 nm) in the 2θ range from 10° to 90°. Fourier-transform infrared spectroscopy (FT-IR) was obtained on a spectrometer (NICO- LET5700, ThermoFisher Scientific, Waltham, MA, USA) by the KBr tablet method. The spectral scanning range was 400–4000 cm−1 at a resolution of 4 cm−1. X-ray photoelectron spectroscopy (XPS) analysis was performed on an ESCALAB 250 electronic spectrometer (ThermoFisher Scientific, Waltham, MA, USA). UV-vis spectra of N-CQDs were recorded using a spectrophotometer (TU-19, Beijing General Analysis Instrument Co., Ltd., Beijing, China) scanning in the range of 200–500 nm. Fluorescence spectra were obtained with a Fluoromax–4 Spectrofluorometer (HORIBA, Kyoto, Japan).
2.4. Detections of Fe3+
The selectivity to Fe3+ ions was measured by adding different metal ion stock solutions in the same way. Typically, the prepared N-CQDs solutions were diluted 10 times using deionized water; then, 150 μL of 10 mM of each metal ion (Cd2+, Mg2+, Fe3+, Fe2+, Cu2+, Pb2+, Ni2+, Ag+, Zn2+, Al3+, Na+, Co2+, Ca2+, Ba2+, Hg2+) was added to 3 mL of diluted N-CQD solution. The fluorescence spectra were recorded under excitation at 330 nm. A slit width of 5 nm was used for both excitation and emission. The dose-dependent response of N-CQDs to Fe3+ was further investigated. Various amounts of Fe3+ were added to 3 mL of the diluted N-CQD solution, and the emission intensity of the N-CQDs at 400 nm was recorded under 330 nm excitation. The same volume without Fe3+ was applied as the negative control.
2.5. Real Sample Analysis
Analysis of real samples was used to test the practicality of N-CQDs in detecting Fe3+ ions in water. Tap water was collected from our lab and lake water was obtained from the lake at Qingdao University. The amount of Fe3+ was estimated using the standard addition method. For recovery studies, known concentrations of Fe3+ solution were added to the samples and the total iron concentrations were then determined at the same condition.
3. Results and Discussion
3.1. Preparation and Characterization of N-CQDs
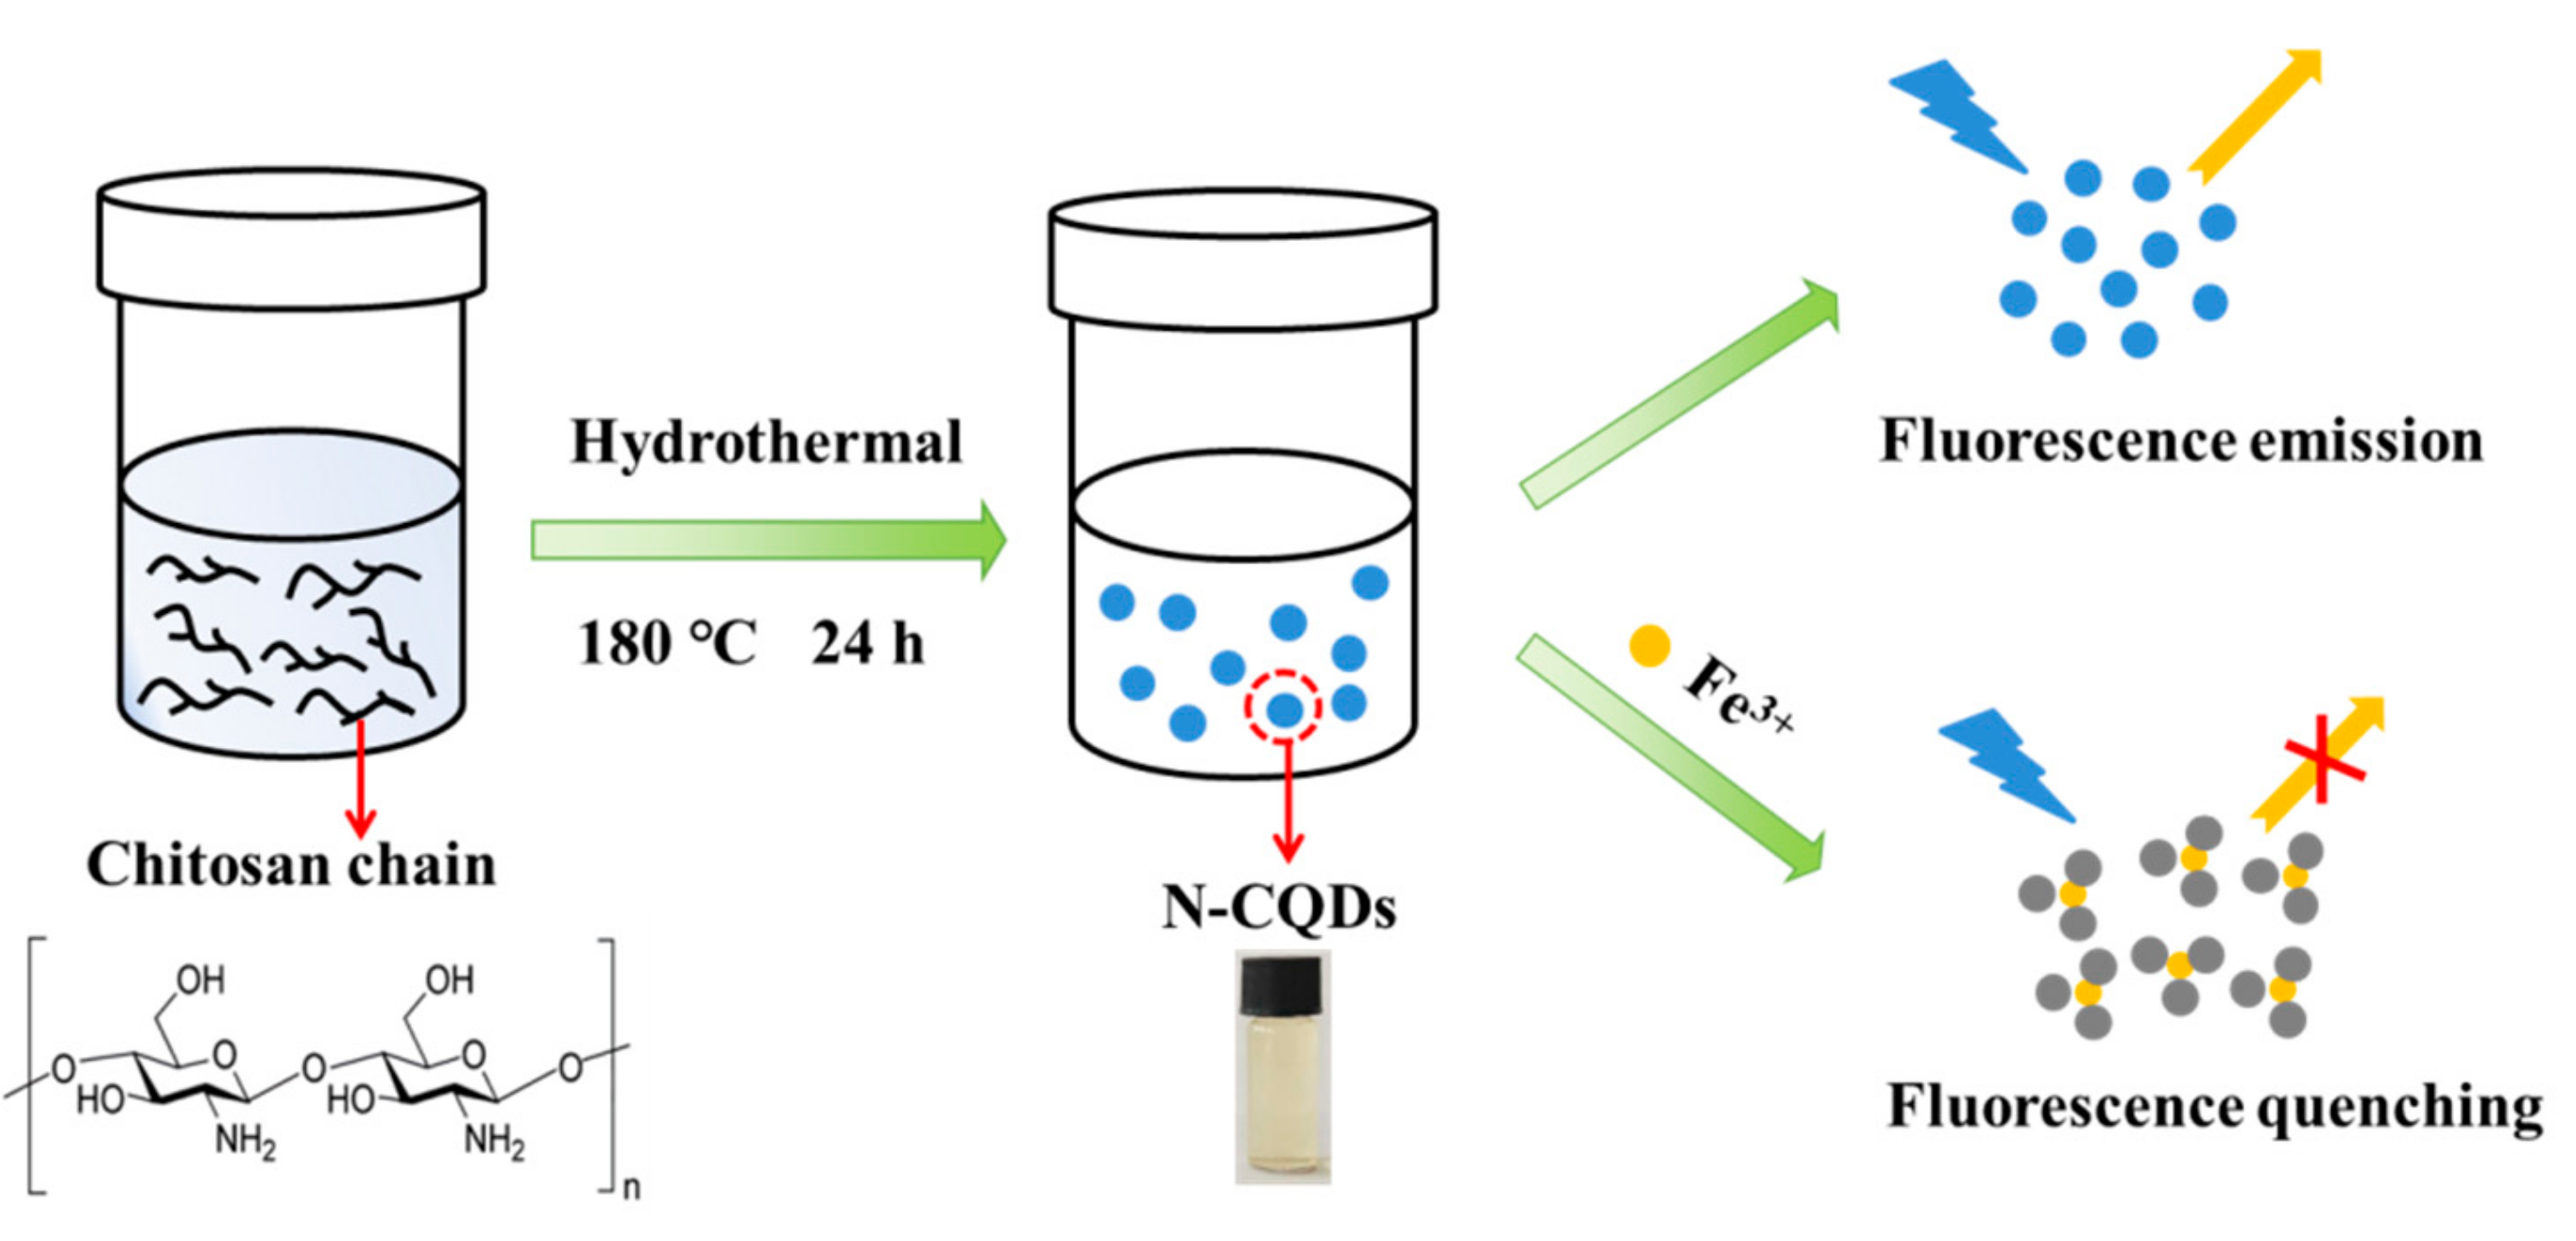
In the present study, water-soluble nitrogen-doped carbon quantum dots (N-CQDs) were prepared by the hydrothermal method with chitosan as both carbon and nitrogen sources (Scheme 1). The as-prepared N-CQDs were well-dispersed yellow solution, which exhibited strong blue fluorescence under UV irradiation (365 nm). The N-CQDs contain a large number of nitrogen-containing (-NH2) and oxygen-containing (-OH and -COOH) groups, which can strongly interact with analytes [32]. When iron ions were added to the carbon dot solution, the fluorescence was quenched under UV irradiation (365 nm), which can be discerned by the naked eye. Therefore, a fluorescence sensor based on N-CQDs was constructed and its sensing properties were investigated in detail.
The morphology of the prepared N-CQDs was characterized by TEM and HRTEM. As shown in Figure 1a, the N-CQDs were well-distributed and uniform in size. The size distribution showed a Gaussian fitting curve and a narrow distribution range of 1–4 nm with an average size of about 2 nm (Figure 1b). The HRTEM image of N-CQDs showed well-resolved lattice fringes with an average in-plane lattice spacing of 0.213 nm (Figure 1c), which is very close to the (110) diffraction facets of graphite. This implies that the NCQDs possess a graphite-like structure. The XRD pattern of N-CQDs is shown in Figure 1d. A broad diffraction peak of about 23° (d002 = 0.34 nm) and a weak peak at 43.4° (d100 = 0.21 nm) were observed in the N-CQDs, revealing an amorphous carbon phase and partial graphitization of the N-CQDs, which are attributed to the existence of abundant functional groups and the graphitization of carbon atoms, respectively. These results further confirm that a graphite structure exists in the carbon core of N-CQDs.
The structure and composition of N-CQDs were investigated by FT-IR spectroscopy (Figure 2). For the pure chitosan powder, the obvious peaks at 3459 cm−1 were ascribed to the O–H and N–H stretching vibration, and the absorption bands at 2956 cm−1 were attributed to the C–H stretching vibration. The absorption band at 1572 cm−1 was assigned to the N–H bending vibration of the primary amino group. The peak at 1441 cm−1 was due to C–N stretching vibrations. The peaks at 1638 and 1324 cm−1 were ascribed to the vibrations of C=O and C–O bonds, respectively. Compared to chitosan, N-CQDs showed an apparent decrease in the adsorption of O–H and N–H stretching vibrations at 3462 cm−1, and C–H vibrations at 1130 cm−1, related to the pyranose, almost disappeared, indicating the degradation of the chitosan chain and decomposition of the pyranose ring through dehydration. Additionally, FT-IR analysis confirmed the presence of amine, hydroxyl, and carbonyl functionality in the surface of N-CQDs.
XPS was also used to characterize the N-CQDs. As shown in Figure 3, the as-prepared N-CQDs contained mainly carbon, nitrogen, and oxygen with their atomic percentages of 72.3%, 6.32%, and 21.38%, respectively (Figure 3a). Furthermore, the high-resolution spectrum of C1s could be deconvoluted into three main peaks at 284.4, 285.2, and 286.5 eV, which could be attributed to sp2 carbon (C–C/C=C), sp3 carbon C–N, and C–O [33], respectively. The characteristic peak of C–C sp2 appearing at 284.4 eV indicates that abundant graphite structures should be contained in the obtained N-CQDs (Figure 3b). The high-resolution spectrum for N1s exhibited two peaks at 399.2 and 400.3 eV, which could be assigned to C–N–C and N–H (Figure 3c), respectively [34]. The high-resolution spectrum for O1s showed a symmetrically shaped peak with a binding energy of 532.1 eV, indicating that the environment of O atoms is uniform in N-CQDs. These data further confirm that the N atom has been successfully doped into CQDs, and functional groups such as C–N, C=C, O–H, and N–H coexisted on the CQD surface.
3.2. Optical Properties of N-CQDs
As shown in Figure 4a, the optical properties of the N-CQDs showed a strong absorption band centered at 285 nm, which is attributed to the n–π* transition of C=O, caused by the trapping of the excited state energy of the surface states, which can lead to strong fluorescence. Accordingly, the maximum excitation wavelength was detected at 330 nm. When excited at 330 nm, the N-CQDs exhibited a strong fluorescence emission peak at 410 nm. In addition, in this work, highly fluorescent N-CQDs were fabricated by the hydrothermal carbonization of chitosan. The optimum carbonization time was investigated, as elaborated in Figure S1. The fluorescence intensity increased with the increase in carbonization time. After six hours of carbonization, the chitosan solution turned light yellow in color, while the solution displayed strong blue luminescence under the UV light lamp with excitation at 365 nm. Here, the N-CQDs with carbonization for 24 h were selected for subsequent experiments. Moreover, detailed emission fluorescence spectra of the N-CQDs with different excitation wavelengths were also investigated. Apparently, the emission wavelength of N-CQDs was nearly excitation-dependent, and the maximum emission wavelength shifted from 400 to 480 nm when the excitation wavelength was increased gradually from 300 to 390 nm (Figure 4b), which may be determined by the distribution of different sizes and multi-surface emission sites of N-CQDs [33,35]. Moreover, with the increase in excitation wavelength, the fluorescence intensity of N-CQDs first increased and then decreased, accompanied by a red shift, reaching its maximum at the excitation wavelength of 330 nm. Some works on carbon dots also indicate that the optical properties of carbon dots possibly correspond to fluorescent surface groups [36,37,38]. Additionally, it should be pointed out that the prepared N-CQDs exhibit excellent water solubility and high stability at room temperature. Even after three months of storage in air, no floating or precipitated nanoparticles were observed, and there was no significant loss of photobleaching after 3 h of exposure to a 365 nm ultraviolet lamp, indicating their advantages in potential applications.
3.3. Detection of Metal Ions
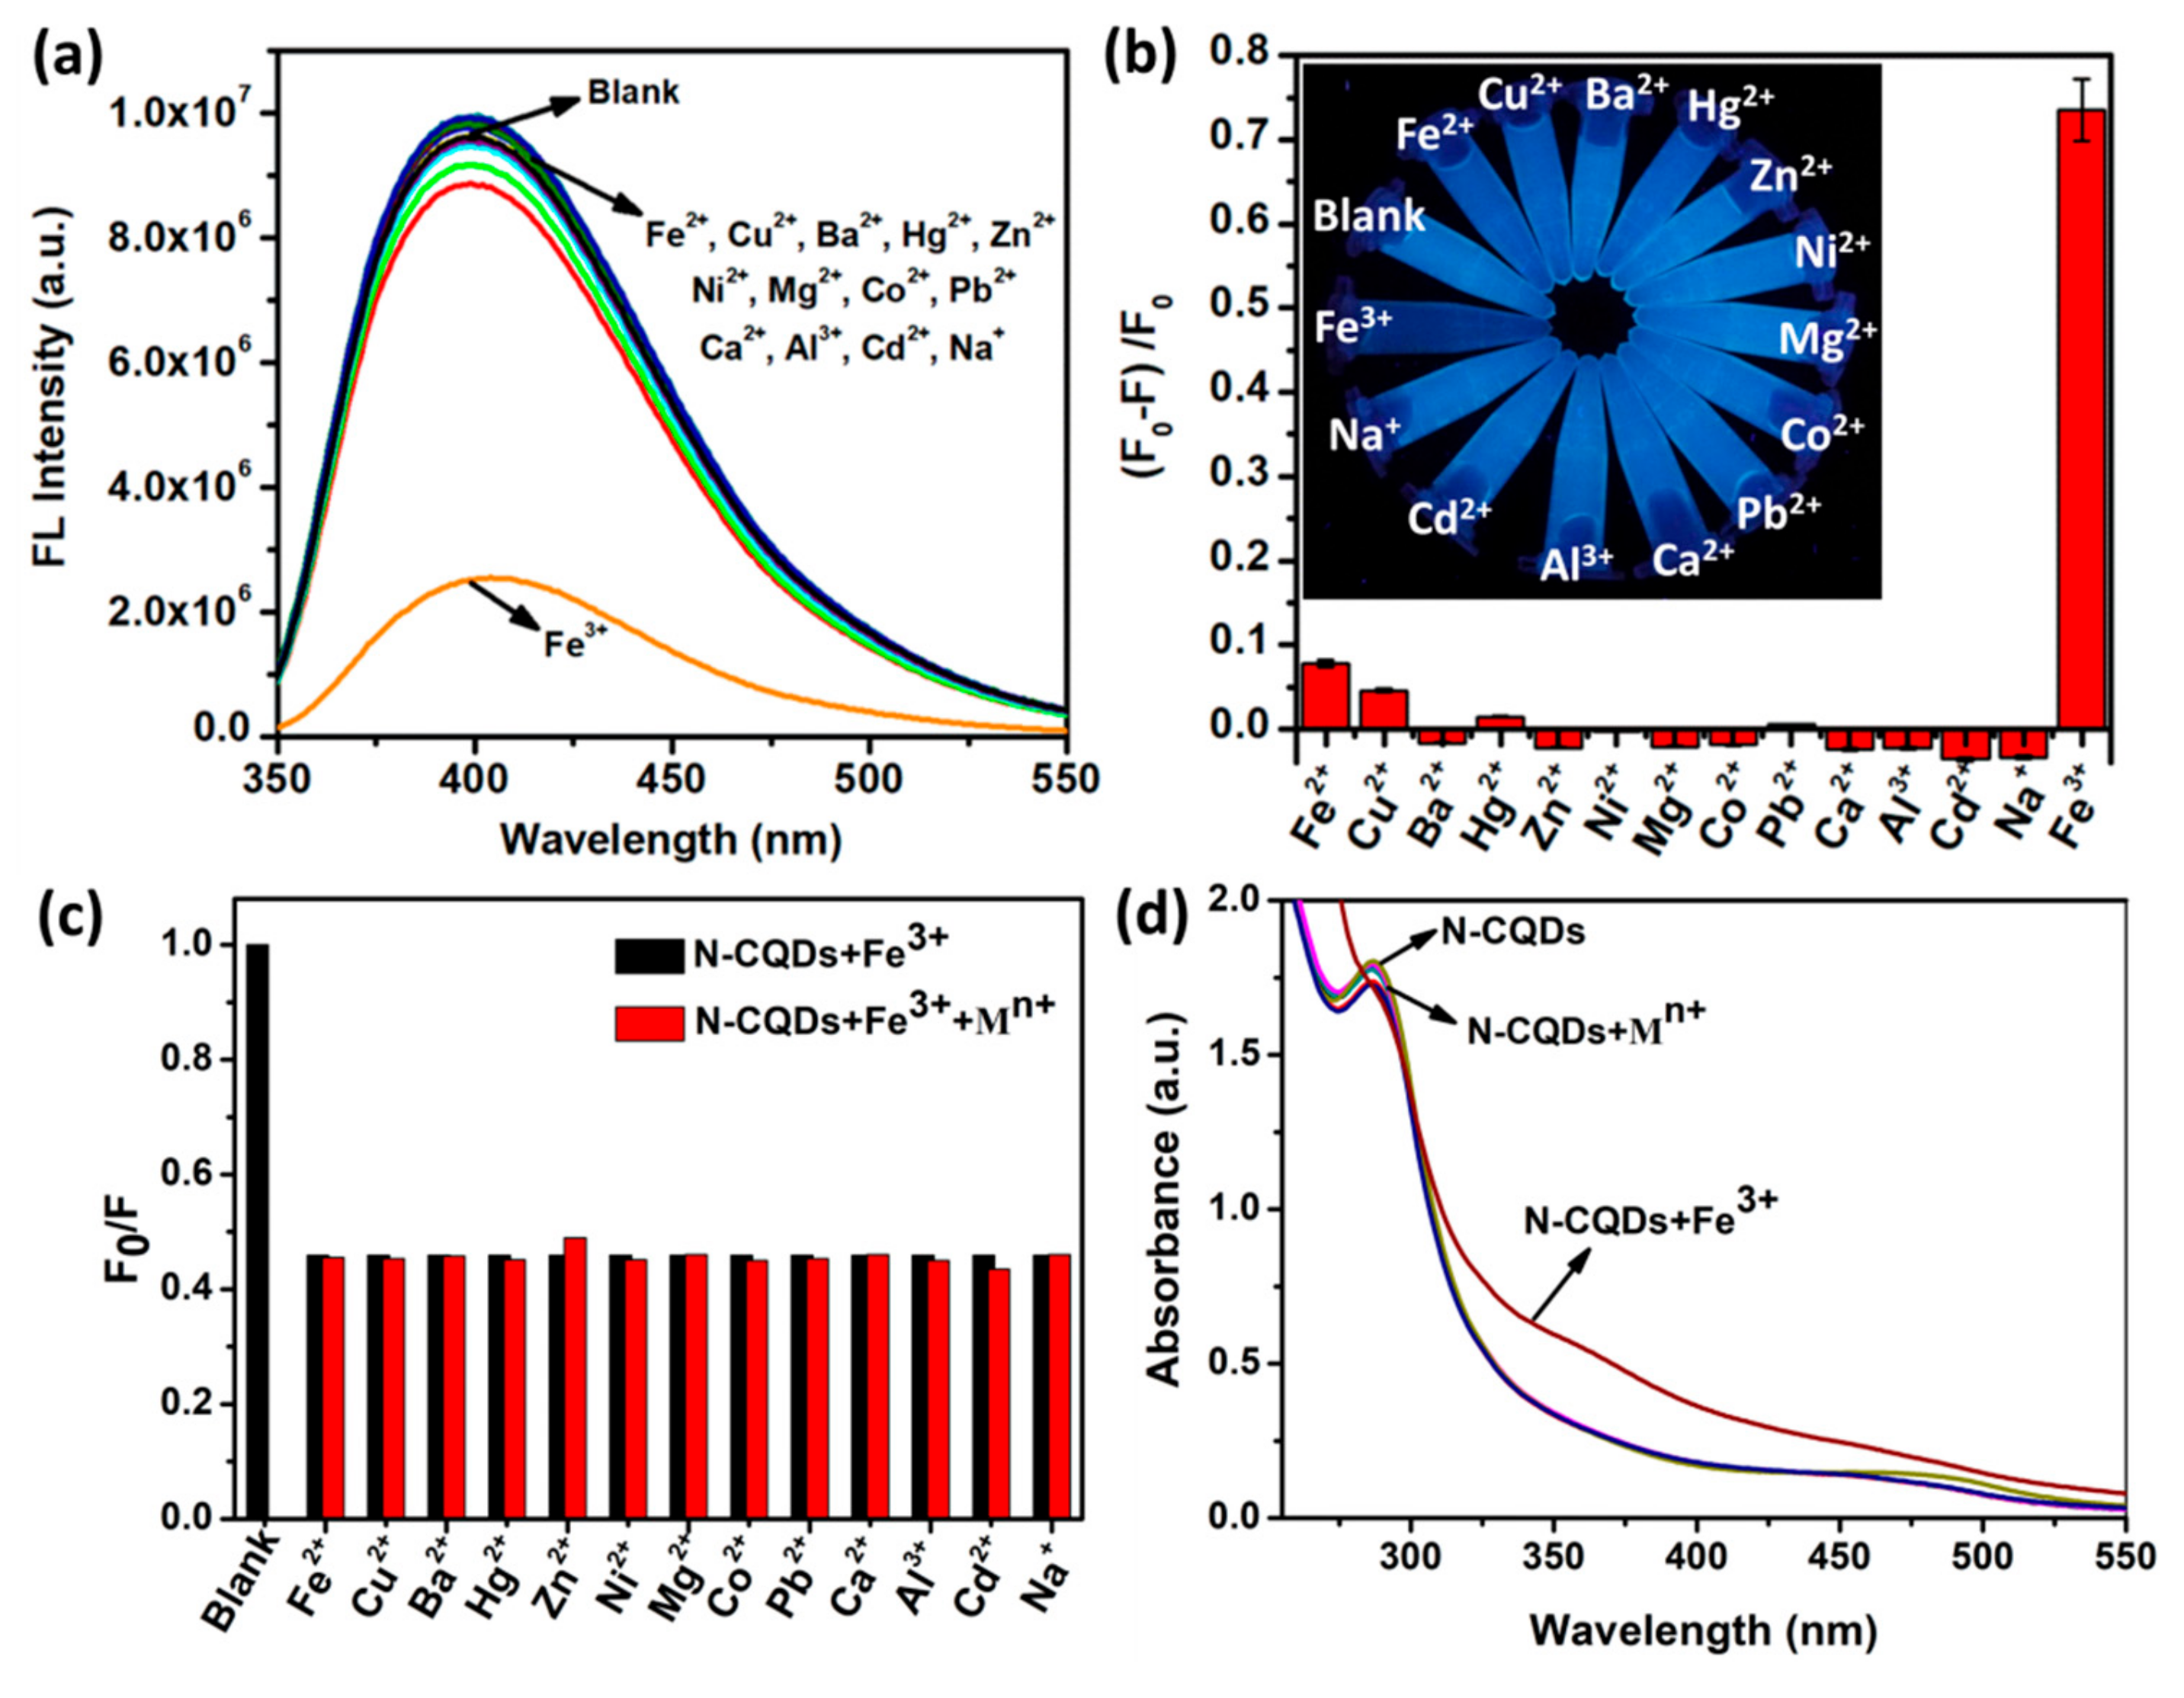
To evaluate the selectivity of N-CQDs as a fluorescent probe for Fe3+ detection, 150 μL of different metal ions was added to 3 mL N-CQD solution, each at a fixed concentration of 500 µM, and their effects on the fluorescent intensity of N-CQDs were recorded after metal ion addition at room temperature. Figure 5a,b present different quenching effects with various metal ions. Among them, Fe2+, Cu2+, Ba2+, Hg2+, Zn2+, Ni2+, Mg2+, Co2+, Pb2+, Ca2+, Al3+, Cd2+, and Na+ metal ions showed a slight change in fluorescence intensity. However, compared to the other metal ions, Fe3+ ions caused remarkable fluorescence quenching of N-CQDs.
In other interference tests, 100 μM of Fe3+ alone (black bars in Figure 5c) and the mixtures of 100 μM of Fe3+ and 100 μM of the above-mentioned metal ions (red bars in Figure 5c) were added into the N-CQD aqueous solution, and the quenching effects of Fe3+ and the mixtures of Fe3+ and Mn+ on the fluorescence of the N-CQDs were then examined. The results show that the coexistence of other ions had little effect on the fluorescence quenching of Fe3+ to N-CQDs and could even be neglected. These results demonstrate that the N-CQD sensor was insensitive to other metal ions but selective to Fe3+ in the mixtures. In addition, the effects of various metal ions on the UV-vis absorption spectrum of N-CQDs were also investigated. As shown in Figure 5d, the UV-vis absorption of N-CQDs changed significantly after adding 100 μM Fe3+, and the absorption at 285 nm disappeared. However, the absorption spectra remained almost unchanged after adding the same concentration of other metal ions. The possible reason is that the presence of Fe3+ can affect the surface states of quantum dots. The above results strongly prove that the N-CQD sensor has a strong selectivity for Fe3+ sensing.
The experimental results indicate that Fe3+ could effectively quench the fluorescence of N-CQDs, implying the potential of N-CQDs as a fluorescence probe for the detection of Fe3+. In order to obtain the optimal response signal, before quantitative analysis of Fe3+, the detection conditions, including pH and reaction time, were investigated. Figure S2 shows the fluorescence intensity of N- CQDs at different pH values with 500 µM of Fe3+ ion. As can be seen from the figure, when the pH was 2, the fluorescence intensity of N-CQDs was almost unchanged. As the pH value increased from 3.0 to 11.0, the fluorescence quenching efficiency increased rapidly and reached a maximum under pH = 7.0. From the KSP calculation of Fe(OH)3, when the pH is about 2, Fe(OH)3 precipitation begins to appear in the water solution. Fe3+ exists in hydroxide in the alkaline solution, which probably goes against the accurate detection of Fe3+ [39]. However, in our reaction system, it is a solution of carbon quantum dots, not pure water solution, and when iron ions are added to the solution, the iron ions probably react with the N-CQDs. Therefore, there is no obvious precipitation of Fe(OH)3 even under alkaline conditions. The result clearly indicates that the probe N-CQDs can be used within a broad range of pH values (3.0−11.0). Figure S3 shows that the fluorescence of N-CQDs was quenched rapidly after the addition of Fe3+ ions within 2 min. In the next experiments, 5 min was selected as the optimum reaction time to obtain stable and accurate experimental results.
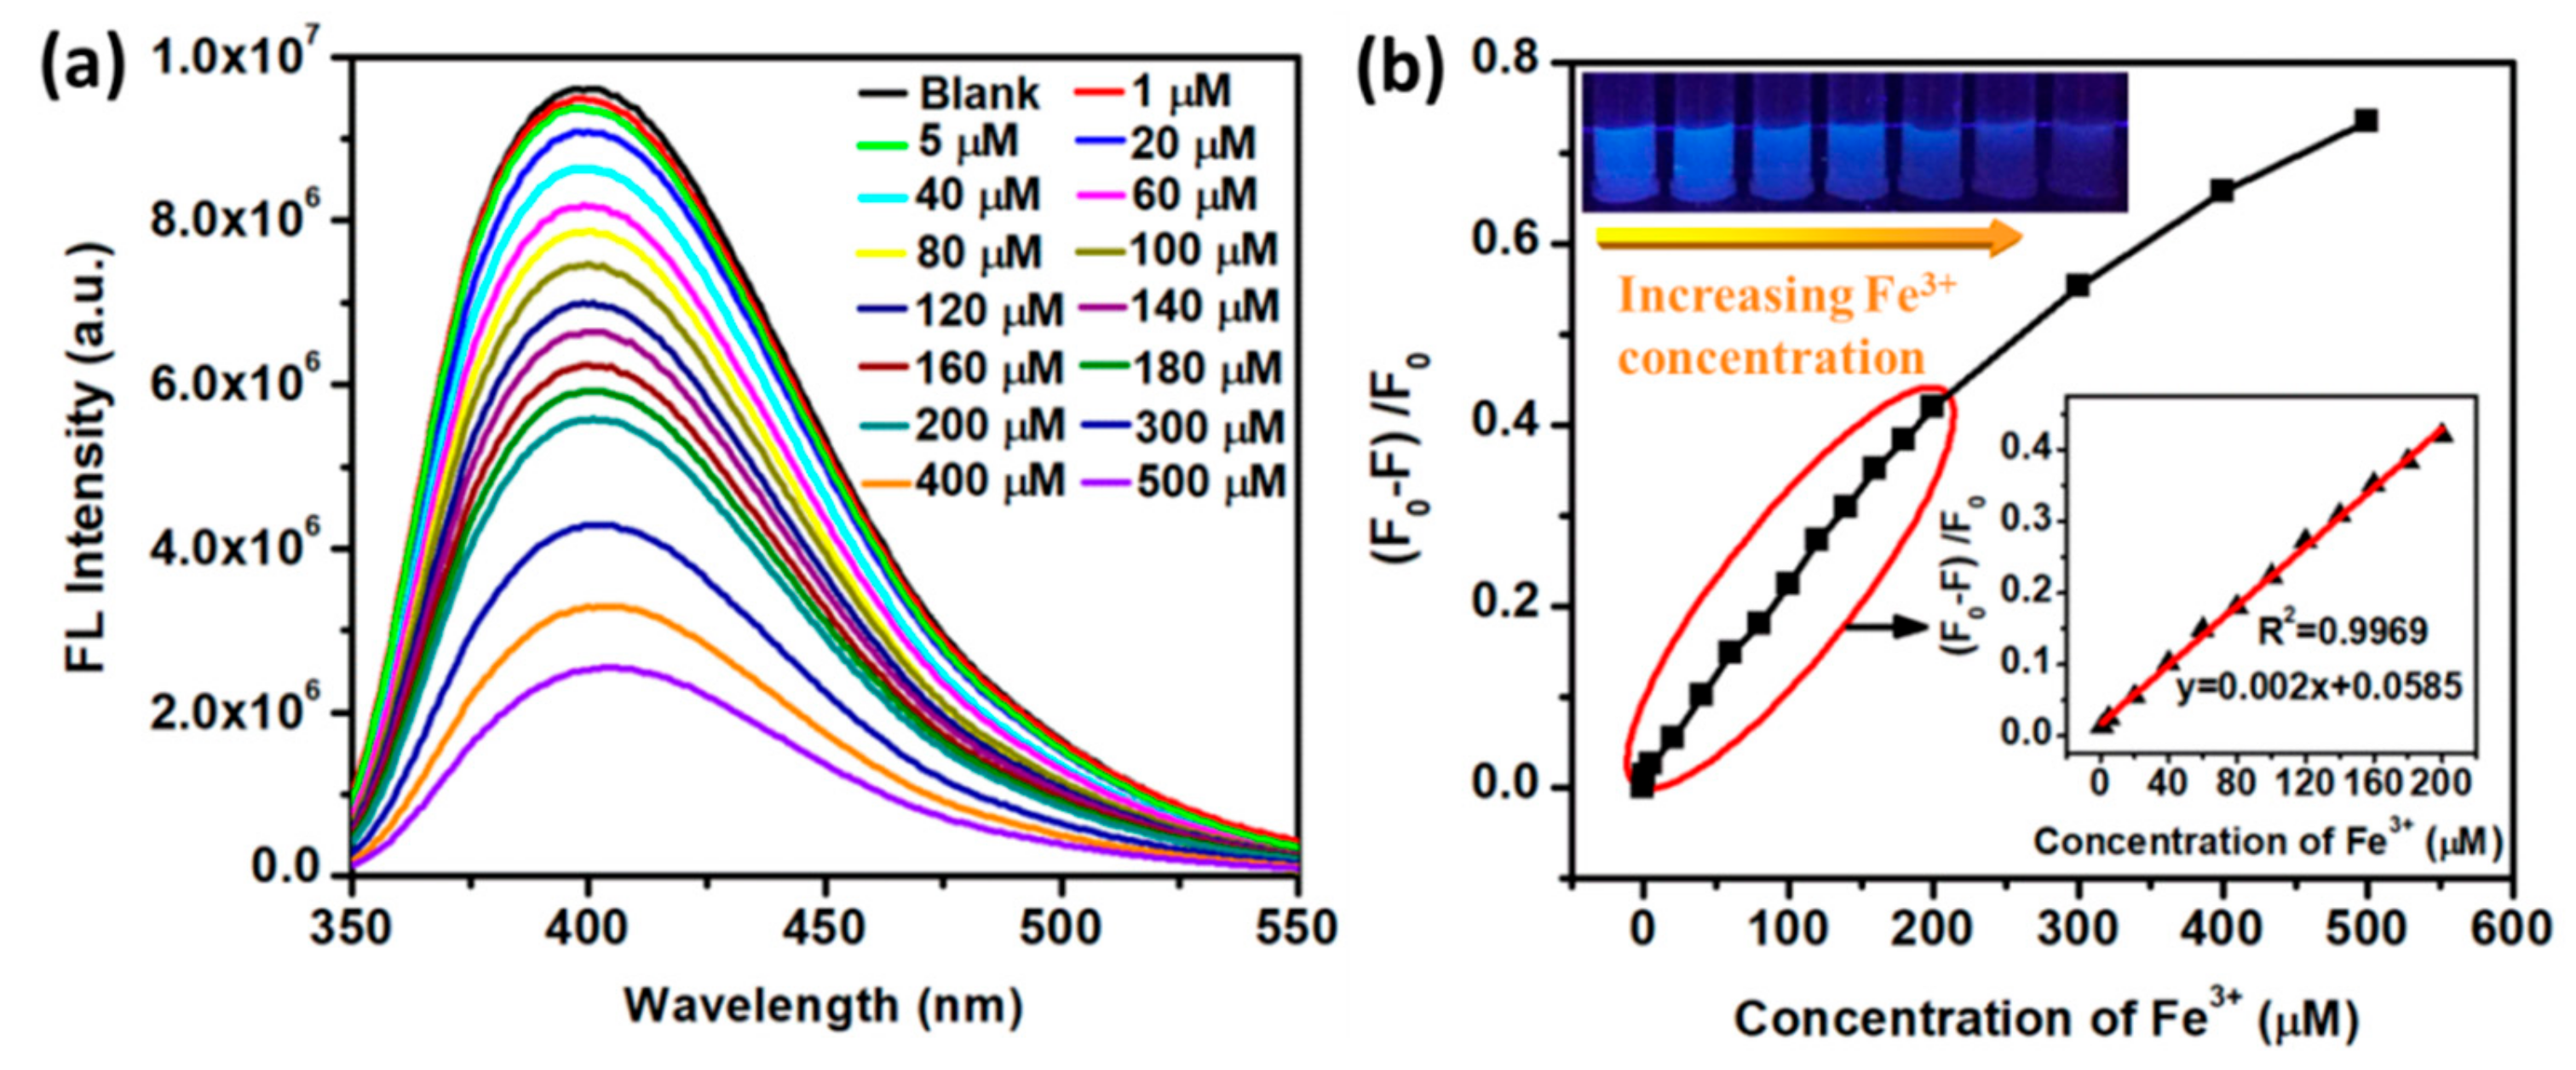
Under the optimum conditions, the sensitivity of N-CQDs to Fe3+ determination was measured. The fluorescence intensity of N-CQDs at 410 nm gradually decreased with the increase in the Fe3+ concentration from 0 to 500 μM (Figure 6a). More importantly, there was a good linear relationship between the fluorescence quenching efficiency (F0 – F)/F0 and the Fe3+ ion concentration within the range of 1–200 μM (Figure 6b). The linear regression equation is (F0–F)/F0 = 0.002C + 0.0585, R2 = 0.9969, where F0 and F are the fluorescence intensity of N-CQDs before and after the addition of Fe3+, respectively. In addition, the detection limit was estimated to be 0.15 μM at a signal-to-noise ratio of 3 [40], which is much lower than recently published assays based on CDs from different precursors (Table 1). Therefore, the N-CQDs could potentially be used as a sensor for Fe3+ ion detection. In addition, the detection limit and linear range of this proposed method were compared to other reported CQD-based sensors. As shown in Table 1, this method provides a lower detection limit and a comparable wide linear range. Therefore, we believe that our present method can be applied to the detection of Fe3+ ions.
3.4. Fluorescence Quenching Mechanism of the N-CQD-Fe3+ System
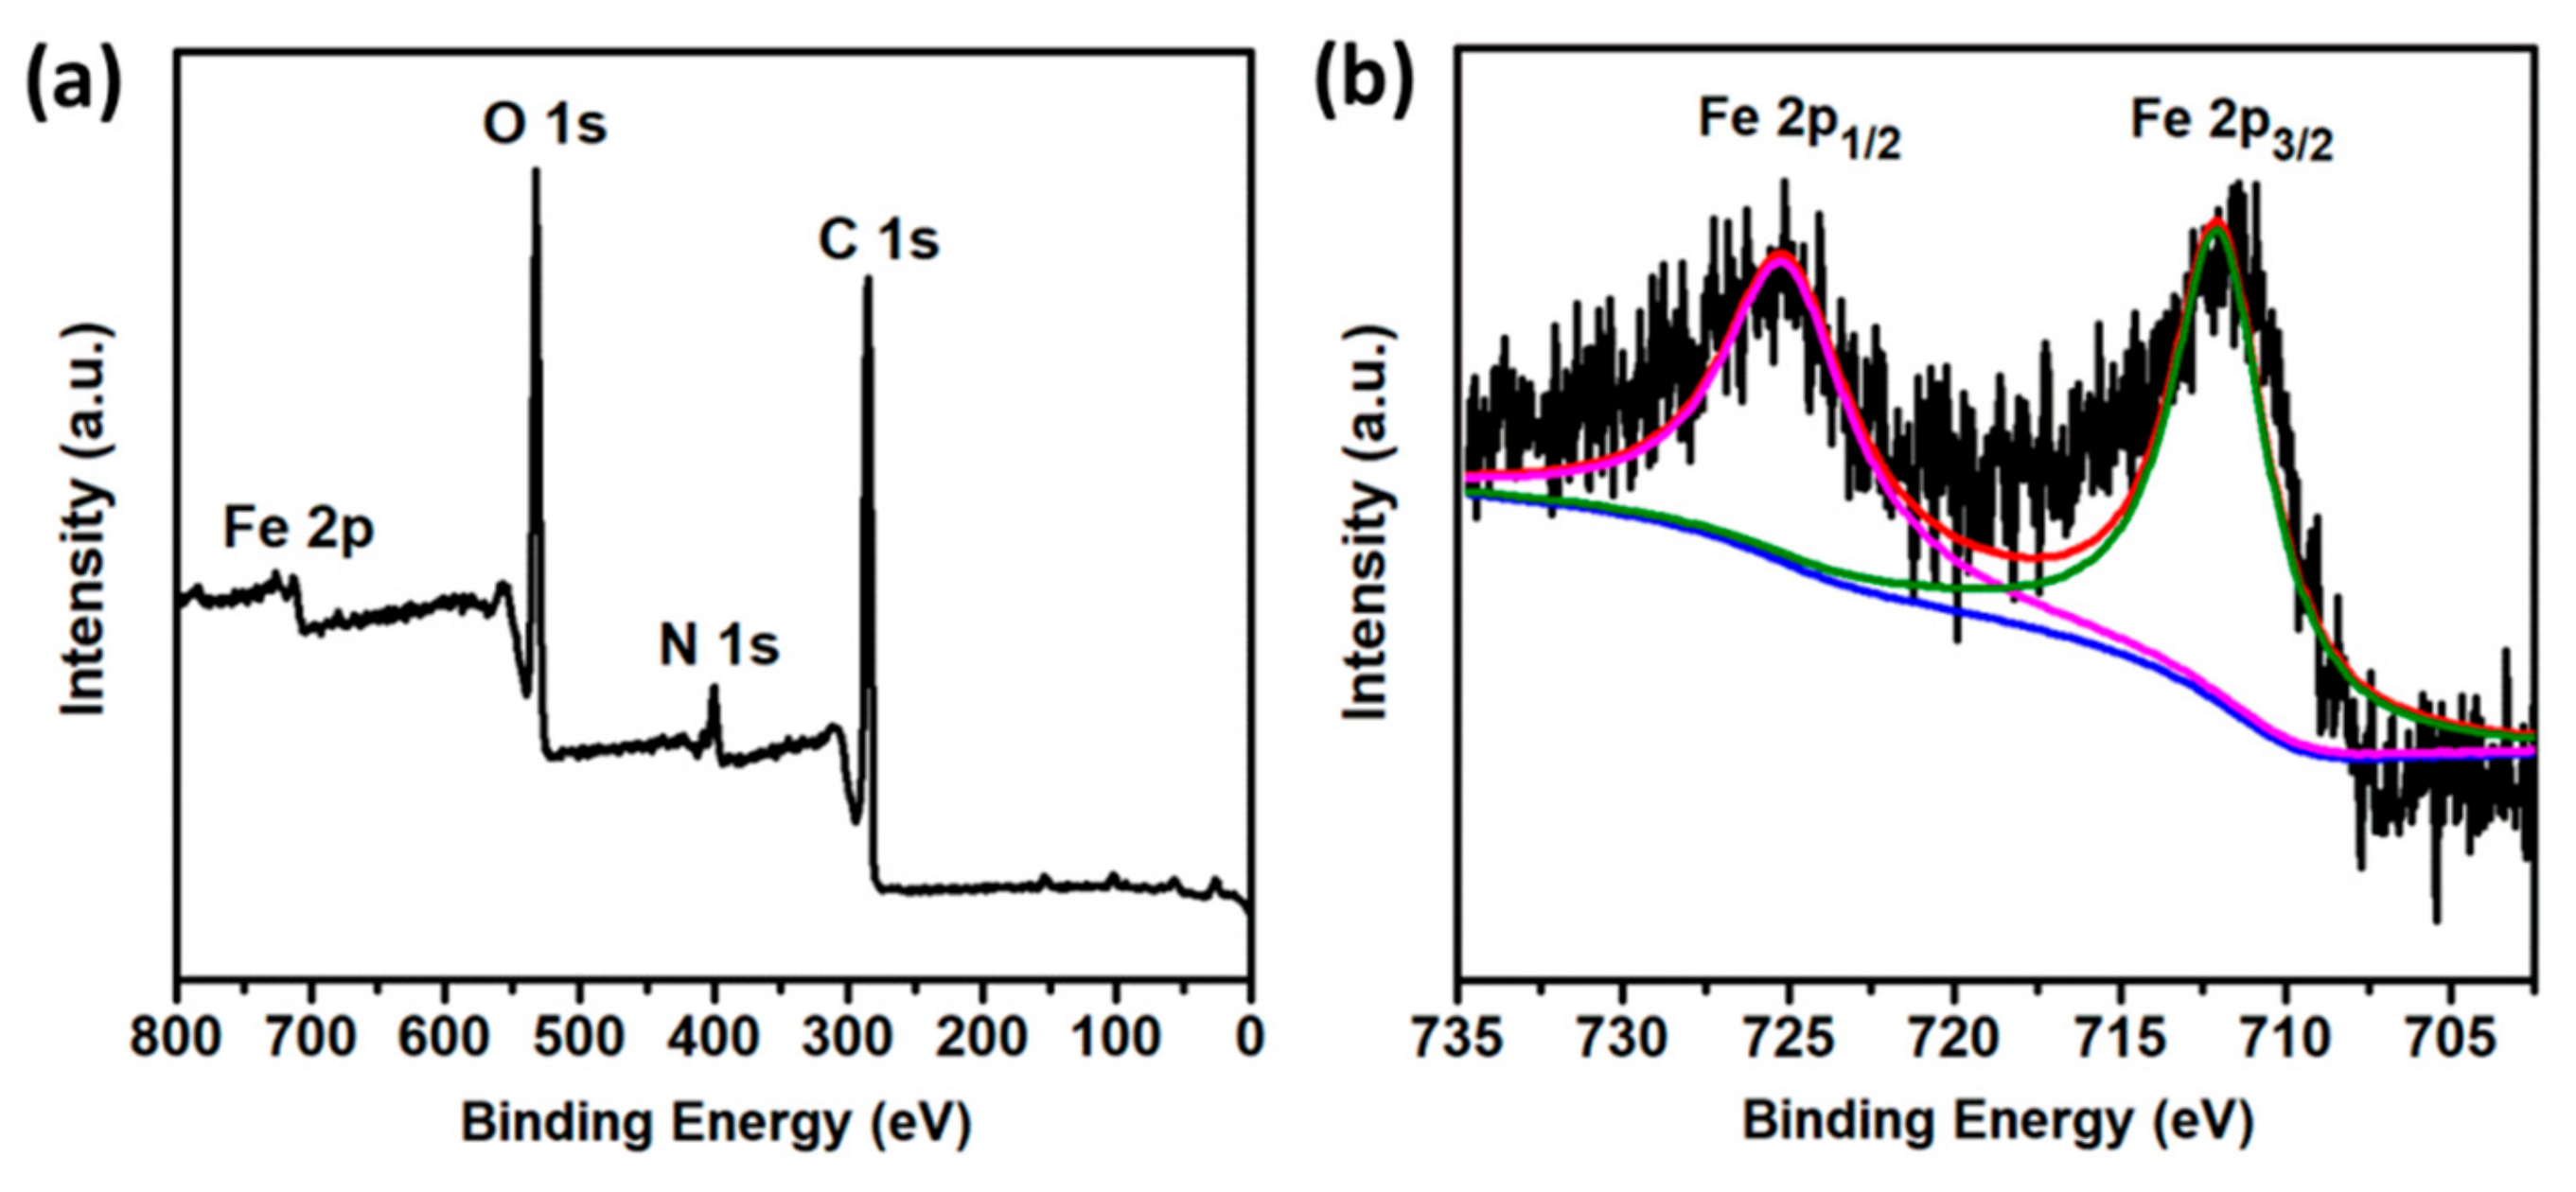
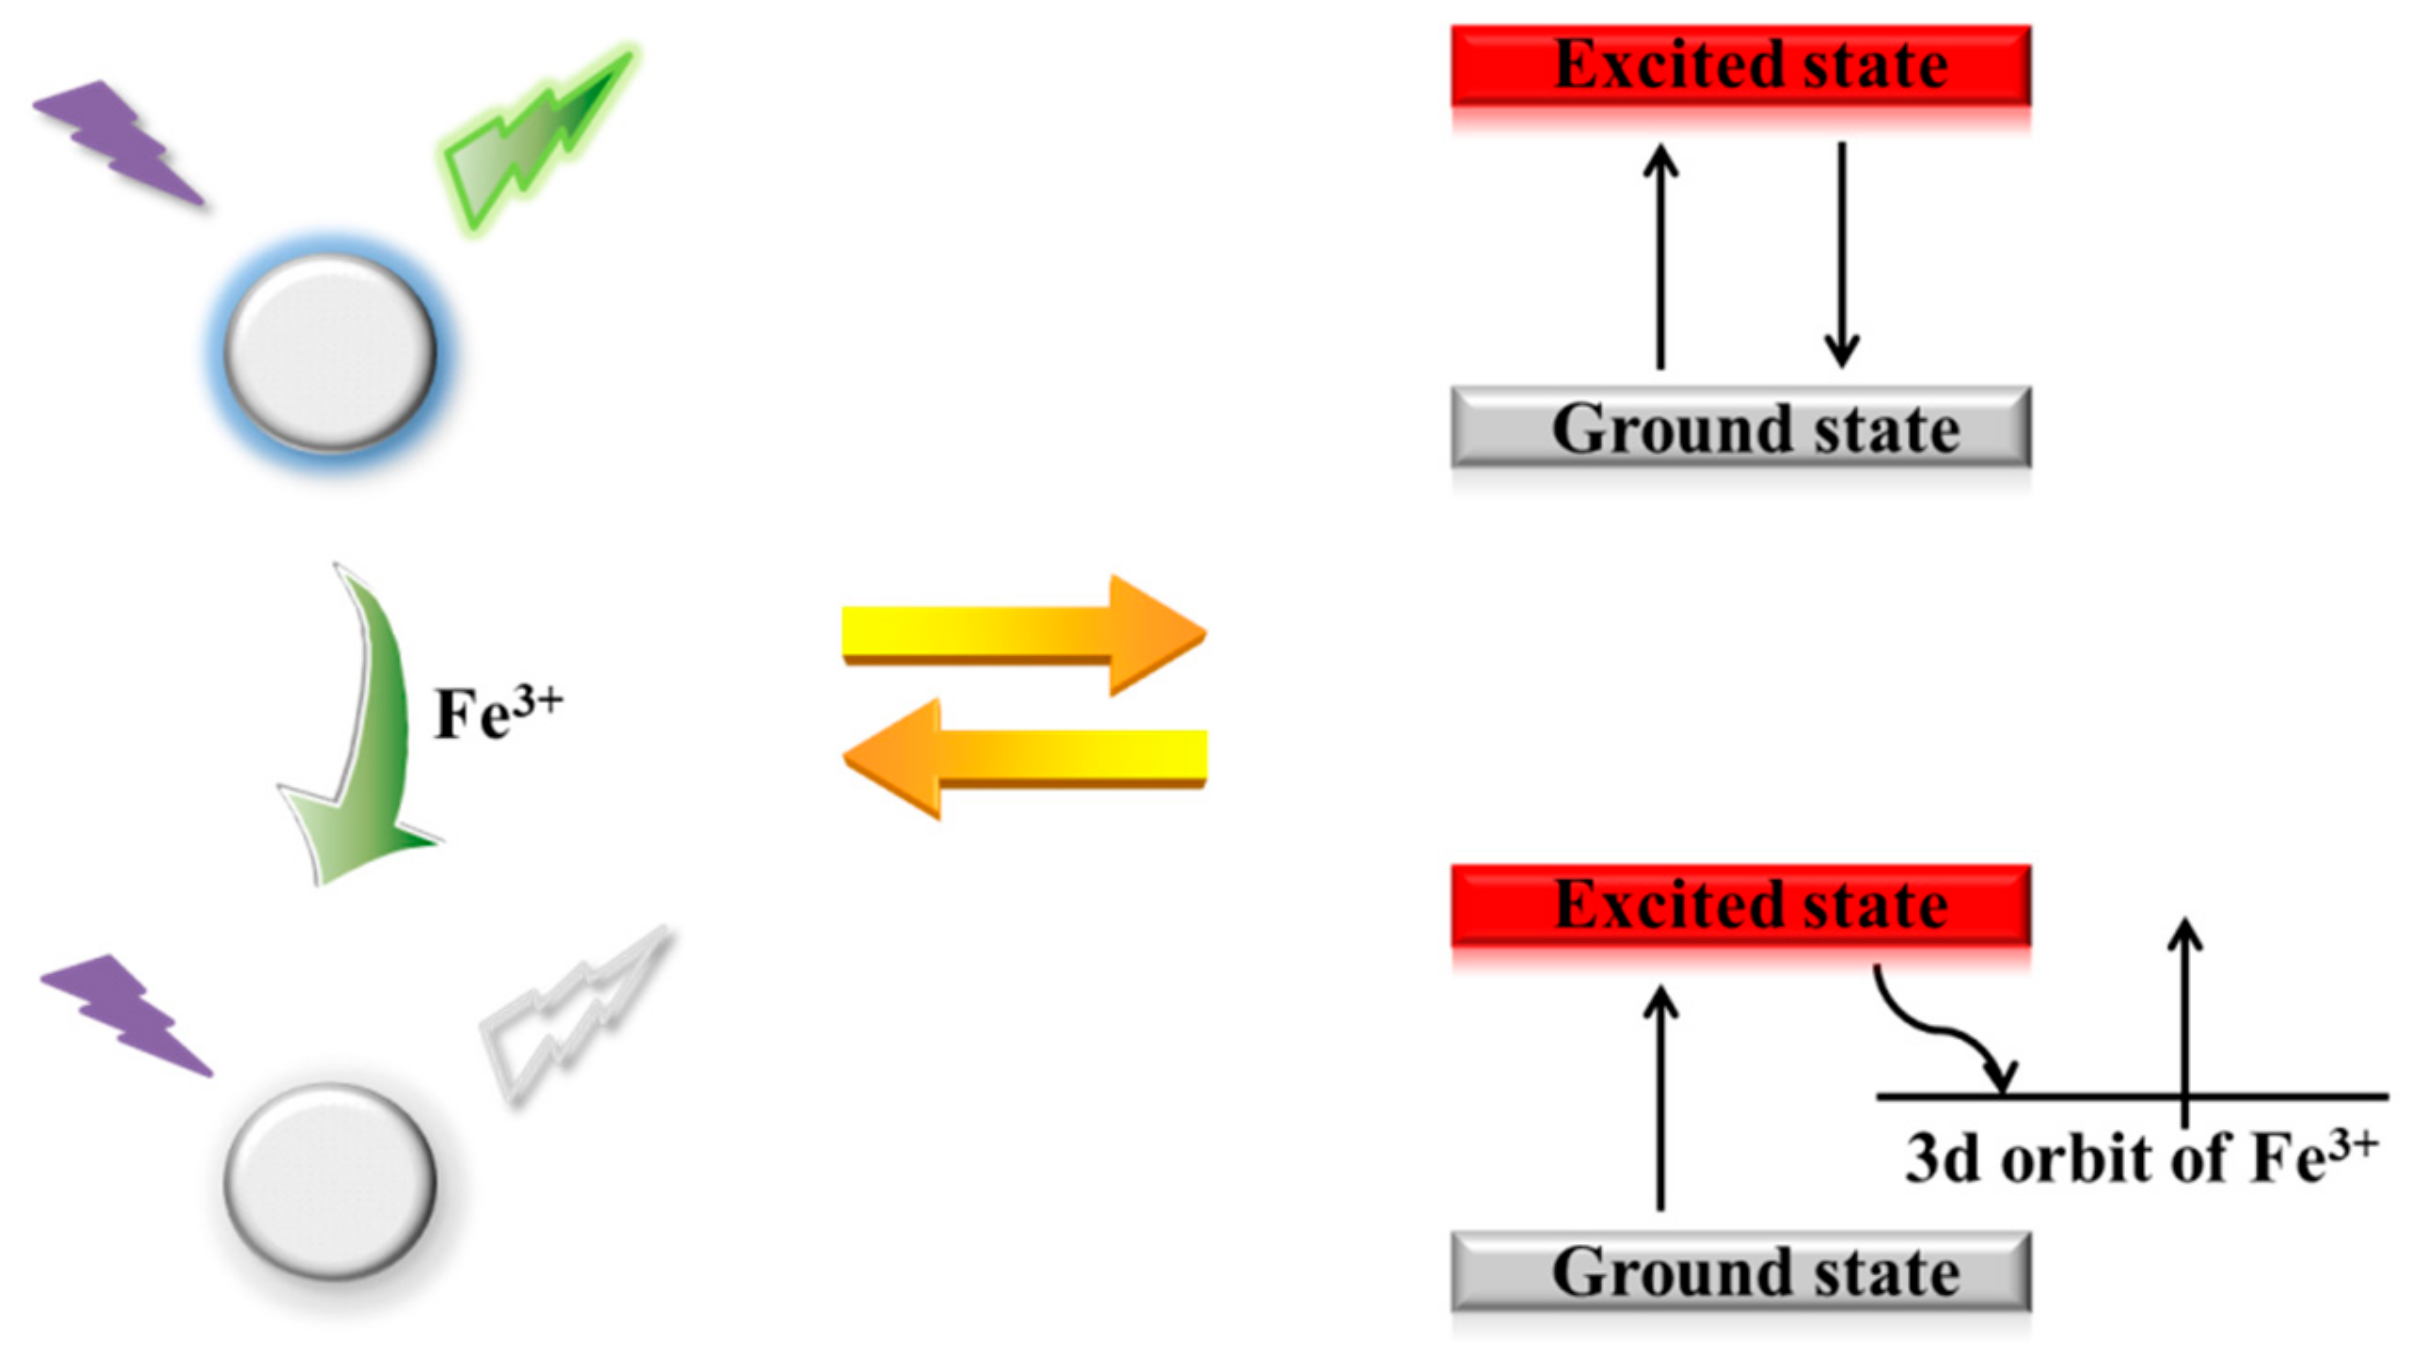
Most N-CQDs are sensitive to metal ions because of their external abundant carboxyl and hydroxyl groups. When Fe3+ ions were added to the prepared N-CQD aqueous solution, the fluorescence emission intensity was significantly quenched. This strong quenching effect may originate from the formation of N-CQD-Fe3+ complexes [47]. Based on previous studies, a reasonable mechanism for the fluorescence quenching of N-CQD is the intramolecular photoinduced electron transfer process from excited N-CQD to Fe3+ ions (Scheme 2). When Fe3+ was added, the electron-deficient Fe3+ complexes with functional groups on the surface of the N-CQD (for example, carboxyl groups and amino groups) lead to the splitting of the d-orbital of Fe3+. Therefore, electrons in the excited state of N-CQD were partially transferred to the d-orbital of Fe3+. Electron transition in the radiation forms (FL emission) was consequently restrained, resulting in fluorescence quenching [48]. To further clarify the mechanism of fluorescence quenching, the N-CQD-Fe3+ complex was characterized by XPS. As shown in Figure 7, the Fe 2p spectrum presented two peaks at 724.6 and 711.2 eV, corresponding to Fe 2p1/2 and Fe 2p3/2 energy levels of the Fe atom, respectively, suggesting the presence of metallic Fe. Further, as shown in Figure 5d, the absorption spectrum of N-CQDs changed remarkably after adding Fe3+, the absorption at 285 nm disappeared, and a new absorption peak appeared near 370 nm. This clearly shows that the surface states of the N-CQDs were modified due to the combination of Fe3+ ions. These results indicate that the presence of Fe3+ could lead to the formation of N-CQD-Fe3+ complexes.
3.5. Application to Real Samples
To investigate the practical feasibility of N-CQD colorimetric probes, it was applied to the determination of Fe3+ in real tap water and lake water samples. The collected water sample was filtered through a 0.45 μm membrane to remove insoluble materials before detection. The standard addition method was used to determine the unknown concentration of Fe3+ in the water samples. In addition, recovery assays for different concentrations of Fe3+ were performed. As can be seen from Table S1, the spiked recoveries were in the range of 96.8–101.9% and the relative standard deviations (RSDs) were less than 3.75%, which indicates that the sensing system showed excellent applicability for real sample analysis.
4. Conclusions
In summary, we have reported a simple, economic, and green method to produce water-soluble nitrogen-doped carbon quantum dots (N-CQDs) with chitosan as both carbon and nitrogen sources. The as-prepared N-CQDs exhibited high water solubility, stability, and excitation-dependent behavior. The average diameter of the N-CQDs was about 2 nm. Moreover, based on the dramatic fluorescence quenching capacity of Fe3+, the N-CQDs presented outstanding selectivity and sensitivity and were successfully applied for the quantitative detection of Fe3+ in aqueous solutions with a linear detection range of 0–500 μM and detection limit of 0.15 μM. This method is simple, rapid, and efficient, which can be used for the detection of Fe3+.
Supplementary Materials
The following are available online at https://www.mdpi.com/2073-4360/11/11/1731/s1, Figure S1: title, Table S1: title, Video S1: title. Figure S1. (a) Fluorescence emission spectra of N-CQDs obtained by chitosan hydrothermal carbonization with different times (at a maximum excitation wavelength of 330 nm). (b) From left to right are photographs of chitosan, N-CQDs with carbonization time 2, 6, 8, 12 and 24 h illuminated by natural light (Top) and UV lamp with 365 nm light (Down). Figure S2. Effect of pH from 2 to 11 on the fluorescence intensity of N-CQDs with 500 µM of Fe3+ ion. Figure S3. Effect of reaction time on the fluorescence intensity of N-CQDs with 500 µM of Fe3+ ion. Table S1. Determination of Fe3+ in tap water and waste water samples.
Author Contributions
Data curation, L.Z., Y.W.; Formal analysis, Y.W.; Investigation, X.Z.; Methodology, Y.D. and X.Z.; Project administration, X.Z.; Resources, X.Z. Supervision, X.Z.; Writing—original draft, L.Z., X.Z.; Writing—review & editing, Y.D.
Funding
This work was supported by the National Natural Science Foundation of China (No. 51503110, No. 51773102, No.21703114), the Program for Changjiang Scholars and Innovative Research Team in University (IRT_14R30).
Conflicts of Interest
The authors declare no conflict of interest.
References
- Huo, B.; Liu, B.; Chen, T.; Cui, L.; Xu, G.; Liu, M.; Liu, J. One-step synthesis of fluorescent boron nitride quantum dots via a hydrothermal strategy using melamine as nitrogen source for the detection of ferric ions. Langmuir 2017, 33, 10673–10678. [Google Scholar] [CrossRef] [PubMed]
- Atchudan, R.; Nesakumar, T.; Immanuel, J.; Raja, K. Highly fluorescent nitrogen-doped carbon dots derived from Phyllanthus acidus utilized as a fluorescent probe for label-free selective detection of Fe3+ ions, live cell imaging and fluorescent ink. Biosens. Bioelectron. 2018, 99, 303–311. [Google Scholar] [CrossRef] [PubMed]
- Liu, W.; Diao, H.; Chang, H.; Wang, H.; Li, T.; Wei, W. Green synthesis of carbon dots from rose-heart radish and application for Fe3+ detection and cell imaging. Sens. Actuat. B Chem. 2017, 241, 190–198. [Google Scholar] [CrossRef]
- Guo, X.; Wang, C.F.; Yu, Z.Y.; Chen, L.; Chen, S. Facile access to versatile fluorescent carbon dots toward light-emitting diodes. Chem. Commun. 2012, 48, 2692–2694. [Google Scholar] [CrossRef]
- Liu, C.; Zhang, P.; Zhai, X.; Tian, F.; Li, W.; Yang, J.; Liu, Y.; Wang, H.; Wang, W.; Liu, W. Nano-carrier for gene delivery and bioimaging based on carbon dots with PEI-passivation enhanced fluorescence. Biomaterials 2012, 33, 3604–3613. [Google Scholar] [CrossRef]
- Zhou, L.; Lin, Y.; Huang, Z.; Ren, J.; Qu, X. Carbon nanodots as fluorescence probes for rapid, sensitive, and label-free detection of Hg2+ and biothiols in complex matrices. Chem. Commun. 2012, 48, 1147–1149. [Google Scholar] [CrossRef]
- Zhang, R.; Chen, W. Nitrogen-doped carbon quantum dots: Facile synthesis and application as a “turn-off” fluorescent probe for detection of Hg2+ ions. Biosens. Bioelectron. 2014, 55, 83–90. [Google Scholar] [CrossRef]
- Baker, S.N.; Baker, G.A. Luminescent carbon nanodots: Emergent nanolights. Angew. Chem. Int. Edit. 2010, 49, 6726–6744. [Google Scholar] [CrossRef]
- Cao, L.; Wang, X.; Meziani, M.J.; Lu, F.; Wang, H.; Luo, P.G.; Lin, Y.; Harruff, B.A.; Veca, L.M.; Murray, D.; et al. Carbon dots for multiphoton bioimaging. J. Am. Chem. Soc. 2007, 129, 11318–11319. [Google Scholar] [CrossRef]
- Zhang, Y.L.; Wang, L.; Zhang, H.C.; Liu, Y.; Wang, H.Y.; Kang, Z.H.; Lee, S.T. Graphitic carbon quantum dots as a fluorescent sensing platform for highly efficient detection of Fe3+ ions. RSC Adv. 2013, 3, 3733–3738. [Google Scholar] [CrossRef]
- Sun, S.; Zhang, L.; Jiang, K.; Wu, A.; Lin, H. Toward High-Efficient Red Emissive Carbon Dots: Facile Preparation, Unique Properties, and Applications as Multifunctional Theranostic Agents. Chem. Mater. 2016, 28, 8659–8668. [Google Scholar] [CrossRef]
- Sahu, S.; Behera, B.; Maiti, T.K.; Mohapatra, S. Simple one-step synthesis of highly luminescent carbon dots from orange juice: Application as excellent bio-imaging agents. Chem. Commun. 2012, 48, 8835–8837. [Google Scholar] [CrossRef] [PubMed]
- Duan, Z.; Zhang, C.; Qiao, Y.; Liu, F.; Wang, D.; Wu, M.; Wang, K.; Lv, X.; Kong, X.; Wang, H. Polyhydric polymer-functionalized fluorescent probe with enhanced aqueous solubility and specific ion recognition: A test strips-based fluorimetric strategy for the rapid and visual detection of Fe3+ ions. Talanta 2017, 170, 306–313. [Google Scholar] [CrossRef] [PubMed]
- Rong, M.; Feng, Y.; Wang, Y.; Chen, X. One-pot solid phase pyrolysis synthesis of nitrogen-doped carbon dots for Fe3+ sensing and bioimaging. Sens. Actuat. B Chem. 2017, 245, 868–874. [Google Scholar] [CrossRef]
- Azadbakht, R.; Hakimi, M.; Khanabadi, J. Fluorescent organic nanoparticles with enhanced fluorescence by self-aggregation and their application for detection of Fe3+ ions. New J. Chem. 2018, 42, 5929–5936. [Google Scholar] [CrossRef]
- Zhang, B.; Liu, H.; Wu, F.; Hao, G.F.; Chen, Y.; Tan, C.; Tan, Y.; Jiang, Y. A dual-response quinoline-based fluorescent sensor for the detection of Copper(II) and Iron(III) ions in aqueous medium. Sens. Actuat. B Chem. 2017, 243, 765–774. [Google Scholar] [CrossRef]
- Biller, D.V.; Bruland, K.W. Analysis of Mn, Fe, Co, Ni, Cu, Zn, Cd, and Pb in seawater using the Nobias-chelate PA1 resin and magnetic sector inductively coupled plasma mass spectrometry (ICP-MS). Mar. Chem. 2012, 130–131, 12–20. [Google Scholar] [CrossRef]
- Lunvongsa, S.; Oshima, M.; Motomizu, S. Determination of total and dissolved amount of iron in water samples using catalytic spectrophotometric flow injection analysis. Talanta 2006, 68, 969–973. [Google Scholar] [CrossRef]
- Ghaedi, M.; Shokrollahi, A.; Kianfar, A.H.; Mirsadeghi, A.S.; Pourfarokhi, A.; Soylak, M. The determination of some heavy metals in food samples by flame atomic absorption spectrometry after their separation-preconcentration on bis salicyl aldehyde, 1,3 propan diimine (BSPDI) loaded on activated carbon. J. Hazard. Mater. 2008, 154, 128–134. [Google Scholar] [CrossRef]
- Zhu, Y.; Pan, D.; Hu, X.; Han, H.; Lin, M.; Wang, C. An electrochemical sensor based on reduced graphene oxide/gold nanoparticles modified electrode for determination of iron in coastal waters. Sens. Actuat. B Chem. 2017, 243, 1–7. [Google Scholar] [CrossRef]
- Li, S.; Li, Y.; Cao, J.; Zhu, J.; Fan, L.; Li, X. Sulfur-doped graphene quantum dots as a novel fluorescent probe for highly selective and sensitive detection of Fe3+. Analyt. Chem. 2014, 86, 10201–10207. [Google Scholar] [CrossRef] [PubMed]
- Zhang, H.; Huang, Y.; Lin, X.; Lu, F.; Zhang, Z.; Hu, Z. Lanthanum loaded graphitic carbon nitride nanosheets for highly sensitive and selective fluorescent detection of iron ions. Sens. Actuat. B Chem. 2018, 255, 2218–2222. [Google Scholar] [CrossRef]
- Sun, L.; Li, J.; Cai, J.; Zhong, L.; Ren, G.; Ma, Q. One pot synthesis of gold nanoparticles using chitosan with varying degree of deacetylation and molecular weight. Carbohydr. Polym. 2017, 178, 105–114. [Google Scholar] [CrossRef] [PubMed]
- Mathew, M.; Sureshkumar, S.; Sandhyarani, N. Synthesis and characterization of gold-chitosan nanocomposite and application of resultant nanocomposite in sensors. Colloids Surf. B Biointerf. 2012, 93, 143–147. [Google Scholar] [CrossRef] [PubMed]
- Mendoza, G.; Regiel-Futyra, A.; Andreu, V.; Sebastián, V.; Kyzioł, A.; Stochel, G.; Arruebo, M. Bactericidal Effect of Gold-Chitosan Nanocomposites in Coculture Models of Pathogenic Bacteria and Human Macrophages. ACS Appl. Mater. Interf. 2017, 9, 17693–17701. [Google Scholar] [CrossRef]
- Bao, J.; Hou, C.; Chen, M.; Li, J.; Huo, D.; Yang, M.; Luo, X.; Lei, Y. Plant Esterase-Chitosan/Gold Nanoparticles-Graphene Nanosheet Composite-Based Biosensor for the Ultrasensitive Detection of Organophosphate Pesticides. J. Agric. Food Chem. 2015, 63, 10319–10326. [Google Scholar] [CrossRef]
- Ramirez, O.; Bonardd, S.; Saldías, C.; Radic, D.; Leiva, Á. Biobased Chitosan Nanocomposite Films Containing Gold Nanoparticles: Obtainment, Characterization, and Catalytic Activity Assessment. ACS Appl. Mater. Interf. 2017, 9, 16561–16570. [Google Scholar] [CrossRef]
- Zhou, S.F.; Han, X.J.; Liu, Y.Q. SWASV performance toward heavy metal ions based on a high-activity and simple magnetic chitosan sensing nanomaterials. J. Alloys Compd. 2016, 684, 1–7. [Google Scholar] [CrossRef]
- Abdullah, S.; Azeman, N.H.; Mobarak, N.N.; Zan, M.S.D.; Ahmad, A.A. Sensitivity enhancement of localized SPR sensor towards Pb(II) ion detection using natural bio-polymer based carrageenan. Optik 2018, 168, 784–793. [Google Scholar] [CrossRef]
- Zhang, Z.; Fu, X.; Li, K.; Liu, R.; Peng, D.; He, L.; Wang, M.; Zhang, H.; Zhou, L. One-step fabrication of electrochemical biosensor based on DNA-modified three-dimensional reduced graphene oxide and chitosan nanocomposite for highly sensitive detection of Hg(II). Sens. Actuat. B Chem. 2016, 225, 453–462. [Google Scholar] [CrossRef]
- Song, J.; Zhao, L.; Wang, Y.; Xue, Y.; Deng, Y.; Zhao, X. Carbon Quantum Dots Prepared with Chitosan for Synthesis of CQDs/AuNPs for Iodine Ions Detection. Nanomaterials 2018, 8, 1043. [Google Scholar] [CrossRef] [PubMed]
- Zheng, M.; Wang, Y.; Wang, C.; Wei, W.; Ma, S.; Sun, X.; He, J. Green synthesis of carbon dots functionalized silver nanoparticles for the colorimetric detection of phoxim. Talanta 2018, 185, 309–315. [Google Scholar] [CrossRef] [PubMed]
- Dong, Y.; Wang, R.; Li, H.; Shao, J.; Chi, Y.; Lin, X.; Chen, G. Polyamine-functionalized carbon quantum dots for chemical sensing. Carbon 2012, 50, 2810–2815. [Google Scholar] [CrossRef]
- Murugan, N.; Prakash, M.; Jayakumar, M.; Sundaramurthy, A.; Sundramoorthy, A.K. Green synthesis of fluorescent carbon quantum dots from Eleusine coracana and their application as a fluorescence ‘turn-off’ sensor probe for selective detection of Cu2+. Appl. Surf. Sci. 2019, 476, 468–480. [Google Scholar] [CrossRef]
- Song, Z.; Quan, F.; Xu, Y.; Liu, M.; Cui, L.; Liu, J. Multifunctional N,S co-doped carbon quantum dots with pH- and thermo-dependent switchable fluorescent properties and highly selective detection of glutathione. Carbon 2016, 104, 169–178. [Google Scholar] [CrossRef]
- Dong, Y.; Shao, J.; Chen, C.; Li, H.; Wang, R.; Chi, Y.; Lin, X.; Chen, G. Blue luminescent graphene quantum dots and graphene oxide prepared by tuning the carbonization degree of citric acid. Carbon 2012, 50, 4738–4743. [Google Scholar] [CrossRef]
- Gao, Z.H.; Lin, Z.Z.; Chen, X.M.; Lai, Z.Z.; Huang, Z.Y. Carbon dots-based fluorescent probe for trace Hg2+ detection in water sample. Sens. Actuat. B Chem. 2016, 222, 965–971. [Google Scholar] [CrossRef]
- Liu, Y.; Zhao, Y.; Zhang, Y. One-step green synthesized fluorescent carbon nanodots from bamboo leaves for copper(II) ion detection. Sens. Actuat. B Chem. 2014, 196, 647–652. [Google Scholar] [CrossRef]
- Gao, X.; Zhou, X.; Ma, Y.; Qian, T.; Wang, C.; Chu, F. Facile and cost-effective preparation of carbon quantum dots for Fe3+ ion and ascorbic acid detection in living cells based on the “on-off-on” fluorescence principle. Appl. Surf. Sci. 2019, 469, 911–916. [Google Scholar] [CrossRef]
- Meng, A.; Xu, Q.; Zhao, K.; Li, Z.; Liang, J.; Li, Q. A highly selective and sensitive “on-off-on” fluorescent probe for detecting Hg(II) based on Au/N-doped carbon quantum dots. Sens Actuat. B Chem. 2018, 255, 657–665. [Google Scholar] [CrossRef]
- Shamsipur, M.; Molaei, K.; Molaabasi, F.; Alipour, M. Facile preparation and characterization of new green emitting carbon dots for sensitive and selective off/on detection of Fe3+ ion and ascorbic acid in water and urine samples and intracellular imaging in living cells. Talanta 2018, 183, 122–130. [Google Scholar] [CrossRef] [PubMed]
- Ma, J.; Yu, H.; Jiang, X.; Luo, Z.; Zheng, Y. High sensitivity label-free detection of Fe3+ ion in aqueous solution using fl uorescent MoS2 quantum dots. Sens. Actuat. B. Chem. 2019, 281, 989–997. [Google Scholar] [CrossRef]
- Deng, M.; Wang, S.; Liang, C.; Shang, H.; Jiang, S. A FRET fluorescent nanosensor based on carbon dots for ratiometric detection of Fe3+ in aqueous. RSC Adv. 2016, 6, 26936–26940. [Google Scholar] [CrossRef]
- Ananthanarayanan, A.; Wang, X.; Routh, P.; Sana, B.; Lim, S.; Kim, D.; Lim, K.; Li, J.; Chen, P. Facile Synthesis of Graphene Quantum Dots from 3D Graphene and their Application for Fe3+ Sensing. Adv. Funct. Mater. 2014, 24, 3021–3026. [Google Scholar] [CrossRef]
- Vikneswaran, R.; Ramesh, S.; Yahya, R. Green synthesized carbon nanodots as a fluorescent probe for selective and sensitive detection of iron(III) ions. Mater. Lett. 2014, 136, 179–182. [Google Scholar] [CrossRef]
- Zhou, M.; Zhou, Z.; Gong, A.; Zhang, Y.; Li, Q. Synthesis of highly photoluminescent carbon dots via citric acid and Tris for iron(III) ions sensors and bioimaging. Talanta 2015, 143, 107–113. [Google Scholar] [CrossRef]
- Deng, X.; Feng, Y.; Li, H.; Du, Z.; Teng, Q.; Wang, H. N-doped carbon quantum dots as fluorescent probes for highly selective and sensitive detection of Fe3+ ions. Particuology 2018, 41, 94–100. [Google Scholar] [CrossRef]
- Chen, B.; Li, F.; Zou, L.; Chen, D. Intermolecular hydrogen bonding-mediated synthesis of high-quality photoluminescent carbon dots for label-free fluorometric detection of Fe3+ ions. J. Colloid Interf. Sci. 2019, 534, 381–388. [Google Scholar] [CrossRef]
Scheme 1.
Schematic illustration of the synthesis of nitrogen-doped carbon quantum dots (N-CQDs) by a hydrothermal treatment approach and its application in the detection of Fe3+.
Scheme 1.
Schematic illustration of the synthesis of nitrogen-doped carbon quantum dots (N-CQDs) by a hydrothermal treatment approach and its application in the detection of Fe3+.

Figure 1.
(a) TEM image, (b) size distribution histogram, (c) high-resolution transmission electron microscopy (HRTEM) image, and (d) XRD pattern of N-CQDs. The inset of (c) shows the HRTEM image of N-CQDs with lattice parameters of 0.212 nm.
Figure 1.
(a) TEM image, (b) size distribution histogram, (c) high-resolution transmission electron microscopy (HRTEM) image, and (d) XRD pattern of N-CQDs. The inset of (c) shows the HRTEM image of N-CQDs with lattice parameters of 0.212 nm.
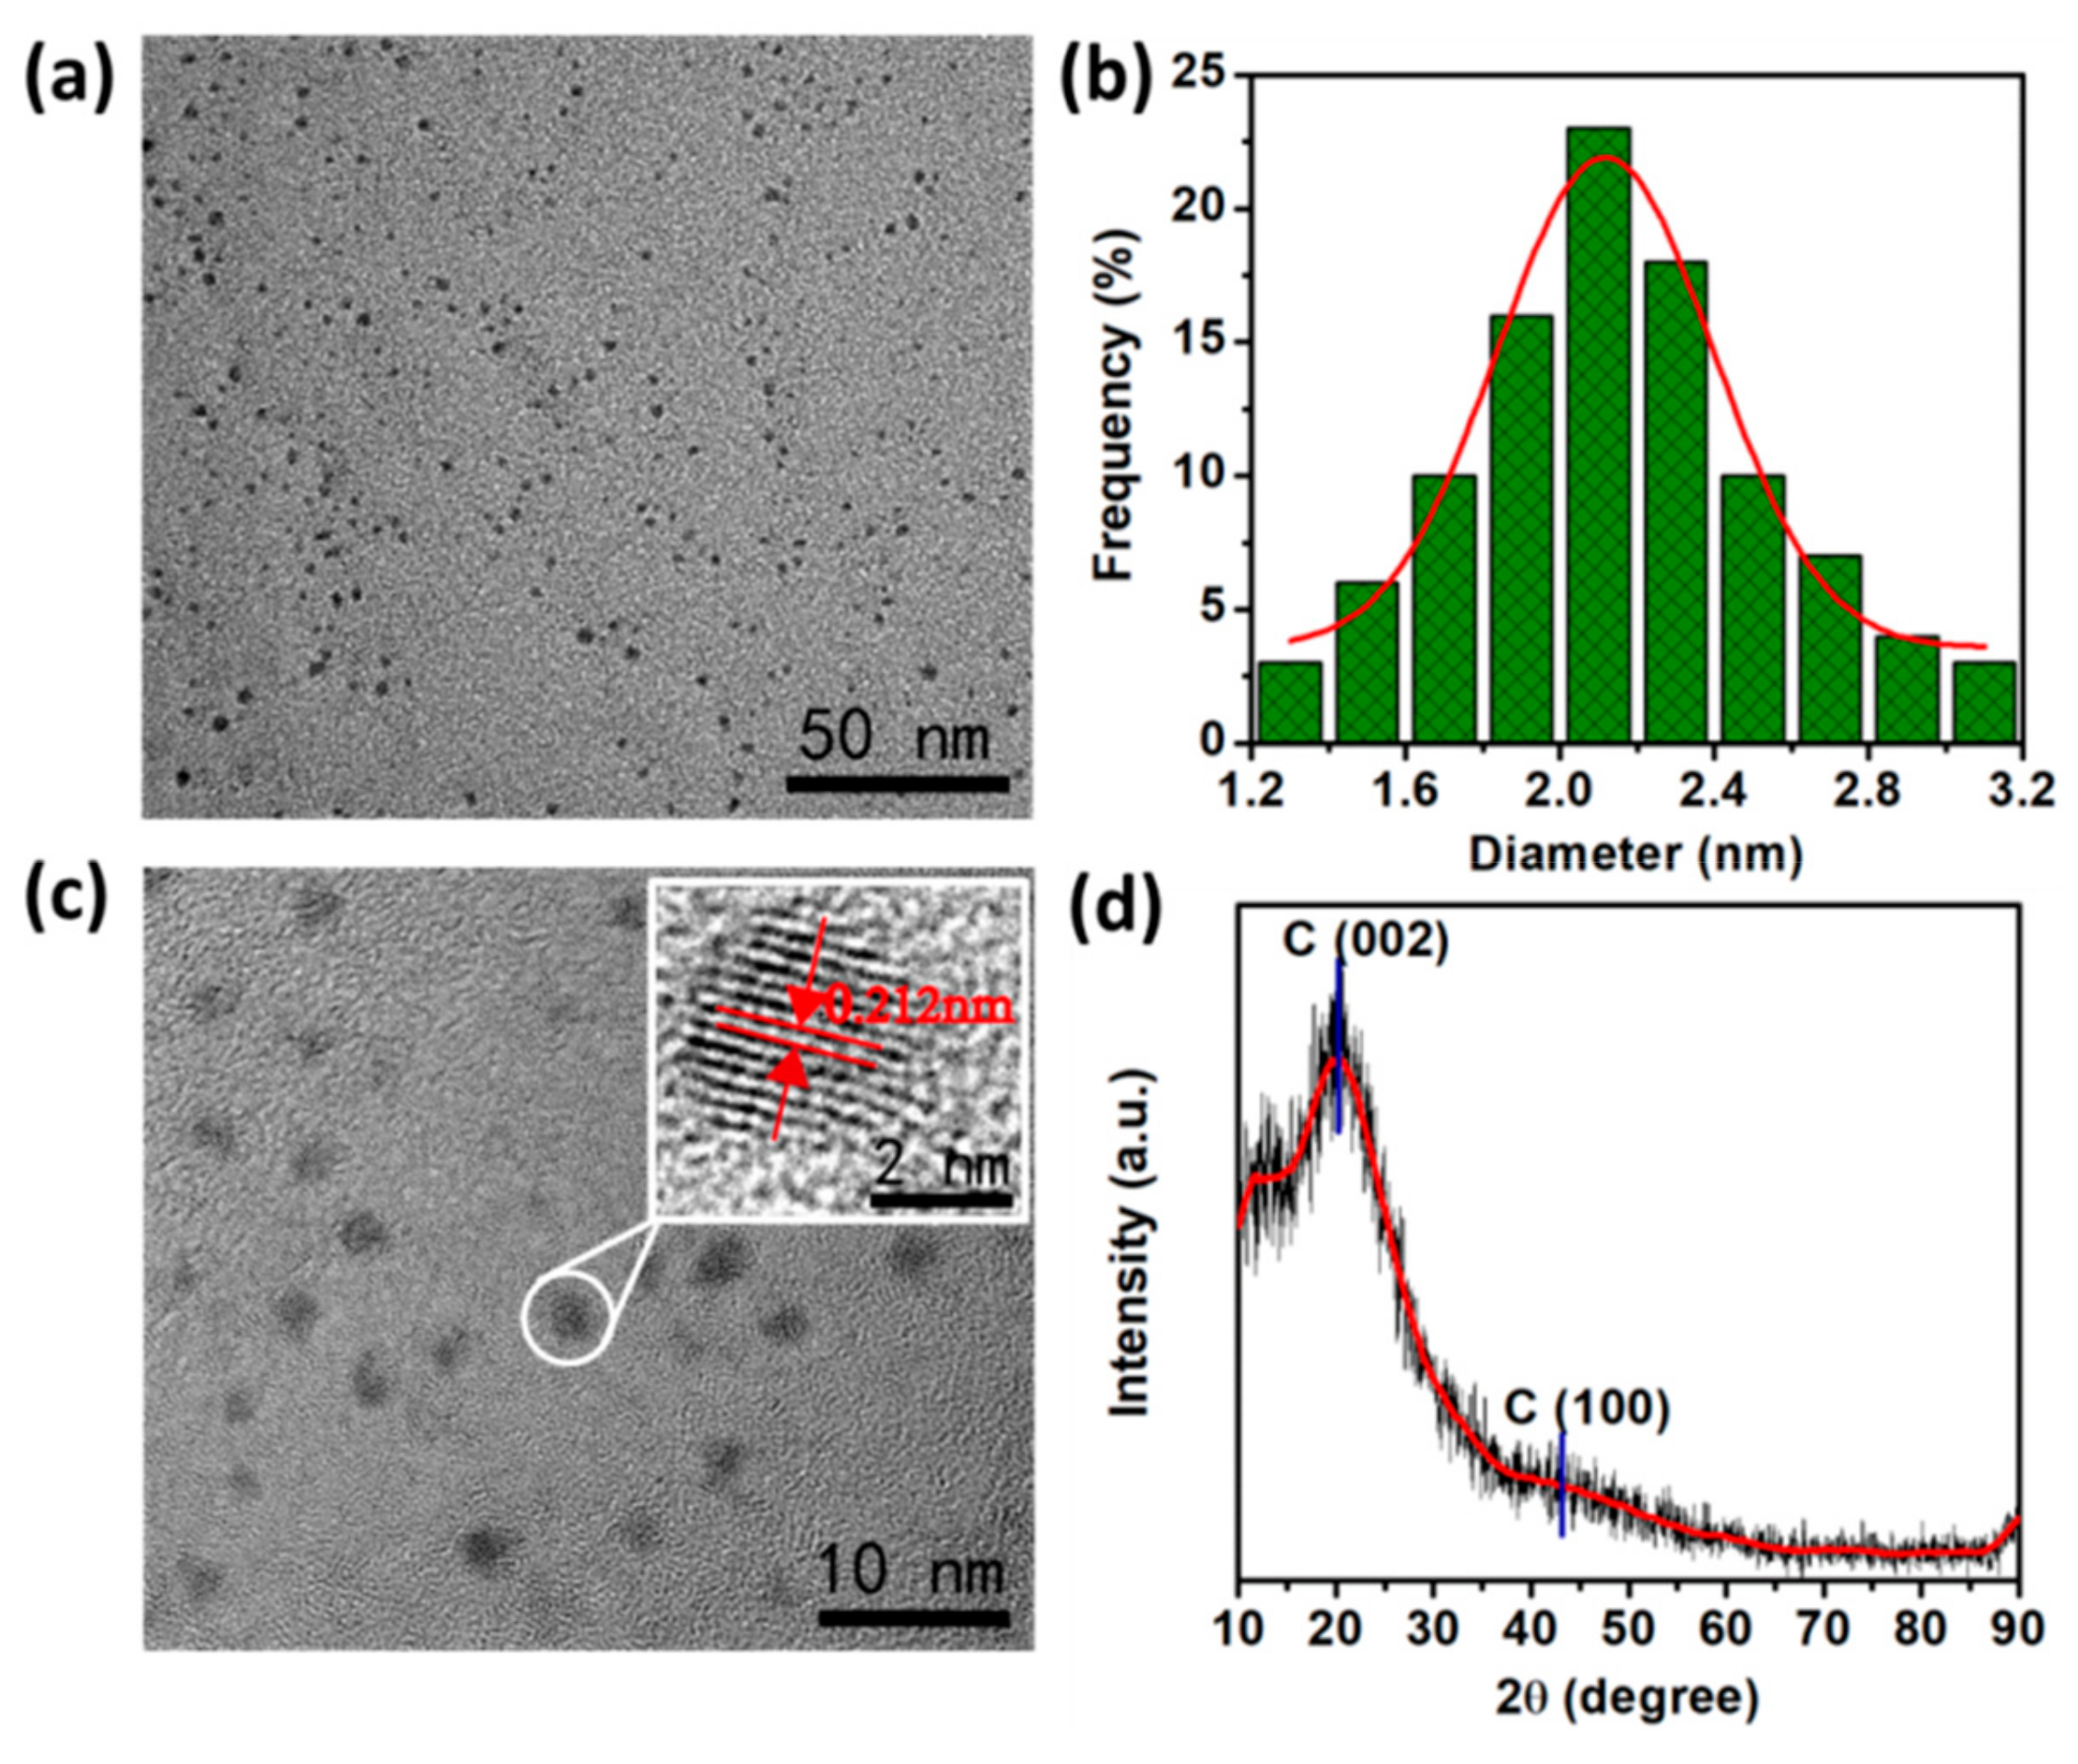
Figure 2.
FT-IR spectra of (a) chitosan and (b) N-CQDs.
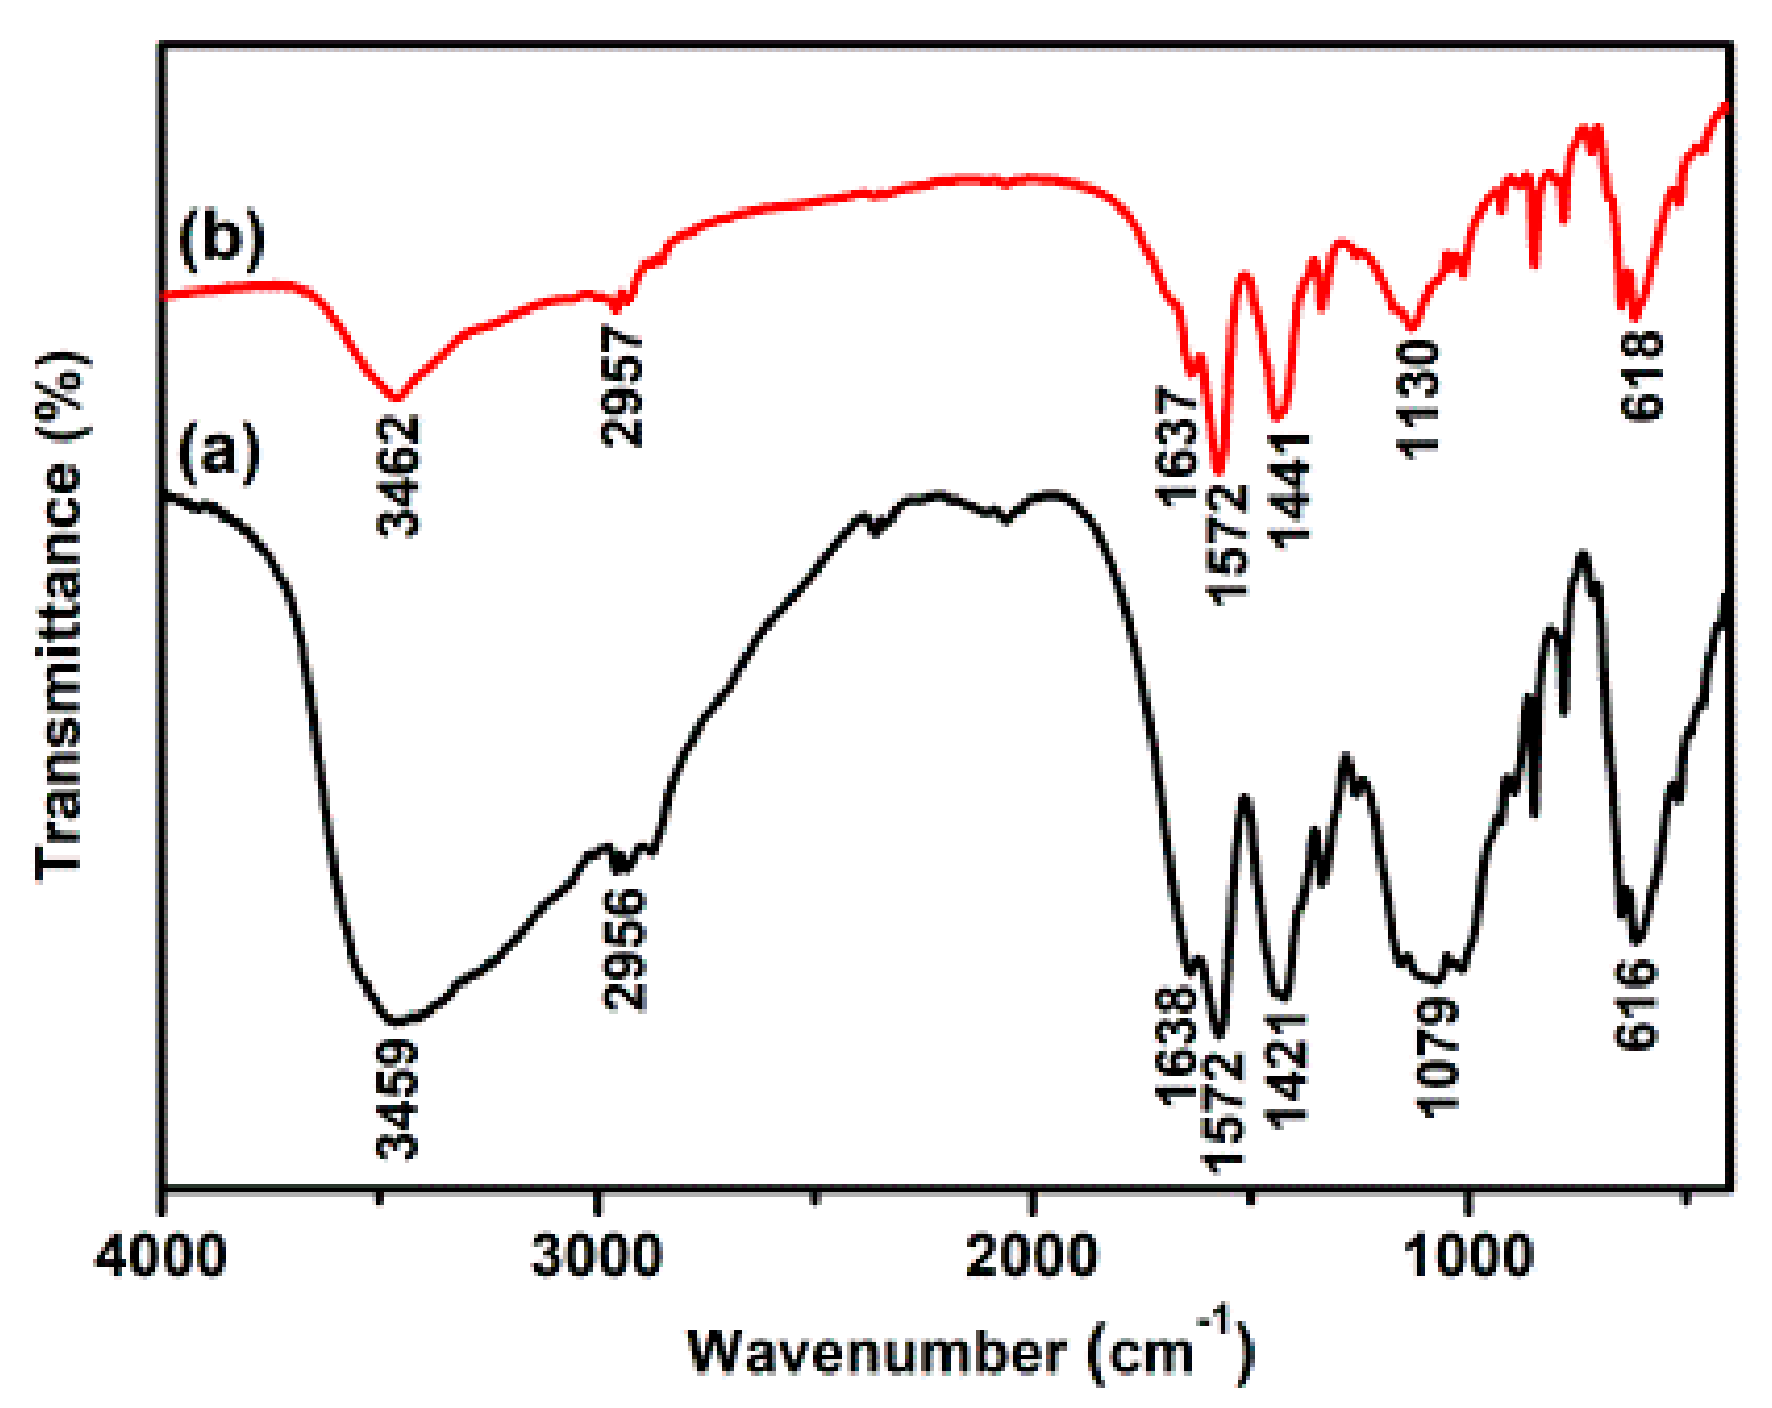
Figure 3.
(a) X-ray photoelectron spectroscopy (XPS) spectra of N-CQDs. (b–d) High-resolution XPS spectra of (b) C1s, (c) N1s, and (d) O1s.
Figure 3.
(a) X-ray photoelectron spectroscopy (XPS) spectra of N-CQDs. (b–d) High-resolution XPS spectra of (b) C1s, (c) N1s, and (d) O1s.
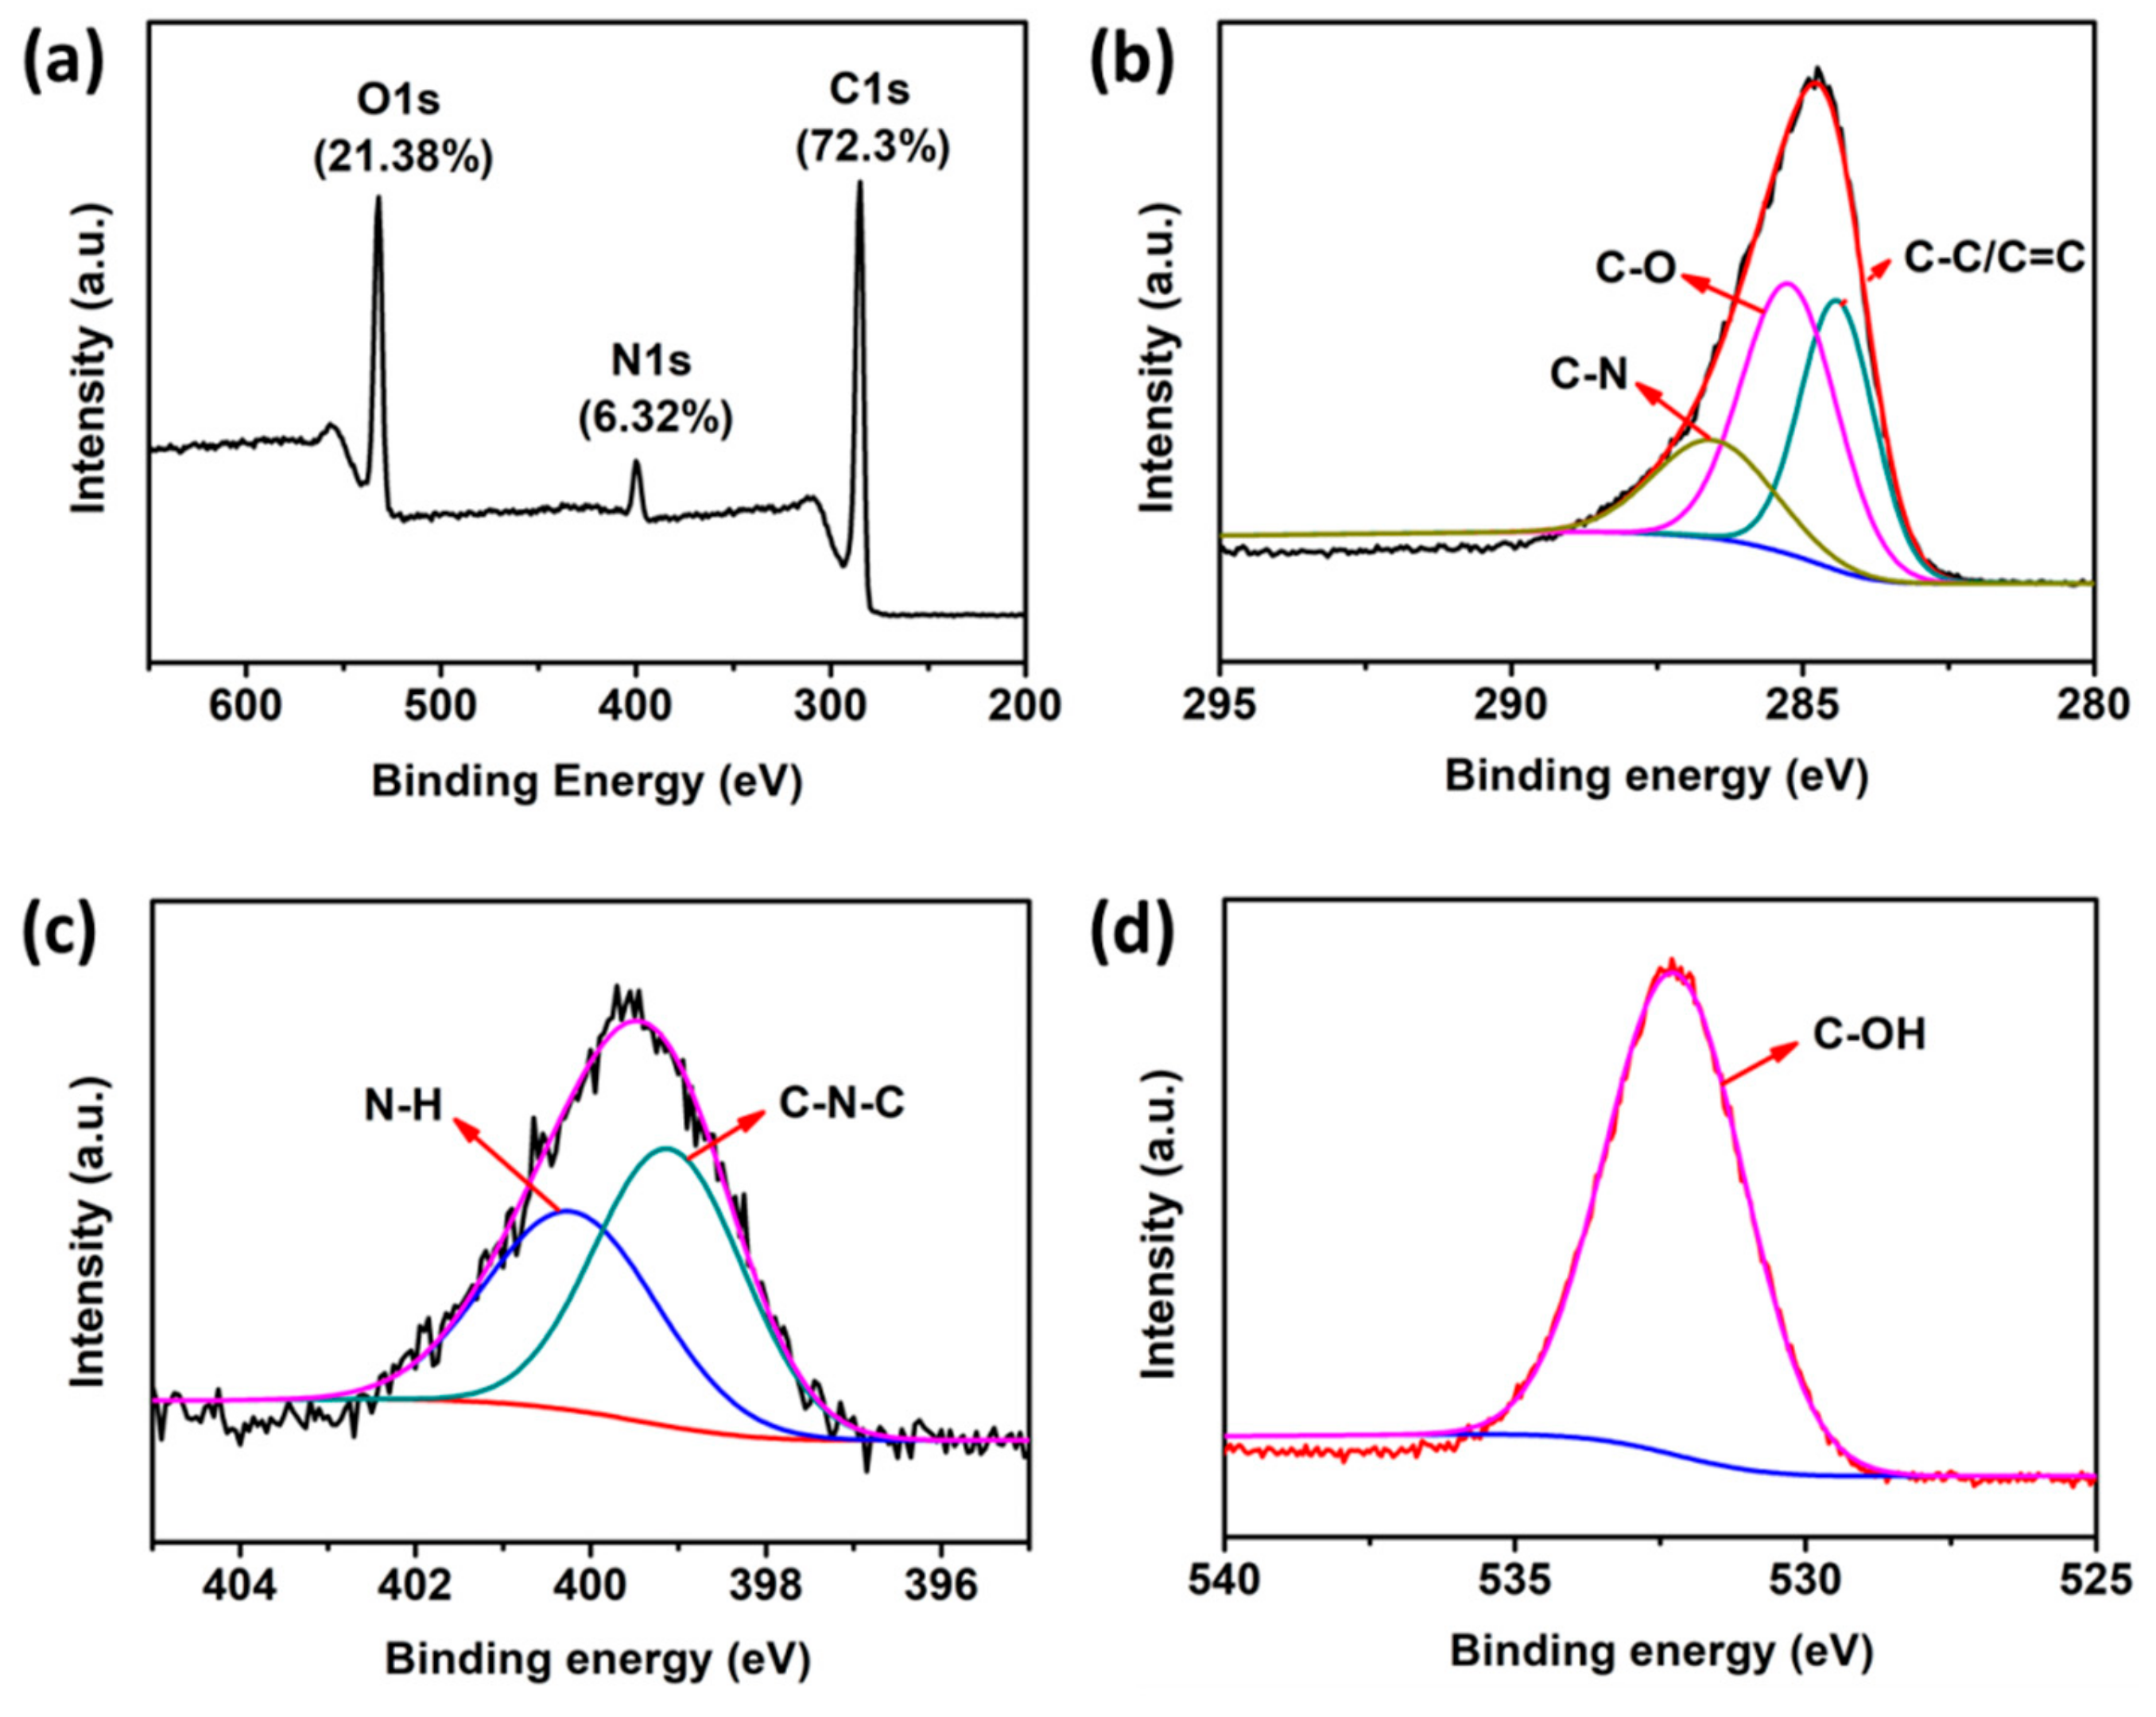
Figure 4.
(a) UV-vis absorption spectra (black line), and fluorescence excitation (λex = 330 nm, green line) and emission (λem = 410 nm, blue line) spectra of N-CQDs. (b) Fluorescence emission spectra of N-CQDs obtained under different excitation wavelengths (from 300 to 390 nm with 10 nm intervals).
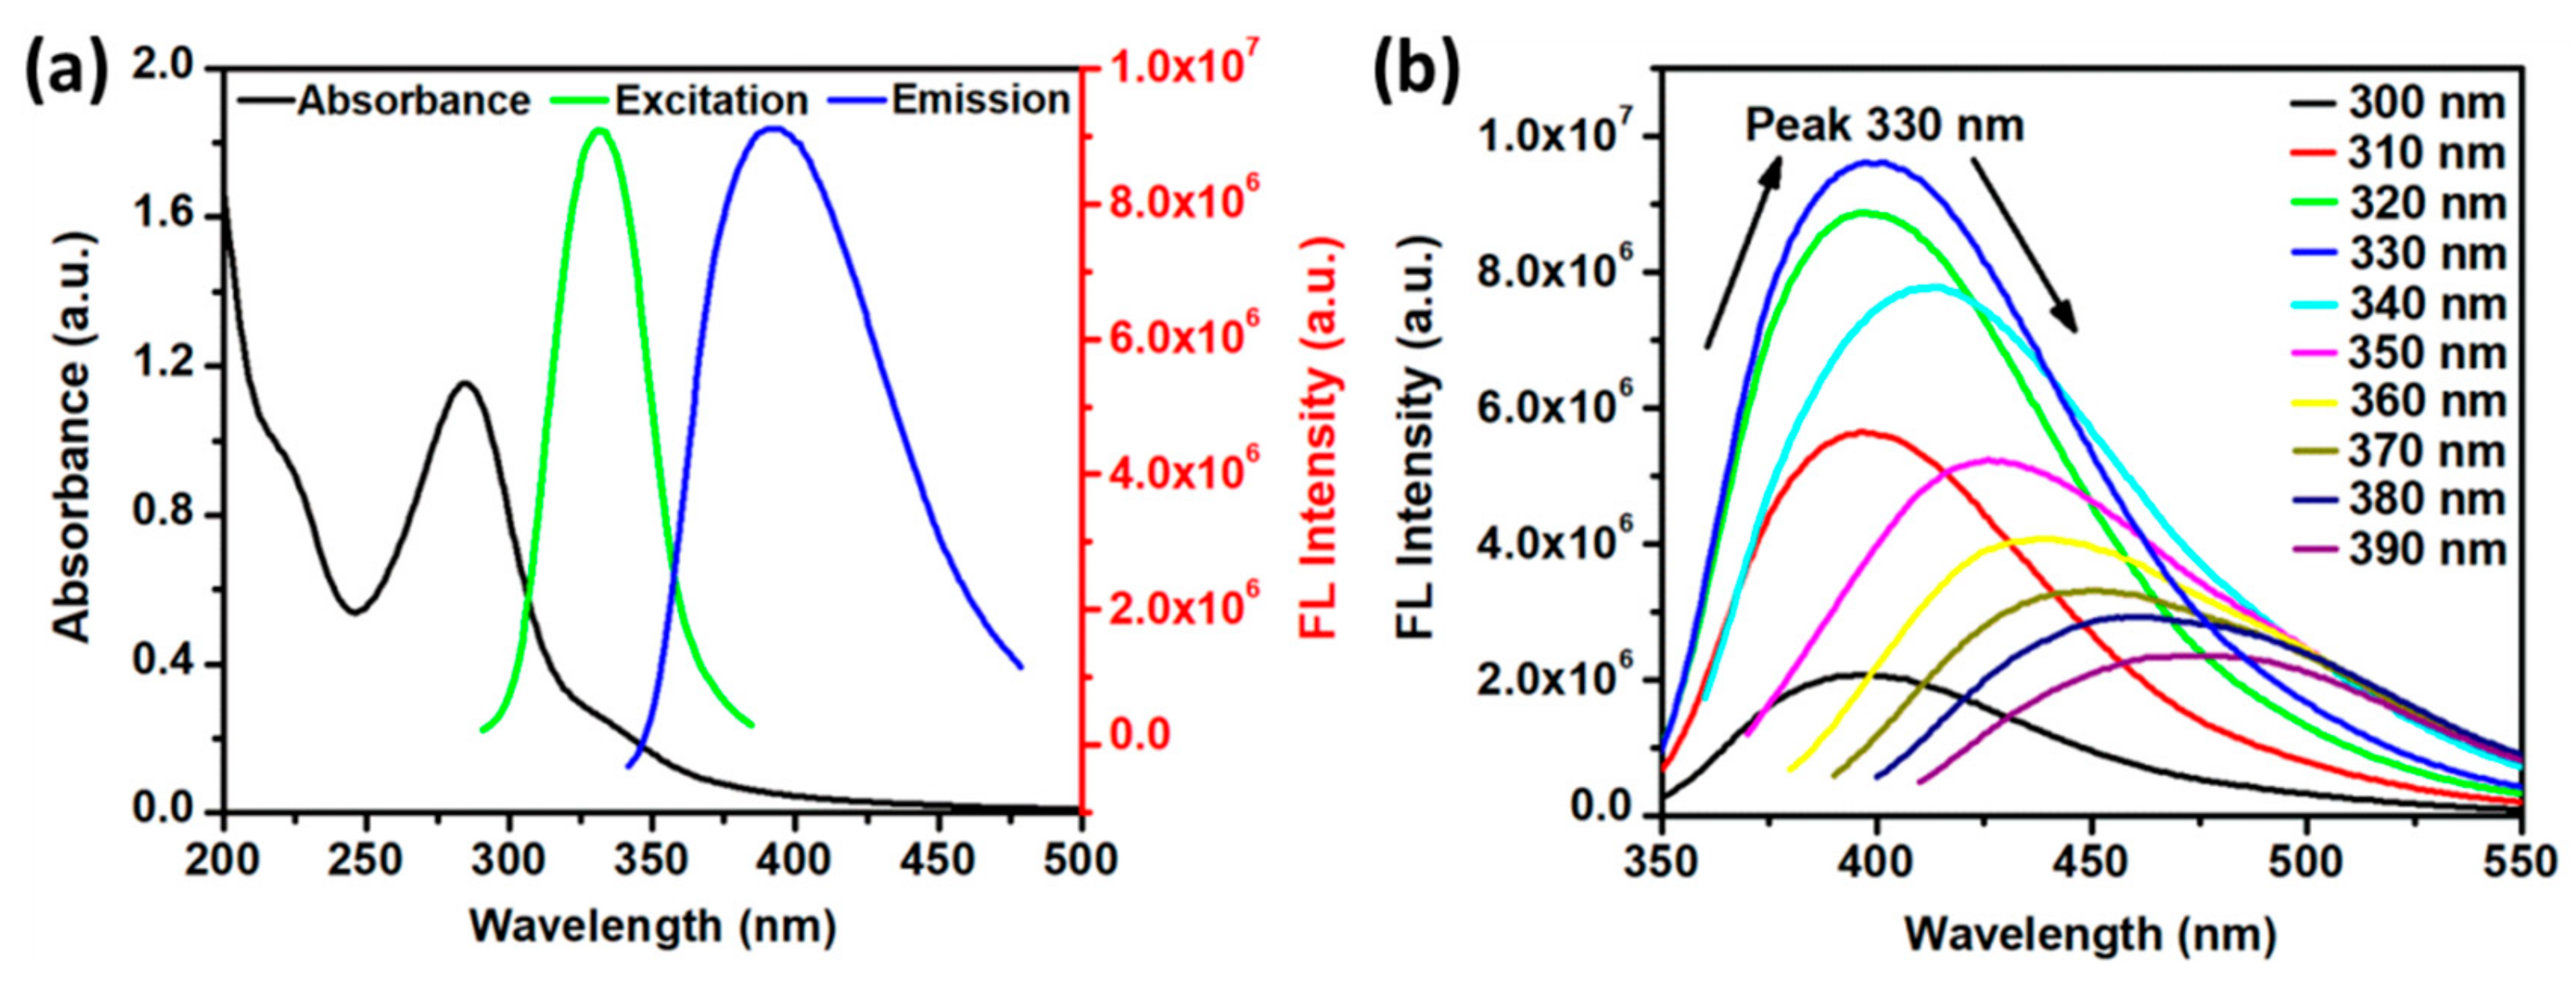
Figure 5.
(a) Fluorescence emission spectra of N-CQDs with various metal ions (500 µM). (b) Various fluorescence intensity ratios (F0–F)/F0 of the N-CQDs in the presence of various individual metal ions. Inset: Fluorescence photographs of synthesized N-CQDs, and N-CQDs with various metal ions under the UV lamp (λ = 365 nm). (c) Interference experiments of aqueous N-CQD solution toward 100 μM Fe3+ (black bars) and other metal ions (red bars). (d) UV-vis spectra of N-CQD solution before and after the addition of different metal ions.

Figure 6.
(a) Fluorescence emission spectra of N-CQDs in the presence of increasing Fe3+ ion concentrations (0–500 µM). (b) Nonlinear Stern–Volmer quenching profile of N-CQDs with Fe3+ ion concentration ranging between 0 and 500 µM. Right inset shows the linear part of the Stern–Volmer quenching profile with Fe3+ ion concentration ranging between 0 and 200 µM. Left inset shows the visible change in the blue photoluminescence intensities of the N-CQDs treated with Fe3+ ions, excited by UV light with a wavelength of 365 nm.
Scheme 2.
Fluorescence quenching mechanism of the N-CQDs in the presence of Fe3+ ions.

Figure 7.
(a) XPS full scan spectrum of N-CQDs after addition of Fe3+ and (b) XPS spectrum of Fe 2p.
Figure 7.
(a) XPS full scan spectrum of N-CQDs after addition of Fe3+ and (b) XPS spectrum of Fe 2p.

Table 1.
Comparison of sensing performance of different fluorescent probes for Fe3+ ion detection.
| Fluorescent Probe | Linear Range/(µM) | LOD/(µM) | Ref. |
|---|---|---|---|
| G-CDs | 0.2–11 | 0.08 | [41] |
| MoS2 QDs | 0–50 | 1.00 | [42] |
| CDs | 0–50 | 0.73 | [43] |
| GQDs | 0–80 | 7.22 | [44] |
| N-C dots | 0–200 | 0.10 | [14] |
| CDs from banana peels | 2–16 | 0.21 | [45] |
| C-QDs | 2–50 | 1.30 | [46] |
| N-CQDs | 0–200 | 0.15 | This work |
© 2019 by the authors. Licensee MDPI, Basel, Switzerland. This article is an open access article distributed under the terms and conditions of the Creative Commons Attribution (CC BY) license (http://creativecommons.org/licenses/by/4.0/).
Share and Cite
MDPI and ACS Style
Zhao, L.; Wang, Y.; Zhao, X.; Deng, Y.; Xia, Y. Facile Synthesis of Nitrogen-Doped Carbon Quantum Dots with Chitosan for Fluorescent Detection of Fe3+. Polymers 2019, 11, 1731. https://doi.org/10.3390/polym11111731
AMA Style
Zhao L, Wang Y, Zhao X, Deng Y, Xia Y. Facile Synthesis of Nitrogen-Doped Carbon Quantum Dots with Chitosan for Fluorescent Detection of Fe3+. Polymers. 2019; 11(11):1731. https://doi.org/10.3390/polym11111731
Chicago/Turabian StyleZhao, Li, Yesheng Wang, Xihui Zhao, Yujia Deng, and Yanzhi Xia. 2019. "Facile Synthesis of Nitrogen-Doped Carbon Quantum Dots with Chitosan for Fluorescent Detection of Fe3+" Polymers 11, no. 11: 1731. https://doi.org/10.3390/polym11111731
Note that from the first issue of 2016, this journal uses article numbers instead of page numbers. See further details here.