Mechanical, Electrical and Rheological Behavior of Ethylene-Vinyl Acetate/Multi-Walled Carbon Nanotube Composites

Abstract
:1. Introduction
2. Materials and Methods
2.1. Materials and Sample Manufacturing
2.2. Differential Scanning Calorimetry (DSC)
2.3. Melt Shear Viscosity
2.4. Pressure-Volume-Temperature Measurements
2.5. Solid Density Measurement
2.6. SEM Analysis
2.7. Tensile Tests
2.8. Measurement of Volume Resistivity
3. Results and Discussion
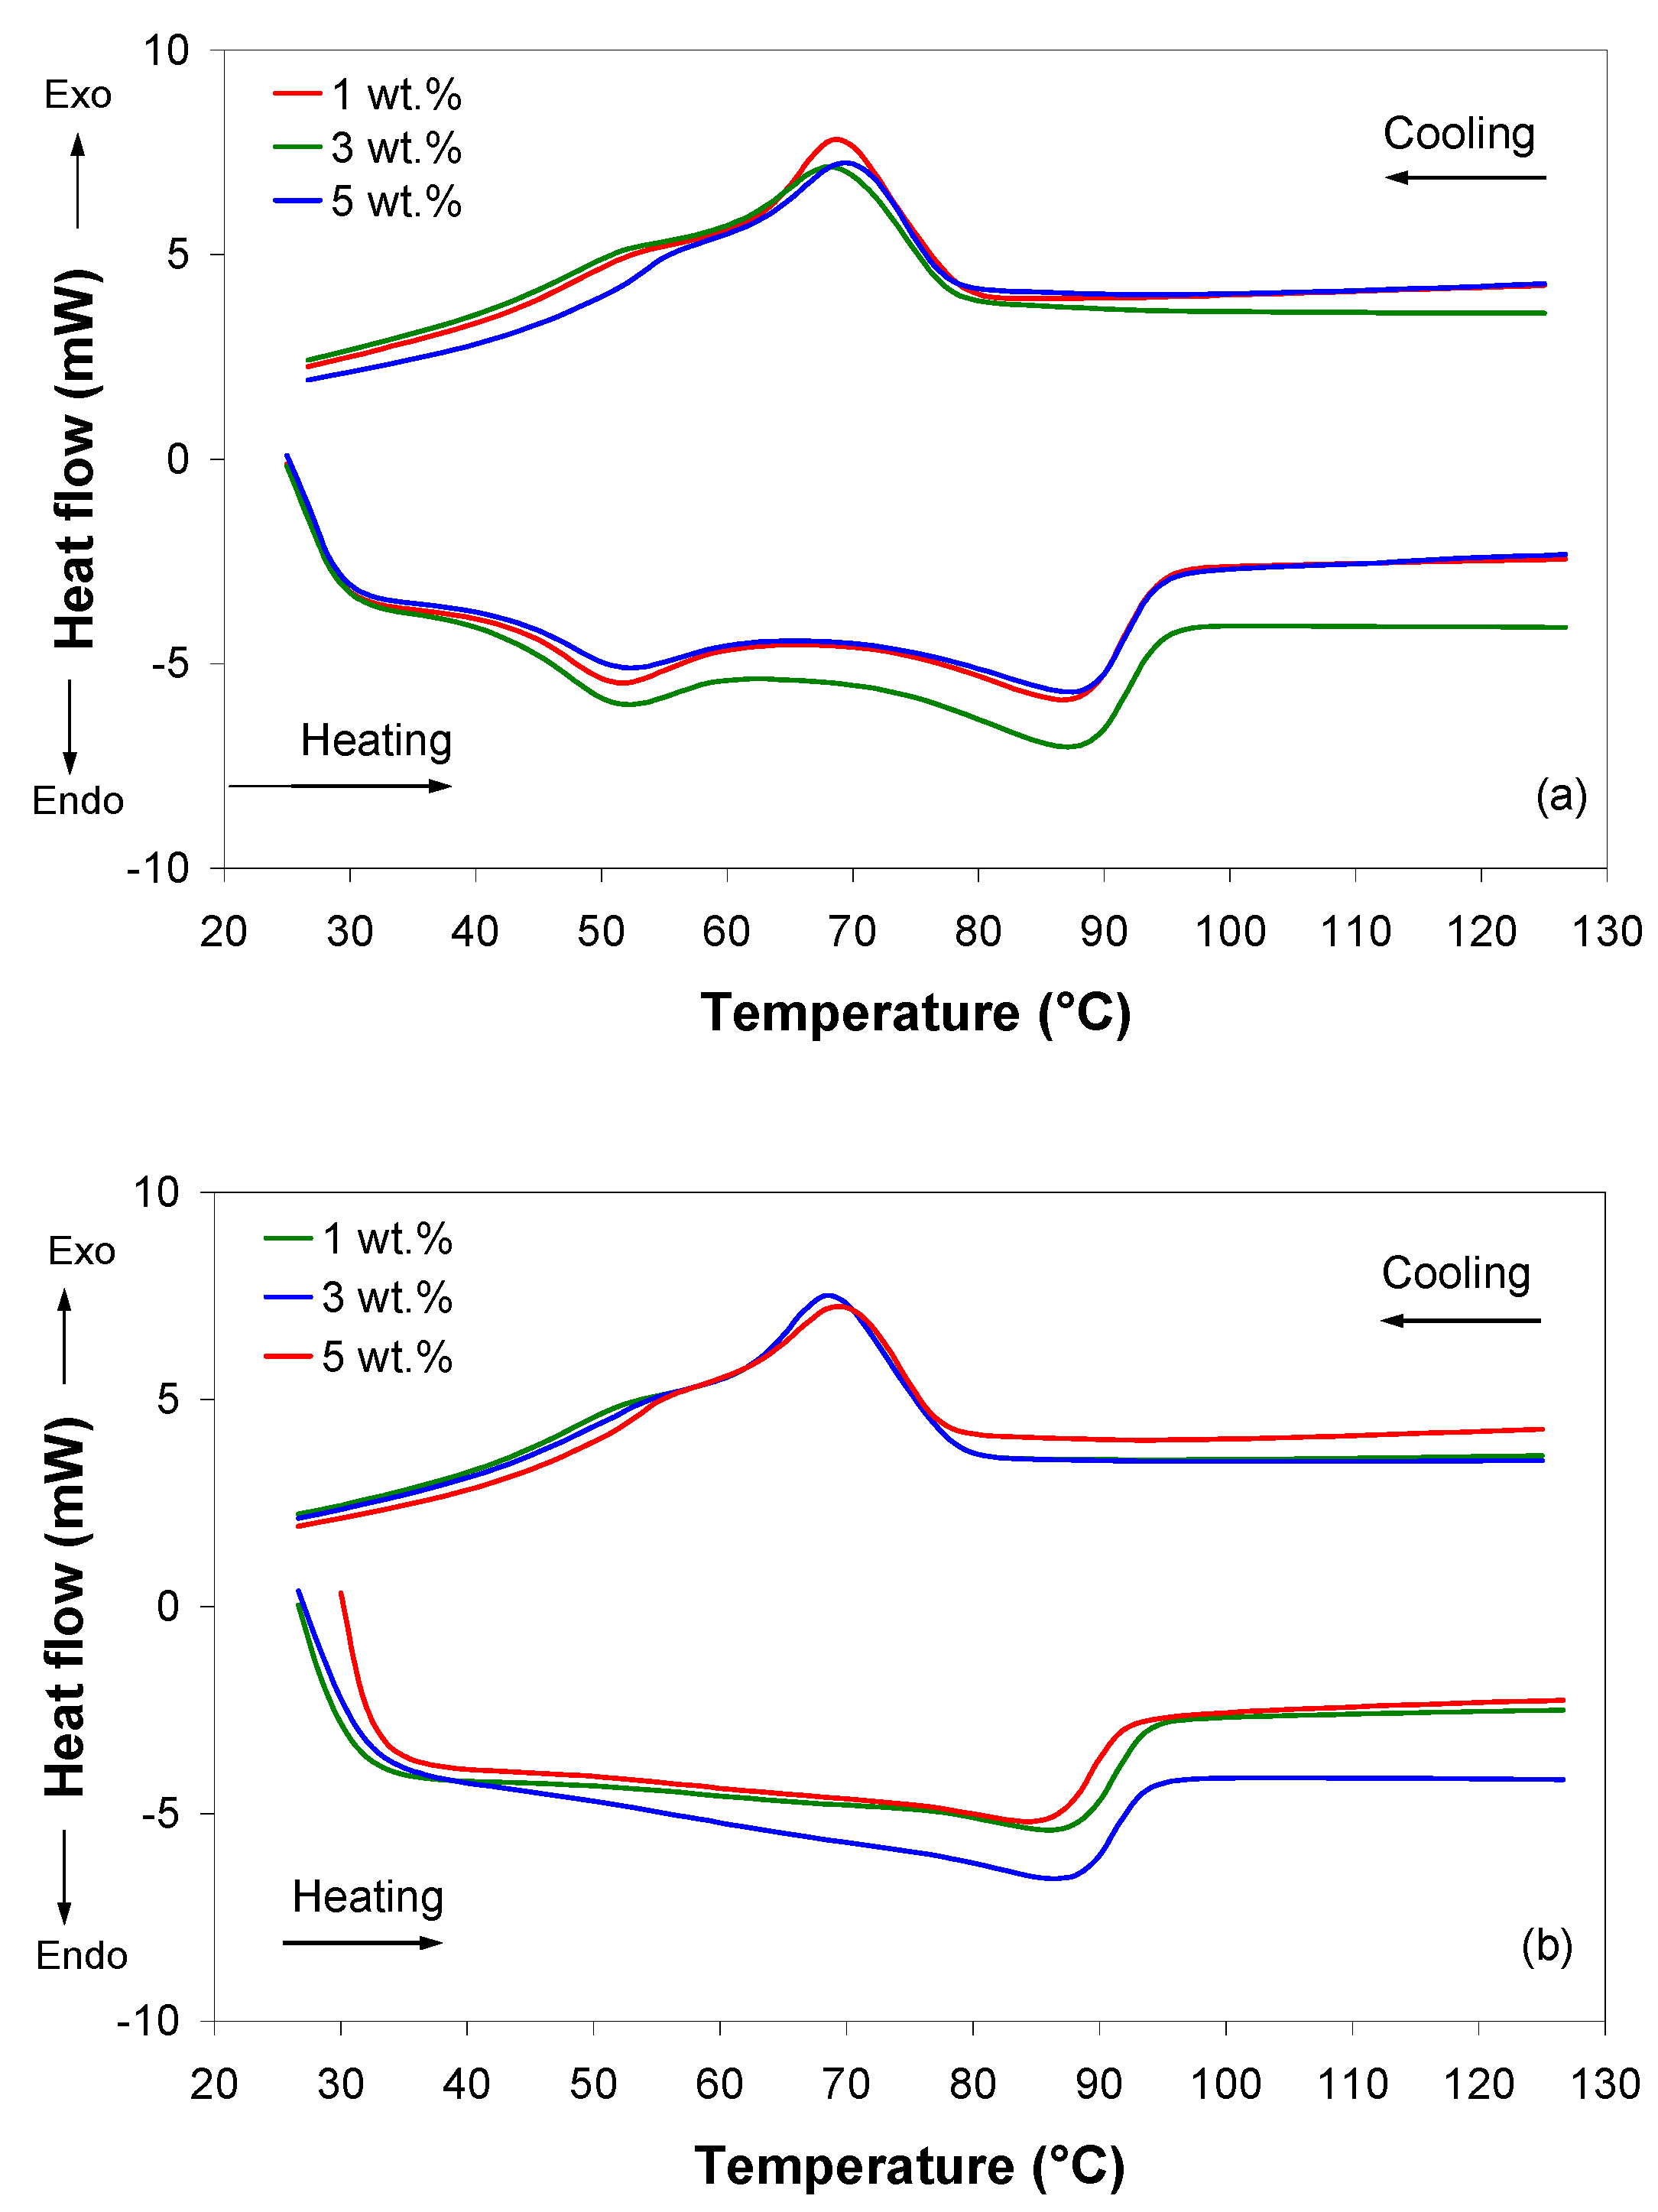
3.1. Crystallization and Melting Behavior of EVA/MWCNT Composites
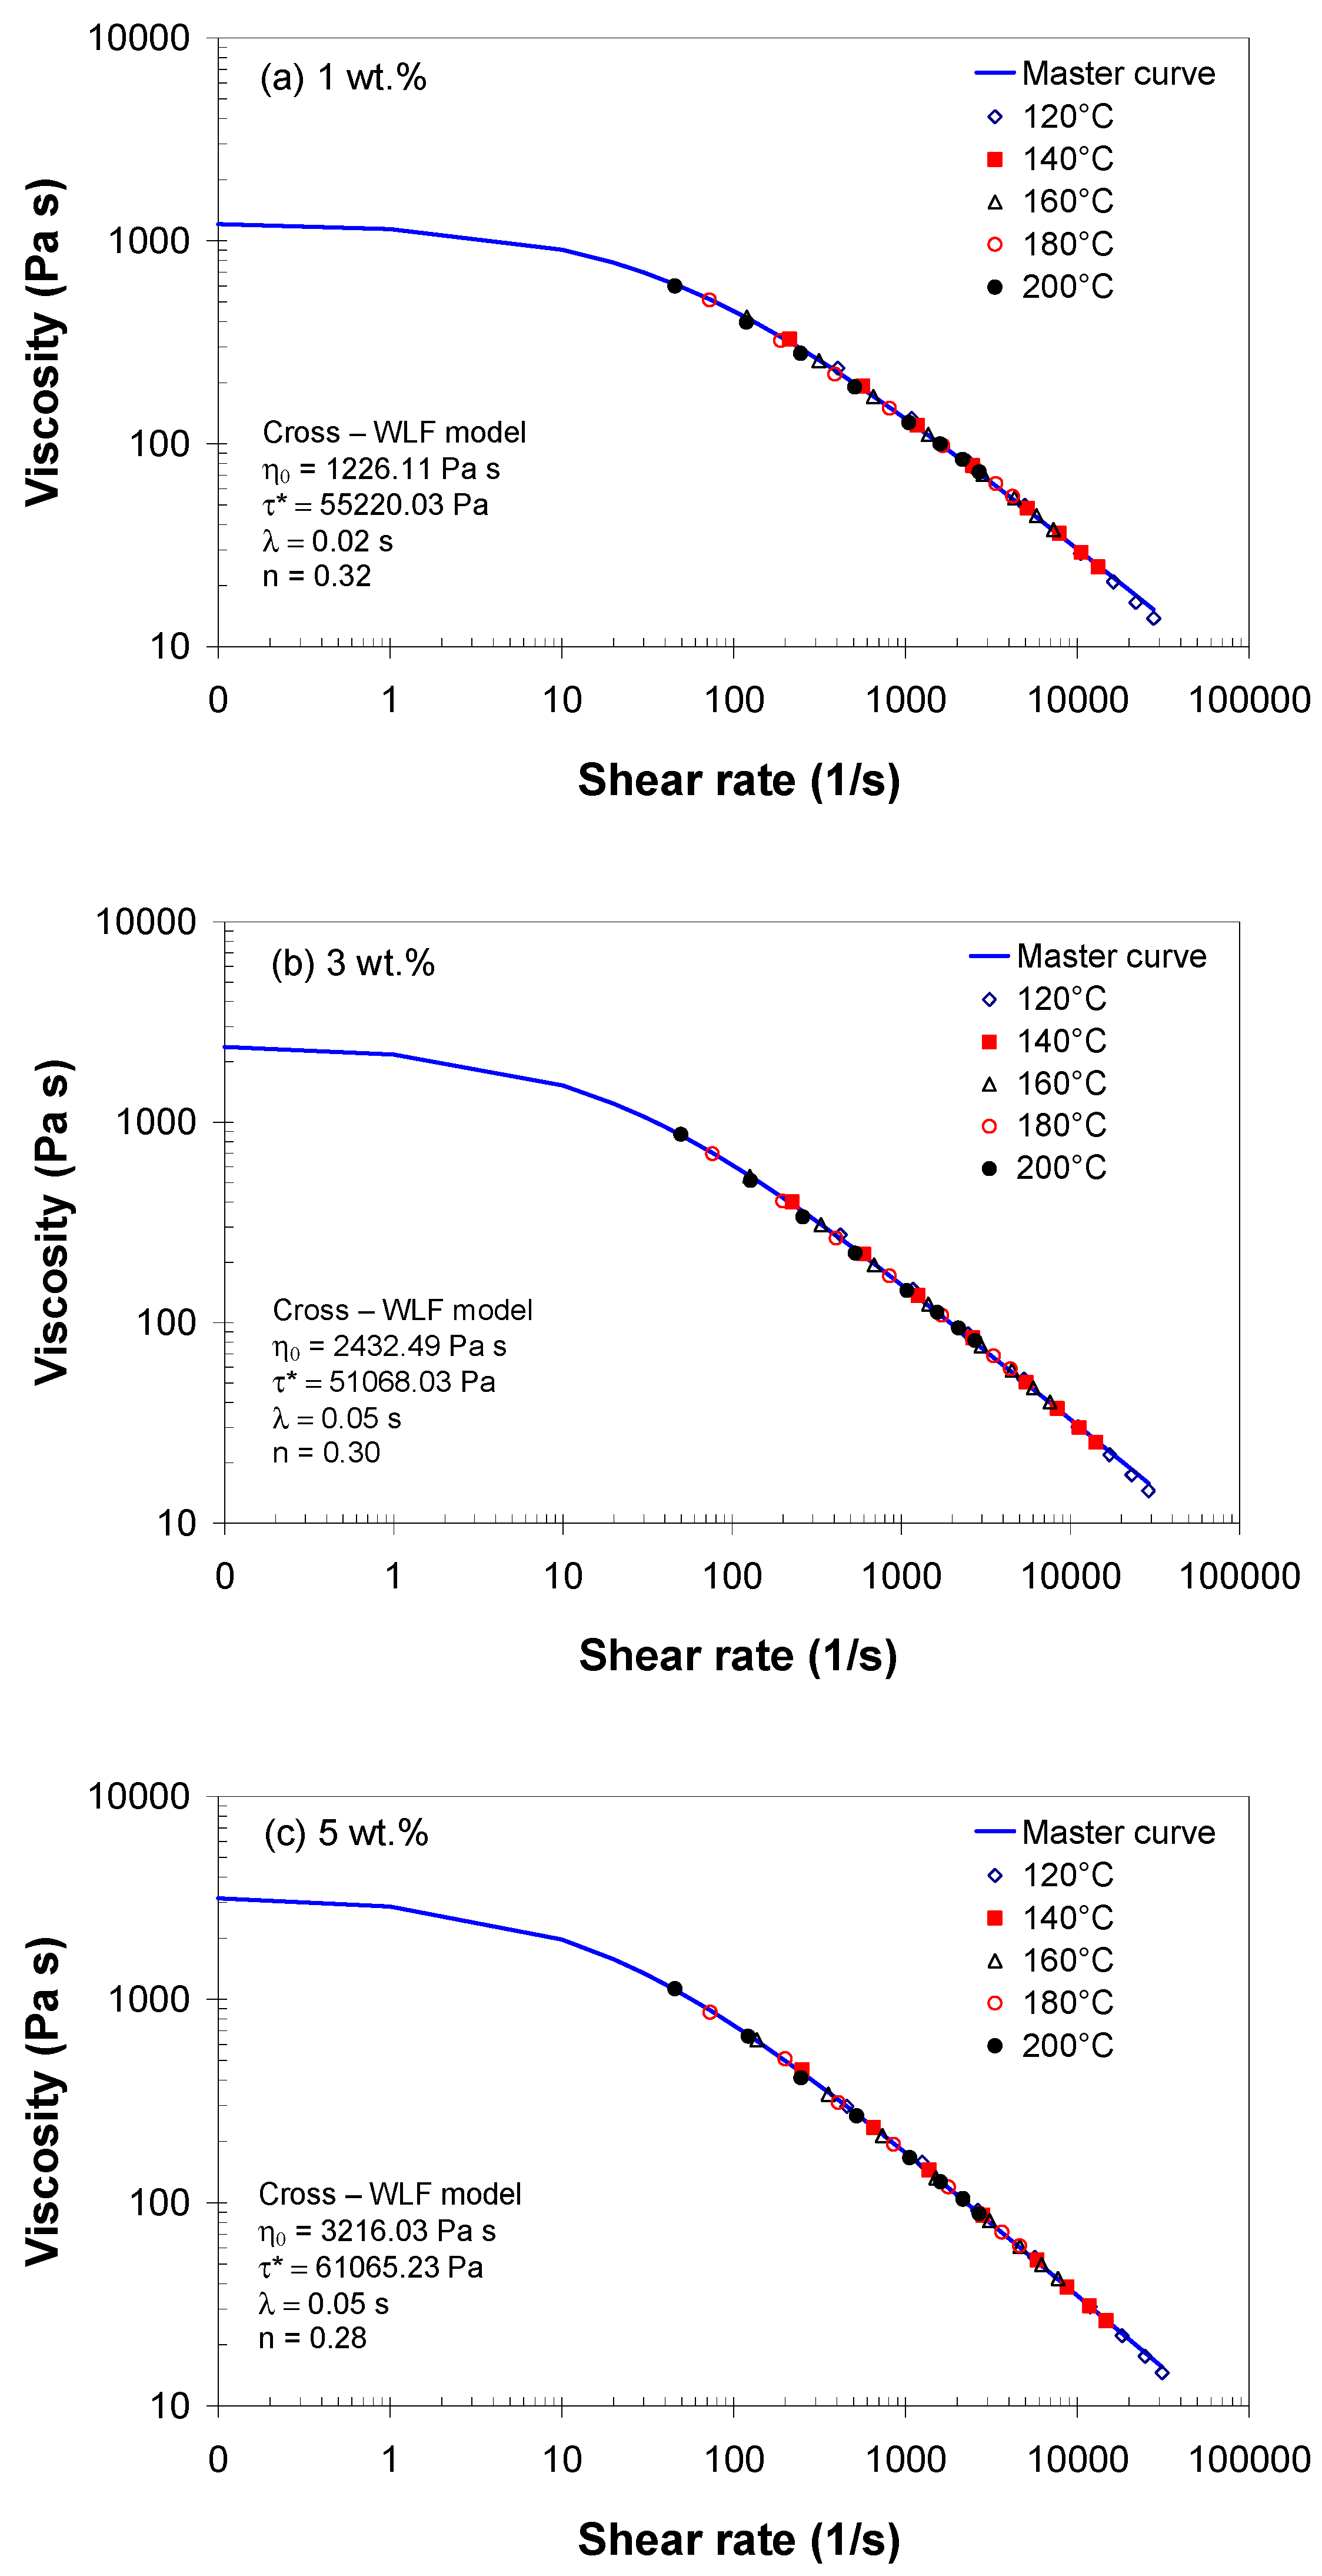
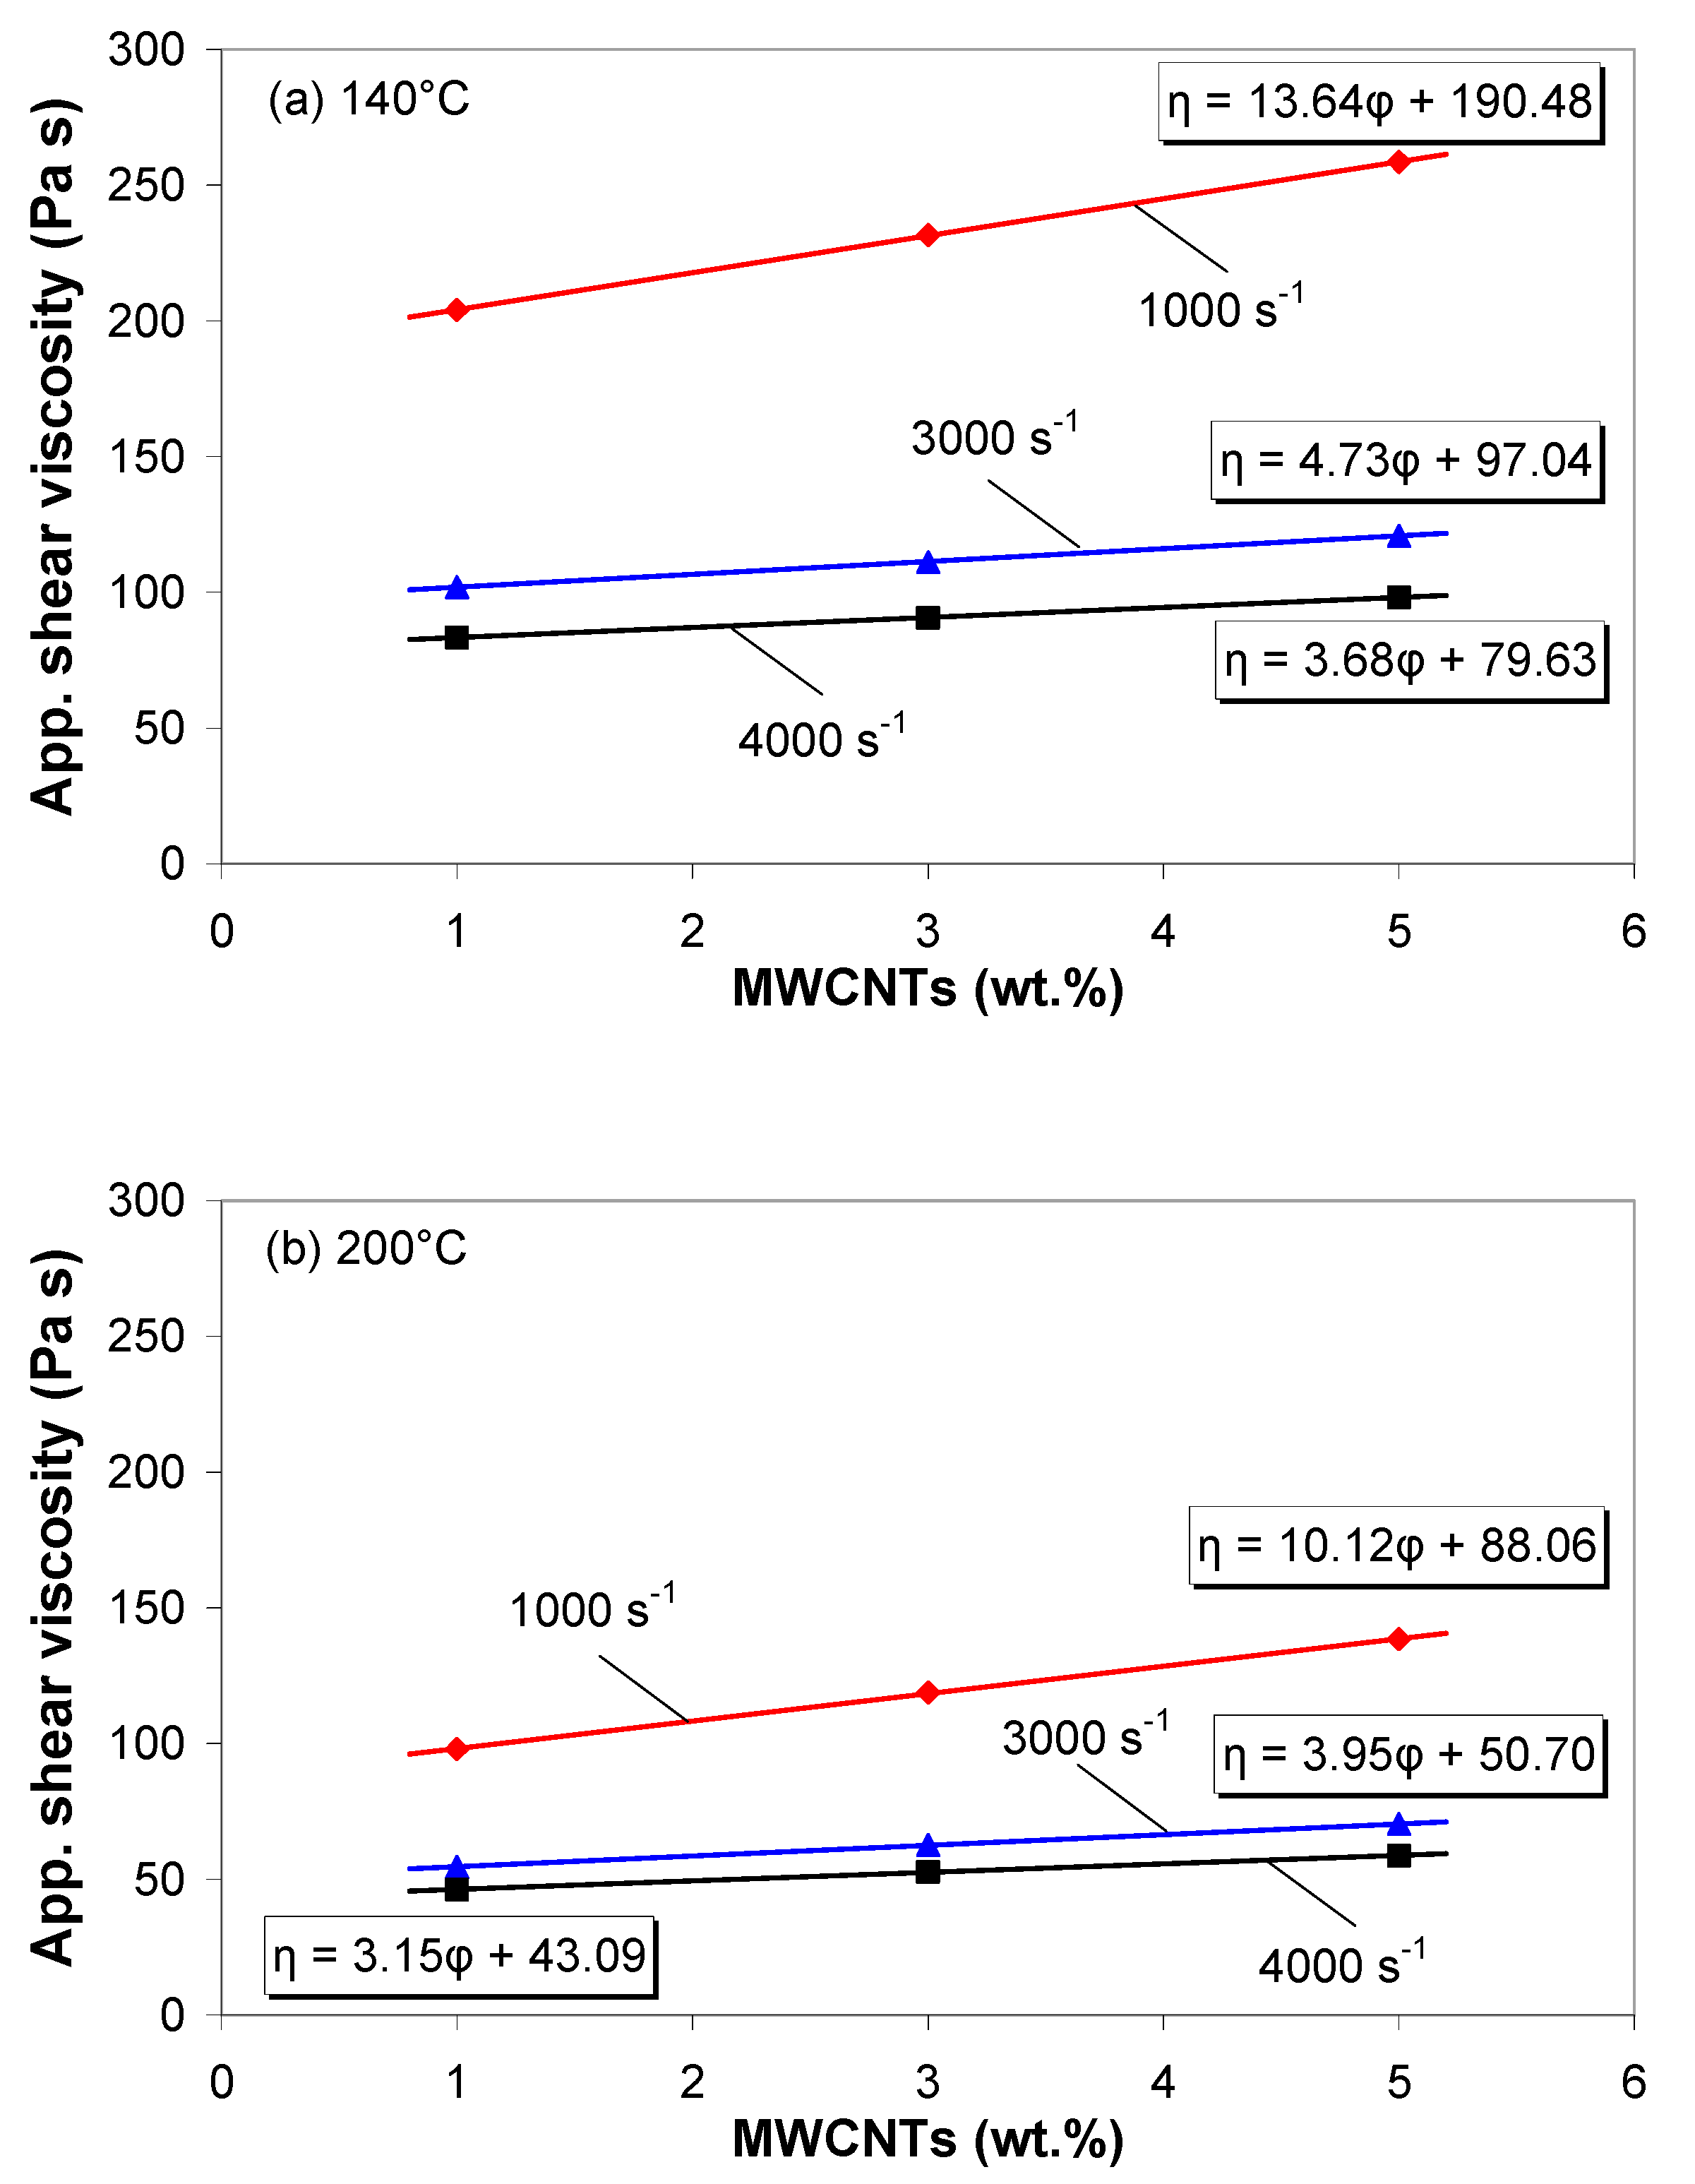
3.2. Flow Curves
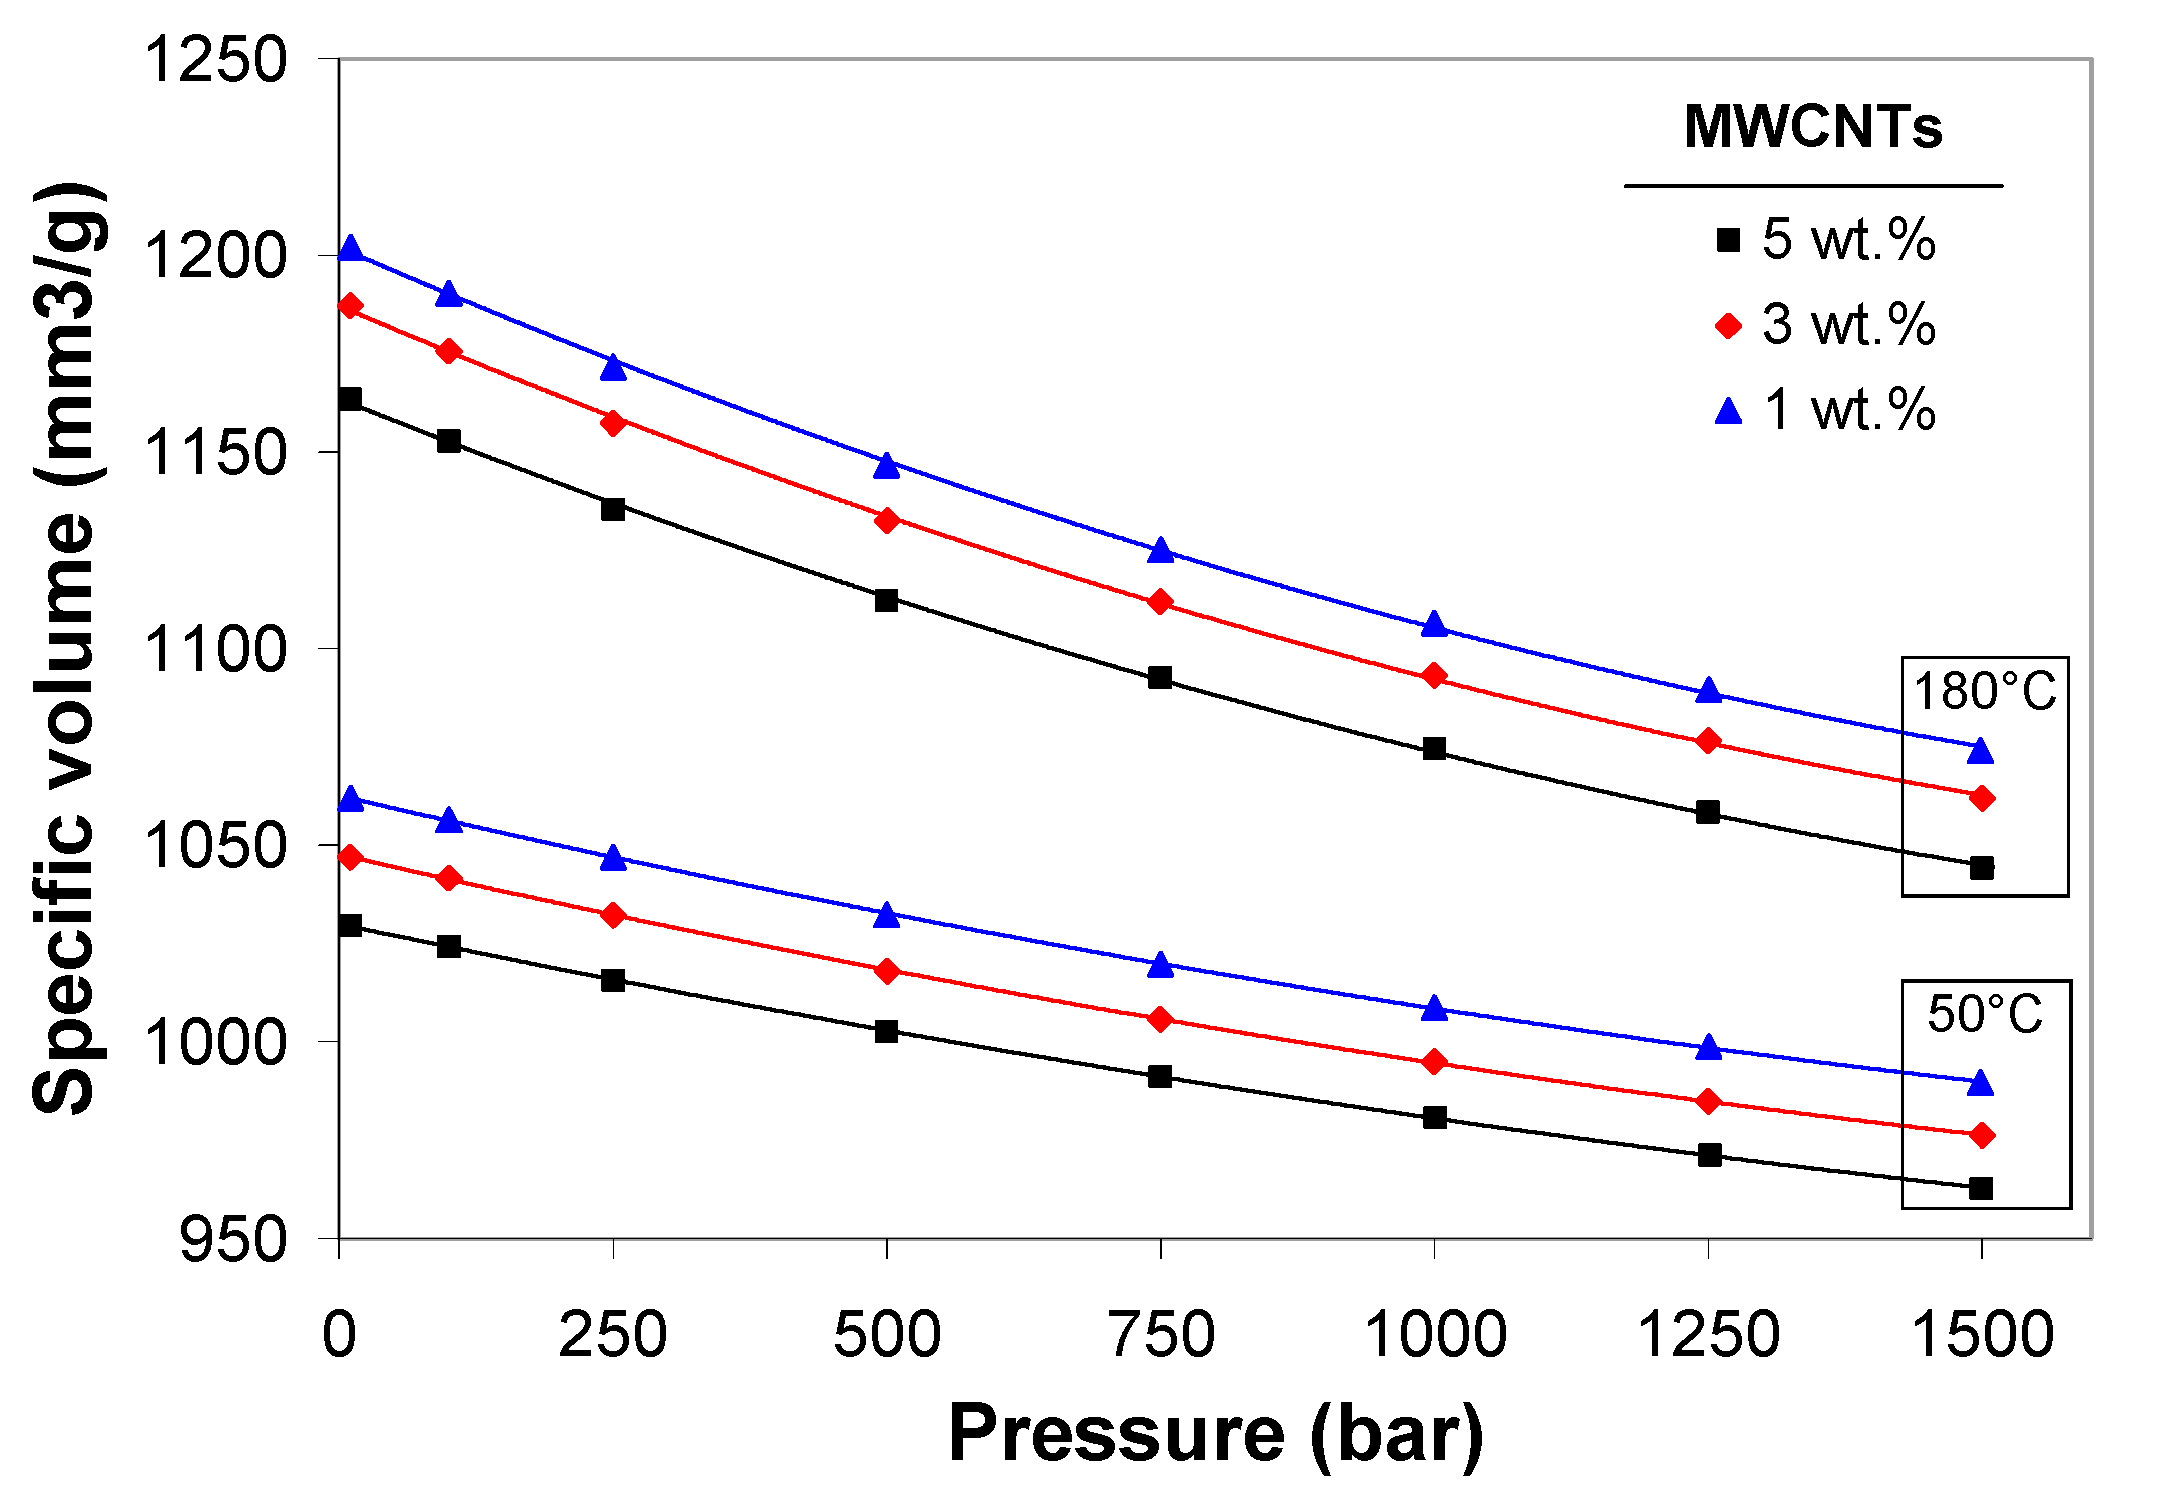
3.3. pvT Data
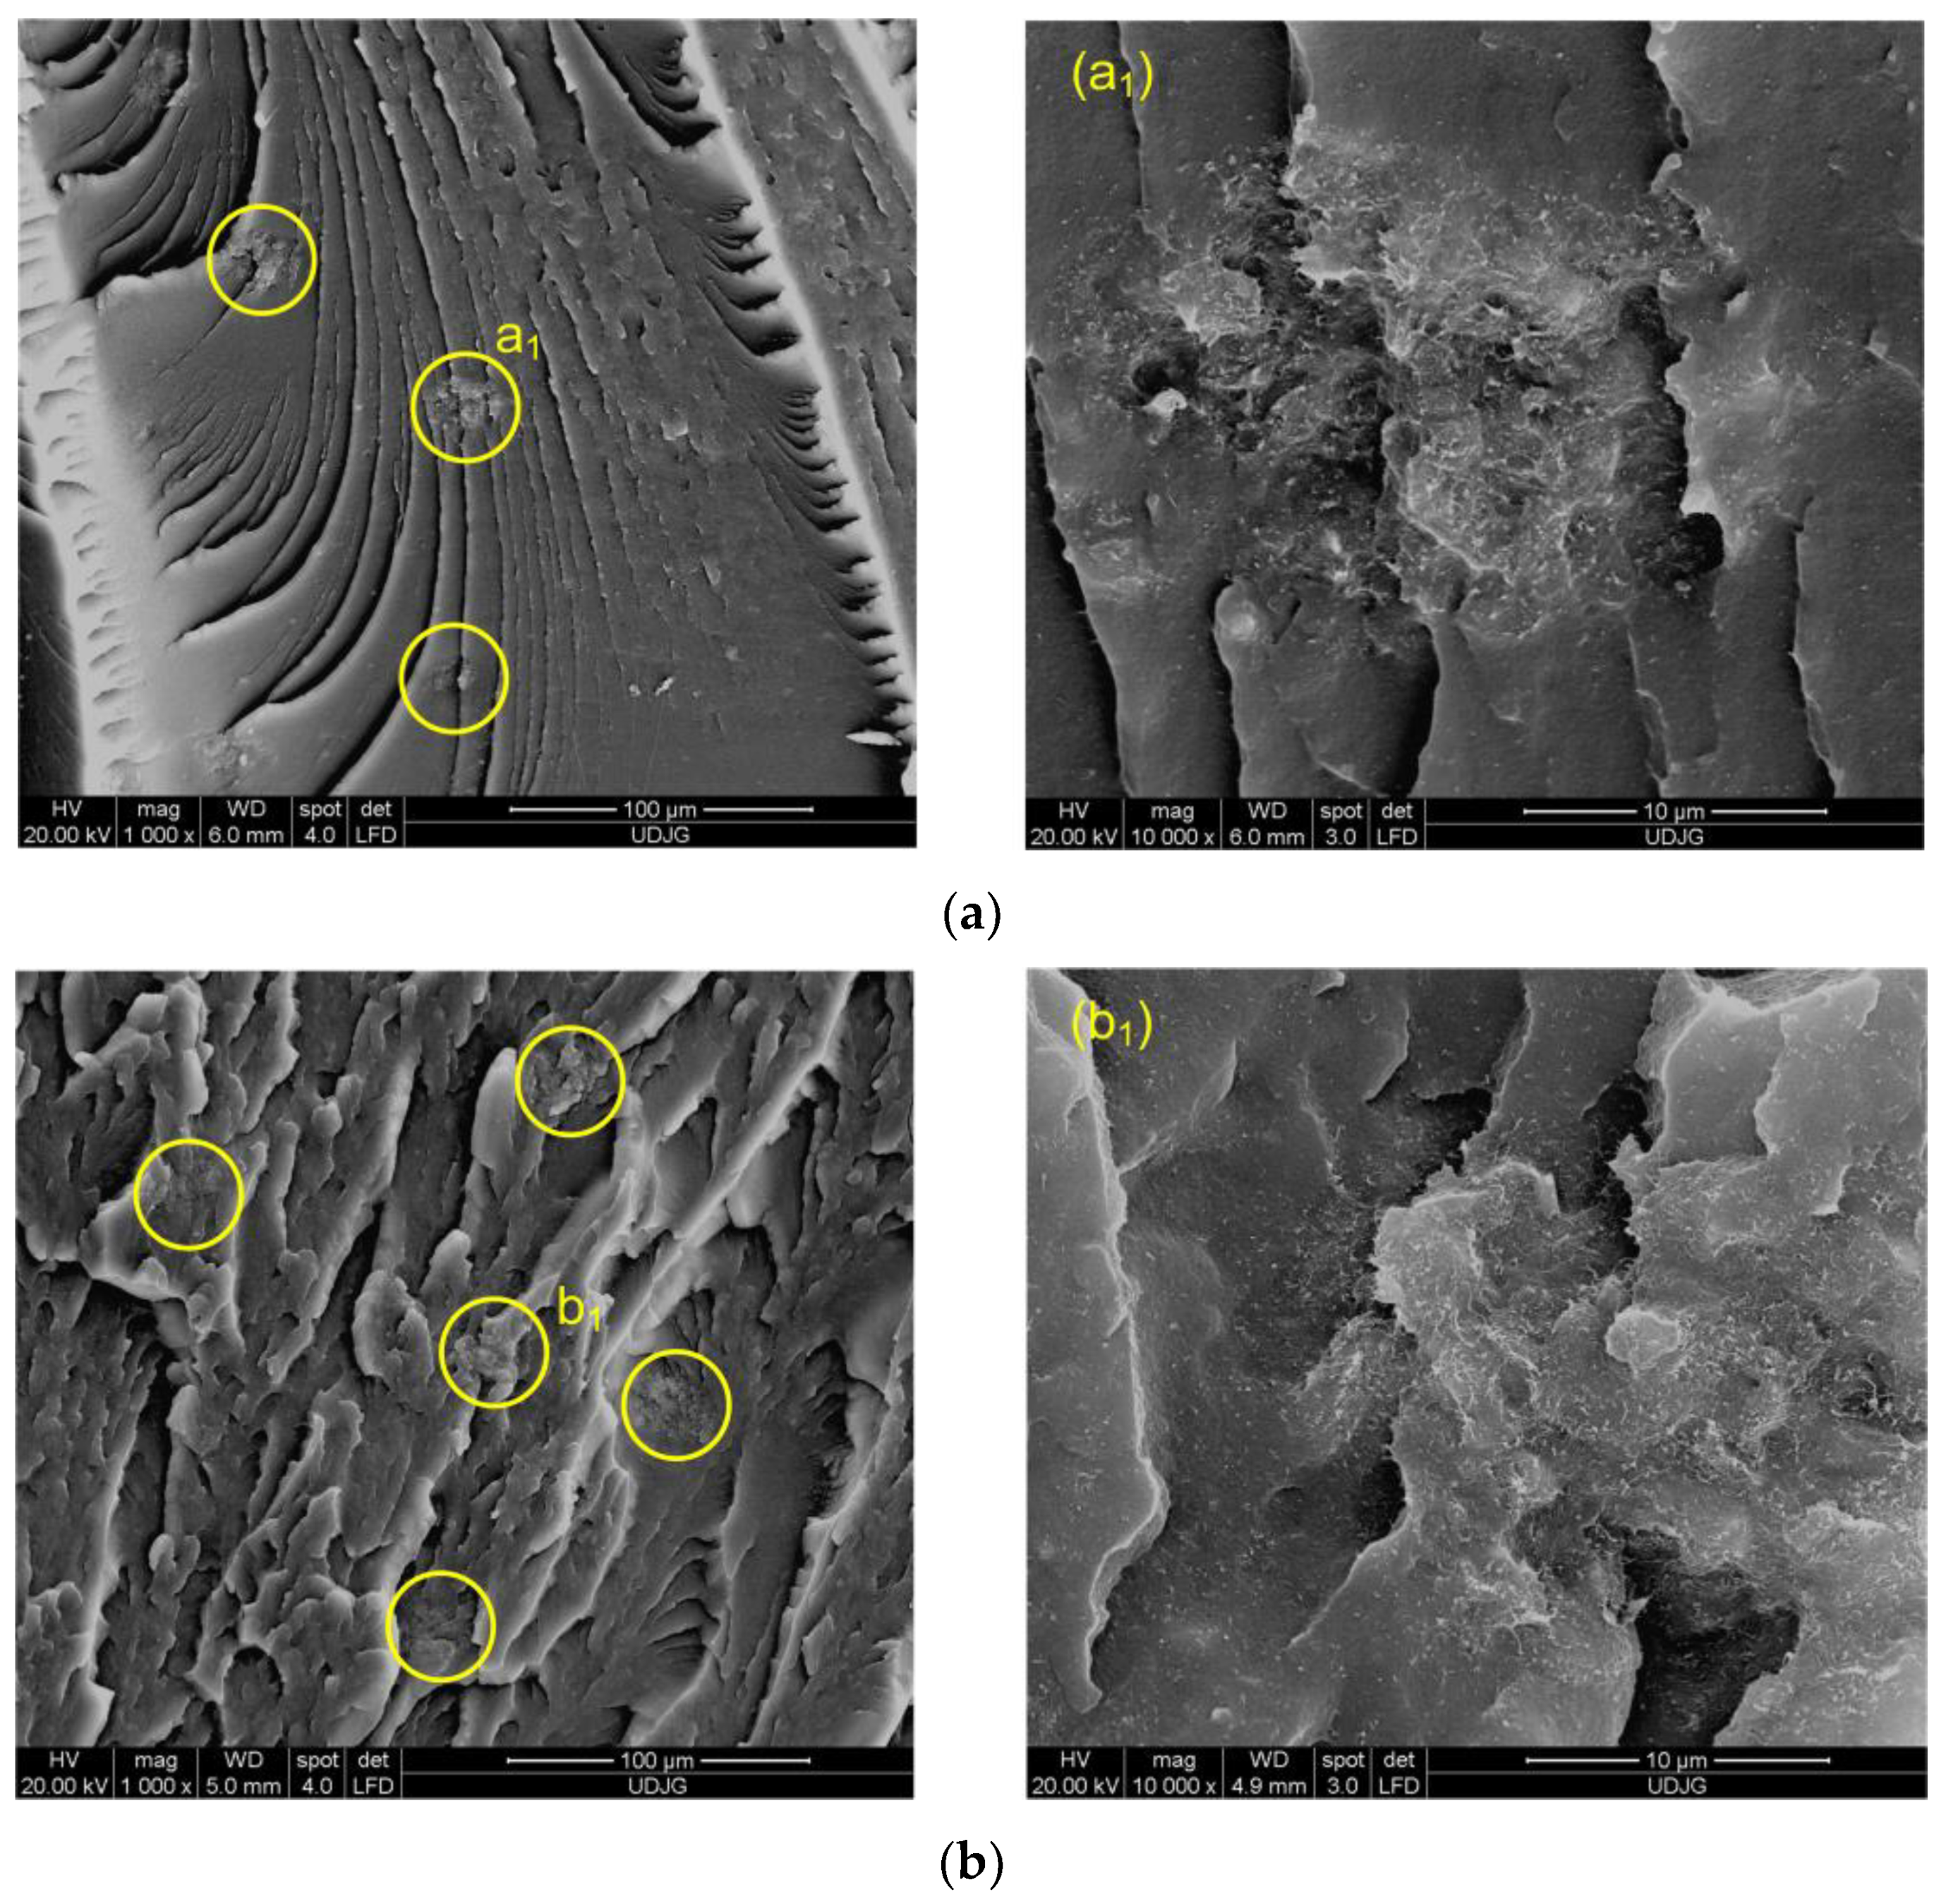
3.4. Morphology of EVA/MWCNT Composite
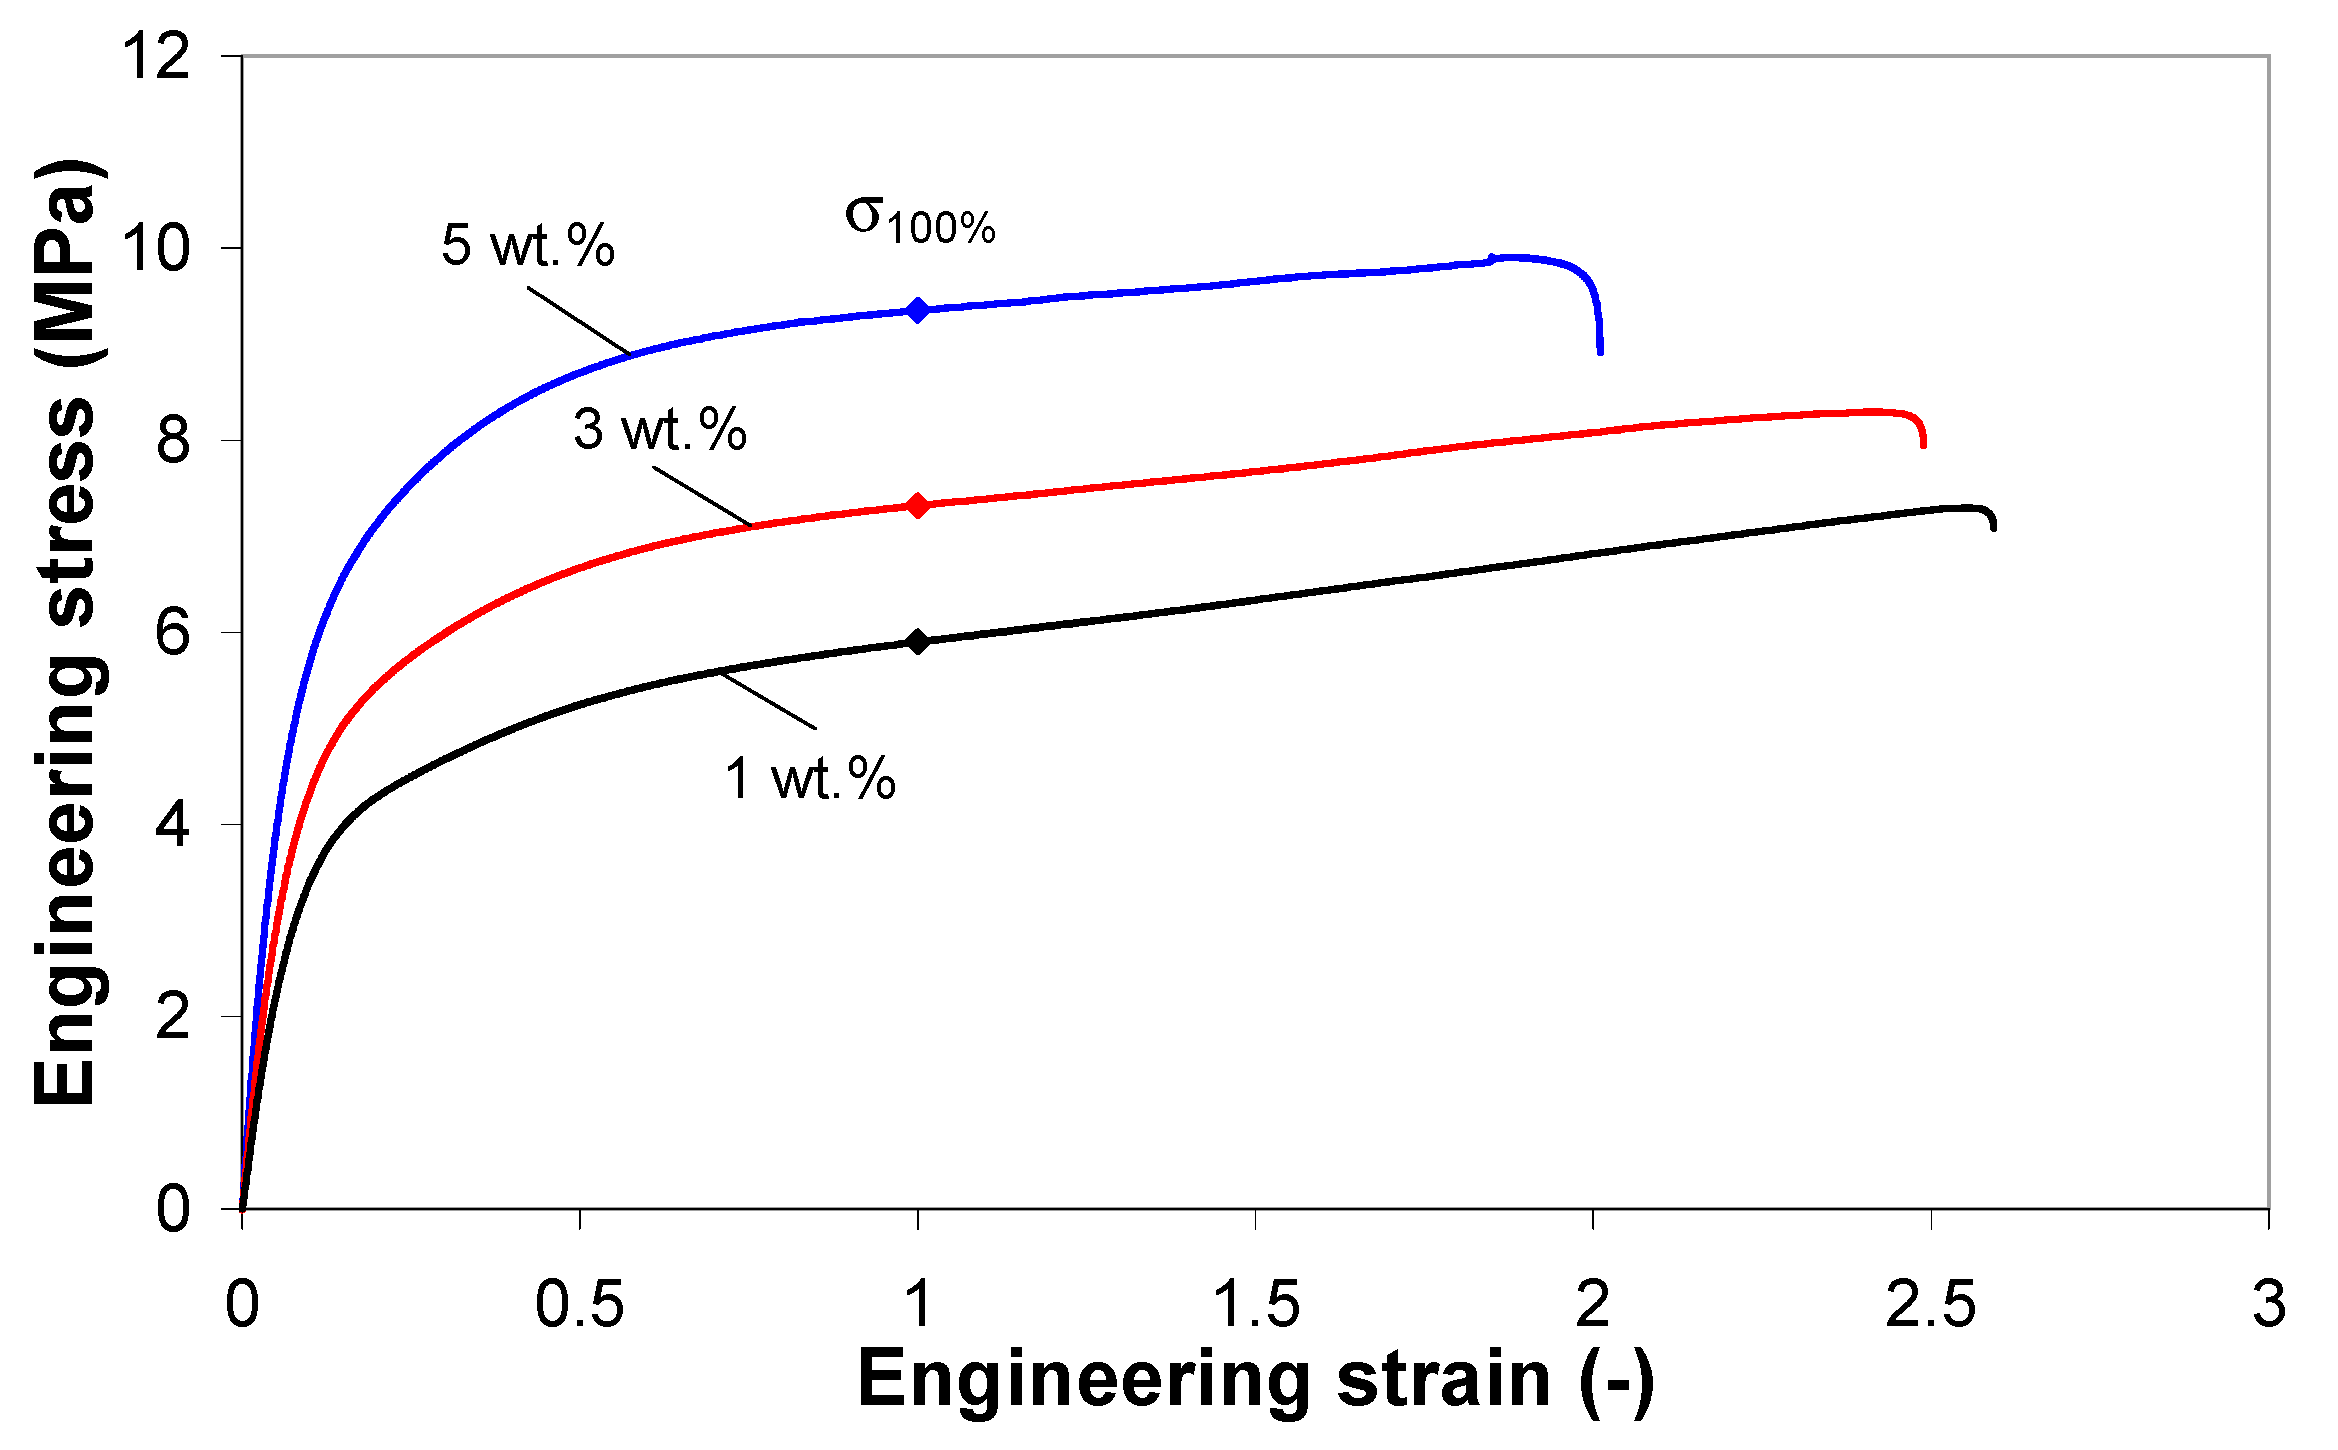
3.5. Mechanical Properties of EVA/MWCNT Composites
3.6. Prediction of Elastic Modulus and Solid Density
3.7. Electrical Conductivity of the EVA/MWCNT Composite
3.8. Modeling of Electrical Conductivity
4. Conclusions
- The melt shear viscosity of the EVA/MWCNT composite increases with increasing MWCNT wt.%, especially at low shear rates, and decreases with increasing shear rate and/or temperature. At high shear rates, the EVA/MWCNT composite displays shear thinning (n < 0.35), and stronger solid-like behavior is observed at higher nanotube loading.
- The presence of the nanotubes lowers the mobility of the polymer chains and increases the flow activation energy. Evaluation of the melt shear viscosity of the EVA/MWCNT composites gives an Arrhenius flow activation energy of about 12.5 to 22.5 kJ/K mol.
- The specific volume of the EVA/MWCNT composite was found to increase with increasing temperature and decrease with increasing pressure and/or nanotube content. The pvT data were well described by the Tait equation both in liquid and solid state.
- The DSC melting and crystallization temperatures are not affected by the presence of the nanotubes, while the enthalpy of crystallization decreases with increasing MWCNT wt.%. However, the pvT transition temperature increases linearly with increasing pressure, e.g., the transition temperature increased by 20 to 30 °C as the pressure increased from 10 to 1500 bar, depending on the nanotube loading.
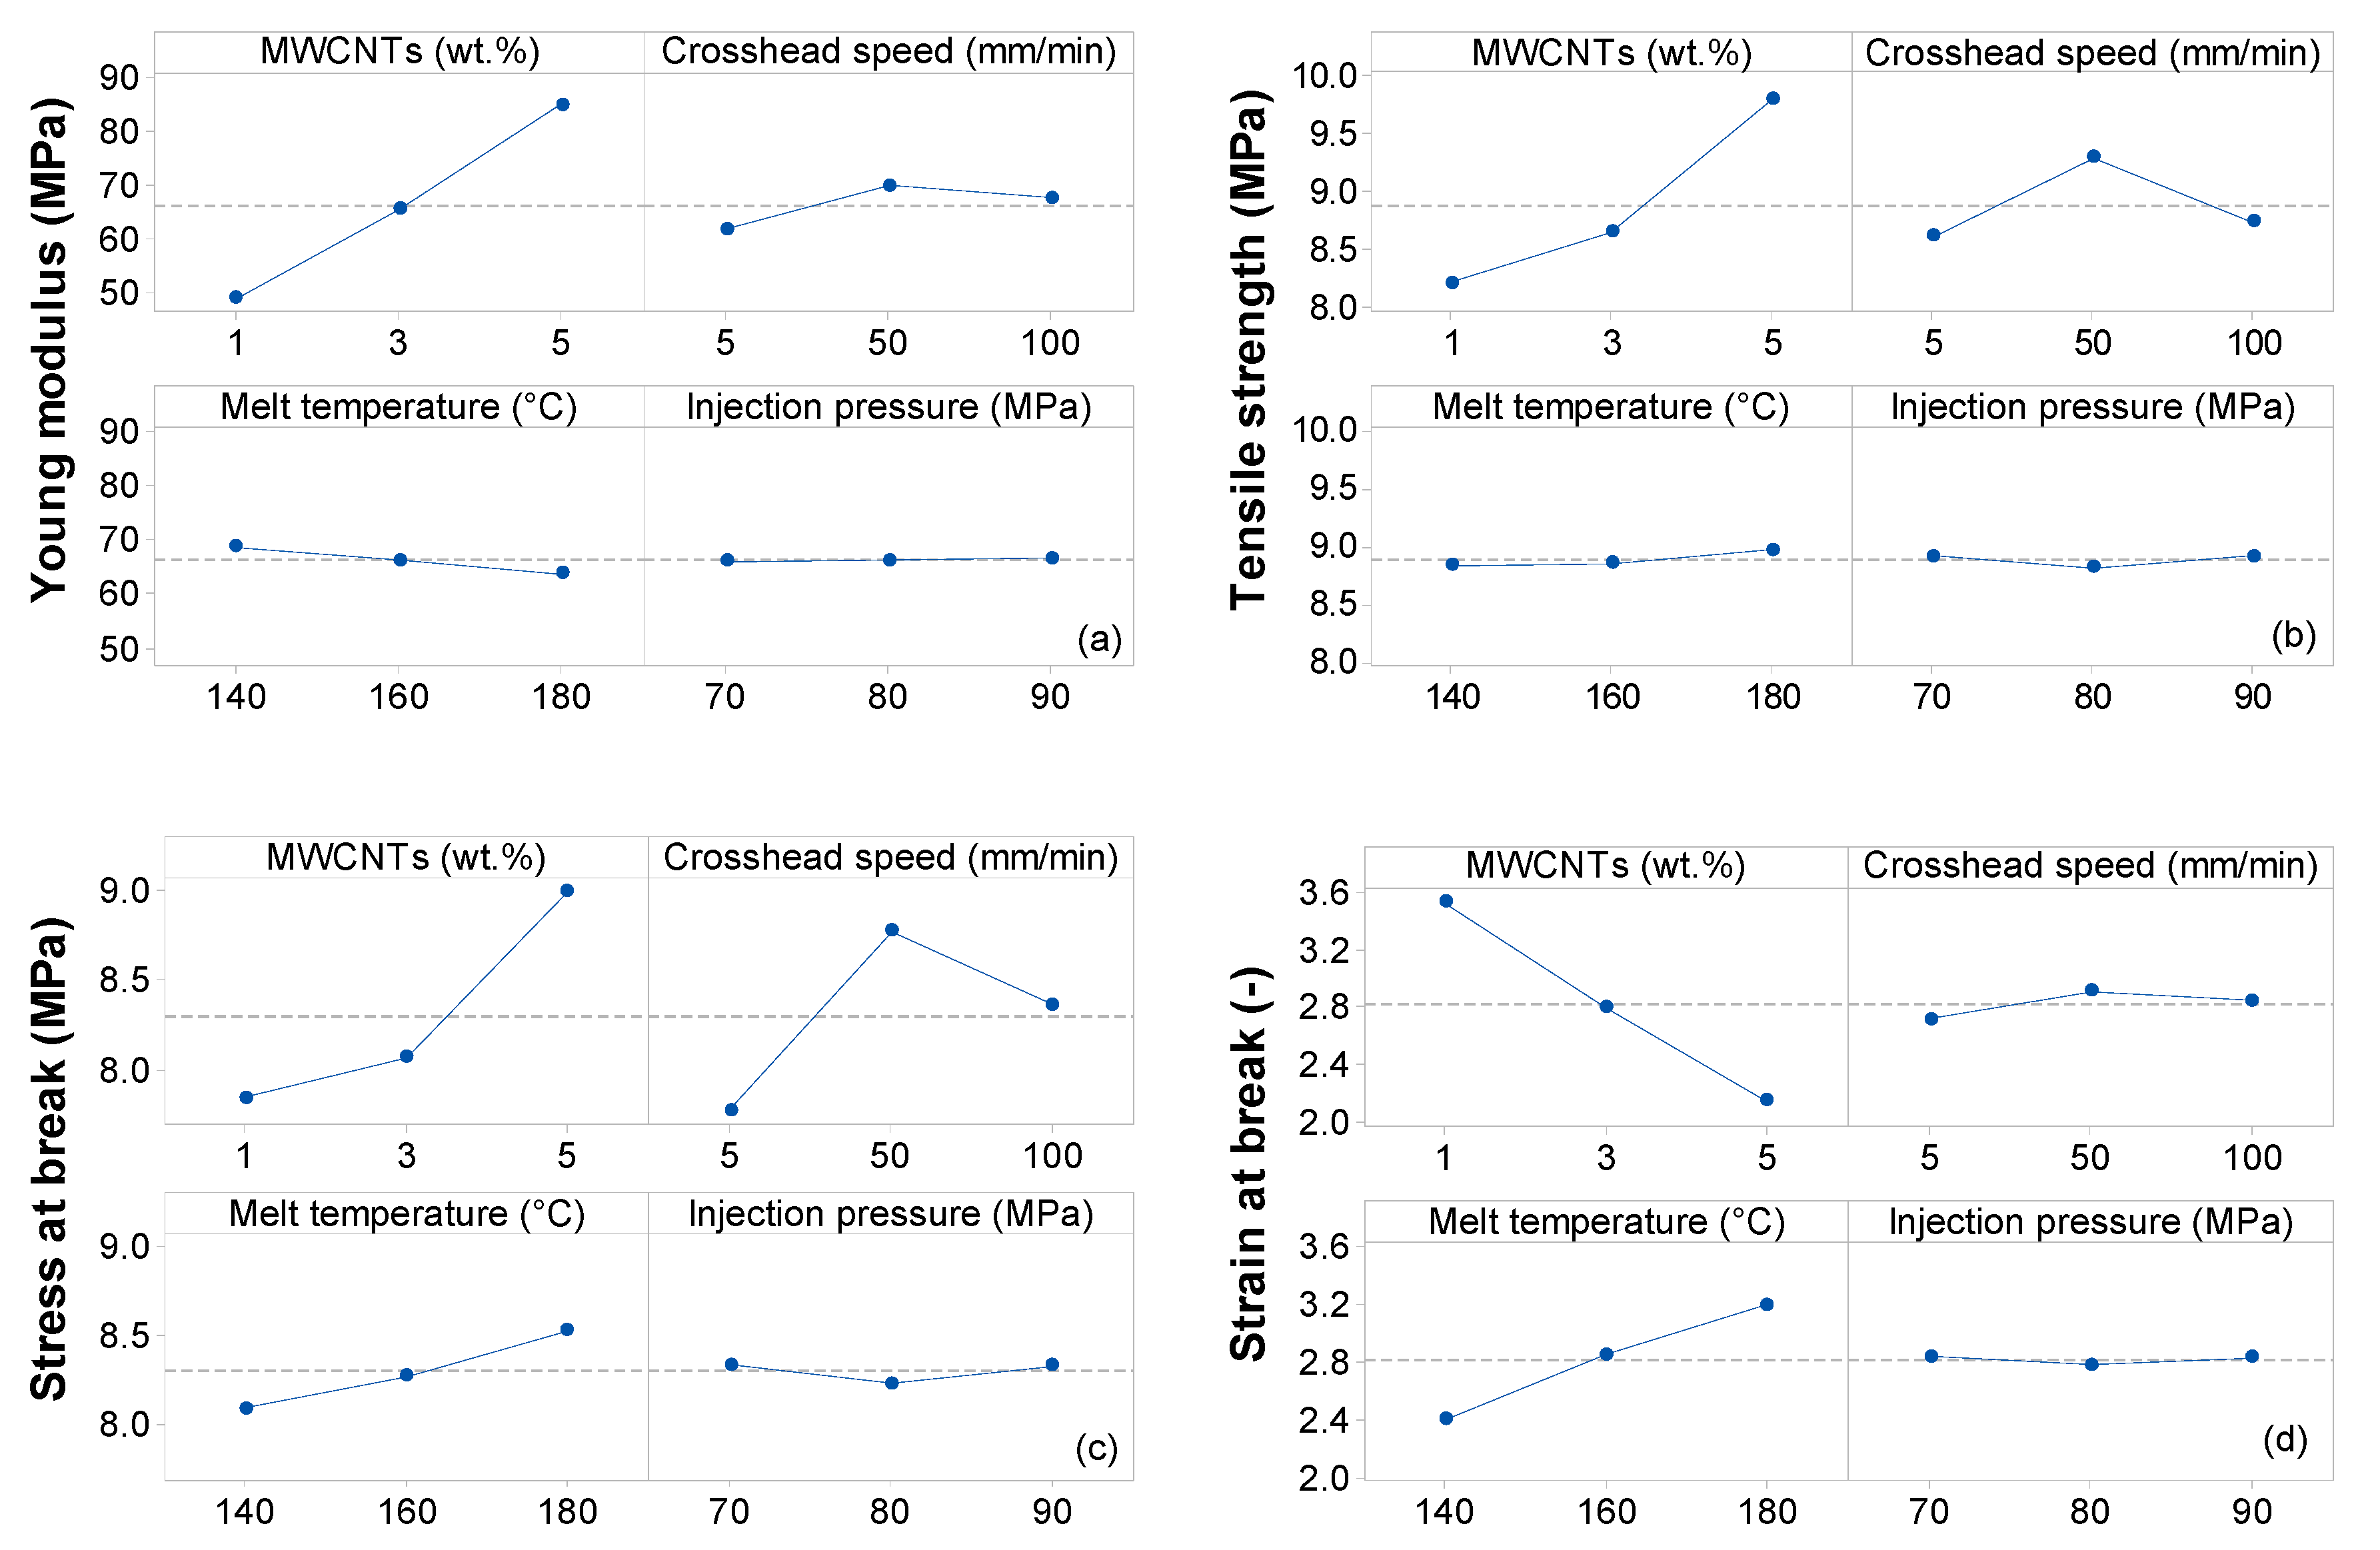
- The mechanical properties of EVA/MWCNT composites were found to be significantly affected by the addition of nanotubes. Incorporation of 5 wt.% MWCNTs into the EVA polymer results in an increase in elastic modulus and yield strength by, respectively, 70% and 20% compared to the composite with 1 wt.% of MWCNTs. On the other hand, the decrease in the strain at break with addition of MWCNTs suggests the formation of MWCNT agglomerates.
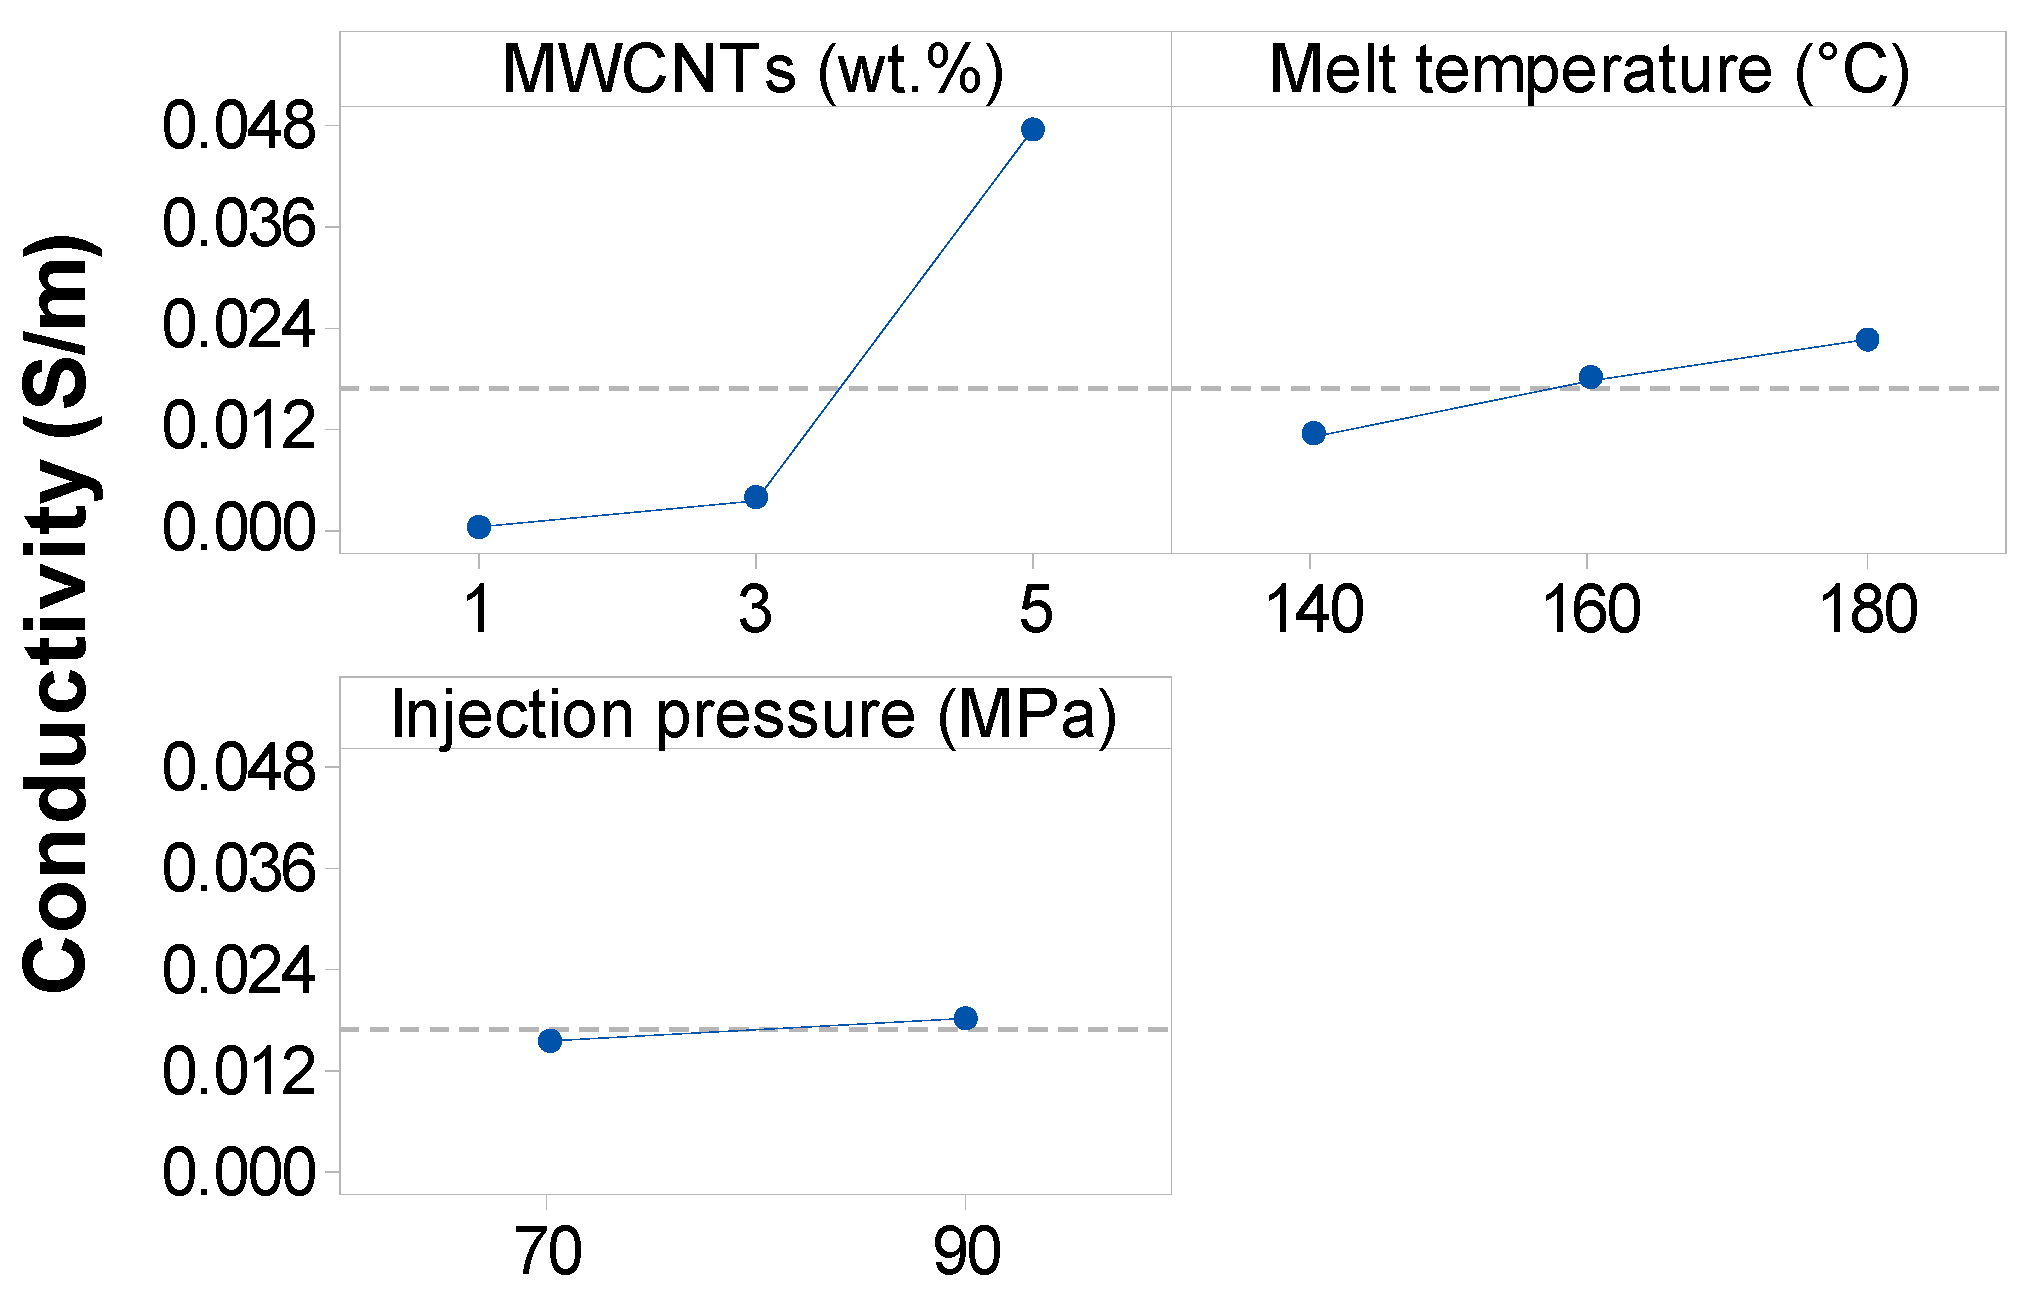
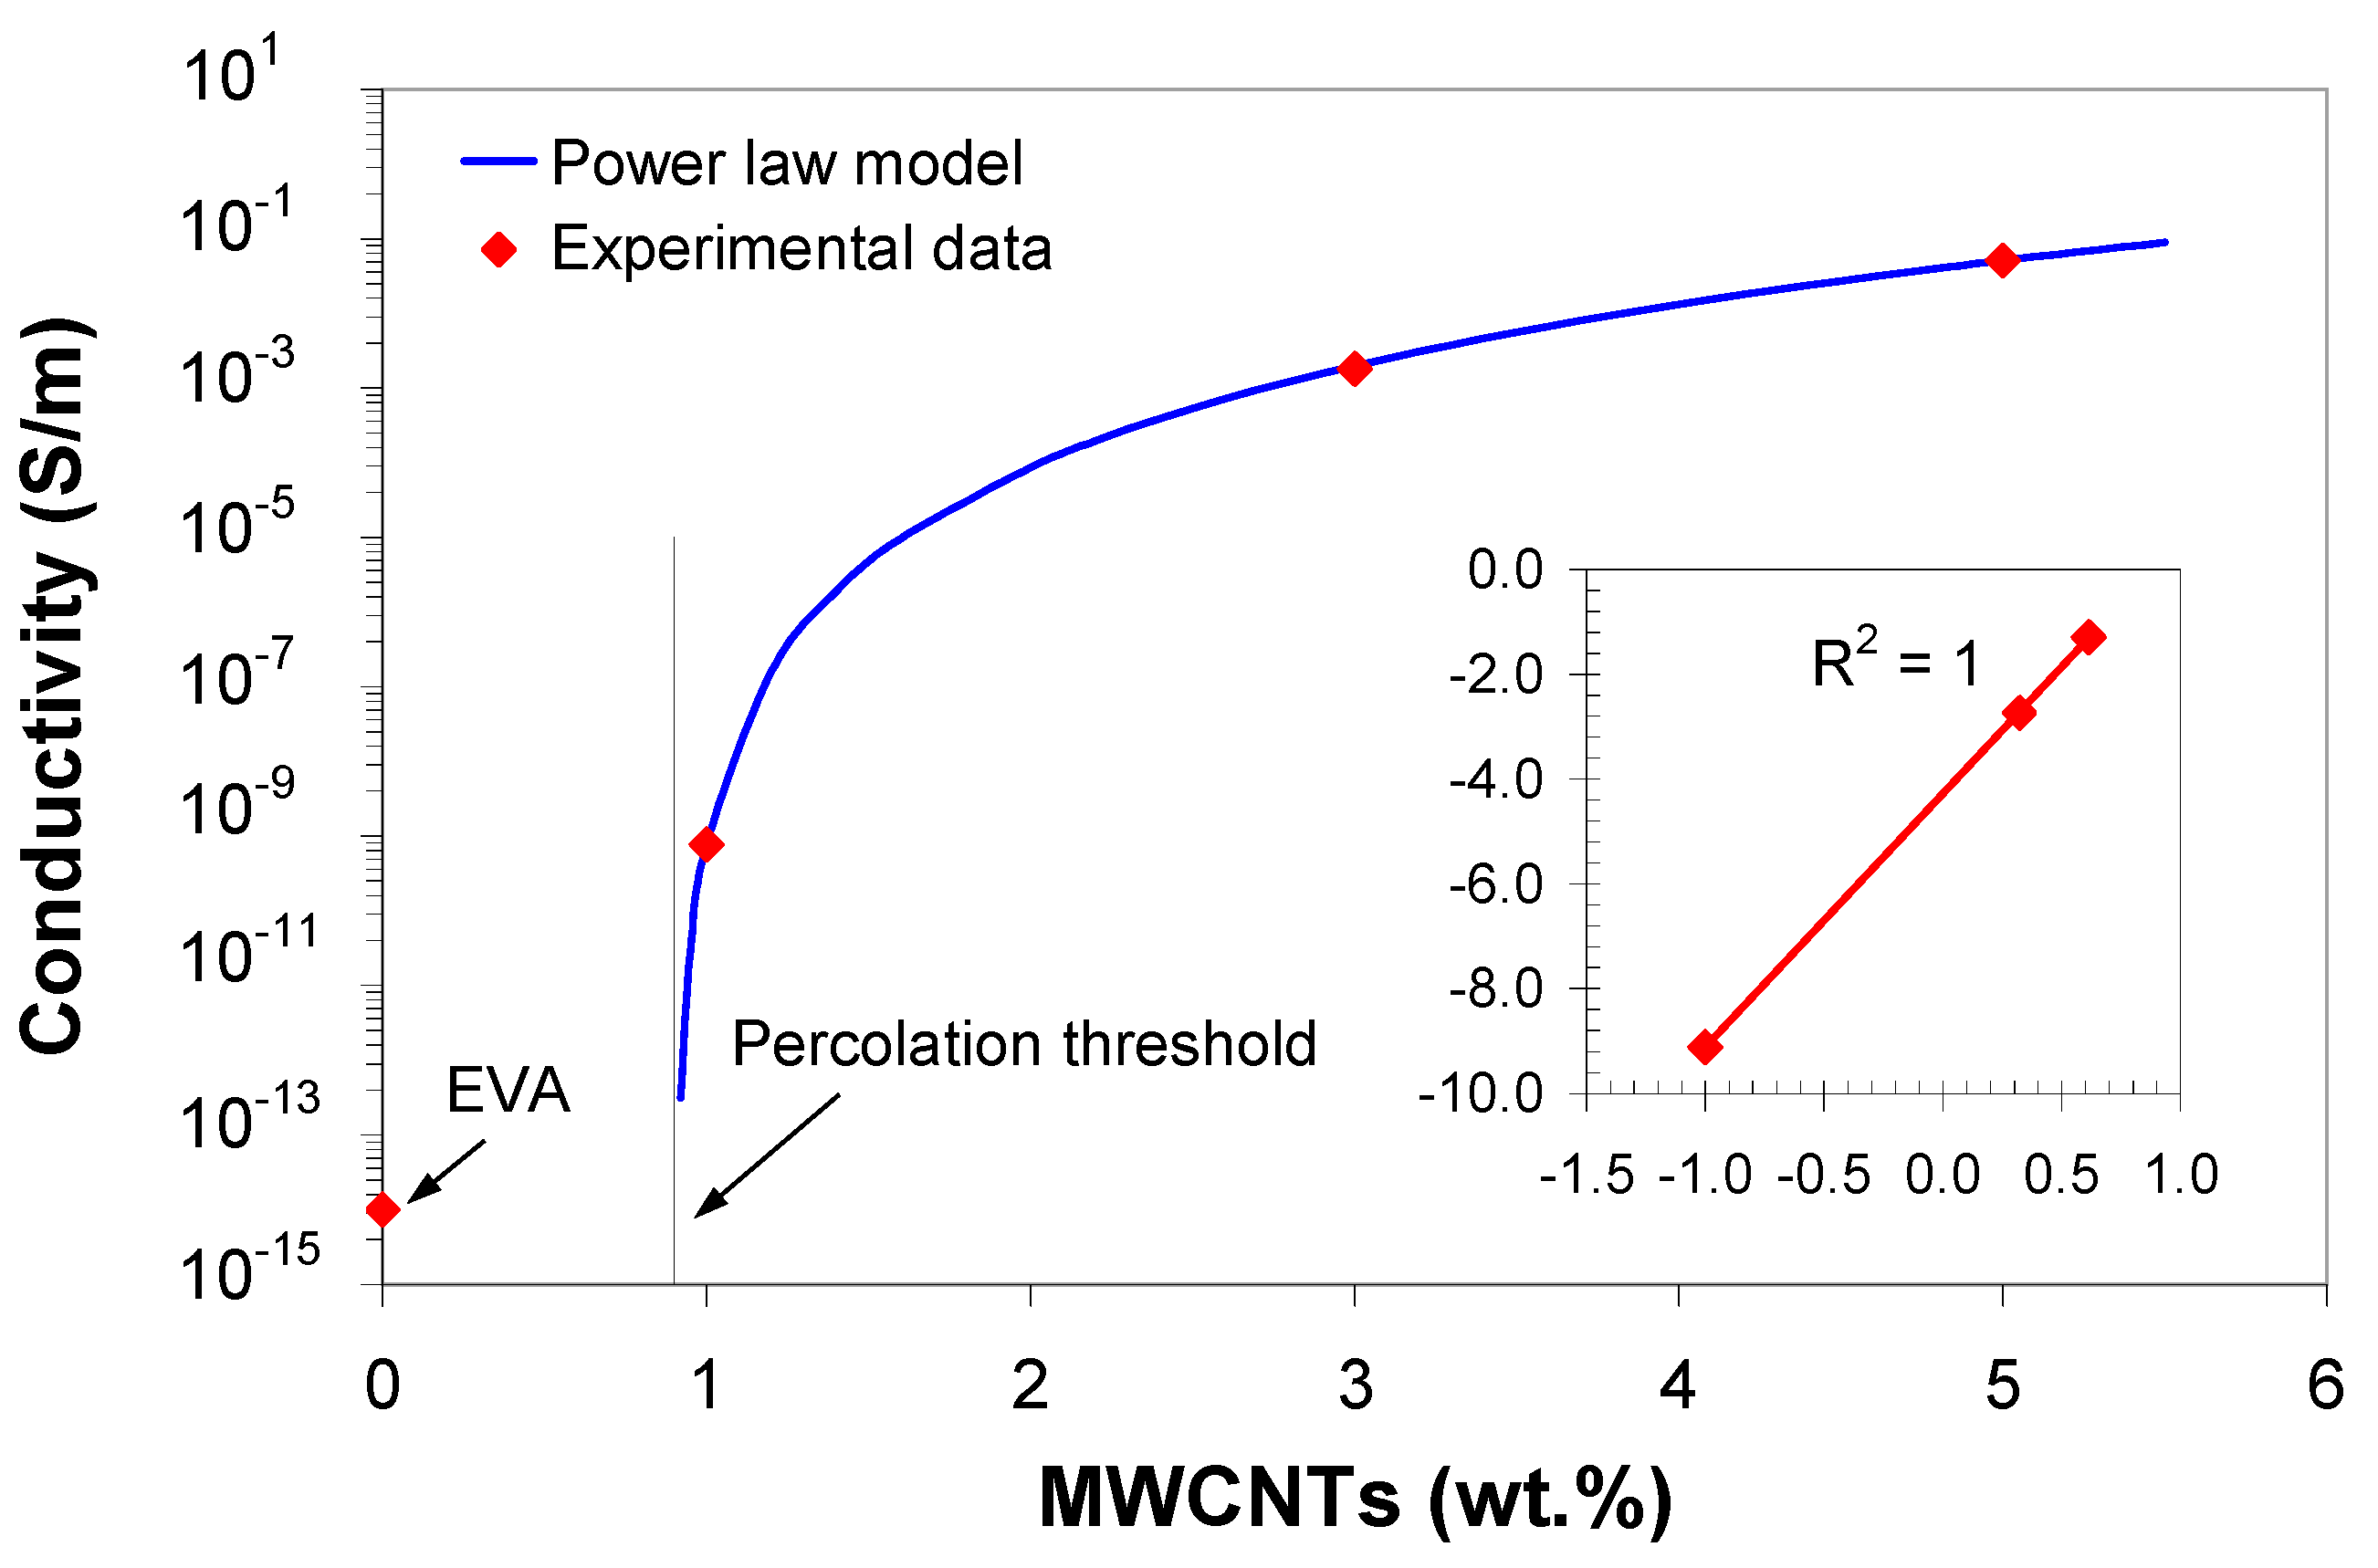
- The electrical conductivity of the EVA/MWCNT composite increased with increasing MWCNT wt.% and melt temperature. For 1 wt.% MWCNTs, the electrical conductivity reached about 10−10 S/m, whereas the value in the composite with 5 wt.% increased by 6 to 8 orders of magnitude and saturated to a value of 10−2 S/m, regardless of the conditions under which they were processed. The electrical conductivity of the EVA/MWCNT composite for optimum conditions (that maximize the conductivity) was found to follow percolation behavior with a threshold mass fraction of 0.9 and higher value of critical exponent 4.95.
- The results recorded for various processing parameters and the ANOVA analysis indicate that, in the investigated range, melt temperature plays a more important role on the mechanical and electrical properties than injection pressure. By controlling melt temperature and MWCNT wt.%, the mechanical and electrical properties can be tailored.
Supplementary Materials
Author Contributions
Funding
Acknowledgments
Conflicts of Interest
References
- Coleman, J.N.; Khan, U.; Blau, W.J.; Gun’ko, Y.K. Small but strong: A review of the mechanical properties of carbon nanotube-polymer composites. Carbon 2006, 44, 1624–1652. [Google Scholar] [CrossRef]
- Yeh, M.-K.; Tai, N.-H.; Liu, J.-H. Mechanical behavior of phenolic-based composites reinforced with multi-walled carbon nanotubes. Carbon 2006, 44, 1–9. [Google Scholar] [CrossRef]
- Bokobza, L. Multiwall carbon nanotube elastomeric composites: A review. Polymer 2007, 48, 4907–4920. [Google Scholar] [CrossRef] [Green Version]
- Kanagaraj, S.; Varanda, F.R.; Zhil’tsova, T.V.; Oliveira, M.S.A.; Simões, J.A.O. Mechanical properties of high density polyethylene/carbon nanotube composites. Compos. Sci. Technol. 2007, 67, 3071–3077. [Google Scholar] [CrossRef]
- Bauhofer, W.; Kovacs, J.Z. A review and analysis of electrical percolation in carbon nanotube polymer composites. Compos. Sci. Technol. 2009, 69, 1486–1498. [Google Scholar] [CrossRef]
- Mittal, G.; Dhand, V.; Rhee, K.Y.; Park, S.-J.; Lee, W.R. A review on carbon nanotubes and graphene as fillers in reinforced polymer nanocomposites. J. Ind. Eng. Chem. 2015, 21, 11–25. [Google Scholar] [CrossRef]
- Tiusanen, J.; Vlasveld, D.; Vuorinen, J. Review on the effects of injection moulding parameters on the electrical resistivity of carbon nanotube filled polymer parts. Compos. Sci. Technol. 2012, 72, 1741–1752. [Google Scholar] [CrossRef]
- Alig, I.; Lellinger, D.; Engel, M.; Skipa, T.; Pötschke, P. Destruction and formation of a conductive carbon nanotube network in polymer melts: In-line experiments. Polymer 2008, 49, 1902–1909. [Google Scholar] [CrossRef]
- Pan, Y.; Cheng, H.K.F.; Li, L.; Chan, S.H.; Zhao, J.; Juay, Y.K. Annealing induced electrical conductivity jump of multi-walled carbon nanotube/polypropylene composites and influence of molecular weight of polypropylene. J. Polym. Sci. B Polym. Phys. 2010, 48, 2238–2247. [Google Scholar] [CrossRef]
- Villmow, T.; Pötschke, P.; Pegel, S.; Häussler, L.; Kretzschmar, B. Influence of twin-screw extrusion conditions on the dispersion of multi-walled carbon nanotubes in poly(lactic acid) matrix. Polymer 2008, 49, 3500–3509. [Google Scholar] [CrossRef]
- Skipa, T.; Lellinger, D.; Böhm, W.; Saphiannikova, M.; Alig, I. Influence of shear deformation on carbon nanotube networks in polycarbonate melts: Interplay between build-up and destruction of agglomerates. Polymer 2010, 51, 201–210. [Google Scholar] [CrossRef]
- Alig, I.; Steinhoff, B.; Lellinger, D. Monitoring of polymer melt processing. Meas. Sci. Technol. 2010, 21, 062001. [Google Scholar] [CrossRef]
- Cipriano, B.H.; Kota, A.K.; Gershon, A.L.; Laskowski, C.J.; Kashiwagi, T.; Bruck, H.A.; Raghavan, S.R. Conductivity enhancement of carbon nanotube and nanofiber-based polymer nanocomposites by melt annealing. Polymer 2008, 49, 4846–4851. [Google Scholar] [CrossRef]
- Stan, F.; Sandu, L.I.; Fetecau, C. Effect of processing parameters and strain rate on mechanical properties of carbon nanotube-filled polypropylene nanocomposites. Compos. Part B Eng. 2014, 59, 109–122. [Google Scholar] [CrossRef]
- Huang, C.Y.; Wu, J.Y. The manufacture and investigation of multi-walled carbon nanotube/polypyrrole/EVA nano-polymeric composites for electromagnetic interference shielding. Thin Solid Films 2011, 519, 4765–4773. [Google Scholar] [CrossRef]
- Alig, I.; Pötschke, P.; Lellinger, D.; Skipa, T.; Pegel, S.; Kasaliwal, G.R.; Willmow, T. Establishment, morphology and properties of carbon nanotube networks in polymer melts. Polymer 2012, 53, 4–28. [Google Scholar] [CrossRef]
- Alig, I.; Lellinger, D.; Dudkin, S.M.; Pötschke, P. Conductivity spectroscopy on melt processed polypropylene-multiwalled carbon nanotube composites: Recovery after shear and crystallization. Polymer 2007, 48, 1020–1029. [Google Scholar] [CrossRef]
- Kharchenko, S.B.; Douglas, J.F.; Obrzut, J.; Grulke, E.A.; Migler, K.B. Flow-induced properties of nanotube-filled polymer materials. Nat. Mater. 2004, 3, 564–568. [Google Scholar] [CrossRef]
- Hwang, S.-S.; Liu, S.-P.; Hsu, P.P.; Yeh, J.-M.; Yang, J.-P.; Chen, C.-L. Morphology, mechanical, and rheological behavior of microcellular injection molded EVA–clay nanocomposites. Int. Commun. Heat Mass 2012, 39, 383–389. [Google Scholar] [CrossRef]
- Liang, J.-Z.; Tang, C.-Y.; Zhou, L.; Tsui, C.-P.; Li, F.-J. Melt flow behavior in capillary extrusion of nanosized calcium carbonate-filled poly(L-lactic acid) biocomposites. Polym. Eng. Sci. 2012, 52, 1839–1844. [Google Scholar] [CrossRef]
- Liang, J.-Z.; Chen, C.Y.; Zou, S.Y.; Tsui, C.-P.; Tang, C.-Y.; Zhang, S.D. Melt flow behavior of polypropylene composites filled with multi-walled carbon nanotubes during extrusion. Polym. Test. 2015, 45, 41–46. [Google Scholar] [CrossRef]
- Fogel, M.; Parlevliet, P.; Geistbeck, M.; Olivier, P.; Dantras, É. Thermal, rheological and electrical analysis of MWCNTs/epoxy matrices. Compos. Sci. Technol. 2015, 110, 118–125. [Google Scholar] [Green Version]
- Agroui, K.; Belghachi, A.; Collins, G.; Farenc, J. Quality control of EVA encapsulant in photovoltaic module process and outdoor exposure. Desalination 2007, 209, 1–9. [Google Scholar] [CrossRef]
- Ayutthaya, S.I.N.; Wootthikanokkhan, J. Investigation of the photodegradation behaviors of an ethylene/vinyl acetate copolymer solar cell encapsulant and effects of antioxidants on the photostability of the material. J. Appl. Polym. Sci. 2008, 107, 3853–3863. [Google Scholar] [CrossRef]
- Shi, X.M.; Zhang, J.; Jin, J.; Chen, S.J. Non-isothermal crystallization and melting of ethylene-vinyl acetate copolymers with different vinyl acetate contents. Express Polym. Lett. 2008, 2, 623–629. [Google Scholar] [CrossRef]
- Lee, B.; Liu, J.Z.; Sun, B.; Shen, C.Y.; Dai, G.C. Thermally conductive and electrically insulating EVA composite encapsulants for solar photovoltaic (PV) cell. Express Polym. Lett. 2008, 2, 357–363. [Google Scholar] [CrossRef]
- Oreski, G.; Wallner, G.M. Evaluation of the aging behavior of ethylene copolymer films for solar applications under accelerated weathering conditions. Sol. Energy 2009, 83, 1040–1047. [Google Scholar] [CrossRef]
- Stark, W.; Jaunich, M. Investigation of ethylene/vinyl acetate copolymer (EVA) by thermal analysis DSC and DMA. Polym. Test. 2011, 30, 236–242. [Google Scholar] [CrossRef]
- Morlat-Therias, S.; Fanton, E.; Gardette, J.-L.; Peeterbroeck, S.; Alexandre, M.; Dubois, P. Polymer/carbon nanotube nanocomposites: Influence of carbon nanotubes on EVA photodegradation. Polym. Degrad. Stabil. 2007, 92, 1873–1882. [Google Scholar] [CrossRef]
- Peeterbroeck, S.; Breugelmans, L.; Alexandre, M.; BNagy, J.; Viville, P.; Lazzaroni, R.; Dubois, P. The influence of the matrix polarity on the morphology and properties of ethylene vinyl acetate copolymers-carbon nanotube nanocomposites. Compos. Sci. Technol. 2007, 67, 1659–1665. [Google Scholar] [CrossRef]
- Li, C.; Thostenson, E.T.; Chou, T.-W. Sensors and actuators based on carbon nanotubes and their composites: A review. Compos. Sci. Technol. 2008, 68, 1227–1249. [Google Scholar] [CrossRef]
- Park, K.-W.; Kim, G.-H. Ethylene vinyl acetate copolymer (EVA)/multiwalled carbon nanotube (MWCNT) nanocomposite foams. J. Appl. Polym. Sci. 2009, 112, 1845–1849. [Google Scholar] [CrossRef]
- Czaniková, K.; Torras, N.; Esteve, J.; Krupa, I.; Kasák, P.; Pavlova, E.; Račko, D.; Chodák, I.; Omastová, M. Nanocomposite photoactuators based on an ethylene vinyl acetate copolymer filled with carbon nanotubes. Sens. Actuators B Chem. 2013, 186, 701–710. [Google Scholar] [CrossRef]
- Sabet, M.; Hassan, S.; Hosseini, S. Properties and characterization of ethylene-vinyl acetate filled with carbon nanotube. Polym. Bull. 2016, 73, 419–434. [Google Scholar] [CrossRef]
- Alcudia® PA-420 Datasheet. Available online: https://www.repsol.com/ (accessed on 23 July 2019).
- NC7000TM Datasheet. Available online: https://www.nanocyl.com/product/nc7000/ (accessed on 1 August 2018).
- Roșculeţ, R.T.; Fetecau, C.; Stan, F.; Sandu, I.-L.; Belea, R. Active Cell for Measuring Electrical Resistivity of Polimer-Based Nanocomposites. Patent Application No. A00674/21.09.2015, RO-BOPI, 30 March 2017. [Google Scholar]
- Stan, F.; Fetecau, C.; Stanciu, N.V.; Rosculet, R.T.; Sandu, L.I. Investigation of structure-property relationships in thermoplastic polyurethane/multiwalled carbon nanotube composites. In Proceedings of the ASME 2017 12th International Manufacturing Science and Engineering Conference, 2, V002T03A016, Los Angeles, CA, USA, 4–8 June 2017. [Google Scholar] [CrossRef]
- Li, S.-N.; Li, Z.-M.; Yang, M.-B.; Hu, X.-B.; Huang, R. Carbon nanotubes induced nonisothermal crystallization of ethylene–vinyl acetate copolymer. Mater. Lett. 2004, 58, 3967–3970. [Google Scholar] [CrossRef]
- Seo, M.-K.; Lee, J.-R.; Park, S.-J. Crystallization kinetics and interfacial behaviors of polypropylene composites reinforced with multi-walled carbon nanotubes. Mater. Sci. Eng. A 2005, 404, 79–84. [Google Scholar] [CrossRef]
- Kodjie, S.L.; Li, L.; Li, B.; Cai, W.; Li, C.Y.; Keating, M. Morphology and crystallization behavior of HDPE/CNT nanocomposite. J. Macromol. Sci. B 2006, 45, 231–245. [Google Scholar] [CrossRef]
- Abbasi, S.; Carreau, P.J.; Derdouri, A.; Moan, M. Rheological properties and percolation in suspensions of multiwalled carbon nanotubes in polycarbonate. Rheol. Acta 2009, 48, 943–959. [Google Scholar] [CrossRef]
- Stan, F.; Stanciu, N.V.; Fetecau, C. Melt rheological properties of ethylene-vinyl acetate/multi-walled carbon nanotube composites. Compos. Part B Eng. 2017, 110, 20–31. [Google Scholar] [CrossRef]
- Shenoy, A.V. Rheology of Filled Polymer Systems; Springer: Berlin/Heidelberg, Germany, 2013. [Google Scholar]
- Ariff, Z.M.; Ariffin, A.; Jikan, S.S.; Rahim, N.A.A. Rheological behaviour of polypropylene through extrusion and capillary rheometry. In Polypropylene; Dogan, F., Ed.; InTech: London, UK, 2012. [Google Scholar]
- Mekhilef, N. Viscoelastic and pressure–volume–temperature properties of poly(vinylidene fluoride) and poly(vinylidene fluoride)–hexafluoropropylene copolymers. J. Appl. Polym. Sci. 2001, 80, 230–241. [Google Scholar] [CrossRef]
- Rodgers, P.A. Pressure–volume–temperature relationships for polymeric liquids: A review of equations of state and their characteristic parameters for 56 polymers. J. Appl. Polym. Sci. 1993, 48, 1061–1080. [Google Scholar] [CrossRef]
- Pötschke, P.; Brünig, H.; Jank, A.; Fischer, D.; Jehnichen, D. Orientation of multiwalled carbon nanotubes in composites with polycarbonate by melt spinning. Polymer 2005, 46, 10355–10363. [Google Scholar] [CrossRef]
- Vargas-Bernal, R.; Herrera-Pérez, G.; Calixto-Olalde, E.; Tecpoyotl-Torres, M. Analysis of DC electrical conductivity models of carbon nanotube-polymer composites with potential application to nanometric electronic devices. J. Electr. Comput. Eng. 2013, 2013, 179538. [Google Scholar] [CrossRef]
- Taherian, R. Development of an equation to model electrical conductivity of polymer-based carbon nanocomposites. ECS J. Solid State Sci. Technol. 2014, 3, M26–M38. [Google Scholar] [CrossRef]
- Musumeci, A.W.; Silva, G.G.; Liu, J.-W.; Martens, W.N.; Waclawik, E.R. Structure and conductivity of multi-walled carbon nanotube/poly(3-hexylthiophene) composite films. Polymer 2007, 48, 1667–1678. [Google Scholar] [CrossRef] [Green Version]
- Grimaldi, C.; Balberg, I. Tunneling and nonuniversality in continuum percolation systems. Phys. Rev. Lett. 2006, 96, 066602. [Google Scholar] [CrossRef] [PubMed]
- Stauffer, D.; Aharony, A. Introduction to the Percolation Theory, 2nd ed.; Francis and Taylor: London, UK, 1991; pp. 1–14, 73–86. [Google Scholar]


| MWNCTs (wt.%) | 1st DSC scan | 2nd DSC scan | |||||
|---|---|---|---|---|---|---|---|
| 1 | 51.6 | 87.6 | 69.1 | 56.8 | 85.5 | 69.1 | 57.1 |
| 3 | 50.8 | 86.4 | 68.8 | 52.2 | 85.6 | 68.9 | 49.7 |
| 5 | 51.4 | 87.1 | 69.0 | 40.0 | 84.4 | 69.0 | 40.5 |
| Apparent Shear Rate (1/s) | MWCNTs (wt.%) | Activation Energy (k J/mol) |
|---|---|---|
| 100 | 1 | 22.577 |
| 3 | 19.123 | |
| 5 | 17.798 | |
| 500 | 1 | 17.055 |
| 3 | 15.325 | |
| 5 | 14.407 | |
| 1000 | 1 | 14.534 |
| 3 | 13.334 | |
| 5 | 12.558 |
| Parameter | Unit | 1 wt.% | 3 wt.% | 5 wt.% |
|---|---|---|---|---|
| mm3/g | 1.1319 × 10³ | 1.1087 × 10³ | 1.0991 × 10³ | |
| mm3/g·°C | 8.0600 × 10⁻¹ | 8.7920 × 10⁻¹ | 8.2872 × 10⁻¹ | |
| bar | 9.3649 × 10² | 9.9568 × 10² | 9.9742 × 10² | |
| 1/°C | 4.0226 × 10⁻³ | 4.3584 × 10⁻³ | 4.1905 × 10⁻³ | |
| °C | 92.35 | 87.45 | 87.745 | |
| °C/bar | 1.5788 × 10⁻² | 1.9015 × 10⁻² | 1.8815 × 10⁻² | |
| mm3/g | 1.1037 × 10³ | 1.0889 × 10³ | 1.0789 × 10³ | |
| mm3/g·°C | 1.1518 | 1.1774 | 1.1390 | |
| bar | 8.3548 × 10² | 9.8815 × 10² | 9.8815 × 10² | |
| 1/°C | 1.1938 × 10⁻² | 8.7264 × 10⁻³ | 8.7264 × 10⁻³ | |
| mm3/g | 2.8788 × 101 | 1.5930 × 101 | 1.7689 × 101 | |
| 1/°C | 3.6442 × 10⁻² | 6.1900 × 10⁻² | 5.5434 × 10⁻² | |
| 1/bar | 3.3486 × 10⁻⁴ | 1.0705 × 10⁻⁴ | 9.2615 × 10⁻⁴ |
| MWCNTs (wt.%) | Young Modulus (MPa) | Density (g/cm3) | ||
|---|---|---|---|---|
| Halpin-Tsai Equation (S13) | Experiment | Rule-of-Mixture | Experiment | |
| 1 | 48.91 | 50.26 ± 1.64 | 0.94 | 0.932 ± 0.01 |
| 3 | 67.05 | 66.17 ± 1.38 | 0.95 | 0.942 ± 0.01 |
| 5 | 85.61 | 85.87 ± 3.07 | 0.96 | 0.952 ± 0.01 |
© 2019 by the authors. Licensee MDPI, Basel, Switzerland. This article is an open access article distributed under the terms and conditions of the Creative Commons Attribution (CC BY) license (http://creativecommons.org/licenses/by/4.0/).
Share and Cite
Stanciu, N.-V.; Stan, F.; Sandu, I.-L.; Susac, F.; Fetecau, C.; Rosculet, R.-T. Mechanical, Electrical and Rheological Behavior of Ethylene-Vinyl Acetate/Multi-Walled Carbon Nanotube Composites. Polymers 2019, 11, 1300. https://doi.org/10.3390/polym11081300
Stanciu N-V, Stan F, Sandu I-L, Susac F, Fetecau C, Rosculet R-T. Mechanical, Electrical and Rheological Behavior of Ethylene-Vinyl Acetate/Multi-Walled Carbon Nanotube Composites. Polymers. 2019; 11(8):1300. https://doi.org/10.3390/polym11081300
Chicago/Turabian StyleStanciu, Nicoleta-Violeta, Felicia Stan, Ionut-Laurentiu Sandu, Florin Susac, Catalin Fetecau, and Razvan-Tudor Rosculet. 2019. "Mechanical, Electrical and Rheological Behavior of Ethylene-Vinyl Acetate/Multi-Walled Carbon Nanotube Composites" Polymers 11, no. 8: 1300. https://doi.org/10.3390/polym11081300