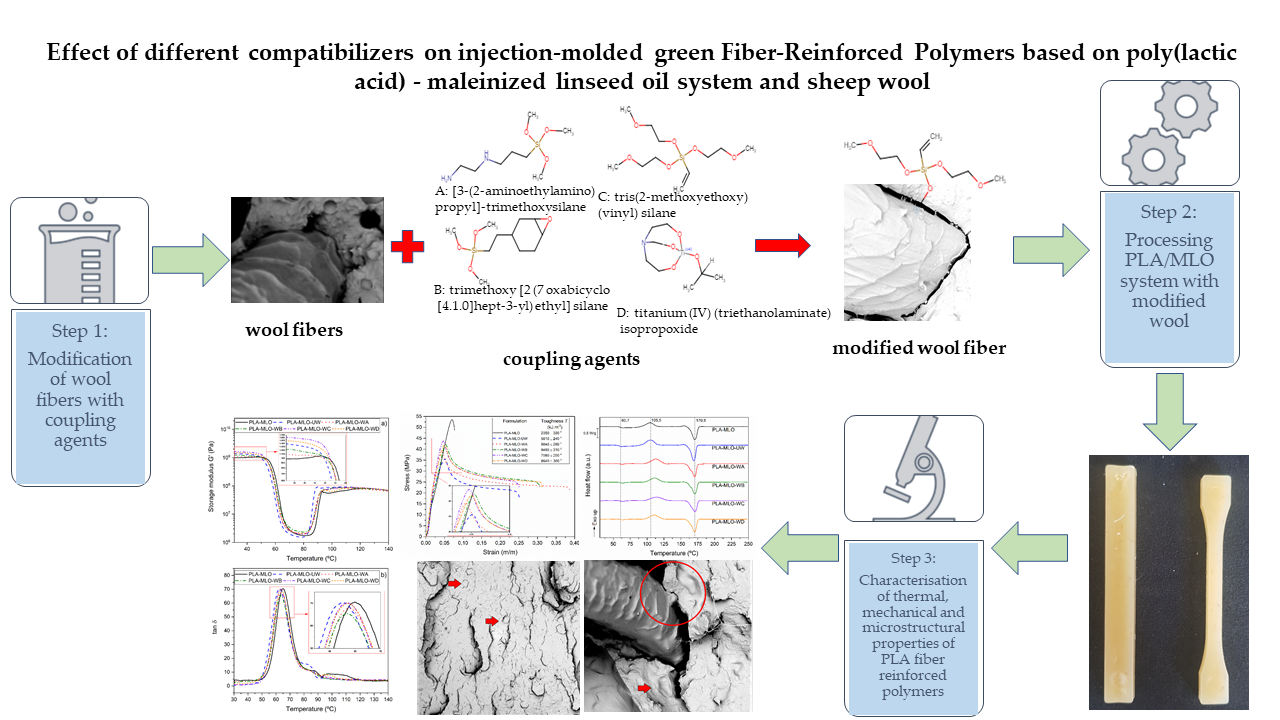
Effect of Different Compatibilizers on Injection-Molded Green Fiber-Reinforced Polymers Based on Poly(lactic acid)-Maleinized Linseed Oil System and Sheep Wool


Abstract
:
1. Introduction
2. Materials and Methods
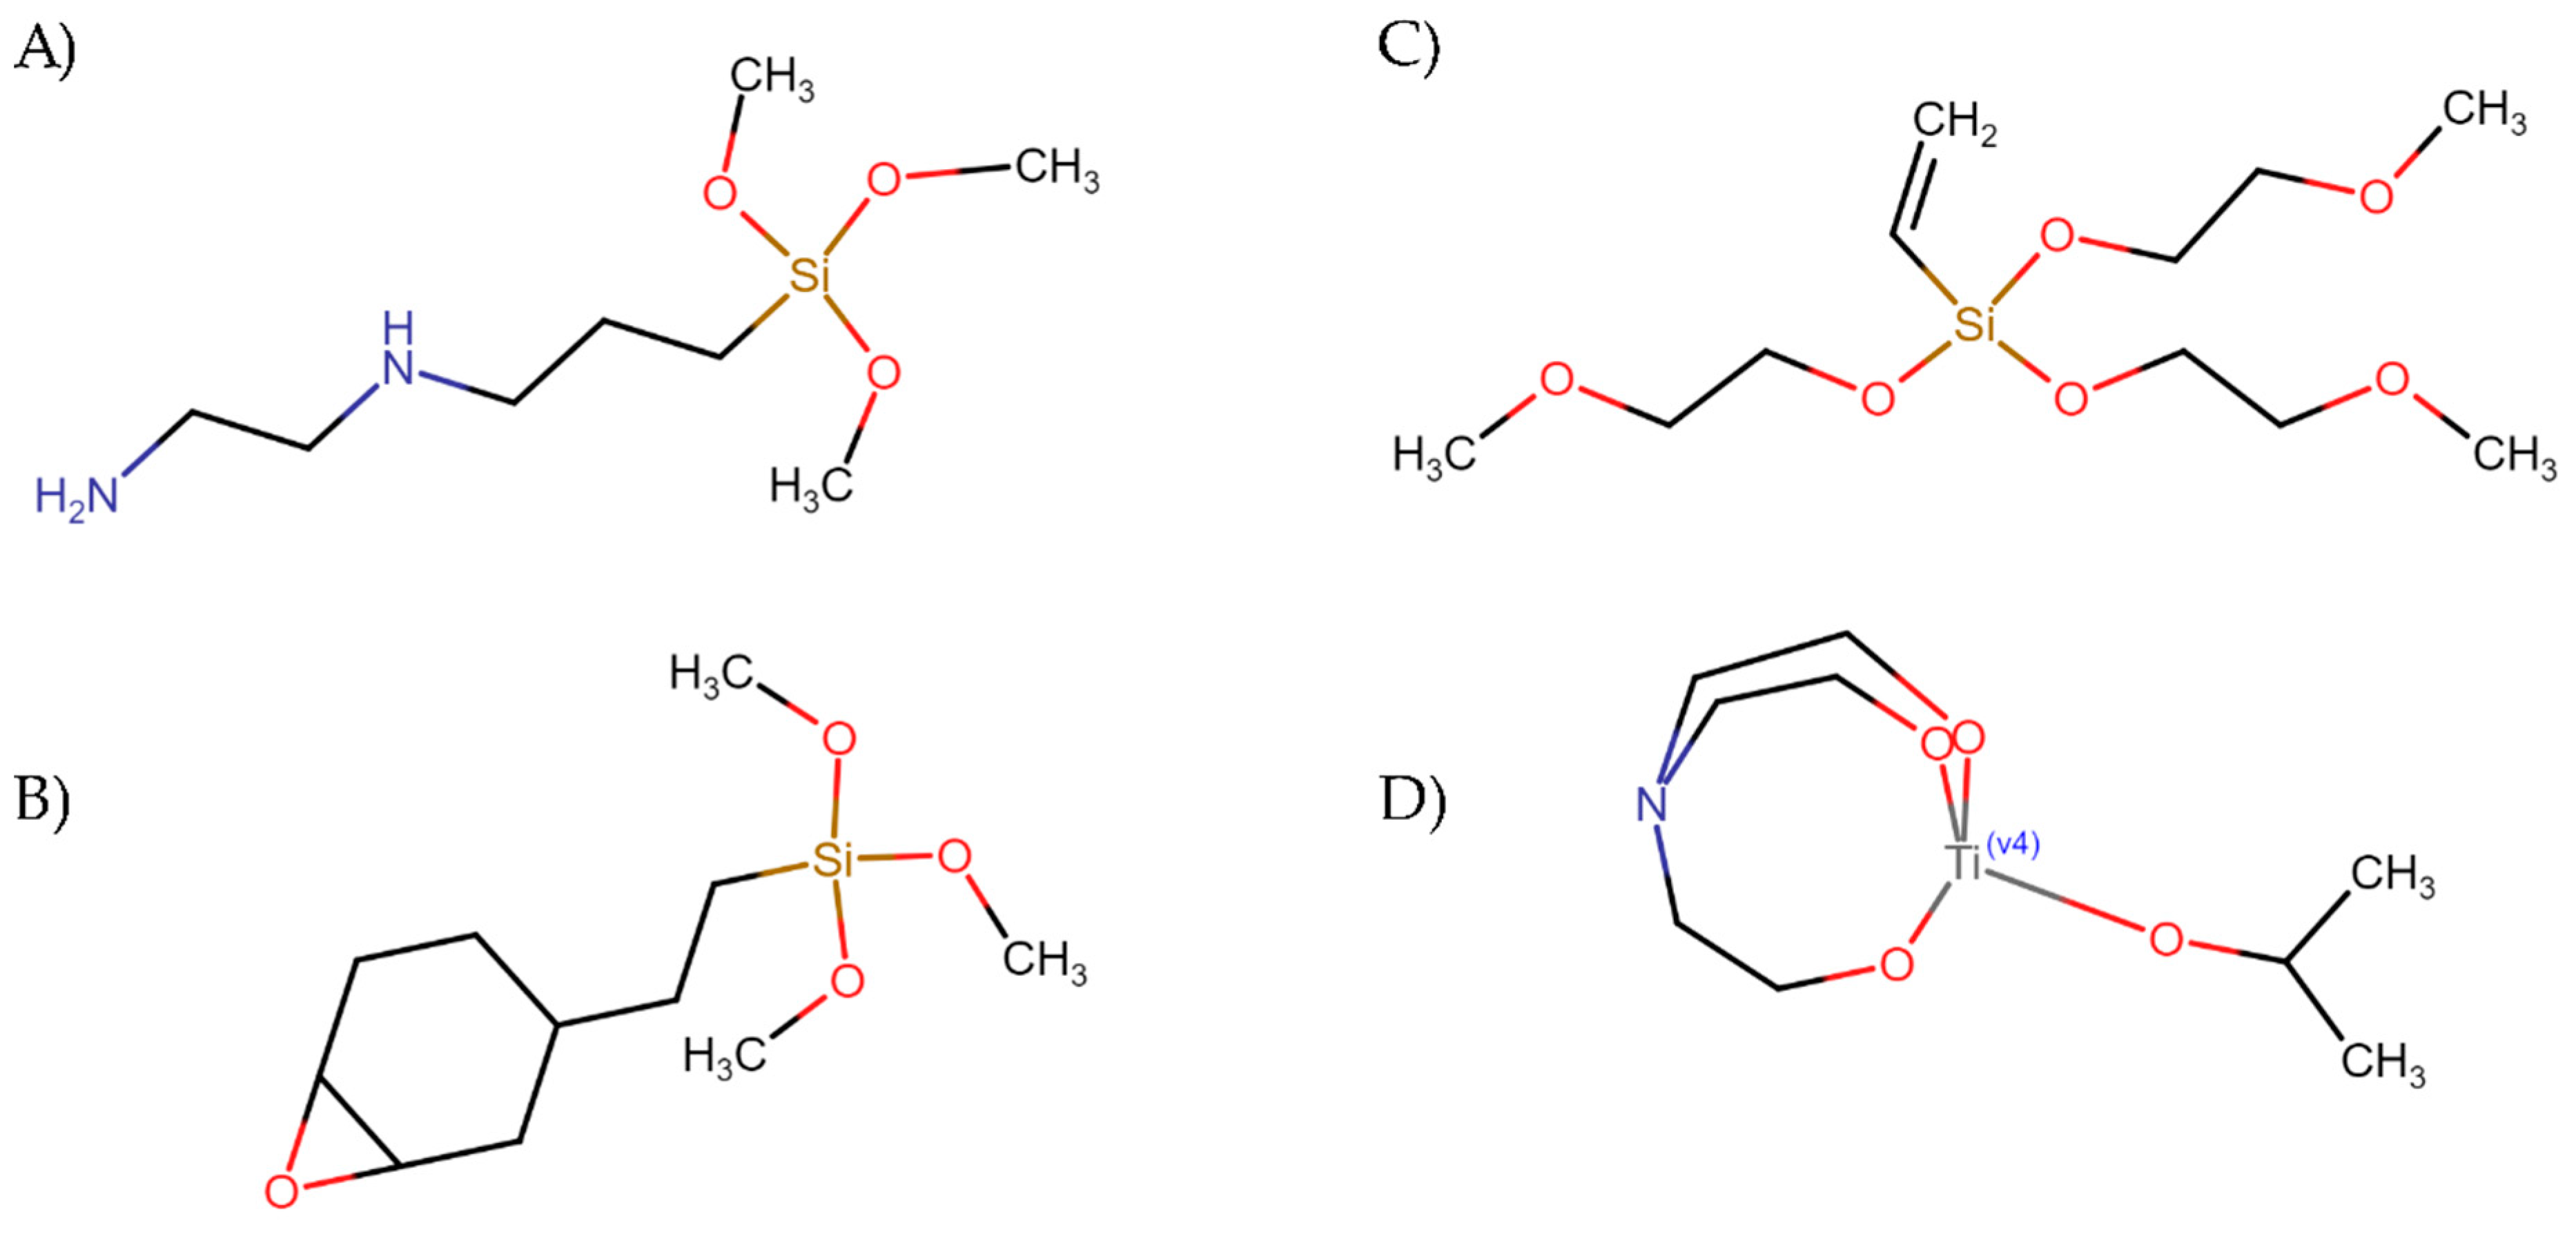
2.1. Materials
2.2. Surface Treatment of Wool Fibers
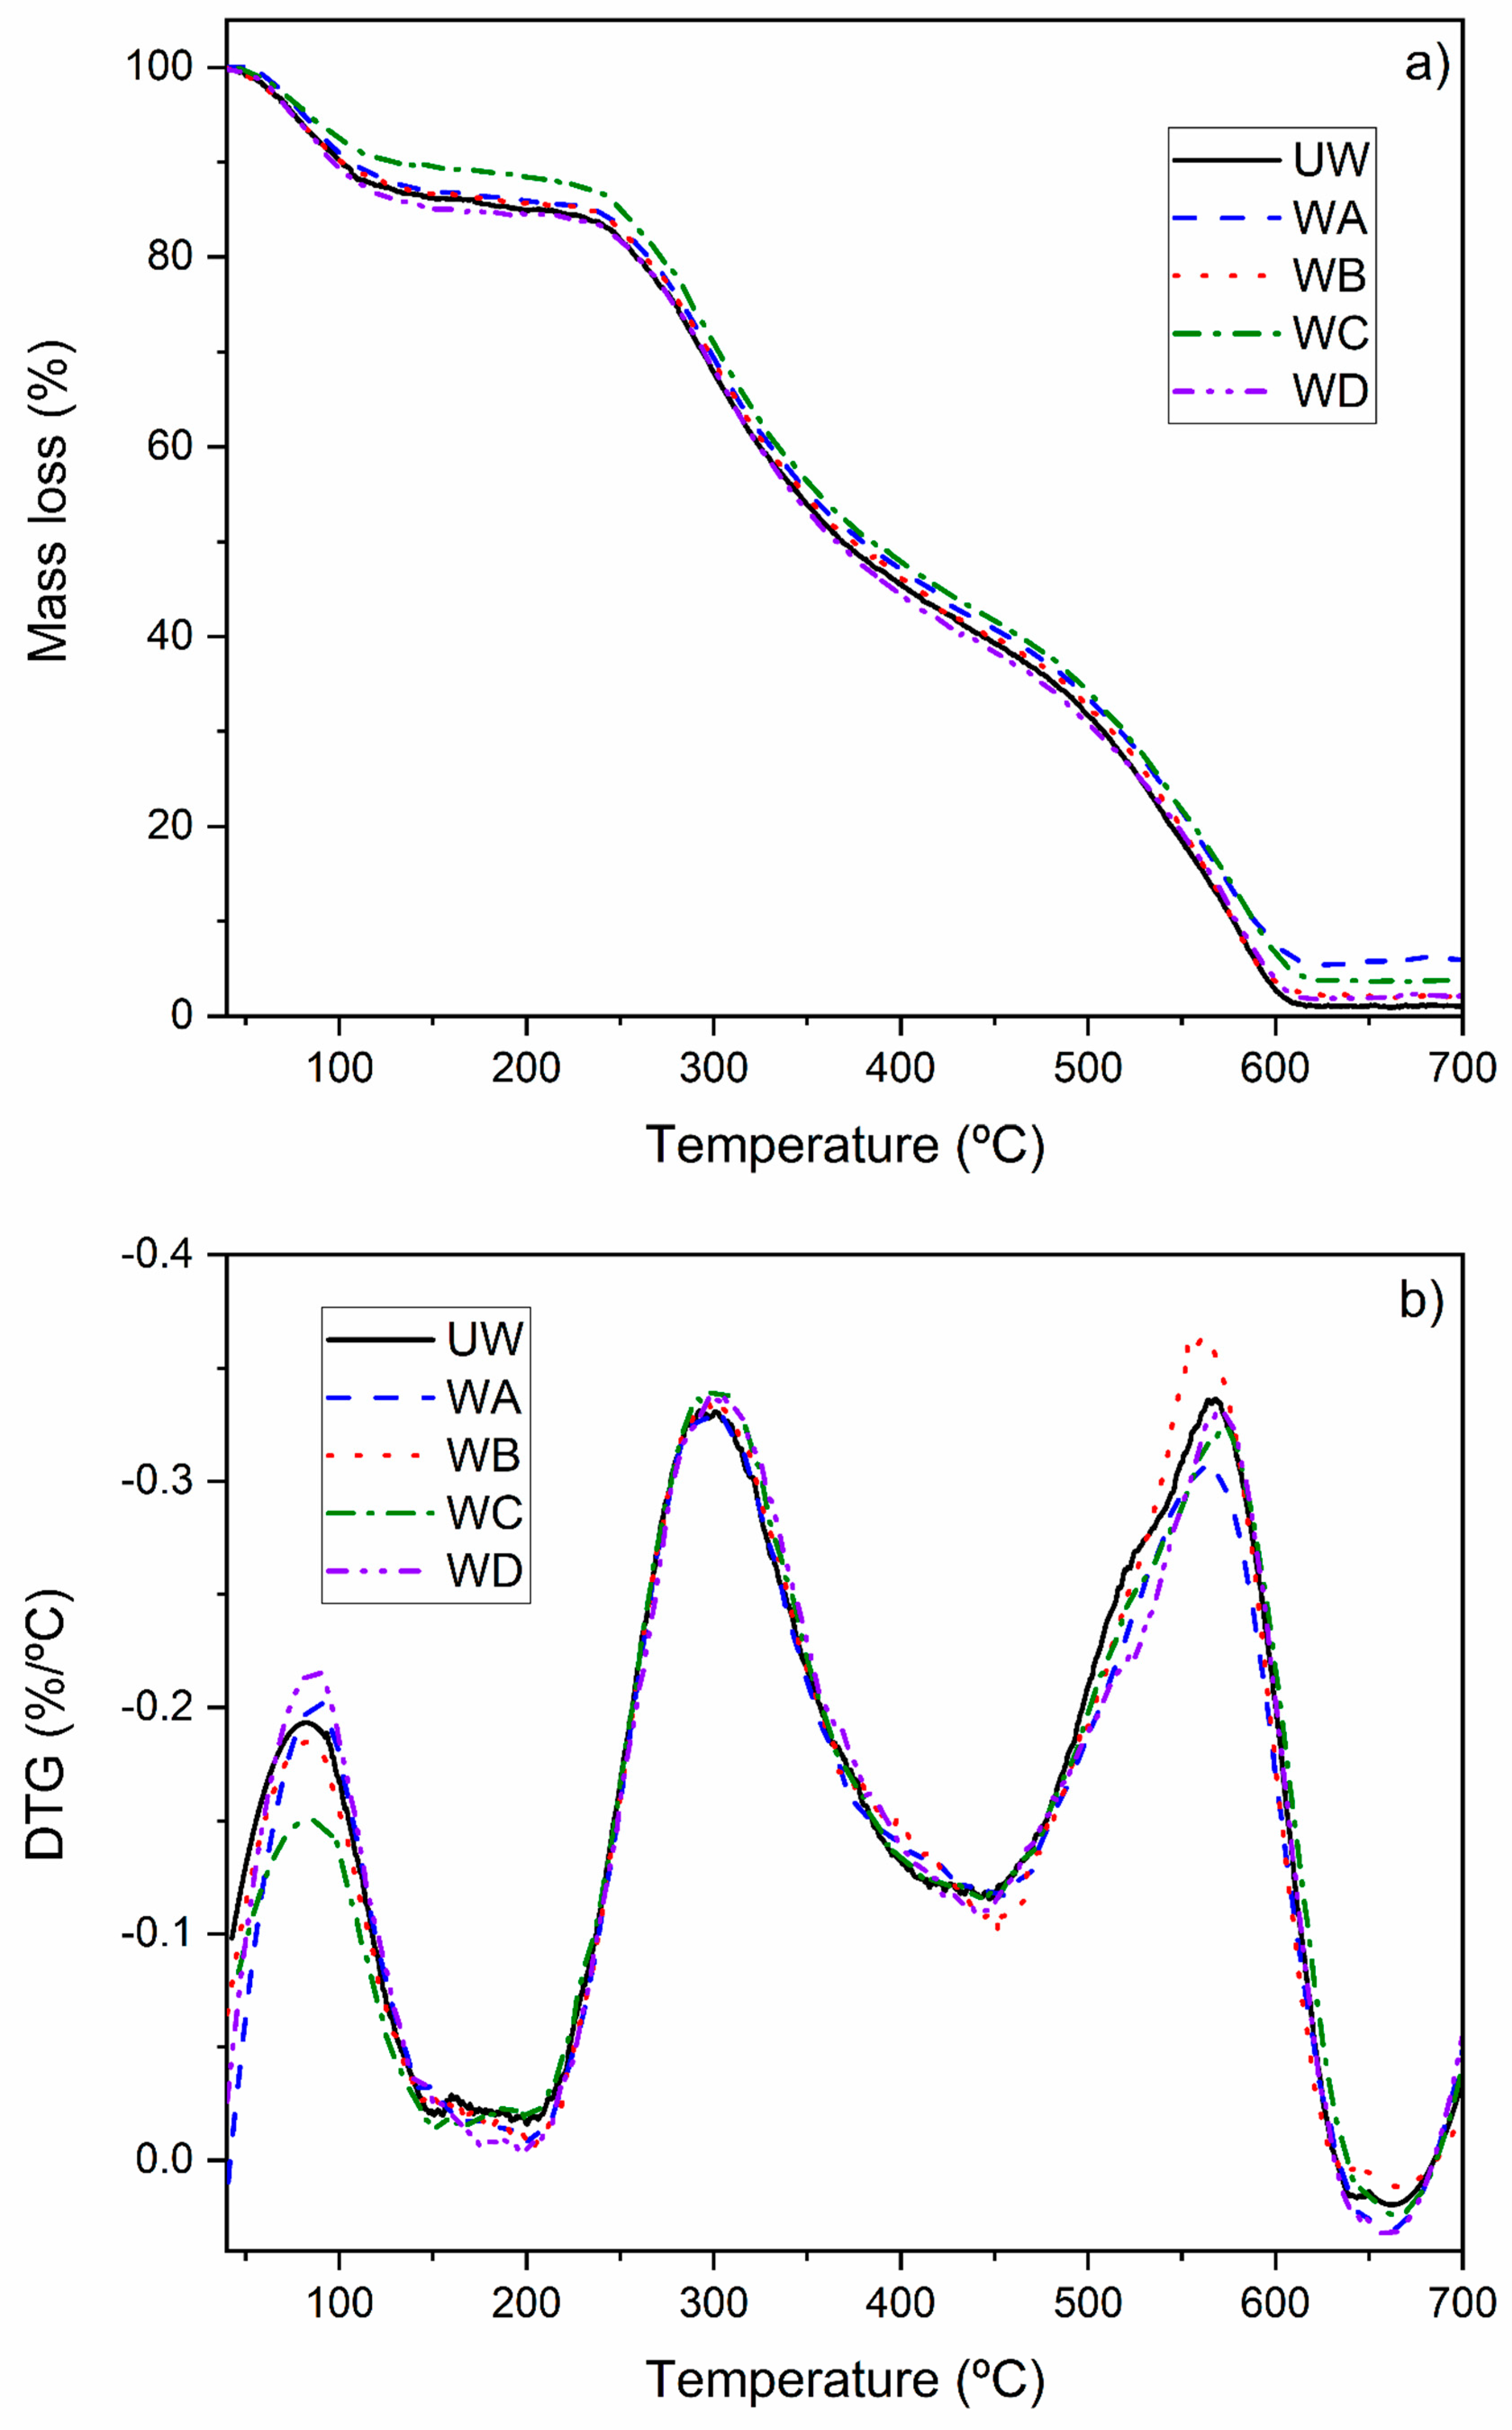
2.3. Characterization of Wool Fiber Treatment
2.4. Fiber Reinforce Polymer Manufacturing
2.5. Characterization of the FRP
3. Results and Discussion
3.1. Characterization of Wool Fiber Treatment
3.2. Mechanical Properties
3.3. Thermal Properties
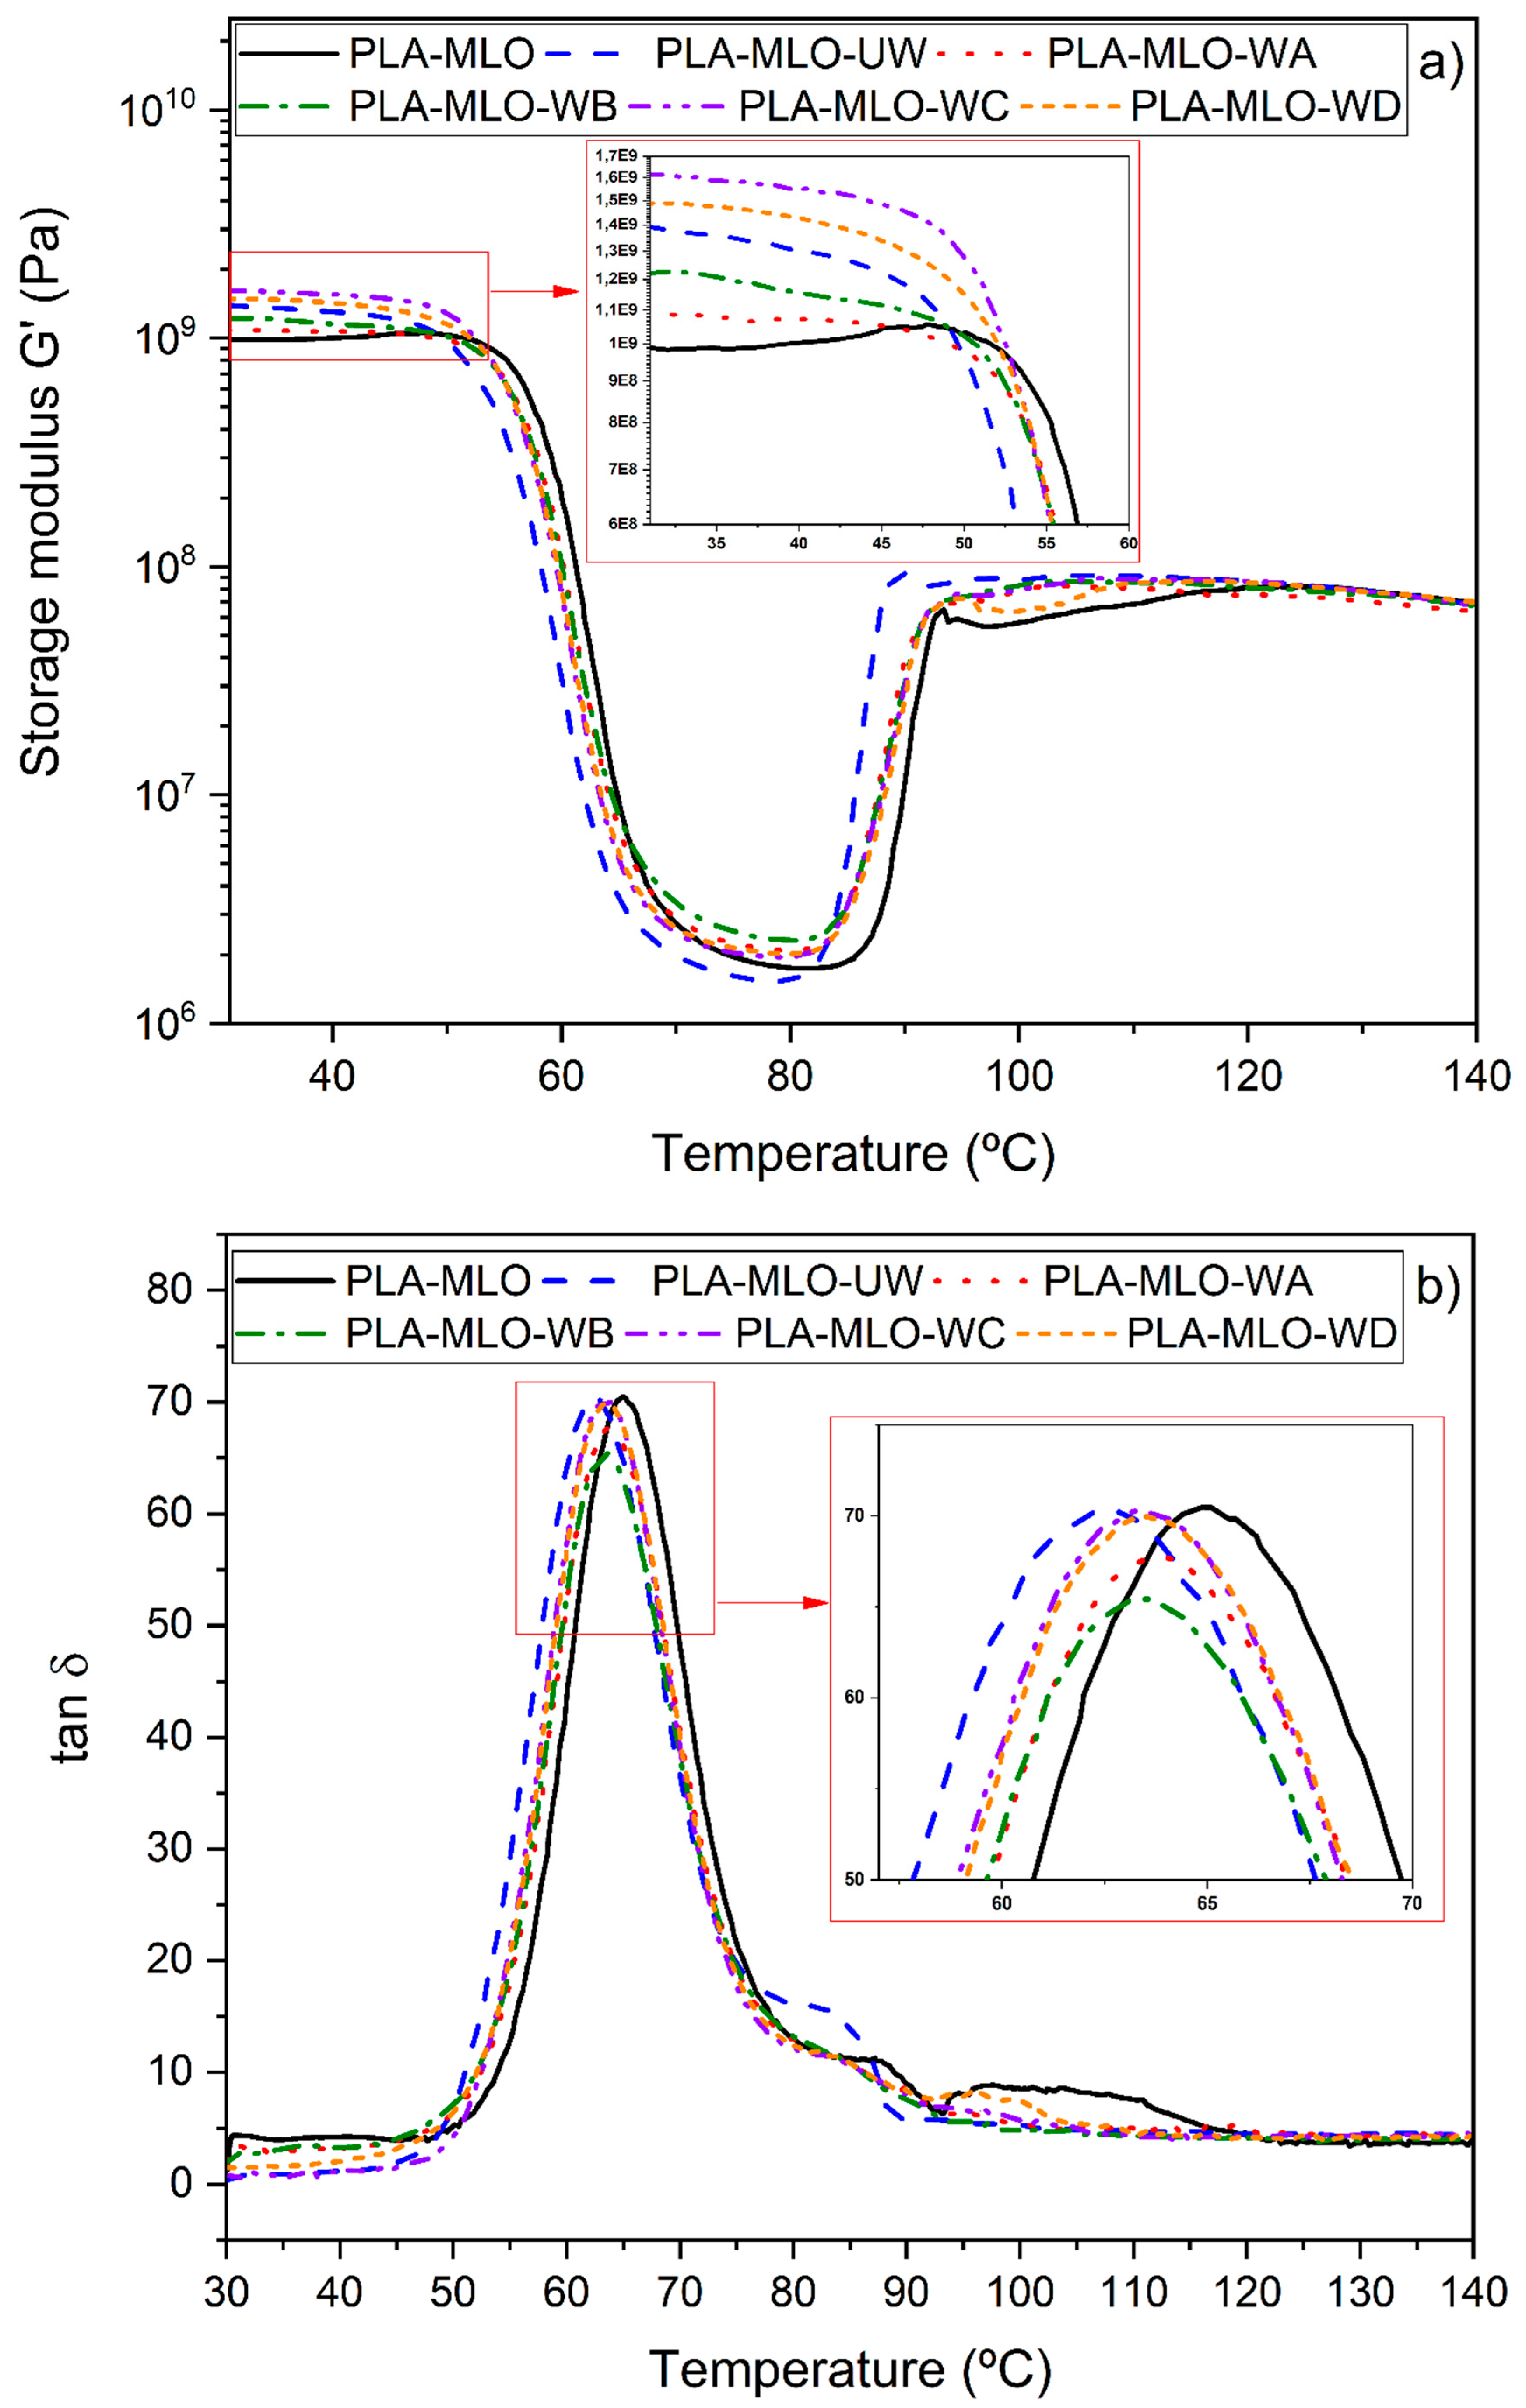
3.4. Dynamic Thermo-Mechanical Analysis
3.5. Microstructural Characterization
3.6. Surface Characterization
4. Conclusions
Author Contributions
Funding
Conflicts of Interest
References
- Kopacic, S.; Walzl, A.; Hirn, U.; Zankel, A.; Kniely, R.; Leitner, E.; Bauer, W. Application of Industrially Produced Chitosan in the Surface Treatment of Fibre-Based Material: Effect of Drying Method and Number of Coating Layers on Mechanical and Barrier Properties. Polymers 2018, 10, 1232. [Google Scholar] [CrossRef] [PubMed]
- Arrieta, M.P.; López, J.; Ferrándiz, S.; Peltzer, M.A. Characterization of PLA-limonene blends for food packaging applications. Polym. Test. 2013, 32, 760–768. [Google Scholar] [CrossRef]
- Aldas, M.; Paladines, A.; Valle, V.; Pazmiño, M.; Quiroz, F. Effect of the prodegradant-additive plastics incorporated on the polyethylene recycling. Int. J. Polym. Sci. 2018, 2018, 1–10. [Google Scholar] [CrossRef]
- Shukor, F.; Hassan, A.; Saiful Islam, M.; Mokhtar, M.; Hasan, M. Effect of ammonium polyphosphate on flame retardancy, thermal stability and mechanical properties of alkali treated kenaf fiber filled PLA biocomposites. Mater. Des. 2014, 54, 425–429. [Google Scholar] [CrossRef]
- Arrieta, M.P.; Fortunati, E.; Dominici, F.; López, J.; Kenny, J.M. Bionanocomposite films based on plasticized PLA–PHB/cellulose nanocrystal blends. Carbohydr. Polym. 2015, 121, 265–275. [Google Scholar] [CrossRef] [PubMed]
- Samper, M.D.; Petrucci, R.; Sánchez-Nacher, L.; Balart, R.; Kenny, J.M. New environmentally friendly composite laminates with epoxidized linseed oil (ELO) and slate fiber fabrics. Compos. Part B 2015, 71, 203–209. [Google Scholar] [CrossRef]
- Quiroz, F.; Cadena, F.; Sinche, L.; Chango, I.; Aldas, M. Estudio de la degradación en polímeros oxo-biodegradables. Rev. Politéc. 2009, 30, 179–191. [Google Scholar]
- Ferri, J.M.; Garcia-Garcia, D.; Sánchez-Nacher, L.; Fenollar, O.; Balart, R. The effect of maleinized linseed oil (MLO) on mechanical performance of poly(lactic acid)-thermoplastic starch (PLA-TPS) blends. Carbohydr. Polym. 2016, 147, 60–68. [Google Scholar] [CrossRef] [PubMed]
- Samper, M.D.; Fombuena, V.; Boronat, T.; García-Sanoguera, D.; Balart, R. Thermal and mechanical characterization of epoxy resins (ELO and ESO) cured with anhydrides. JAOCS J. Am. Oil Chem. Soc. 2012, 89, 1521–1528. [Google Scholar] [CrossRef]
- Arrieta, M.P.; Samper, M.D.; Aldas, M.; López, J. On the use of PLA-PHB blends for sustainable food packaging applications. Materials 2017, 10, 1008. [Google Scholar] [CrossRef] [PubMed]
- Grzabka-Zasadzińska, A.; Klapiszewski, L.; Borysiak, S.; Jesionowski, T. Thermal and mechanical properties of silica-lignin/polylactide composites subjected to biodegradation. Materials 2018, 11, 2257. [Google Scholar] [CrossRef] [PubMed]
- Nasrin, R.; Biswas, S.; Rashid, T.U.; Afrin, S.; Jahan, R.A.; Haque, P.; Rahman, M.M. Preparation of Chitin-PLA laminated composite for implantable application. Bioact. Mater. 2017, 2, 199–207. [Google Scholar] [CrossRef]
- Wang, L.; Okada, K.; Hikima, Y.; Ohshima, M.; Sekiguchi, T.; Yano, H. Effect of cellulose nanofiber (CNF) surface treatment on cellular structures and mechanical properties of polypropylene/CNF nanocomposite foams via core-back foam injection molding. Polymers 2019, 11, 249. [Google Scholar] [CrossRef] [PubMed]
- Klapiszewski, Ł.; Pawlak, F.; Tomaszewska, J.; Jesionowski, T. Preparation and characterization of novel PVC/silica-lignin composites. Polymers 2015, 7, 1767–1788. [Google Scholar] [CrossRef]
- Sormunen, P.; Kärki, T. Compression molded thermoplastic composites entirely made of recycled materials. Sustainability 2019, 11, 631. [Google Scholar] [CrossRef]
- Herrera, N.; Roch, H.; Salaberria, A.M.; Pino-Orellana, M.A.; Labidi, J.; Fernandes, S.C.M.; Radic, D.; Leiva, A.; Oksman, K. Functionalized blown films of plasticized polylactic acid/chitin nanocomposite: Preparation and characterization. Mater. Des. 2016, 92, 846–852. [Google Scholar] [CrossRef]
- Samper, M.D.; Petrucci, R.; Sanchez-Nacher, L.; Balart, R.; Kenny, J.M. Properties of composite laminates based on basalt fibers with epoxidized vegetable oils. Mater. Des. 2015, 72, 9–15. [Google Scholar] [CrossRef]
- Wang, F.; Zhou, S.; Yang, M.; Chen, Z.; Ran, S. Thermo-mechanical performance of polylactide composites reinforced with Alkali-treated bamboo fibers. Polymers 2018, 10, 401. [Google Scholar] [CrossRef] [PubMed]
- Ferri, J.M.; Garcia-Garcia, D.; Montanes, N.; Fenollar, O.; Balart, R. The effect of maleinized linseed oil as biobased plasticizer in poly(lactic acid)-based formulations. Polym. Int. 2017, 66, 882–891. [Google Scholar] [CrossRef]
- Alam, J.; Alam, M.; Raja, M.; Abduljaleel, Z.; Dass, L.A. MWCNTs-reinforced epoxidized linseed oil plasticized polylactic acid nanocomposite and its electroactive shape memory behaviour. Int. J. Mol. Sci. 2014, 15, 19924–19937. [Google Scholar] [CrossRef]
- Chang, C.-W.; Lee, H.-L.; Lu, K.-T. Manufacture and Characteristics of Oil-Modified Refined Lacquer for Wood Coatings. Coatings 2018, 9, 11. [Google Scholar] [CrossRef]
- Liminana, P.; Quiles-Carrillo, L.; Boronat, T.; Balart, R.; Montanes, N. The Effect of Varying Almond Shell Flour (ASF) Loading in Composites with Poly(Butylene Succinate (PBS) Matrix Compatibilized with Maleinized Linseed Oil (MLO). Materials 2018, 11, 2179. [Google Scholar] [CrossRef] [PubMed]
- Arrieta, M.P.; Samper, M.D.; Jiménez-López, M.; Aldas, M.; López, J. Combined effect of linseed oil and gum rosin as natural additives for PVC. Ind. Crops Prod. 2017, 99, 196–204. [Google Scholar] [CrossRef]
- Salpin, F. Laine et Colorants: Fixation, Quantification et Vieillissement. Etude par spectrométrie Raman. Ph.D. Thesis, Université Pierre et Marie Curie, Paris, France, 2008. (In French). [Google Scholar]
- Hearle, J.W.S. A critical review of the structural mechanics of wool and hair fibres. Int. J. Biol. Macromol. 2000, 27, 123–138. [Google Scholar] [CrossRef]
- Xu, W.; Ke, G.; Wu, J.; Wang, X. Modification of wool fiber using steam explosion. Eur. Polym. J. 2006, 42, 2168–2173. [Google Scholar] [CrossRef] [Green Version]
- Xu, B.; Niu, M.; Wei, L.; Hou, W.; Liu, X. The structural analysis of biomacromolecule wool fiber with Ag-loading SiO2 nano-antibacterial agent by UV radiation. J. Photochem. Photobiol. A Chem. 2007, 188, 98–105. [Google Scholar] [CrossRef]
- Wang, L.; Yao, J.; Niu, J.; Liu, J.; Li, B.; Feng, M. Eco-friendly and highly efficient enzyme-based wool shrinkproofing finishing by multiple padding techniques. Polymers 2018, 10, 1213. [Google Scholar] [CrossRef]
- Quartinello, F.; Vecchiato, S.; Weinberger, S.; Kremenser, K.; Skopek, L.; Pellis, A.; Guebitz, G.M. Highly selective enzymatic recovery of building blocks fromwool-cotton-polyester textile waste blends. Polymers 2018, 10, 1107. [Google Scholar] [CrossRef]
- Mu, F.; Rong, E.; Jing, Y.; Yang, H.; Ma, G.; Yan, X.; Wang, Z.; Li, Y.; Li, H.; Wang, N. Structural Characterization and Association of Ovine Dickkopf-1 Gene with Wool Production and Quality Traits in Chinese Merino. Genes 2017, 8, 400. [Google Scholar] [CrossRef]
- España, J.M.; Samper, M.D.; Fages, E.; Sánchez-Nácher, L.; Balart, R. Investigation of the effect of different silane coupling agents on mechanical performance of basalt fiber composite laminates with biobased epoxy matrices. Polym. Compos. 2013, 34, 376–381. [Google Scholar] [CrossRef]
- Samper, M.D.; Petrucci, R.; Sánchez-Nacher, L.; Balart, R.; Kenny, J.M. Effect of silane coupling agents on basalt fiber-epoxidized vegetable oil matrix composite materials analyzed by the single fiber fragmentation technique. Polym. Compos. 2015, 36, 1205–1212. [Google Scholar] [CrossRef]
- Kabir, M.M.; Wang, H.; Lau, K.T.; Cardona, F. Chemical treatments on plant-based natural fibre reinforced polymer composites: An overview. Compos. Part B 2012, 43, 2883–2892. [Google Scholar] [CrossRef]
- Naeimirad, M.; Zadhoush, A.; Esmaeely Neisiany, R.; Salimian, S.; Kotek, R. Melt-spun PLA liquid-filled fibers: Physical, morphological, and thermal properties. J. Text. Inst. 2019, 110, 89–99. [Google Scholar] [CrossRef]
- Abdelmouleh, M.; Boufi, S.; ben Salah, A.; Belgacem, M.N.; Gandini, A. Interaction of silane coupling agents with cellulose. Langmuir 2002, 18, 3203–3208. [Google Scholar] [CrossRef]
- Aldas, M.; Ferri, J.M.; Lopez-Martinez, J.; Samper, M.D.; Arrieta, M.P. Effect of pine resin derivatives on the structural, thermal, and mechanical properties of Mater-Bi type bioplastic. J. Appl. Polym. Sci. 2019, 48236. [Google Scholar] [CrossRef]
- Conzatti, L.; Giunco, F.; Stagnaro, P.; Patrucco, A.; Tonin, C.; Marano, C.; Rink, M.; Marsano, E. Wool fibres functionalised with a silane-based coupling agent for reinforced polypropylene composites. Compos. Part A 2014, 61, 51–59. [Google Scholar] [CrossRef]
- Kuciel, S.; Romańska, P. Hybrid composites of polylactide with basalt and carbon fibers and their thermal treatment. Materials 2018, 12, 95. [Google Scholar] [CrossRef]
- Magoń, A.; Pyda, M. Study of crystalline and amorphous phases of biodegradable poly (lactic acid) by advanced thermal analysis. Polymer 2009, 50, 3967–3973. [Google Scholar] [CrossRef]
- Jiang, J.; Jiang, C.; Li, B.; Feng, P. Bond behavior of basalt textile meshes in ultra-high ductility cementitious composites. Compos. Part B 2019, 174. [Google Scholar] [CrossRef]


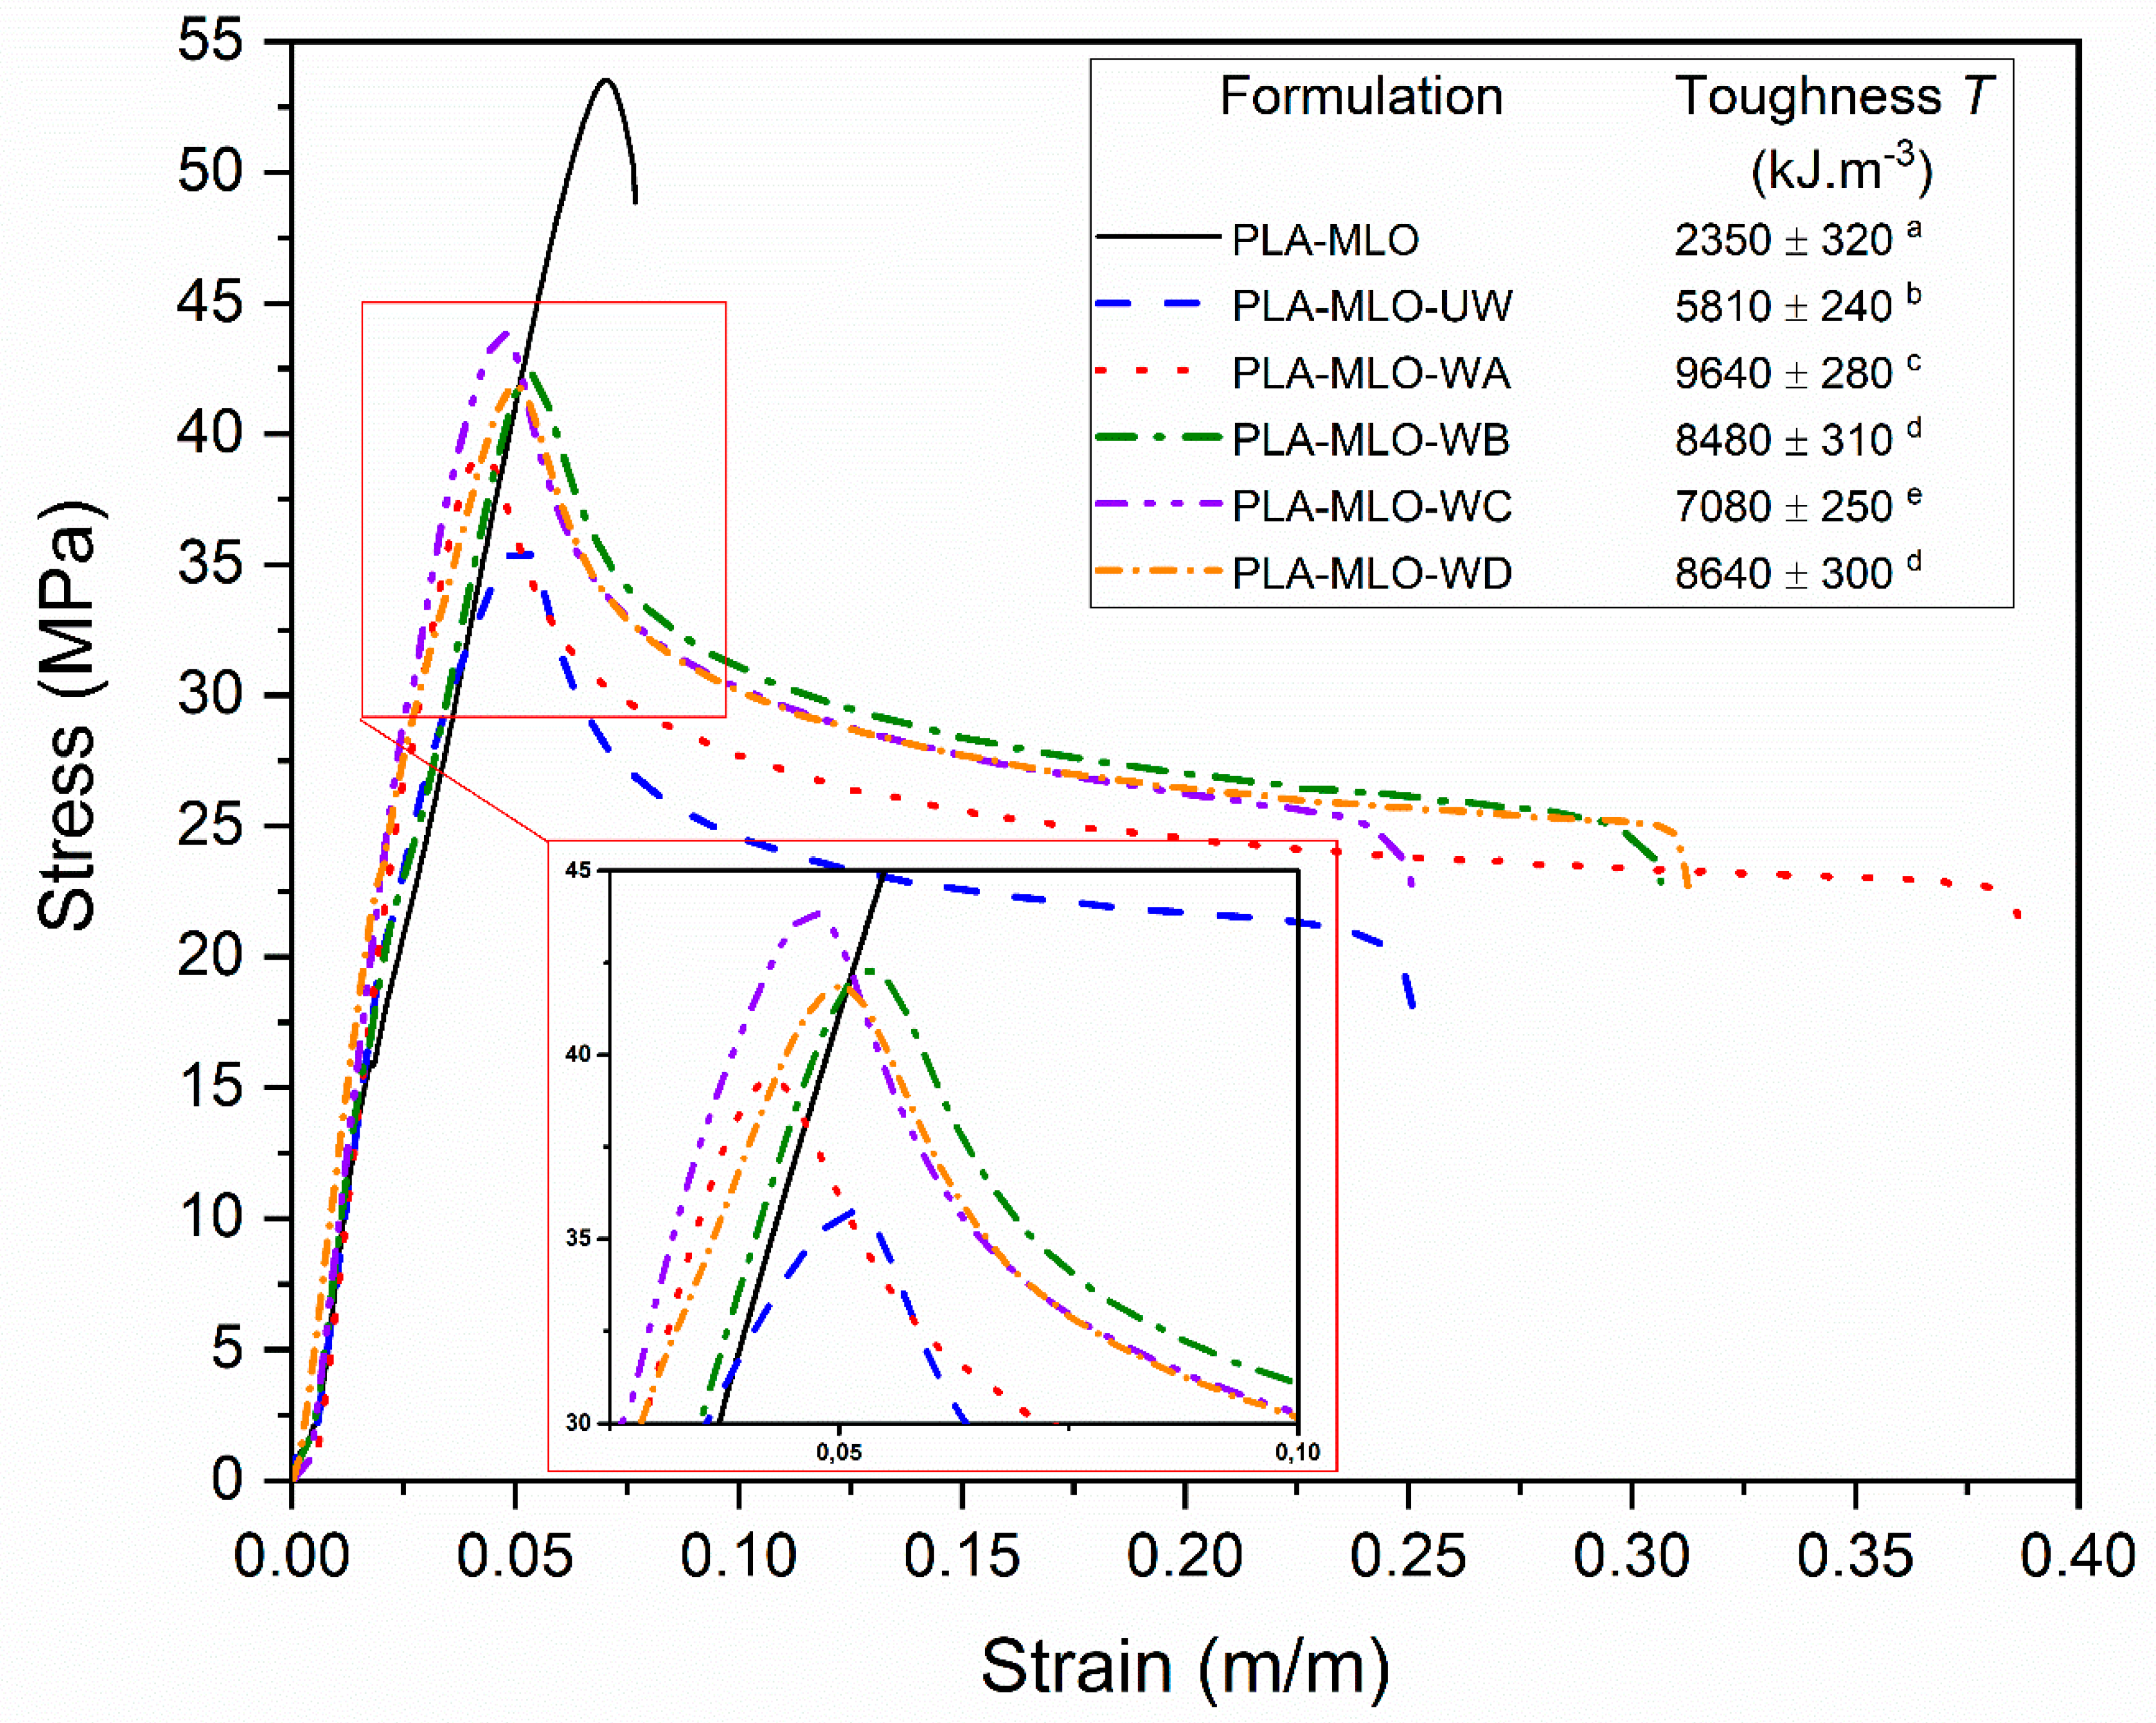
| Formulation | Tensile Properties | Flexural Properties | Impact Resistance | Hardness | |||
|---|---|---|---|---|---|---|---|
| Maximum Resistance (MPa) | Young‘s Modulus (MPa) | Elongation at Break (%) | Maximum Resistance (MPa) | Flexural Modulus (MPa) | Charpy’s Impact Energy (kJ/m2) | Shore D | |
| PLA–MLO | 54.1 ± 1.5a | 1816 ± 283a | 6.8 ± 1.1a | 27.4 ± 2.5a | 3216 ± 131a | 27.4 ± 2.5a,c | 81.4 ± 2.1a |
| PLA–MLO–UW | 36.5 ± 1.5b | 1712 ± 64a | 21.2 ± 5.1a,b | 17.4 ± 1.9b | 3206 ± 75a | 17.4 ± 1.9b | 74.2 ± 0.8b |
| PLA–MLO–WA | 39.5 ± 1.3c | 1903 ± 201a | 36.4 ± 7.8b | 18.6 ± 5.2b,c | 3139 ± 132a | 18.6 ± 5.2b | 79.6 ± 0.5a,c |
| PLA–MLO–WB | 41.6 ± 1.8c | 1723 ± 340a | 34.0 ± 11.5b | 23.6 ± 5.2c,d | 3053 ± 115a | 23.6 ± 5.2b,c | 77.0 ± 1.6c |
| PLA–MLO–WC | 41.8 ± 1.3c | 1923 ± 216a | 25.2 ± 11.2b | 20.1 ± 3.6d | 3220 ± 25a | 20.1 ± 3.6b | 80.4 ± 1.3a |
| PLA–MLO–WD | 40.9 ± 1.2c | 1947 ± 129a | 32.4 ± 9.5b | 19.0 ± 2.0d | 3181 ± 33a | 19.0 ± 2.0b | 81.0 ± 1.2a |
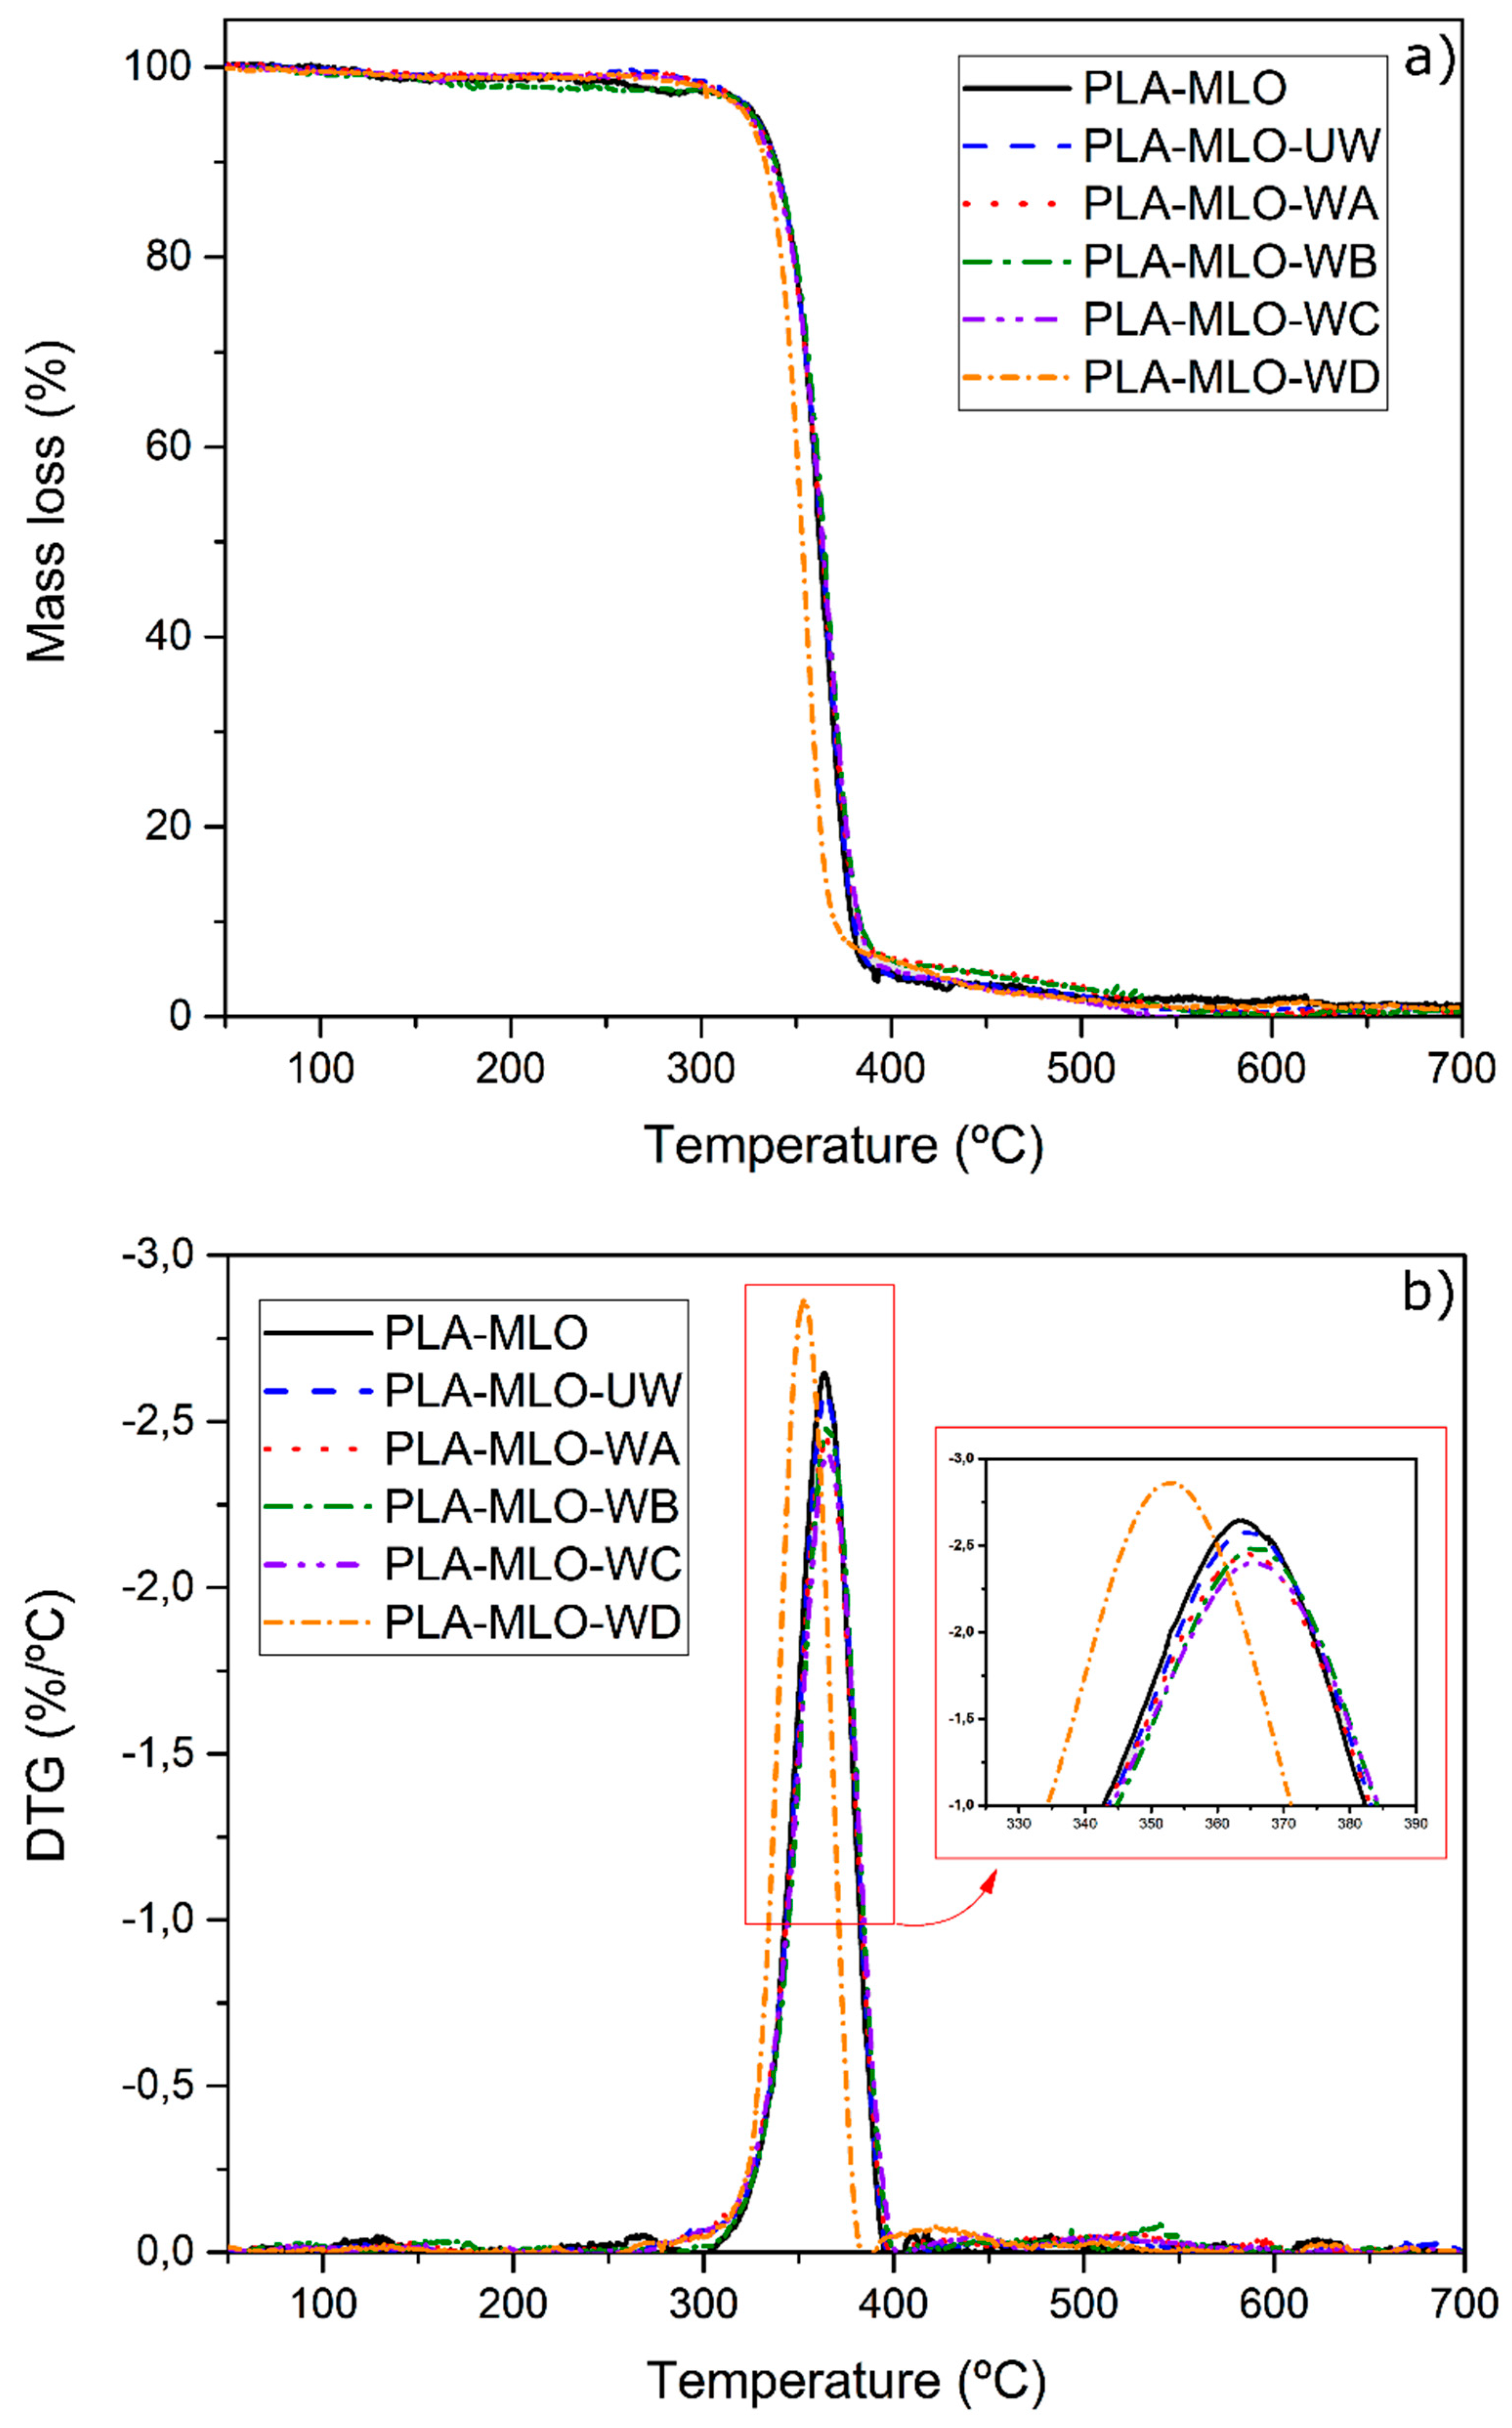
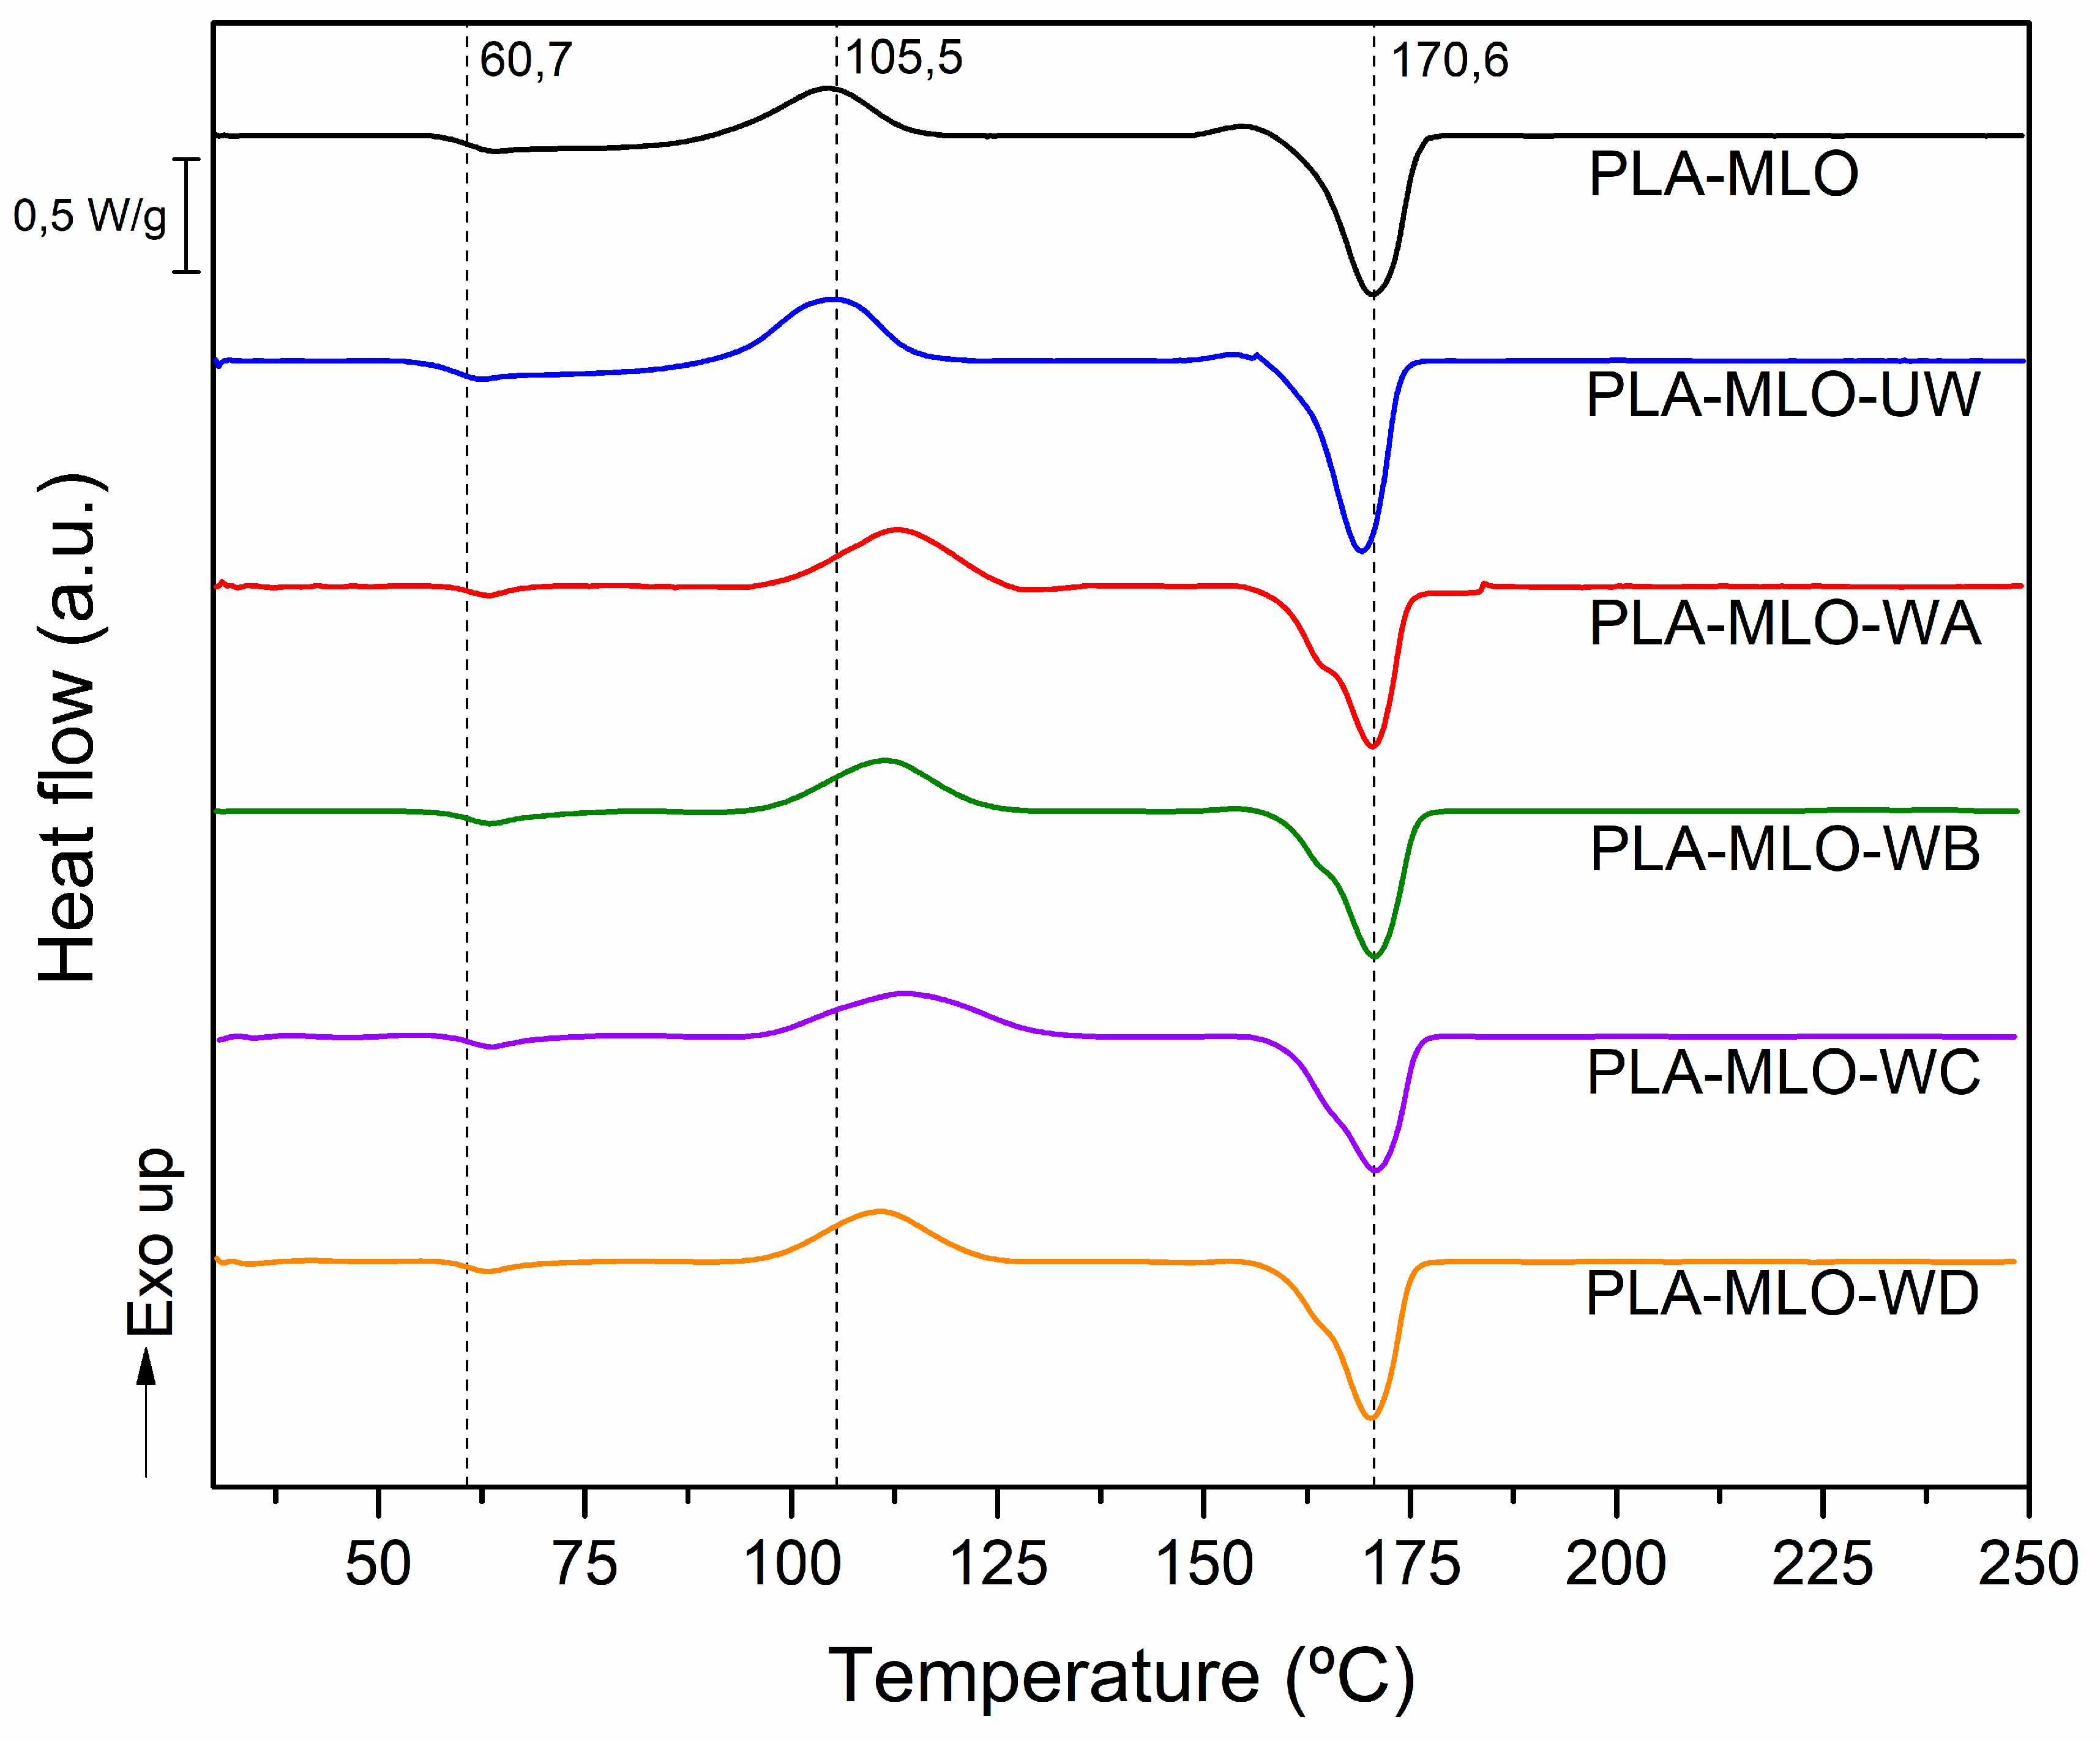
| Formulation | TGA Assessment | DSC Assessment | ||||||
|---|---|---|---|---|---|---|---|---|
| T5 (°C) | Tmax (°C) | Mass Loss at 300 °C (%) | Mass Loss at 350 °C (%) | Tg (°C) | Tcc (°C) | Tm (°C) | Xc (%) | |
| PLA–MLO | 327.2 ± 0.4a | 364.9 ± 2.5a | 2.8 ± 0.2a | 21.6 ± 0.6a | 60.7 ± 0.6a | 105.5 ± 1.2a | 170.6 ± 0.9a | 19.9 ± 0.9a |
| PLA–MLO–UW | 327.0 ± 1.8a | 366.4 ± 2.6a | 1.9 ± 0.6a,b | 23.2 ± 1.9a | 58.6 ± 1.0a | 105.2 ± 0.5a | 168.1 ± 1.2a | 19.2 ± 1.3a |
| PLA–MLO–WA | 325.3 ± 1.1a | 365.9 ± 3.3a | 1.7 ± 0.4b | 22.5 ± 0.9a | 60.1 ± 1.0a | 111.5 ± 2.0b | 169.7 ± 0.7a | 16.7 ± 0.7b |
| PLA–MLO–WB | 326.8 ± 0.7a | 366.9 ± 1.9a | 2.6 ± 0.3a,b | 21.0 ± 1.2a | 60.2 ± 1.0a | 111.3 ± 0.5b | 170.1 ± 0.5a | 16.4 ± 0.8b |
| PLA–MLO–WC | 324.2 ± 1.6a | 365.9 ± 0.3a | 2.4 ± 0.4a,b | 23.1 ± 1.4a | 60.4 ± 1.4a | 111.6 ± 2.5b | 170.3 ± 1.4a | 16.1 ± 0.5b |
| PLA–MLO–WD | 324.9 ± 1.2a | 356.9 ± 2.6a | 1.7 ± 0.2b | 32.9 ± 5.7b | 60.2 ± 1.0a | 110.2 ± 0.6b | 169.8 ± 0.6a | 17.5 ± 0.6b |
| Formulation | DMTA Analysis | Wettability | Color | ||
|---|---|---|---|---|---|
| Tg from tan δ Curve (°C) | Theta Angle (°) | L* | a* | b* | |
| PLA–MLO | 64.4 ± 0.5a | 66.9 ± 3.8a | 43.57 ± 0.36a | −1.89 ± 0.05a | 2.38 ± 0.08a |
| PLA–MLO–UW | 62.3 ± 0.3b | 66.4 ± 4.3a | 47.88 ± 0.41b | 1.63 ± 0.22b | 19.98 ± 0.75b,c |
| PLA–MLO–WA | 63.7 ± 0.3a | 77.3 ± 5.8b | 48.36 ± 0.07b | 1.23 ± 0.15b | 21.32 ± 0.17b |
| PLA–MLO–WB | 63.9 ± 0.4a | 76.9 ± 1.2b | 48.23 ± 0.38b | 0.21 ± 0.06c | 19.54 ± 0.30c |
| PLA–MLO–WC | 63.6 ± 0.4a | 80.8 ± 2.3c | 48.86 ± 0.33b | −0.03 ± 0.04c,d | 17.21 ± 0.26d |
| PLA–MLO–WD | 63.7 ± 0.2a | 75.0 ± 0.4d | 49.38 ± 0.45b | −0.36 ± 0.05d | 18.05 ± 0.34d |
© 2019 by the authors. Licensee MDPI, Basel, Switzerland. This article is an open access article distributed under the terms and conditions of the Creative Commons Attribution (CC BY) license (http://creativecommons.org/licenses/by/4.0/).
Share and Cite
Pawlak, F.; Aldas, M.; López-Martínez, J.; Samper, M.D. Effect of Different Compatibilizers on Injection-Molded Green Fiber-Reinforced Polymers Based on Poly(lactic acid)-Maleinized Linseed Oil System and Sheep Wool. Polymers 2019, 11, 1514. https://doi.org/10.3390/polym11091514
Pawlak F, Aldas M, López-Martínez J, Samper MD. Effect of Different Compatibilizers on Injection-Molded Green Fiber-Reinforced Polymers Based on Poly(lactic acid)-Maleinized Linseed Oil System and Sheep Wool. Polymers. 2019; 11(9):1514. https://doi.org/10.3390/polym11091514
Chicago/Turabian StylePawlak, Franciszek, Miguel Aldas, Juan López-Martínez, and María Dolores Samper. 2019. "Effect of Different Compatibilizers on Injection-Molded Green Fiber-Reinforced Polymers Based on Poly(lactic acid)-Maleinized Linseed Oil System and Sheep Wool" Polymers 11, no. 9: 1514. https://doi.org/10.3390/polym11091514