
A Machine Learning Model for Torsion Strength of Externally Bonded FRP-Reinforced Concrete Beams


1
Engineering and Construction Management Department, Future University in Egypt (FUE), Cairo 11835, Egypt
2
Electrical Engineering Department, Future University in Egypt (FUE), Cairo 11835, Egypt
*
Author to whom correspondence should be addressed.
Polymers 2022, 14(9), 1824; https://doi.org/10.3390/polym14091824
Submission received: 6 March 2022
/
Revised: 19 April 2022
/
Accepted: 20 April 2022
/
Published: 29 April 2022
(This article belongs to the Special Issue Fiber Reinforced Polymers Applications as Reinforcement of Concrete Structures—Design Aspects, Tests and Analysis)
Abstract
:Strengthening of reinforced concrete (RC) beams subjected to significant torsion is an ongoing area of research. In addition, fiber-reinforced polymer (FRP) is the most popular choice as a strengthening material due to its superior properties. Moreover, machine learning models have successfully modeled complex behavior affected by many parameters. This study will introduce a machine learning model for calculating the ultimate torsion strength of concrete beams strengthened using externally bonded (EB) FRP. An experimental dataset from published literature was collected. Available models were outlined. Several machine learning models were developed and evaluated. The best model was the wide neural network, which had the most accurate results with a coefficient of determination, root mean square error, mean average error, an average safety factor, and coefficient of variation values of 0.93, 1.66, 0.98, 1.11, and 45%. It was selected and further compared with the models from the existing literature. The model showed an improved agreement and consistency with the experimental results compared to the available models from the literature. In addition, the effect of each parameter on the strength was identified and discussed. The most dominant input parameter is effective depth, followed by FRP-reinforcement ratio and strengthening scheme, while fiber orientation has proven to have the least effect on the prediction output accuracy.
1. Introduction
In recent years, there have been more reports of structural failures attributed to torsion [1]. Whittle identified several reasons for failure, which included but were not limited to the following: (1) design errors; (2) structural modeling errors; (3) inappropriate extrapolation of the code of practice; (4) inadequate assessment of critical forces paths. In addition, failure could be because of aging and lack of maintenance. Reinforced concrete (RC) members subjected to large torsion may fail quite suddenly, which is undesirable and needs to be avoided. Thus, analysis of damage to engineering structures, rehabilitation, and strengthening is becoming a necessity. The choice of material used for that purpose is of paramount importance. FRP has many advantages in engineering applications [2,3,4,5,6].
During the last few decades, rehabilitation and strengthening of structures using externally bonded fiber-reinforced polymer (EB-FRP) have been an important research topic worldwide [7,8,9,10]. Although many reinforced concrete (RC) members are subjected to significant torsion, most of the available research investigates concrete-strengthened members’ flexure and shear behavior. The high cost of infrastructure replacement has prompted research into various strengthening and rehabilitation techniques. Torsion strengthening is required in many projects [11]. Structural elements subjected to torsion experience diagonal tension and compression, thus failing in an undesirable brittle manner, leading to inadequate behavior during earthquakes [12,13,14,15,16,17]. Therefore, a simple yet accurate torsion design of concrete structural elements is essential. Much more research studies are required to give physical significance to the torsion design of concrete beams with FRP [18,19,20].
Although most of the early research efforts focused on beams strengthened using EB-FRP subjected to moments or shear, more recently, starting in the year 2001, the torsion behavior of concrete beams with EB-FRP has gained much attention. Over the last few years, several experimental investigations worldwide have been conducted to study the torsional behavior of strengthened concrete beams, as shown in Figure 1 [21,22,23,24,25,26]. However, much more work is required to give physical significance to the torsion design of concrete beams strengthened using EB-FRP.
In the case of torsion strengthening, de-bonding failure is the most common failure mode, which is usually accompanied by excessive concrete cracking or bond slippage at the fiber-reinforced polymer (FRP) and concrete interface [27,28,29,30,31]. Available bond models developed based on simple shear testing of FRP sheets bonded to concrete blocks have shown that the FRP ultimate strain will probably not be reached, regardless of how large the interface length between the FRP and the concrete is. Existing models for torsion strength lack accuracy, and thus, a need for reliable and accurate strength models is a mandate.
Machine learning-based models have proven to be reliable in predicting the strength of many problems, including, but not limited to, punching shear and shear of beams [32,33,34]. However, very limited machine learning models were developed for torsion, especially for the torsion of beams strengthened with FRP. Thus, this research study focused on developing a machine learning model for the torsion strength of EB-FRP beams. In this regard, an experimental database was assembled, and the effects of various parameters were investigated. In addition, selected parameters such as FRP reinforcement ratio, fiber orientation, and concrete compression strength were implemented to develop a machine learning model. Moreover, several ML models were created, and their strength was compared with that of the experimental database results and that from the available design models. Finally, the importance of the various variables on the strength was found and discussed. This study could help further design code development.
2. Experimental Database Profiles
Since 2001, FRP has been studied as an externally reinforcing material for beams under torsion. Table 1 shows the statistical measures for the collected experimental database. For the case of concrete beams strengthened using EB-FRP, the following parameters were investigated: (1) beam width (b); (2) beam effective depth (d); (3) FRP Young’s modulus (E) as an indication of the type of fiber used, carbon FRP (CFRP) and glass FRP (GFRP); (4) FRP reinforcement ratio () taken as , where is the number of layers, is the thickness of FRP sheets, and is the width, is the center to center spacing, and is the concrete tube thickness, taken as, , is the concrete area enclosed inside the centerline of the FRP jacket, and is the perimeter of the area enclosed inside the centerline of the FRP jacket; (5) strengthening scheme; (6) concrete compressive strength; (7) fiber orientation.
A careful examination of the profile of the experimental database presented in Table 2 showed the following remarks: (1) the total number of beams strengthened using EB-FRP tested under significant torsion was 157 beam; (2) although beams are usually connected to a flange (i.e., a floor slab or inverted flanged beam) and the cross section shape have a significant effect on the behavior and design [17,22,35], only 22% of the tested beams had a flanged cross section while 77% investigated rectangular beams; (3) although the full jacket technique is not practical and the U-jacket performs poorly while the usage of anchorage systems for beams with EB-FRP under shear and torsion is gaining a lot of attention [36], less than 20% of the conducted studies investigated using an anchorage; (4) Although FRP continuous jackets can be uneconomic, in most cases, compared to FRP strip jacket, 61% and 37% investigated continuous and strip jackets, respectively; (5) although 45° inclined FRP jackets were found to be the most effective in torsion, only 10% of the experiments examined 45° inclined FRP jackets. In total, the number of tested beams strengthened using fully wrapped strips, continuous fully wrapped, U-jacket, extended U-jacket, and anchored U-jacket were 65, 36, 38, 11, and 13, respectively. Clearly, more work is needed to utilize anchorage devices and extended schemes.
Table 3 shows the parameters investigated by the previous experimental studies. For the case of concrete beams strengthened using EB-FRP, the following parameters were investigated: (1) strengthening scheme that varied depending on the practical application (i.e., access to 3 or 4 faces of the beam); (2) the type of fiber used (CFRP; GFRP, …etc.); (3) fiber orientation (); (4) original loading and condition before strengthening; (5) number of plies; (6) center to center spacing between strips (); (7) influence of anchor in U-wrapped test beams; (8) continuous wrap or strips.
3. Brief Summaries of Previous Models
3.1. FIB
The model developed by FIB [8] adapted the principle of superposition; the total torsion strength is the additive of both the steel and the FRP contribution to the torsion strength of the beam. In other words, the FRP and steel contributions are independent; thus, the FRP torsion contribution () was as follows: Where is Young’s Modulus of the FRP, is the thickness of the FRP, and are the width and depth of the concrete section, respectively, is the width of the FRP strip, is the center-to-center spacing between strips, is the angle of inclination of the diagonal cracks to the longitudinal axis [7] of the beam. The effective FRP strain is being calculated using the following formulas:
where is the ultimate strain in the FRP and is FRP reinforcement ratio with respect to concrete calculated as follows:
3.2. Deifalla
Deifalla and co-workers [27,28] developed a simple model where the torsion contribution of the FRP contribution () can be calculated by the following:
where is the area enclosed inside the critical shear flow path due to the strengthening, is the stress in the FRP sheets at failure, is the angle of orientation of the fiber direction to the longitudinal axis of the beam, s is the spacing between the centerline of the FRP strips, and is the effective area of the FRP-resisting torsion calculated using the follows:
where is the number of FRP layers and the FRP effective strain is taken as follows:
where the development length () is calculated using the following:
Moreover, is a constant to consider the difference in the stress distribution between the continuous FRP sheets and the strips, which is calculated as follows:
where is FRP reinforcement ratio with respect to concrete calculated as follows:
where is the thickness of the equivalent hollow tube section taken as , is the concrete area enclosed inside the centerline of the FRP jacket and is the perimeter of the area enclosed inside the centerline of the FRP jacket.
3.3. ACI
The ACI [10,47] proposed a new design model, where the effective strain for FRP strips in shear is being adapted for this study as follows:
The selected models are quite similar in the approach used to calculate the torsion capacity, which is based on the hollow tube analogy. However, models vary significantly in the approach used to calculate the design strain and that used to consider different strengthening schemes (i.e., U-jacket, side bond).
4. Effects of Significant Parameters on Torsion Gain
In this section, the experimental results from the collected database were implemented to investigate the effects of FRP axial rigidity, strengthening scheme, and failure mode. The axial rigidity of the FRP was calculated as , where is the number of sheet layers, is the thickness of the FRP sheet, is the young’s modulus of FRP, is the concrete beam cross-section area, and is the concrete beam cross-section perimeter. The torsion gain was calculated as the ratio between the torsion contribution of the FRP and the torsion strength of the control beam without FRP. The influence of the FRP axial rigidity on the torsion strength gain is discussed with respect to strengthening schemes used and the observed failure mode. The torsion strength gain is plotted versus the FRP axial rigidity with respect to the failure mode and the strengthening scheme in Figure 2a,b, respectively. In general, the torsion gain increases with the increase in the FRP axial rigidity. The rate of increase is larger for FRP axial rigidity below 1000 compared to that for FRP axial rigidity above 1000. From Figure 2a, at the same FRP axial rigidity and using the same scheme, the percentage of the torsion gain varied significantly, indicating that maybe other parameters might have influenced it. From Figure 2b, it can be seen that data is scattered, which indicates that other parameters have a significant influence. Parameters include but are not limited to the beam dimensions and cross-section shape, and the concrete’s compressive strength and mechanical properties [17,23,29]. Thus, for the machine learning development, the following parameters were selected as follows: (1) X1, is a discrete variable, which represents full wrapping or U wrapping; (2) X2, which represents continuous or strip strengthening; (3) X3 is a discrete variable, which with 90-, 45-, and 0-degree values; X4 is a discrete variable, which n with a value of 1, 2, and 3; X5 is a continuous variable, which represents the ; X6 is a continuous variable, which represents .
5. Machine Learning Models
In recent years, artificial intelligence (AI) has been showing superior results in many applications, such as [59,60,61,62]. It has also shown to have accurate and promising results in structural engineering [63]. From these applications, machine learning (ML) has received exceptional attention from researchers [64,65]. In this paper, 11 machine learning models were implemented. Their performance is evaluated by comparing the accuracy and efficiency of their predictions to the experimentally measured strength. These comparisons are essential for the assessment of such models. All models have been trained using the experimental database, as shown in Section 2. Using 80% of the dataset for training with holdout validation of 15% and testing with the rest of 20%, as shown in Table 4. All models were trained using the same six inputs, and the output was the predicted value of torsion gain. To train an ML model, there are the following four main stages:
- Dividing the database into training and test sets.
- Applying the training methodology for the training set.
- Checking the accuracy requirements.
- Output the predicted values.
A total of 11 machine learning models were developed and used.
5.1. Ensembled Trees
An ensemble tree methodology is a weighted combination of multiple regression trees that can provide a strong and accurate prediction. This is because the combining of multiple trees improves the prediction efficiency. Two types of ensemble trees are used, boosted, and bagged, respectively. The boosted tree works as a two-step approach. In the first step, the training dataset is divided into subsets in order to obtain several average-preforming models. Then, in the second step, the maximum performance is obtained by joining all of the models in Step 1 using a defined cost function [66]. The bagged trees create many distinct models by forming bootstraps in a single tree and then integrating them all into one tree. The final decision is obtained as the average of the final trees [67].
5.2. Gaussian Process Regression
The Gaussian process regression (GPR) is a Bayesian nonparametric methodology used in solving complex problems. This approach has the ability to provide uncertainty measurements on the predictions. The main advantage of GPR is that the probability distribution is computed over all admissible functions that fit the data in the training set. It also defines a process that which the random variables are tolerated using a Gaussian distribution. Examining squared exponential, Marten 5\2, Exponential and Rational GPR.
5.3. Neural Networks
The Artificial Neural Network (ANN) is a supervised learning technique; it was initially inspired by the human biological nervous system. It is a computational black box composed of neurons [68]. ANN is a widely used approach. These methods typically have good predictive accuracy. However, they are not easy to interpret. Model flexibility increases with the size and number of fully connected layers in the neural network. We examined several types of NN model flexibility, narrow, medium, wide, bi-layered, and tri-layered NN, respectively. Each model is a feed-forward, fully connected neural network for classification. The first fully connected layer of the neural network has a connection between the network input, and each subsequent layer has a connection with the previous layer. Each fully connected layer multiplies the input by a weight matrix and then adds a bias vector. An activation function follows each fully connected layer. The final fully connected layer and the subsequent Soft Max activation function produce the network’s output, namely, classification scores and predicted labels.
5.4. Results and Discussions
All proposed models were tested using a testing set composed of 20% of the experimental dataset. To evaluate the effectiveness of the proposed models that were reported by comparing the coefficient of determination (R2), the root mean square error (RMSE), and the mean square error (MAE) for the randomly assigned test set. The three used statistical measures are computed as follows:
where, is the predicted output and is the real output. While the overfitting potential of the selected models is handled in the following two ways: (1) the dataset random splitting into a training set and a test set; (2) the performance evaluation of the model on the test data, as the model has not been trained on the test data before; therefore, the accuracy of the machine learning models in the training set is an indication of the actual performance of the model on the unseen data. All trained models were trained using a 15-fold cross-validation on the training set using the cross-validated parameters as the hyperparameters of the machine learning model. The optimal parameter for each model is obtained using a 15-fold cross-validation. The results of the proposed models are provided in Table 5. From Table 5, the model that produced the most accurate predictions was the wide neural network model, which reported the highest , lowest RMSE, and MAE of values 0.93, 1.6634, and 0.98591, respectively. However, it had the longest training time. All proposed models were trained on Intel(R) Core (TM) i5-7200U CPU @ 2.50 GHz, 2.71 GHz, and 16 GB RAM using MATLAB 2021a Statistical and Machine learning toolbox.
Moreover, GPR methods reported the same highest value of . However, it was not optimal in RMSE and MAE, but generally, it produces acceptable predictions. Figure 3 depicts the scatter distribution of the predictions of the 11 developed ML models. Each model represents the residual plot, where it maps the difference between the observed predicted output and the real output value. The ideal residual plot is also called the null residual plot, where all the data points form an approximately constant width band around the identity horizontal line. The ideal case is to have all points in the linear line, i.e., to have zero error between the predicted and the real output values. The distance between data points and the horizontal line is the error in predictions. In Figure 3, model 1.22 (Wide NN) provides the most accurate predictions with respect to the other ML models developed. Model 1.22 also has the maximum and the least RMSE and MAE among the other developed ML models, as depicted in Table 5.
Moreover, a study of the influence of each of the input parameters on the prediction accuracy is shown in Figure 4. It can be concluded that the most dominant input parameter is X6, followed by X5, then X2, while X3 has proven to have the least effect on the prediction output accuracy. X6 also has the highest factor value of R2, and the lowest RMSE and MAE in training and testing, respectively.
Another good visualization for the optimized model is Wide NN; Figure 5 shows how the error decreases as different combinations of hyperparameters are evaluated. The proposed model convergence in the 30th training iteration with the best performance reached in the 16th training iteration and the minimum error hyperparameters. The proposed model is composed of three fully connected layers with sizes equal to 107, 96, and 256 and activation functions ReLU, Tanh, and Sigmoid, respectively, with a regularization strength (Lambda) of value and 900.9009.
6. Comparison between Proposed Model and Existing Design Models
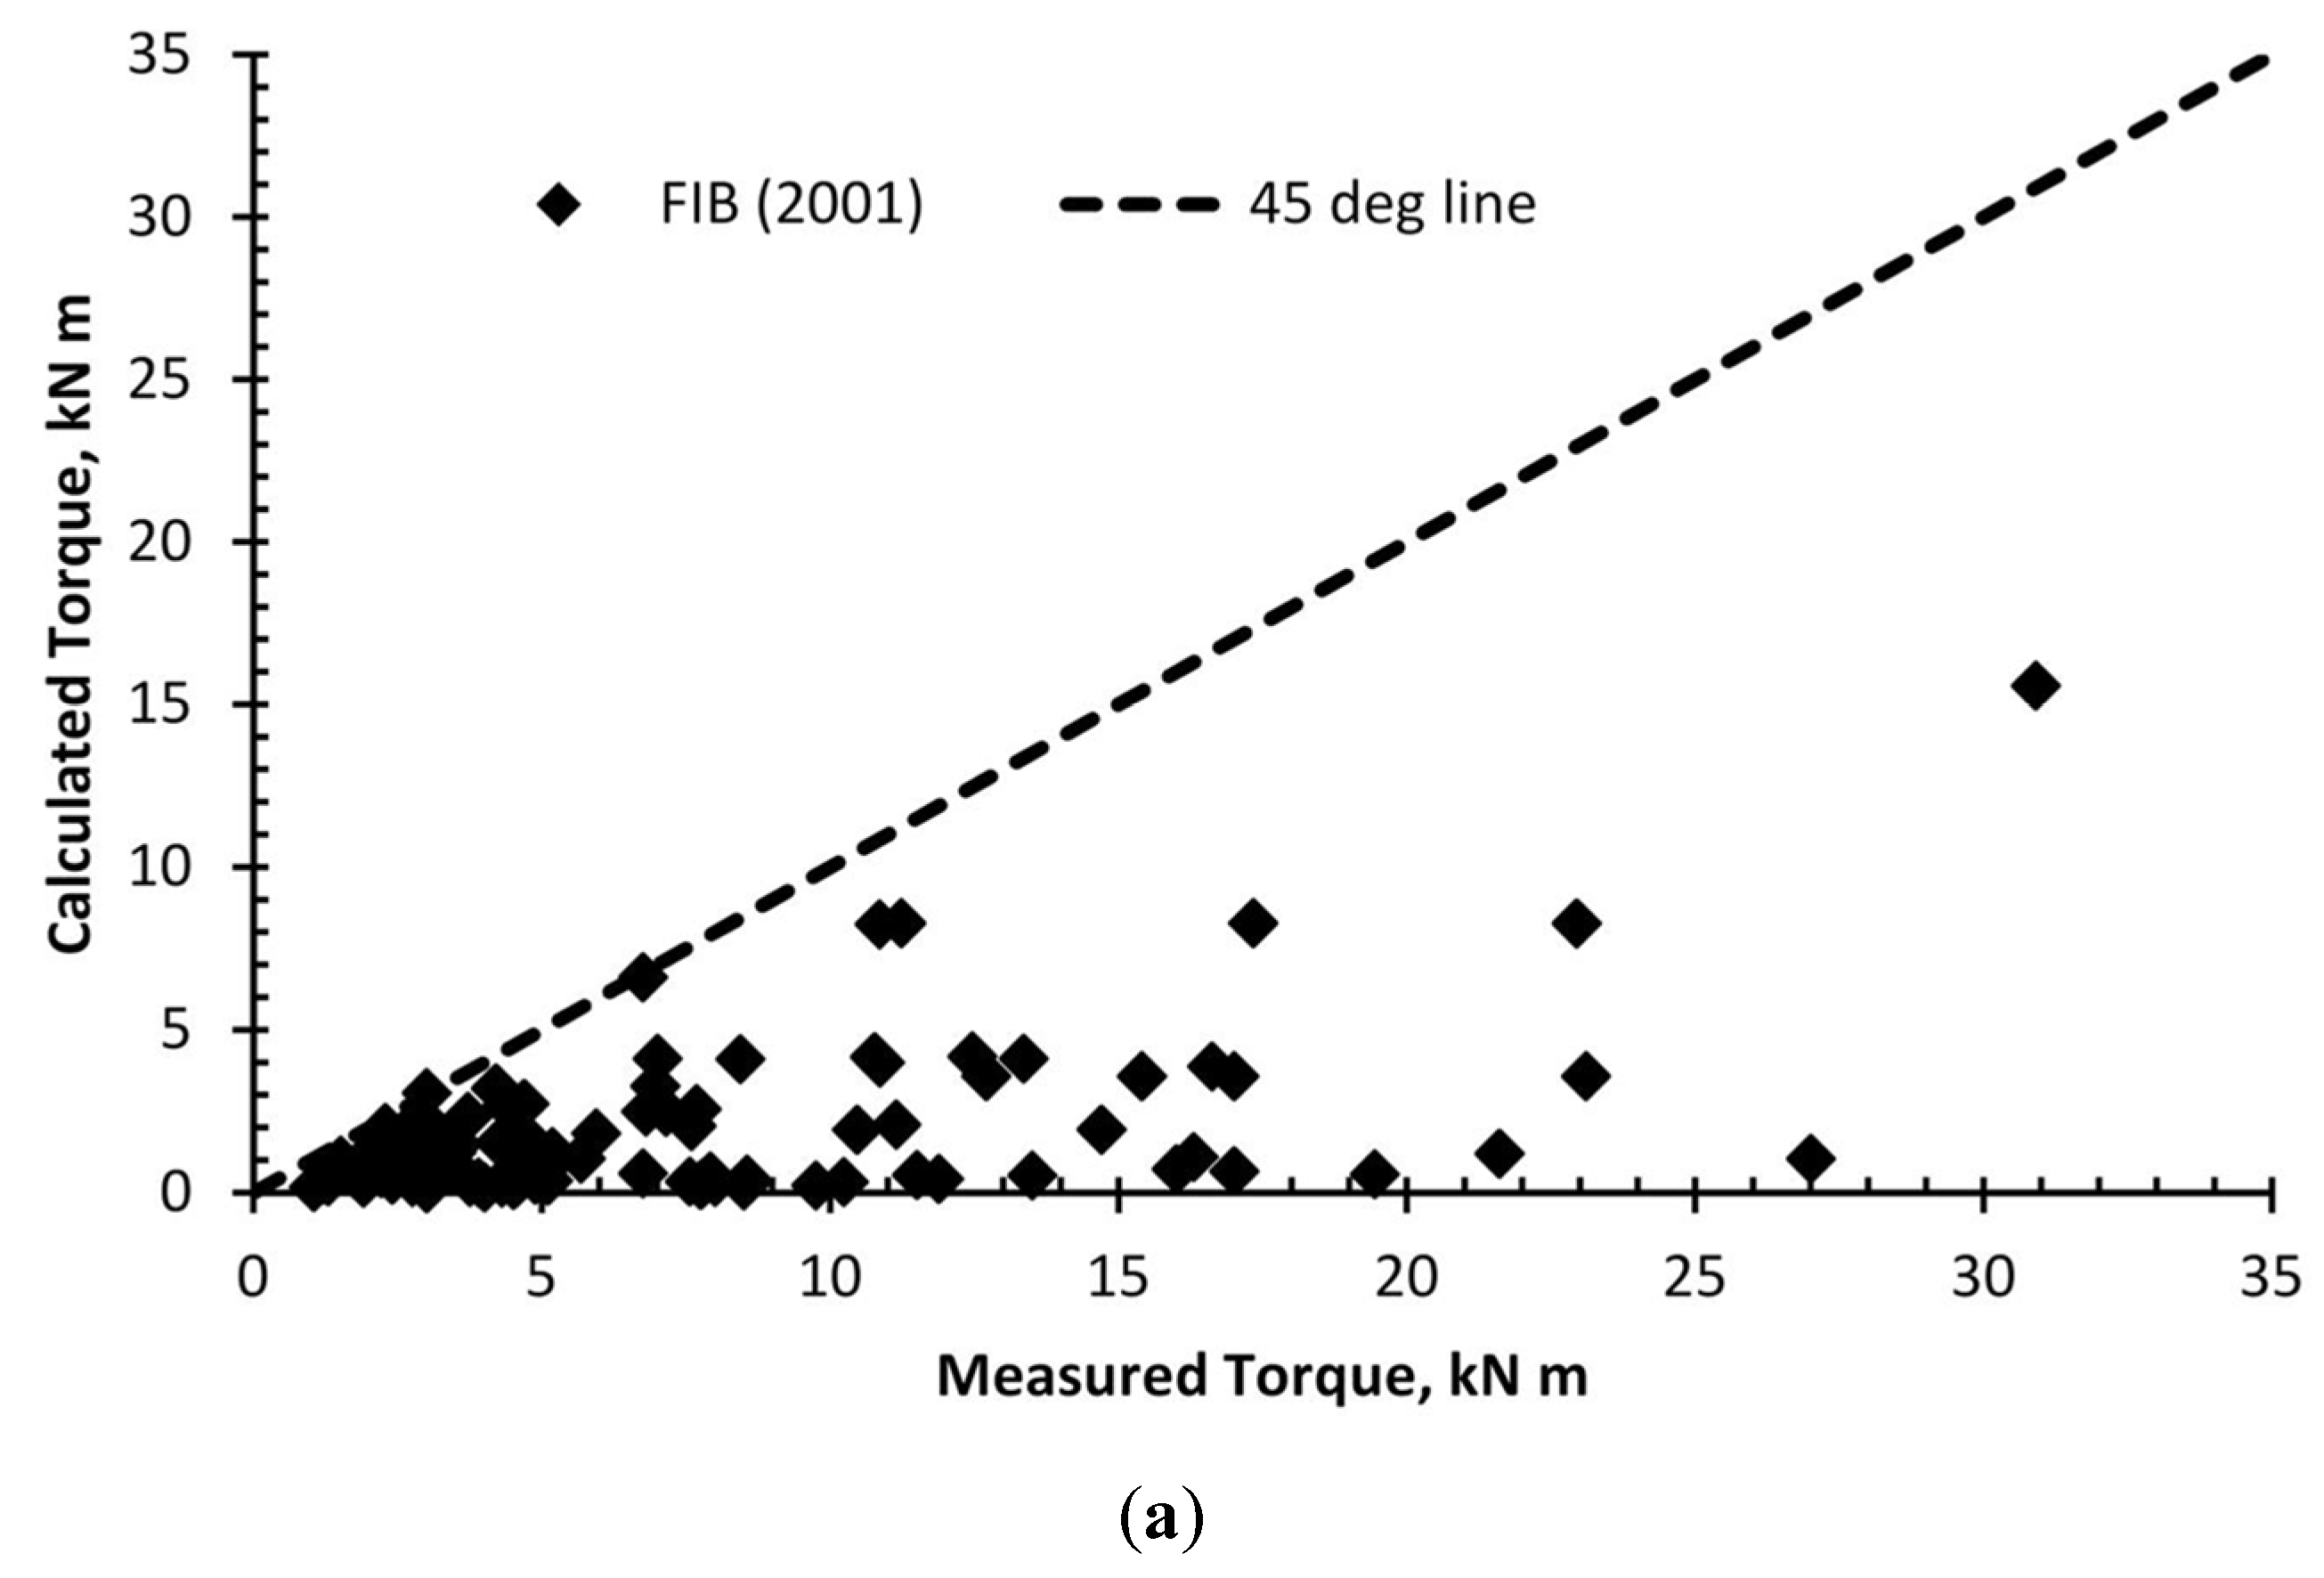
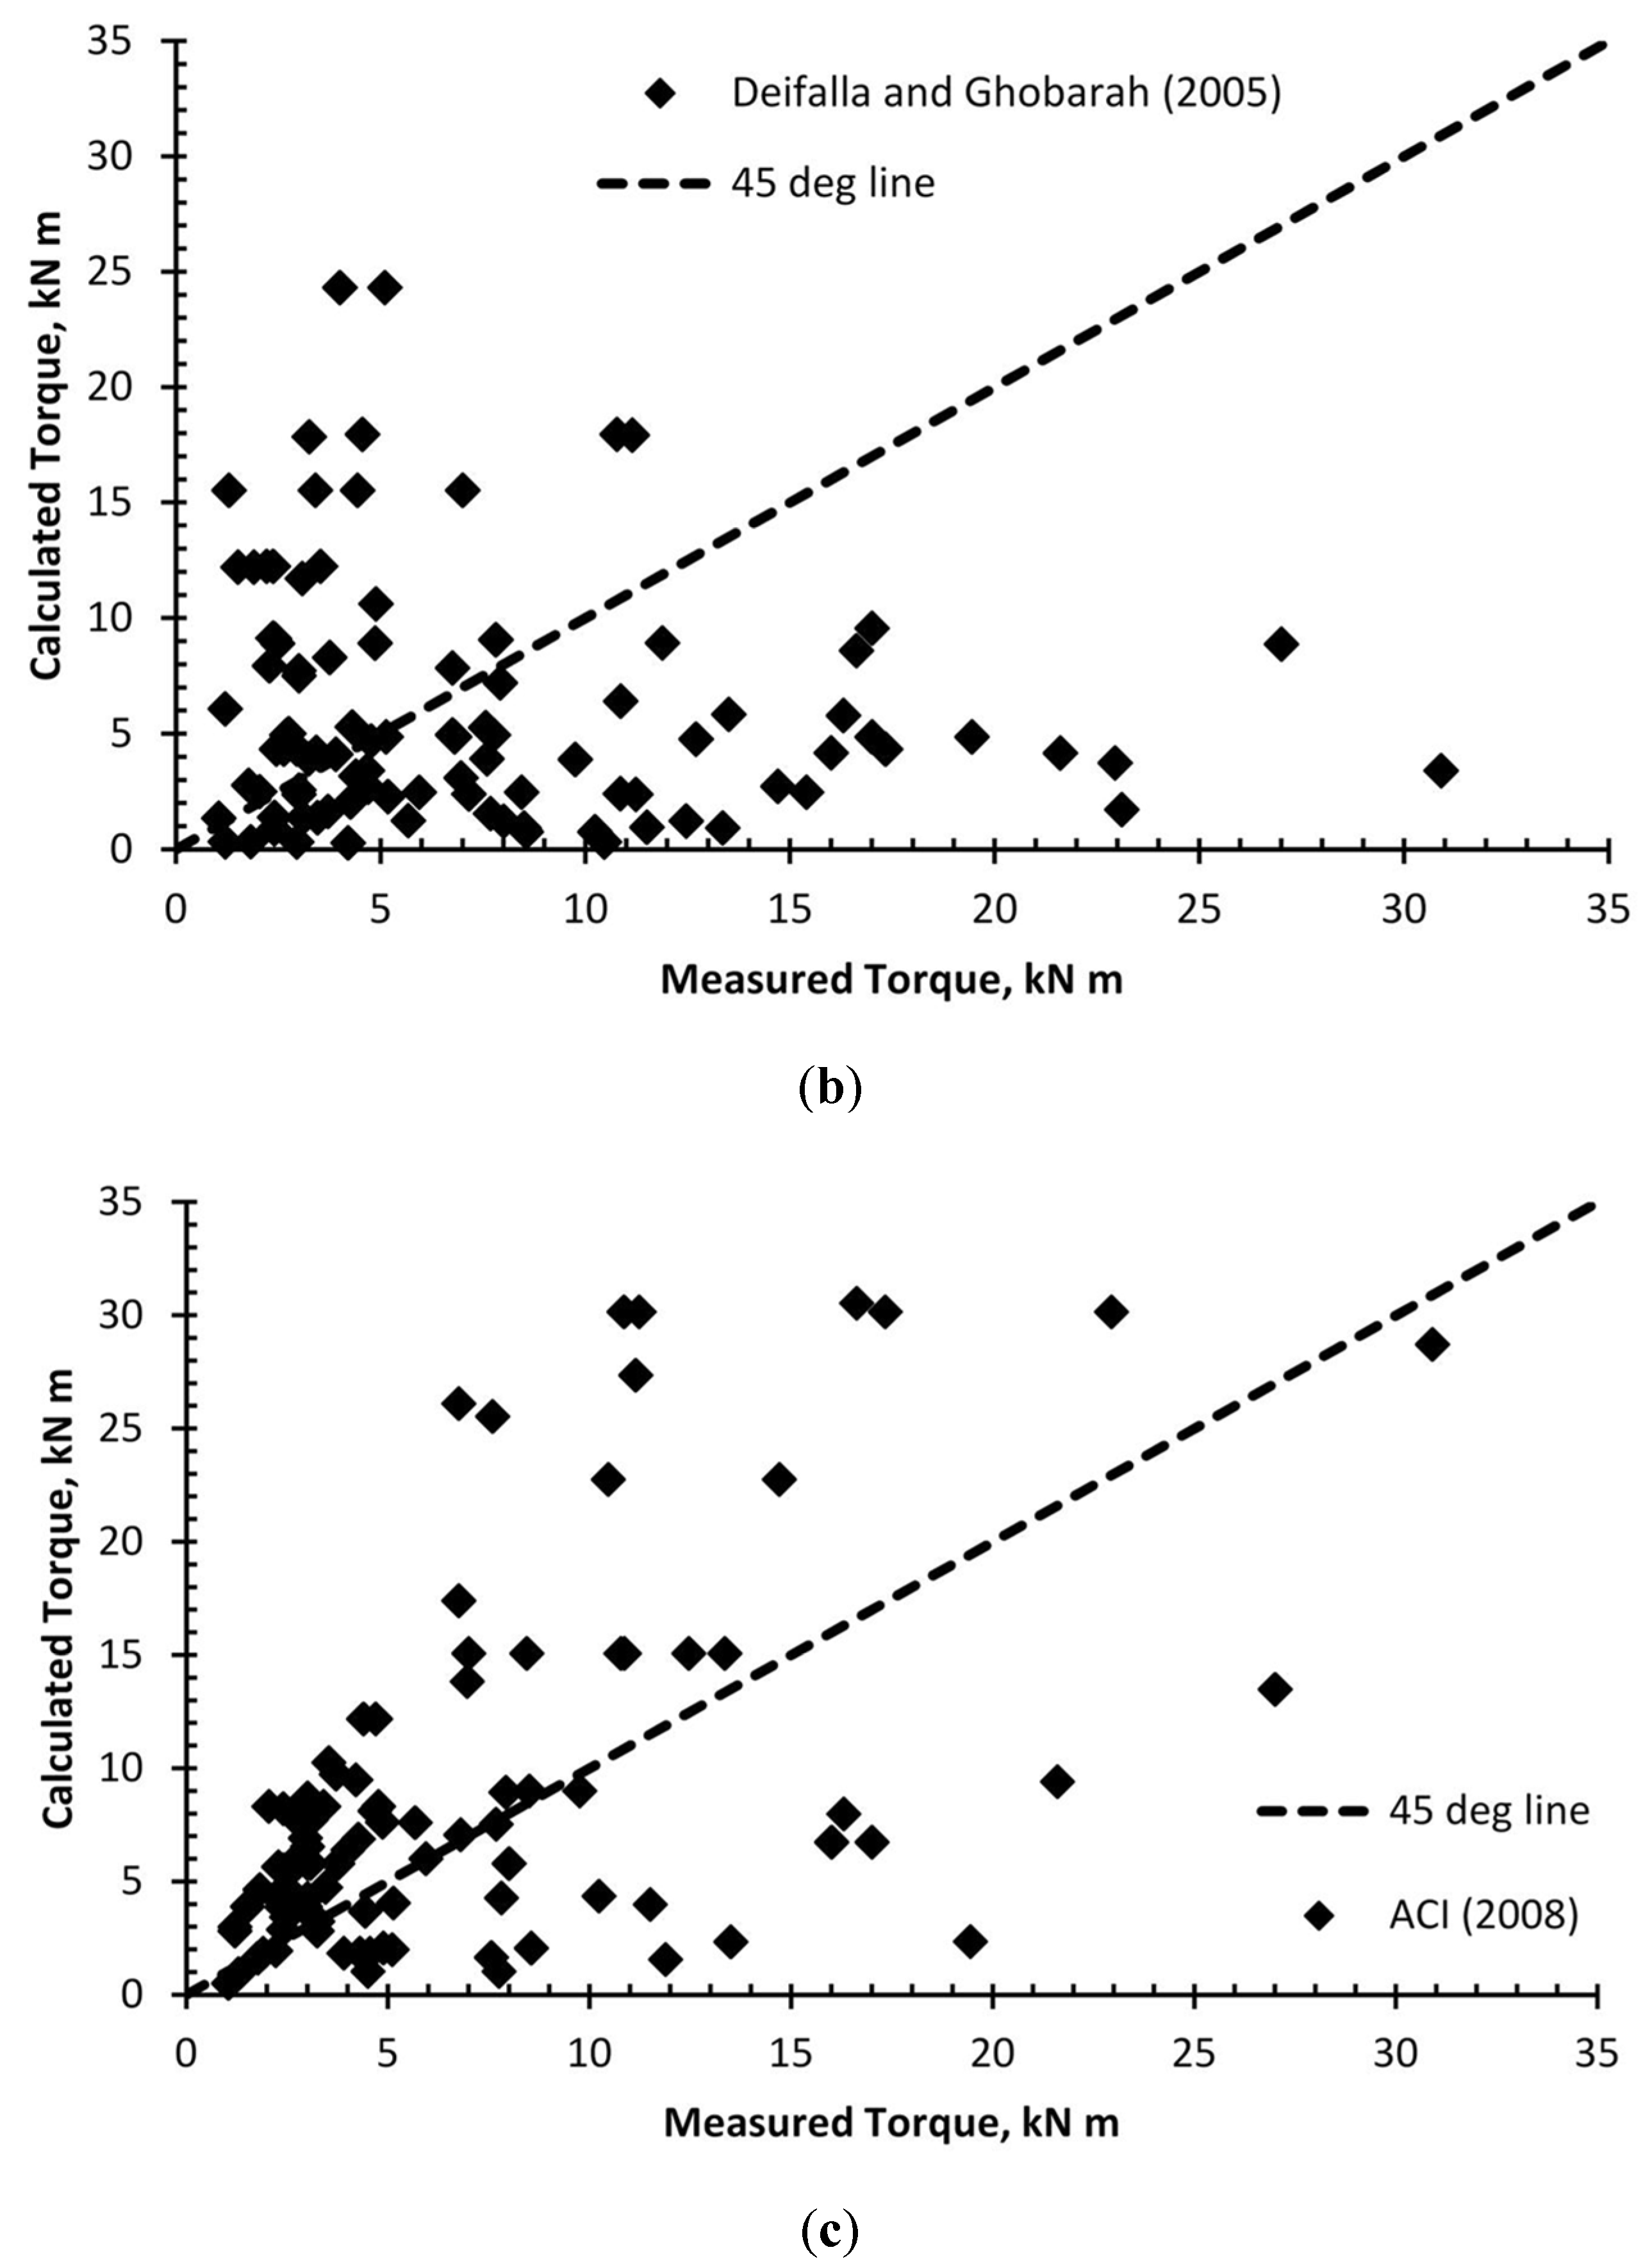
The strength was calculated using the available models and a wide neural network model. The angle (ɵ) was taken at 45 degrees to simplify the analysis for the purpose of this study. The ratios between the calculated strength, using the four different models, and the measured strength were graphed as shown in Figure 6. In addition, Table 6 shows the overall average, standard deviation, maximum, minimum, and 95% confidence interval. The proposed model showed a better agreement with the experimental results compared to the other models. Although the ACI (2008) had a comparable average with the wide neural network model, the proposed model predictions were remarkably consistent, having a significantly lower standard deviation compared to the other models. This is due to the ability of the wide neural network to model the true behavior in an accurate and reliable manner.
7. Summary and Conclusions
It is clear that the available design models are over-conservative, which is due to the brittle nature of the torsion and FRP. However, the refinement of such models or the development of more accurate and consistent models is the mandate of the research community in order to achieve an economical and safe design.
A total of 11 ML models were developed and tested for the prediction of the torsion gain, including ensembled trees and Gaussian process regression. The selected ML techniques have been widely used in previous studies and are known to effectively analyze different types of datasets. Performance measures were used to evaluate the accuracy of the selected models using R2, RMSE, and MAE and model training time. The ensembled trees, boosted and bagged, had the worst model performance, with an R2 of 0.71 and 0.47, respectively.
The most accurate model was the wide neural network model for predicting the torsion strength of concrete beams strengthened using EB-FRP. The models reported the best performance using R2, RMSE, and MAE with values of 0.93, 16,634 KN, and 0.98 KN, respectively; however, it had the longest training time.
The model was based on an extensive experimental database in order to capture the variation in the following parameters: (1) the strengthening technique; (2) the number and thickness of FRP layers; (3) the spacing between FRP strips; (4) the cross-section dimensions; (5) the FRP type and mechanical properties. The model was verified using an extensive experimental database from various sources and compared with the models available in the literature. In addition, the effect of each parameter on the strength was identified and discussed. Thus, the following conclusions were reached:
- -
- The proposed model based on wide neural networks provides good accuracy and reliable representation of the behavior.
- -
- The most dominant input parameter is effective depth, followed by an FRP reinforcement ratio and then strengthening scheme, while fiber orientation has proven to have the least effect on the prediction output accuracy.
- -
- This study could help further design code development.
Author Contributions
Conceptualization, A.D. and N.M.S.; methodology, A.D. and N.M.S.; software, N.M.S.; validation, N.M.S.; writing—original draft preparation, Salem writing—review and editing, A.D. All authors have read and agreed to the published version of the manuscript.
Funding
This research received no external funding.
Institutional Review Board Statement
Not Applicable.
Informed Consent Statement
Not Applicable.
Data Availability Statement
All developed data are included in the paper.
Conflicts of Interest
The authors declare no conflict of interest.
References
- Whittle, R. Failures in Concrete Structures—Case Studies in Reinforced and Prestressed Concrete; FL 33487-2742; CRC Press: Boca Raton, FL, USA; Taylor & Francis Group: Abingdon, UK, 2013; 140p. [Google Scholar]
- Xian, G.; Guo, R.; Li, C. Combined effects of sustained bending loading, water immersion and fiber hybrid mode on the mechanical properties of carbon/glass fiber reinforced polymer composite. Compos. Struct. 2022, 281, 115060. [Google Scholar] [CrossRef]
- Chenggao, L.; Guijun, X.; Hui, L. Tension-tension fatigue performance of a large-diameter pultruded carbon/glass hybrid rod. Int. J. Fatigue 2019, 120, 141–149. [Google Scholar] [CrossRef]
- Rui, G.; Guijun, X.; Chenggao, L.; Xiangyu, H.; Meiyin, X. Effect of fiber hybridization types on the mechanical properties of carbon/glass fiber reinforced polymer composite rod. Mech. Adv. Mater. Struct. 2021. [Google Scholar] [CrossRef]
- Mohammed, A.A.; Manalo, A.C.; Ferdous, W.; Zhuge, Y.; Vijay, P.; Pettigrew, J. Experimental and numerical evaluations on the behaviour of structures repaired using prefabricated FRP composites jacket. Eng. Struct. 2020, 210, 110358. [Google Scholar] [CrossRef]
- Siddika, A.; Mamun, M.A.A.; Ferdous, W.; Alyousef, R. Performances, challenges, and opportunities in strengthening reinforced concrete structures by using FRPs—A state-of-the-art review. Eng. Fail. Anal. 2020, 111, 104. [Google Scholar] [CrossRef]
- American Concrete Institute. ACI 440.2R-17; Guide for the Design and Construction of Externally Bonded FRP Systems for Strengthening Concrete Structures. American Concrete Institute: Farmington Hills, MI, USA, 2017.
- FIB. FRP Reinforcement in RC Structures; Technical Report Prepared by a Working Party of Task Group 9.3; FIB Bulletin 40; International Federation for Structural Concrete: Lausanne, Switzerland, 2007; p. 151. [Google Scholar]
- CSA-S806-02; Design and Construction of Building Components with Fiber Reinforced Polymers. Canadian Standards Association: Rexdale, ON, Canada, 2002; 206p.
- American Concrete Institute. ACI 440.2R-08; Guide for the Design and Construction of Externally Bonded FRP Systems for Strengthening Concrete Structures. American Concrete Institute: Farmington Hills, MI, USA, 2008.
- Gosbell, T.; Meggs, R. West gate bridge approach spans FRP strengthening Melbourne. In Proceedings of the IABSE Symposium, Melbourne, Australia, 11–13 September 2002. [Google Scholar]
- Deifalla, A.F.; Zapris, A.G.; Chalioris, C.E. Multivariable Regression Strength Model for Steel Fiber-Reinforced Concrete Beams under Torsion. Materials 2021, 14, 3889. [Google Scholar] [CrossRef]
- Deifalla, A. Refining the Torsion Design of Fibered Concrete Beams Reinforced with FRP using Multi-variable Non-linear Regression Analysis for Experimental Results. Eng. Struct. 2020, 224, 111394. [Google Scholar] [CrossRef]
- Deifalla, A. Torsion Design of Lightweight Concrete Beams without or with Fibers: A comparative study and a refined cracking torque formula. Structures 2020, 28, 786–802. [Google Scholar] [CrossRef]
- Deifalla, A.; Awad, A.; Seleem, H.; AbdElrahman, A. Investigating the Behavior of Lightweight Foamed Concrete T-Beams under Torsion, shear, and Flexure. Eng. Struct. 2020, 219, 110741. [Google Scholar] [CrossRef]
- Deifalla, A.; Awad, A.; Seleem, H.; AbdElrahman, A. Experimental and numerical investigation of the behavior of LWFC L-girders under combined torsion. Structures 2020, 26, 362–377. [Google Scholar] [CrossRef]
- Deifalla, A.; Ghobarah, A. Behavior and Analysis of Inverted T-shaped RC Beams under Shear and Torsion. Eng. Struct. 2014, 62, 776–786. [Google Scholar] [CrossRef]
- Hassan, M.M.; Deifalla, A. Evaluating the new CAN/CSA-S806-12 torsion provisions for concrete beams with FRP reinforcements. Mater. Struct. 2016, 49, 2715–2729. [Google Scholar] [CrossRef]
- Deifalla, A. Torsional Behavior of Rectangular and Flanged Concrete Beams with FRP Reinforcements. J. Struct. Eng. 2015, 141, 04015068. [Google Scholar] [CrossRef]
- Deifalla, K.M.S.; Abdelrahman, A. Simplified Model for the Torsional Strength of Concrete Beams with GFRP Stirrups. J. Compos. Constr. 2015, 19, 04014032. [Google Scholar] [CrossRef]
- Deifalla, A.; Hamed, M.; Saleh, A.; Ali, T. Exploring GFRP bars as reinforcement for rectangular and L-shaped beams subjected to significant torsion: An experimental study. Eng. Struct. 2014, 59, 776–786. [Google Scholar] [CrossRef]
- Deifalla, A.; Awad, A.; El-Garhy, M. Effectiveness of Externally Bonded CFRP Strips for Strengthening Flanged Beams under Torsion: An Experimental Study. Eng. Struct. 2013, 56, 2065–2075. [Google Scholar] [CrossRef]
- Deifalla, A.; Ghobarah, A. Strengthening RC T-Beams Subjected to Combined Torsion and Shear Using FRP fabrics—Experimental study. Compos. Constr. 2010, 14, 301–311. [Google Scholar] [CrossRef]
- Saeed Atea, R. Torsional behavior of reinforced concrete T-beams strengthened with CFRP strips. Case Stud. Constr. Mater. 2017, 7, 110–127. [Google Scholar]
- Siddikaa, A.; Abdullah-Al-Mamun, M.; Alyousefc, R.; Amran, Y.H.M. Strengthening of reinforced concrete beams by using fiber-reinforced polymer composites: A review. J. Build. Eng. 2019, 25, 100798. [Google Scholar] [CrossRef]
- Alabdulhady, M.; Sneed, L.H. Torsional strengthening of reinforced concrete beams with externally bonded composites: A state of the art review. Constr. Build. Mater. 2019, 205, 148–163. [Google Scholar] [CrossRef]
- Deifalla, A.; Ghobarah, A. Simplified analysis of RC beams torsionaly strengthened using FRP. In Proceedings of the International Symposium on Bond Behavior of FRP in Structures, BBFS 2005, Hong Kong, China, 7–9 December 2005. [Google Scholar]
- Deifalla, A.; Ghobarah, A. Calculating the Thickness of FRP Jacket for Shear and Torsion strengthening of RC T-Girders. In Proceedings of the Third International Conference on FRP Composites in Civil Engineering, Miami, FL, USA, 13–15 December 2006. [Google Scholar]
- Deifalla, A.; Ghobarah, A. Full torsional behavior of RC beams wrapped with FRP: Analytical model. Compos. Constr. 2010, 14, 289–300. [Google Scholar] [CrossRef]
- Karayannis, C.G.; Kosmidou, P.-M.K.; Chalioris, C.E. Reinforced Concrete Beams with Carbon-Fiber-Reinforced Polymer Bars—Experimental Study. Fibers 2018, 6, 99. [Google Scholar] [CrossRef] [Green Version]
- Al-Bayati, G.; Al-Mahaidi, R. Torsional Strengthening of Concrete Members Using CFRP Composites: A State-of-the-Art Review. In Proceedings of the Fourth Asia-Pacific Conference on FRP in Structures (APFIS 2013), Melbourne, Australia, 11–13 December 2013; International Institute for FRP in Construction: Kingston, ON, Canada, 2013. [Google Scholar]
- Salem, N.M.; Deifalla, A. Evaluation of the Strength of Slab–Column Connections with FRPs Using Machine Learning Algorithms. Polymers 2022, 14, 1517. [Google Scholar] [CrossRef] [PubMed]
- Ebid, A.; Deifalla, A. Using Artificial Intelligence Techniques to Predict Punching Shear Capacity of Lightweight Concrete Slabs. Materials 2022, 15, 2732. [Google Scholar] [CrossRef]
- Ebid, A.; Deifalla, A. Prediction of Shear Strength of FRP Reinforced Beams with and Without Stirrups Using (GP) Technique. Ain Shams Eng. J. 2021, 12, 2493–2510. [Google Scholar] [CrossRef]
- Chalioris, C.E.; Karayiannis, C. Effectiveness of the use of steel fibres on the torsional behavior of flanged concrete beams. Cem. Concr. Compos. 2009, 31, 331–341. [Google Scholar] [CrossRef]
- Kalfat, R.; Al-Mahaidi, R.; Smith, S. Anchorage devices used to improve the performance of reinforced concrete beams retrofitted with FRP composites: State-of-the-art review. J. Compos. Constr. 2013, 17, 14–33. [Google Scholar] [CrossRef]
- Zhang, J.; Lu, T.; Zhu, H. Experimental study on the behavior of RC torsional members externally bonded with CFRP. In Proceedings of the FRP Composites in Civil Engineering Conference, Hong Kong, China, 12–15 December 2001; Elsevier Science Ltd.: Amsterdam, The Netherlands, 2001; Volume I. [Google Scholar]
- Biddah, A.; El-Behairy, S.; Hussein, S. Repair and strengthening of bridge concrete beams subjected to shear and torsion using FRP. In Proceedings of the 6th International Conference on Short and Medium Span Bridges, Vancouver, BC, Canada, 31 July–2 August 2002. [Google Scholar]
- Ghobarah, M.; Ghorbel, C.S. Upgrading torsional resistance of RC beams using FRP. J. Compos. Constr. 2002, 6, 257–263. [Google Scholar] [CrossRef]
- Panchacharam, S.; Belarbi, A. Torsional behavior of reinforced concrete beams strengthened with FRP composites. In Proceedings of the First FIB Congress on Concrete Structures in the 21st Century, Osaka, Japan, 13–19 October 2002. [Google Scholar]
- Sharobim, K.; Mokhtar, H. Behavior of retrofitted concrete beams using carbon fiber reinforced plastics under torsion. In Proceedings of the Structural Composites for Infrastructure Application, Aswan, Egypt, 17–20 December 2002. [Google Scholar]
- Ronagh, H.R.; Dux, P.F. Full-scale torsion testing of concrete beams strengthened with CFRP. In Proceedings of the 1st International Conference on the Performance of Construction Materials in the New Millennium, Cairo, Egypt, 18–20 February 2003; pp. 735–743. [Google Scholar]
- Salom, P.; Gergely, J.; Young, D. Torsional strengthening of spandrel beams with fiber-reinforced polymer laminates. J. Compos. Constr. 2004, 8, 157–162. [Google Scholar] [CrossRef]
- Sayed, M. Strengthening of Reinforced Concrete Beams in Torsion. Master’s Thesis, Structural Engineering, Faculty of Engineering, El Zag-Zig University, Zagazig, Egypt, 2004. [Google Scholar]
- He, H.; Kiyomiya, O.; Masuda, A. Experimental Study on Torsion Behaviour of PC Beams Strengthened with Carbon Fiber Sheets. Eng. Concr. 2004, 26, 4. Available online: http://data.jci-net.or.jp/search.shtml (accessed on 5 March 2022).
- Hii, A.K.Y.; Al-Mahaidi, R. An Experimental and numerical investigation on torsional strengthening of solid and box-section RC beams using CFRP laminates. Compos. Struct. 2006, 75, 213–221. [Google Scholar] [CrossRef]
- Ameli, M.; Ronagh, H.; Dux, P. Behavior of FRP strengthened concrete beams under torsion. J. Compos. Constr. 2007, 11, 192–200. [Google Scholar] [CrossRef]
- Genidi, M. Strengthening of Reinforced Concrete Beams in Shear and Torsion Using Composite Materials. Ph.D. Thesis, Structural Engineering, Faculty of Engineering, Helwan University, Cairo, Egypt, 2007. [Google Scholar]
- Chalioris, C.E. Torsional strengthening of rectangular and flanged beams using carbon fiber-reinforced-polymers—Experimental study. Constr. Build. Mater. 2008, 22, 21–29. [Google Scholar] [CrossRef]
- Mohammadizadeh, M.; Fadeel, M.; Ronagh, H.R. Improving Torsional behavior of reinforced concrete beams strengthened with carbon fibre reinforced polymer composite. Iran. Polym. J. 2009, 18, 315–327. [Google Scholar]
- Natarajan, A.; Kumar, P.A. Experimental investigation of torsional behaviour of glass fibre wrapped reinforced concrete beam. Int. J. Earth Sci. Eng. 2009, 2, 63–67. [Google Scholar]
- Mohammadizadeh, M.; Fadeel, M. Experimental investigation on torsional strengthening of high strength concrete beams using CFRP sheets. Kuwait J. Sci. Eng. 2010, 37, 1–19. [Google Scholar]
- Mahmood, A.S.; Mahmood, M. Torsional behavior of prestressed concrete beams strengthened with CFRP sheets. In Proceedings of the 16th International Conference on Composite Structures (ICCS 16), Porto, Portugal, 28–30 June 2011. [Google Scholar]
- Abduljalil, A.S.; Sarsam, K.F. Torsional Behavior of Reinforced Concrete T Beams Strengthened with CFRP Strips. Eng. Technol. J. 2012, 30, 1462–1482. [Google Scholar]
- Chhabirani, T. Study of Torsional Behaviour of Rectangular Reinforced Concrete Beams Wrapped with GFRP. Master’s Thesis, National Institute of Technology, Odisha, India, 2012. [Google Scholar]
- El-Kateb, M.M.; Abdel Rahman, A.A.; Hassan, T.K. Torsional Strengthening of Reinforced Concrete Beams Using CFRP Sheets. Civ. Eng. Res. Mag. 2013, 35, 10. [Google Scholar]
- Khanna, S.; Patra, K. Torsional Strengthening of R.C. Beams Using Glass Fibre Reinforced Polymers (GFRP). IJERT 2013, 2, 1873–1878. [Google Scholar]
- Jariwala, V.H.; Patel, H.P.V.; Purohit, S.P. Strengthening of RC beams subjected to combined torsion and bending with GFRP composites. Procedia Eng. 2013, 51, 282–289. [Google Scholar] [CrossRef] [Green Version]
- Salem, N.M.F. A Survey on Various Image Inpainting Techniques. Future Eng. J. 2021, 2, 1. [Google Scholar]
- Salem, N.M.; Mahdi, H.M.K.; Abbas, H.M. A Novel Face Inpainting Approach Based on Guided Deep Learning. In Proceedings of the 4th International Conference on Communications, Signal Processing, and their Applications (ICCSPA), virtual, 16–18 March 2021. [Google Scholar]
- Salem, N.M.; Mahdi, H.M.K.; Abbas, H.M. Random-Shaped Image Inpainting using Dilated Convolution. Int. J. Eng. Adv. Technol. IJEAT 2019, 8, 641–647. [Google Scholar] [CrossRef]
- Salem, N.M.; Mahdi, H.M.K.; Abbas, H.M. Semantic image inpainting using self-learning encoder-decoder and adversarial loss. In Proceedings of the 13th International Conference on Computer Engineering and Systems (ICCES), Cairo, Egypt, 18–19 December 2018; pp. 103–108. [Google Scholar]
- Geetha, N.K.; Bridjesh, P. Overview of machine learning and its adaptability in mechanical engineering. Mater. Today 2020. [Google Scholar] [CrossRef]
- Mangalathu, S.; Karthikeyan, K.; De-Cheng, F.; Jeon, J.-S. Machine-learning interpretability techniques for seismic performance assessment of infrastructure systems. Eng. Struct. 2022, 250, 112883. [Google Scholar] [CrossRef]
- Chen, S.-Z.; Feng, D.-C.; Han, W.-S.; Wub, G. Development of data-driven prediction model for CFRP-steel bond strength by implementing ensemble learning algorithms. Constr. Build. Mater. 2021, 303, 124470. [Google Scholar] [CrossRef]
- Mangalathu, S.; Shin, H.; Choi, E.; Jeon, J.S. Explainable machine learning models for punching shear strength estimation of flat slabs without transverse reinforcement. J. Build. Eng. 2021, 39, 102300. [Google Scholar] [CrossRef]
- Alotaibi, E.; Mostafa, O.; Nassif, N.; Omar, M.; Arab, M.G. Prediction of Punching Shear Capacity for Fiber-Reinforced Concrete Slabs Using Neuro-Nomographs Constructed by Machine Learning. J. Struct. Eng. 2021, 147, 04021075. [Google Scholar] [CrossRef]
- Kumar, P.; Lai, S.; Wong, J.; Mohd, N.; Kamal, M.; Afan, H.A.; Ahmed, A.; Sherif, M.; Sefelnasr, A.; El-Shafie, A. Review of nitrogen compounds prediction in water bodies using artificial neural networks and other models. Sustainability 2020, 12, 4359. [Google Scholar] [CrossRef]
Figure 1.
Torsion strengthening schemes using FRP (a) Entire beam for rectangular beam; (b) U entire beam for rectangular beam; (c) 90 strips for rectangular beam; (d) U strips for rectangular beam; (e) Longitudinal strips for rectangular beam; (f) 90 strips and longitudinal strips for rectangular beam; (g) 45 strips one side for rectangular beam; (h) 45 strips spiral around beam for rectangular beam; (i) 90 strips for box beam; (j) U anchorage strips and longitudinal strips for box beam; (k) U anchorage strips for box beam; (l) Extended U entire beam for spandrel beam (with multiple FRP orientations); (m) U entire beam for T beam; (n) Extended U entire beam for T beam; (o) Entire beam for T beam.

Figure 2.
Torsion gain versus FRP axial rigidity (a) failure modes and (b) strengthening schemes.
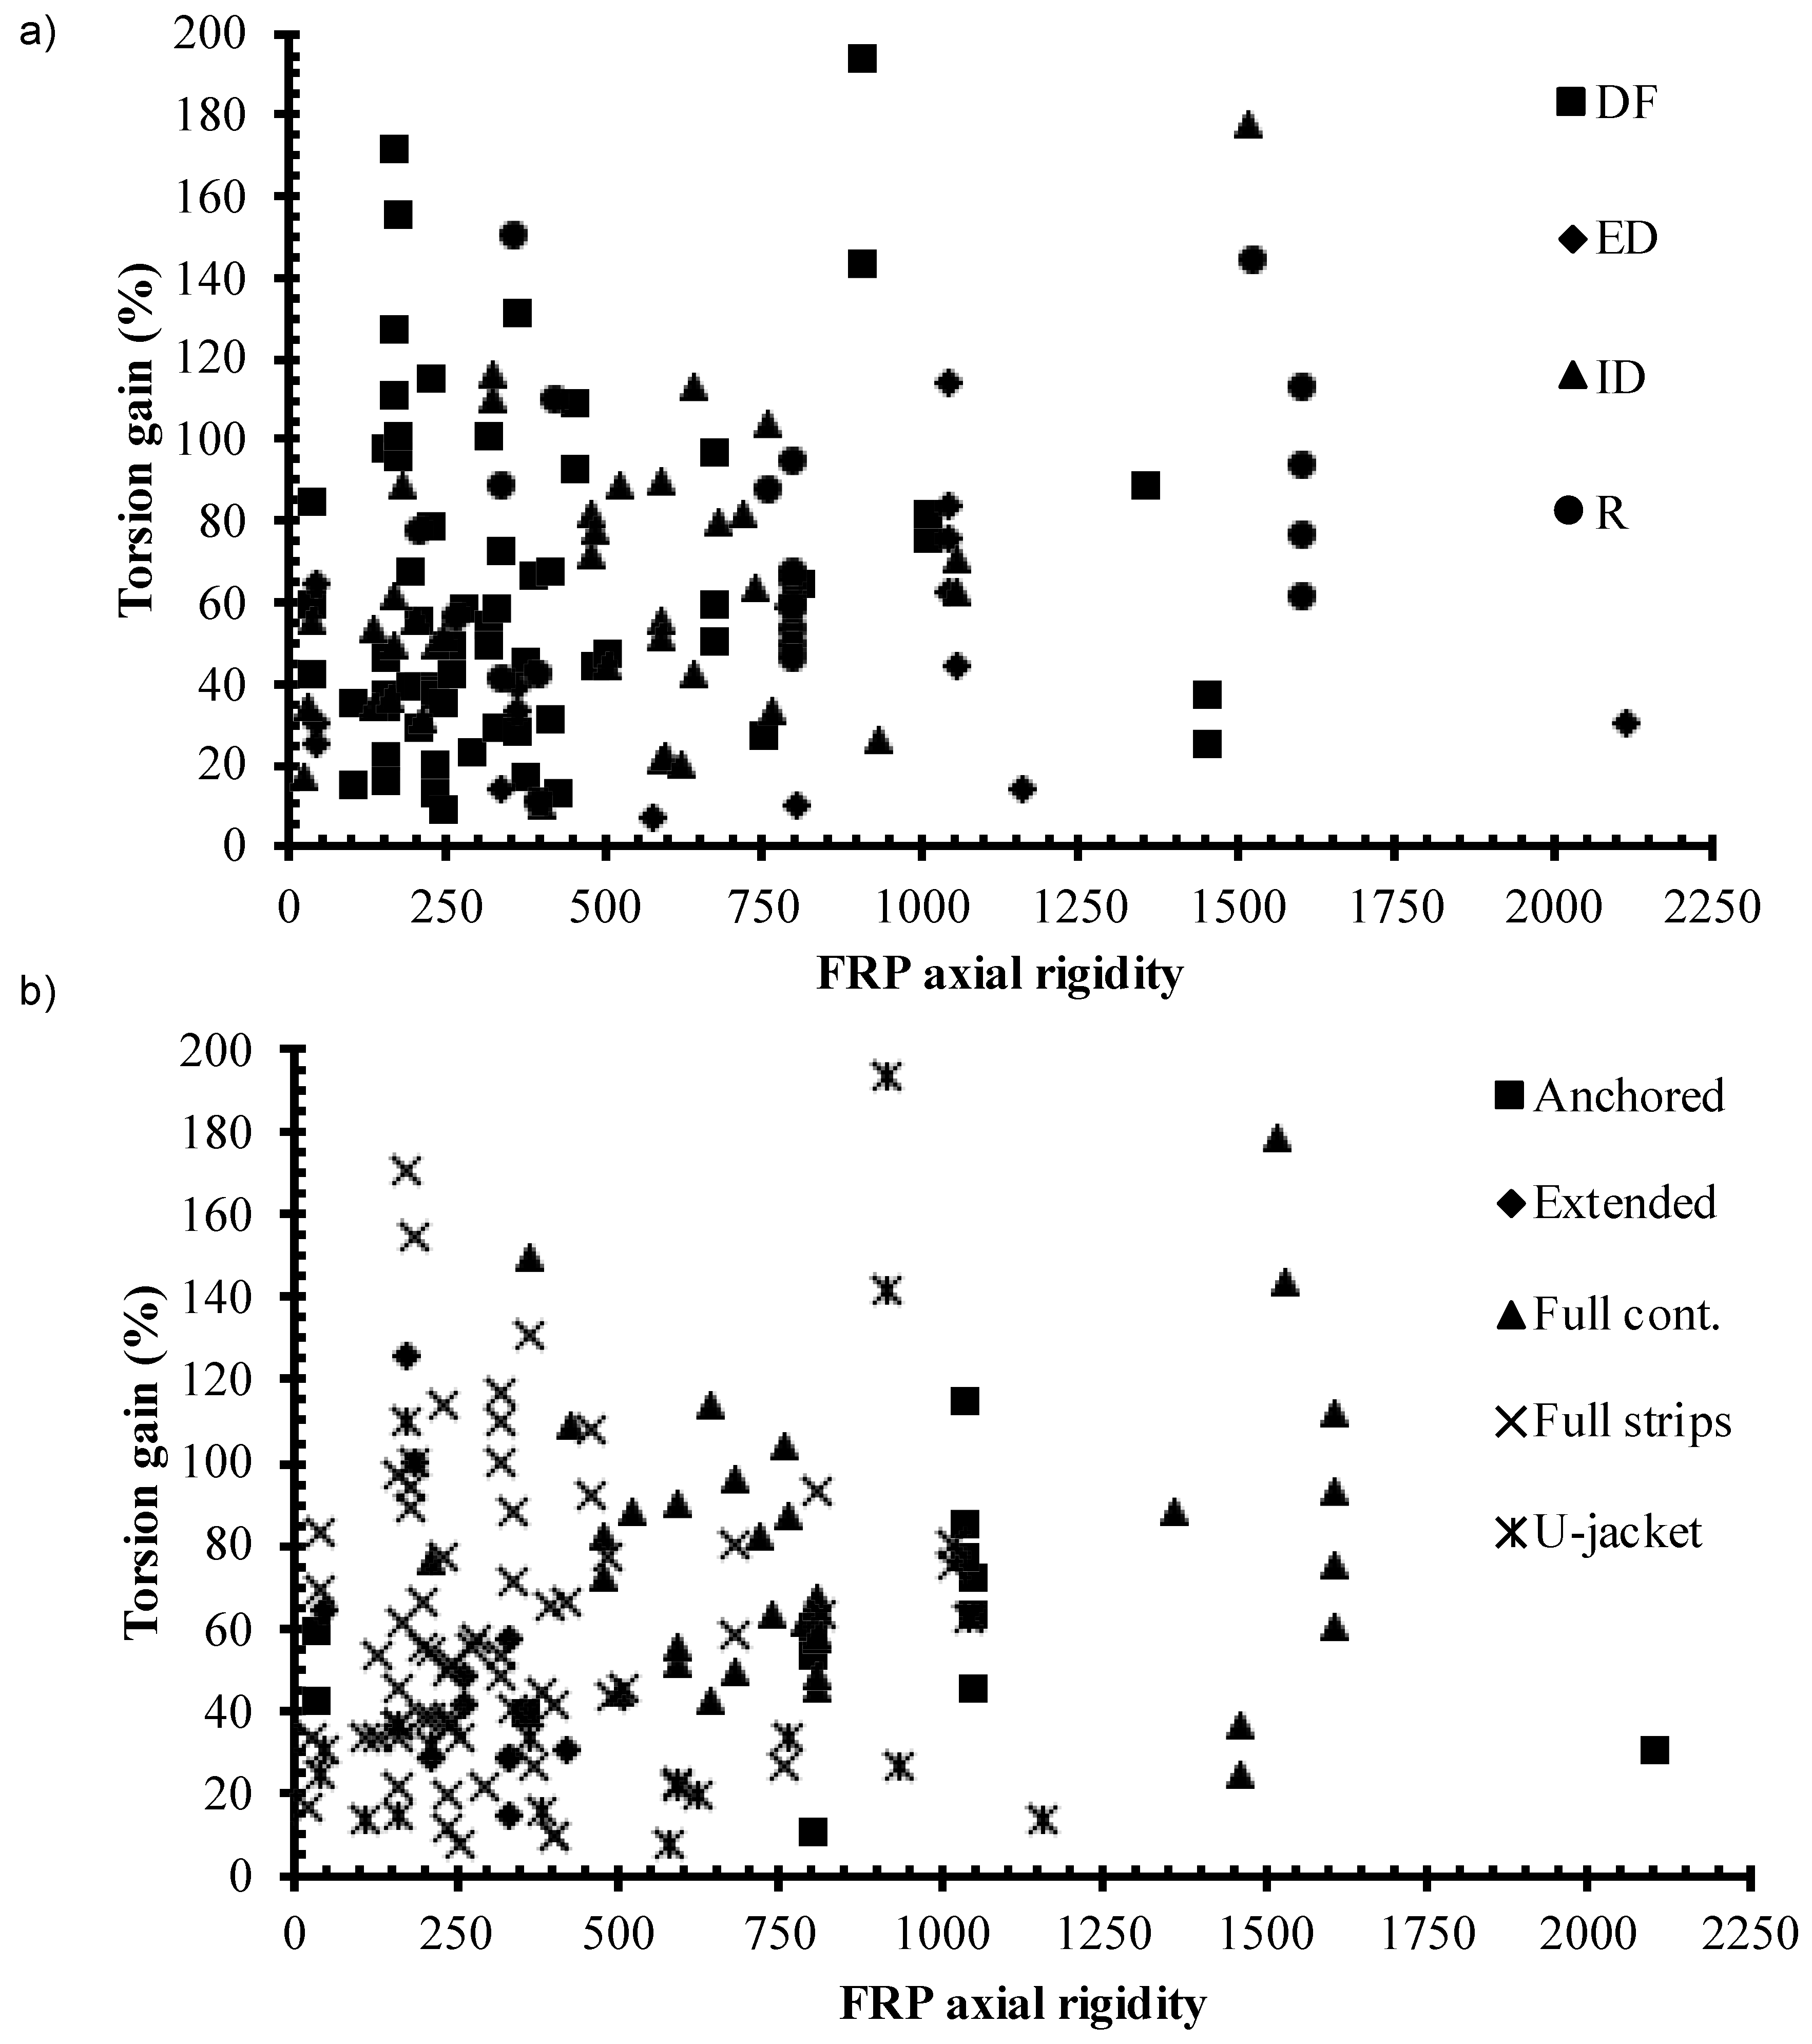
Figure 3.
The model predictions for the test set.

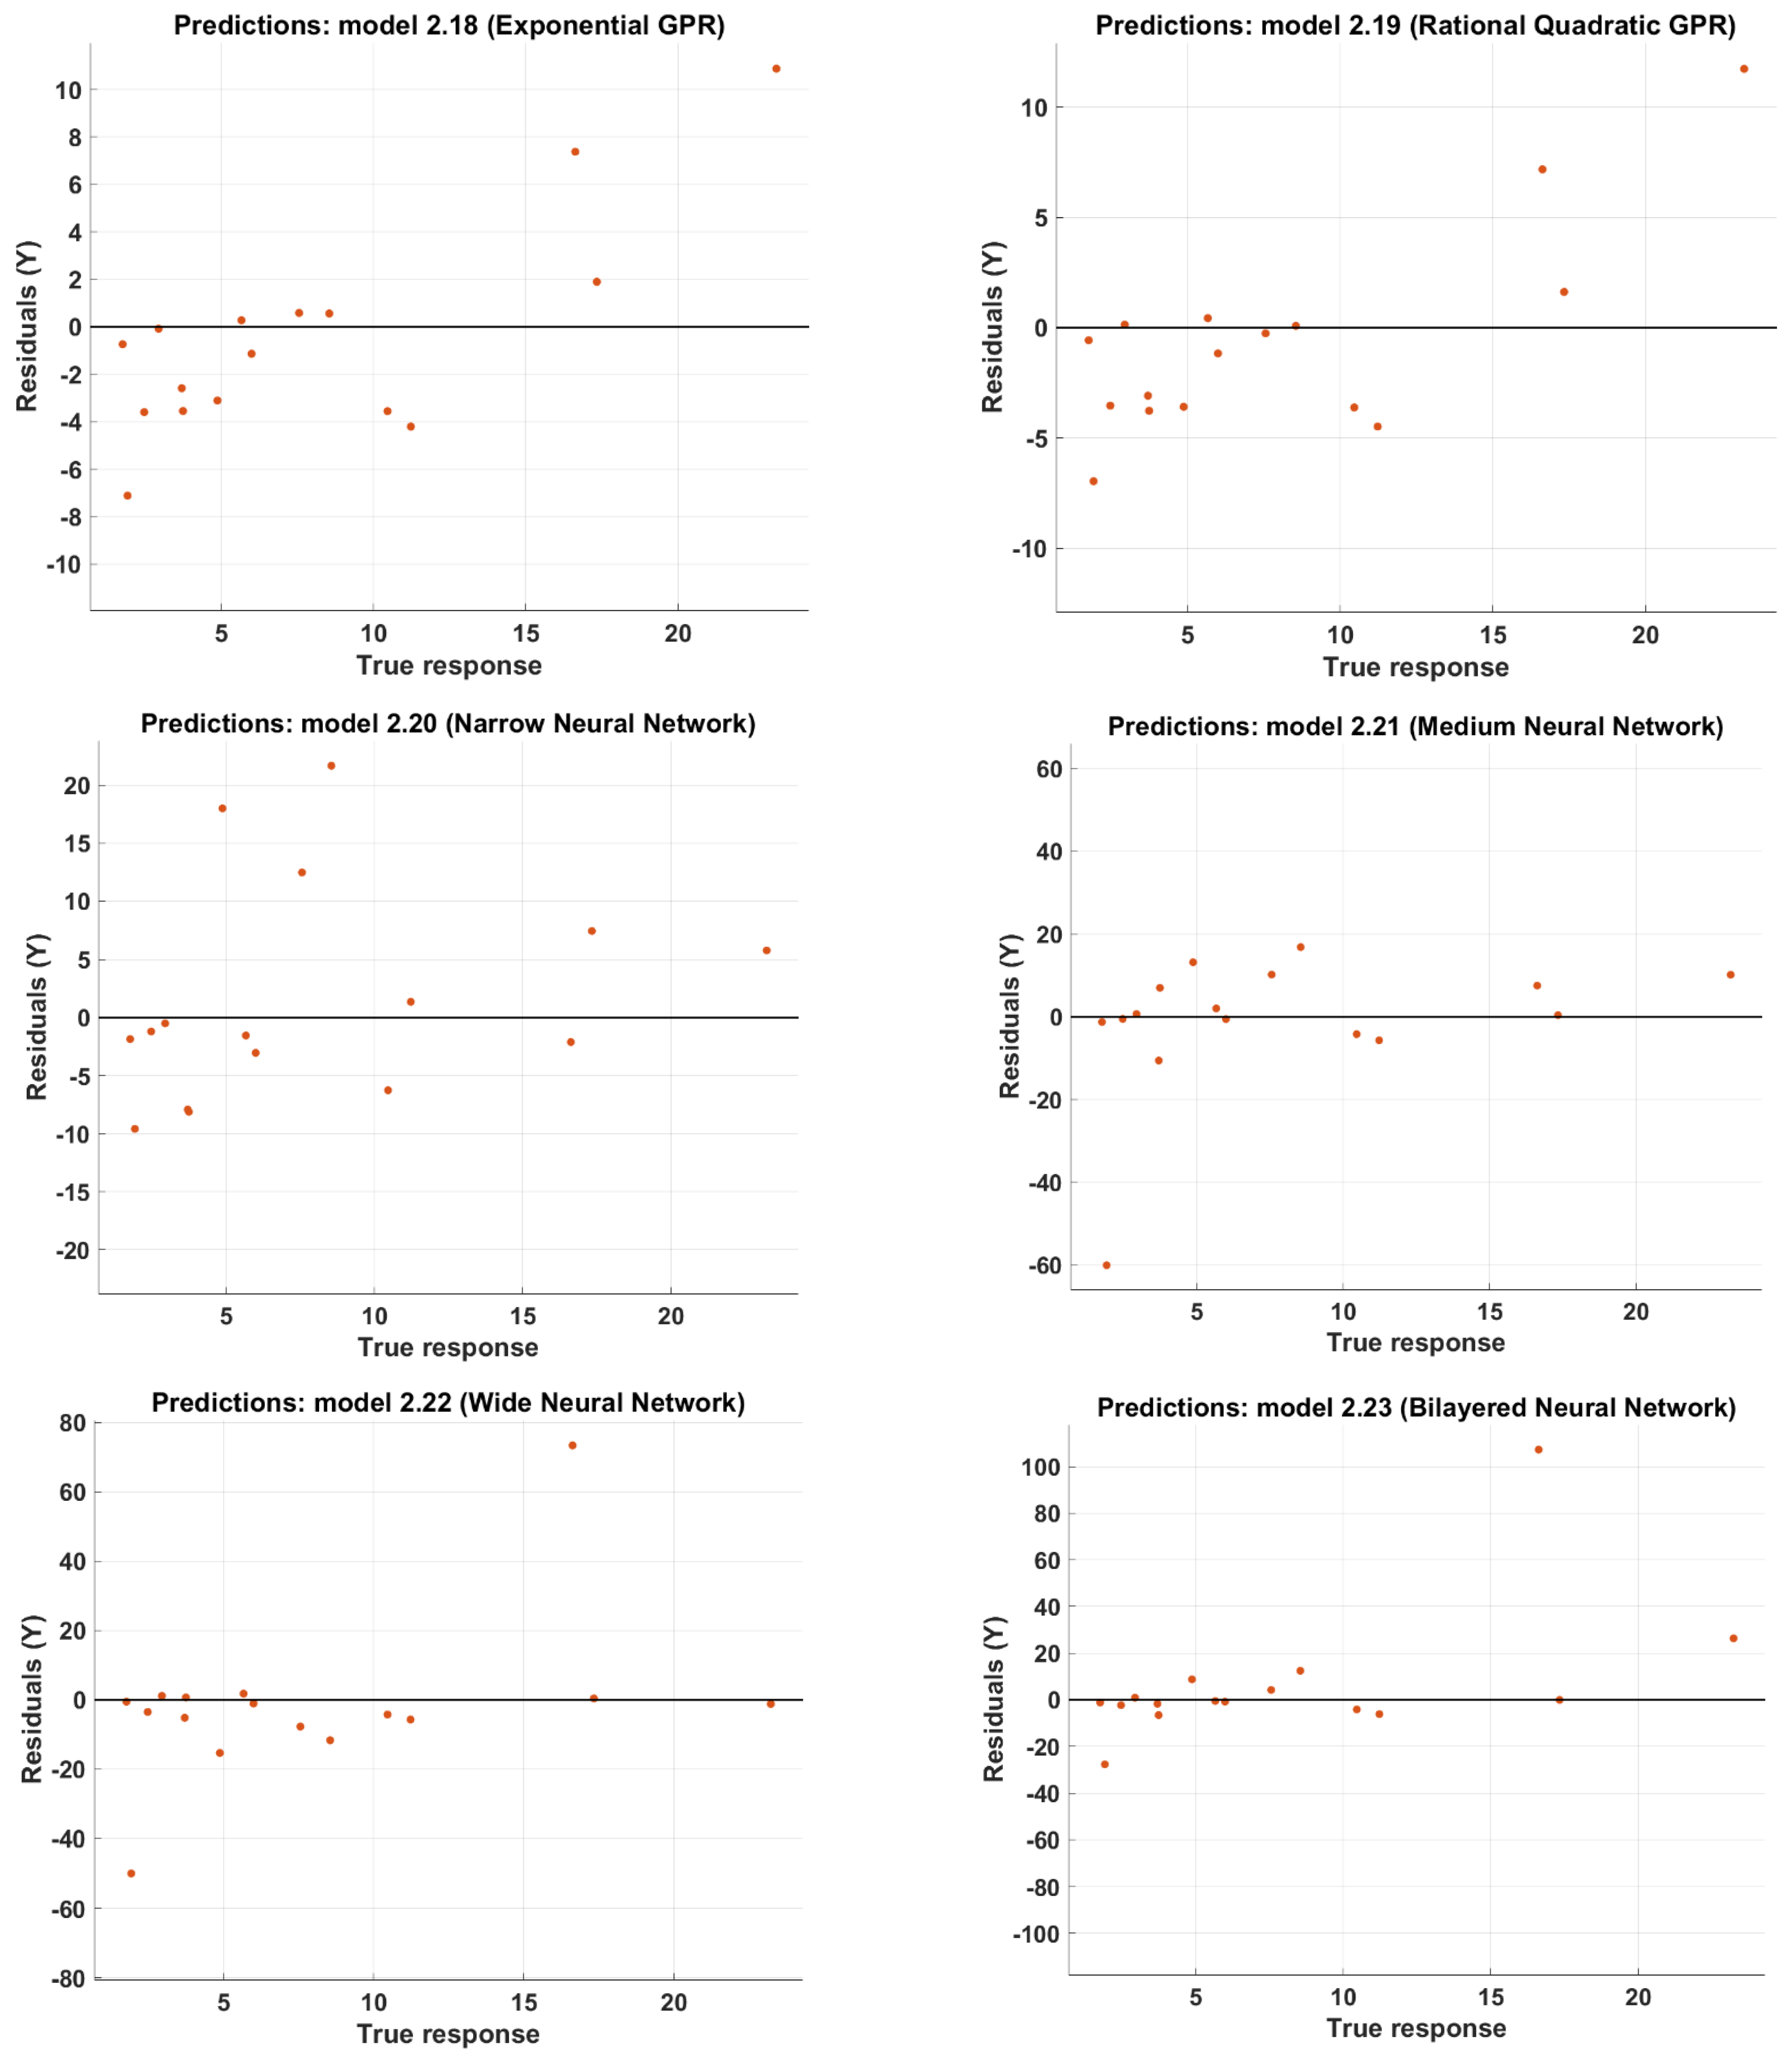
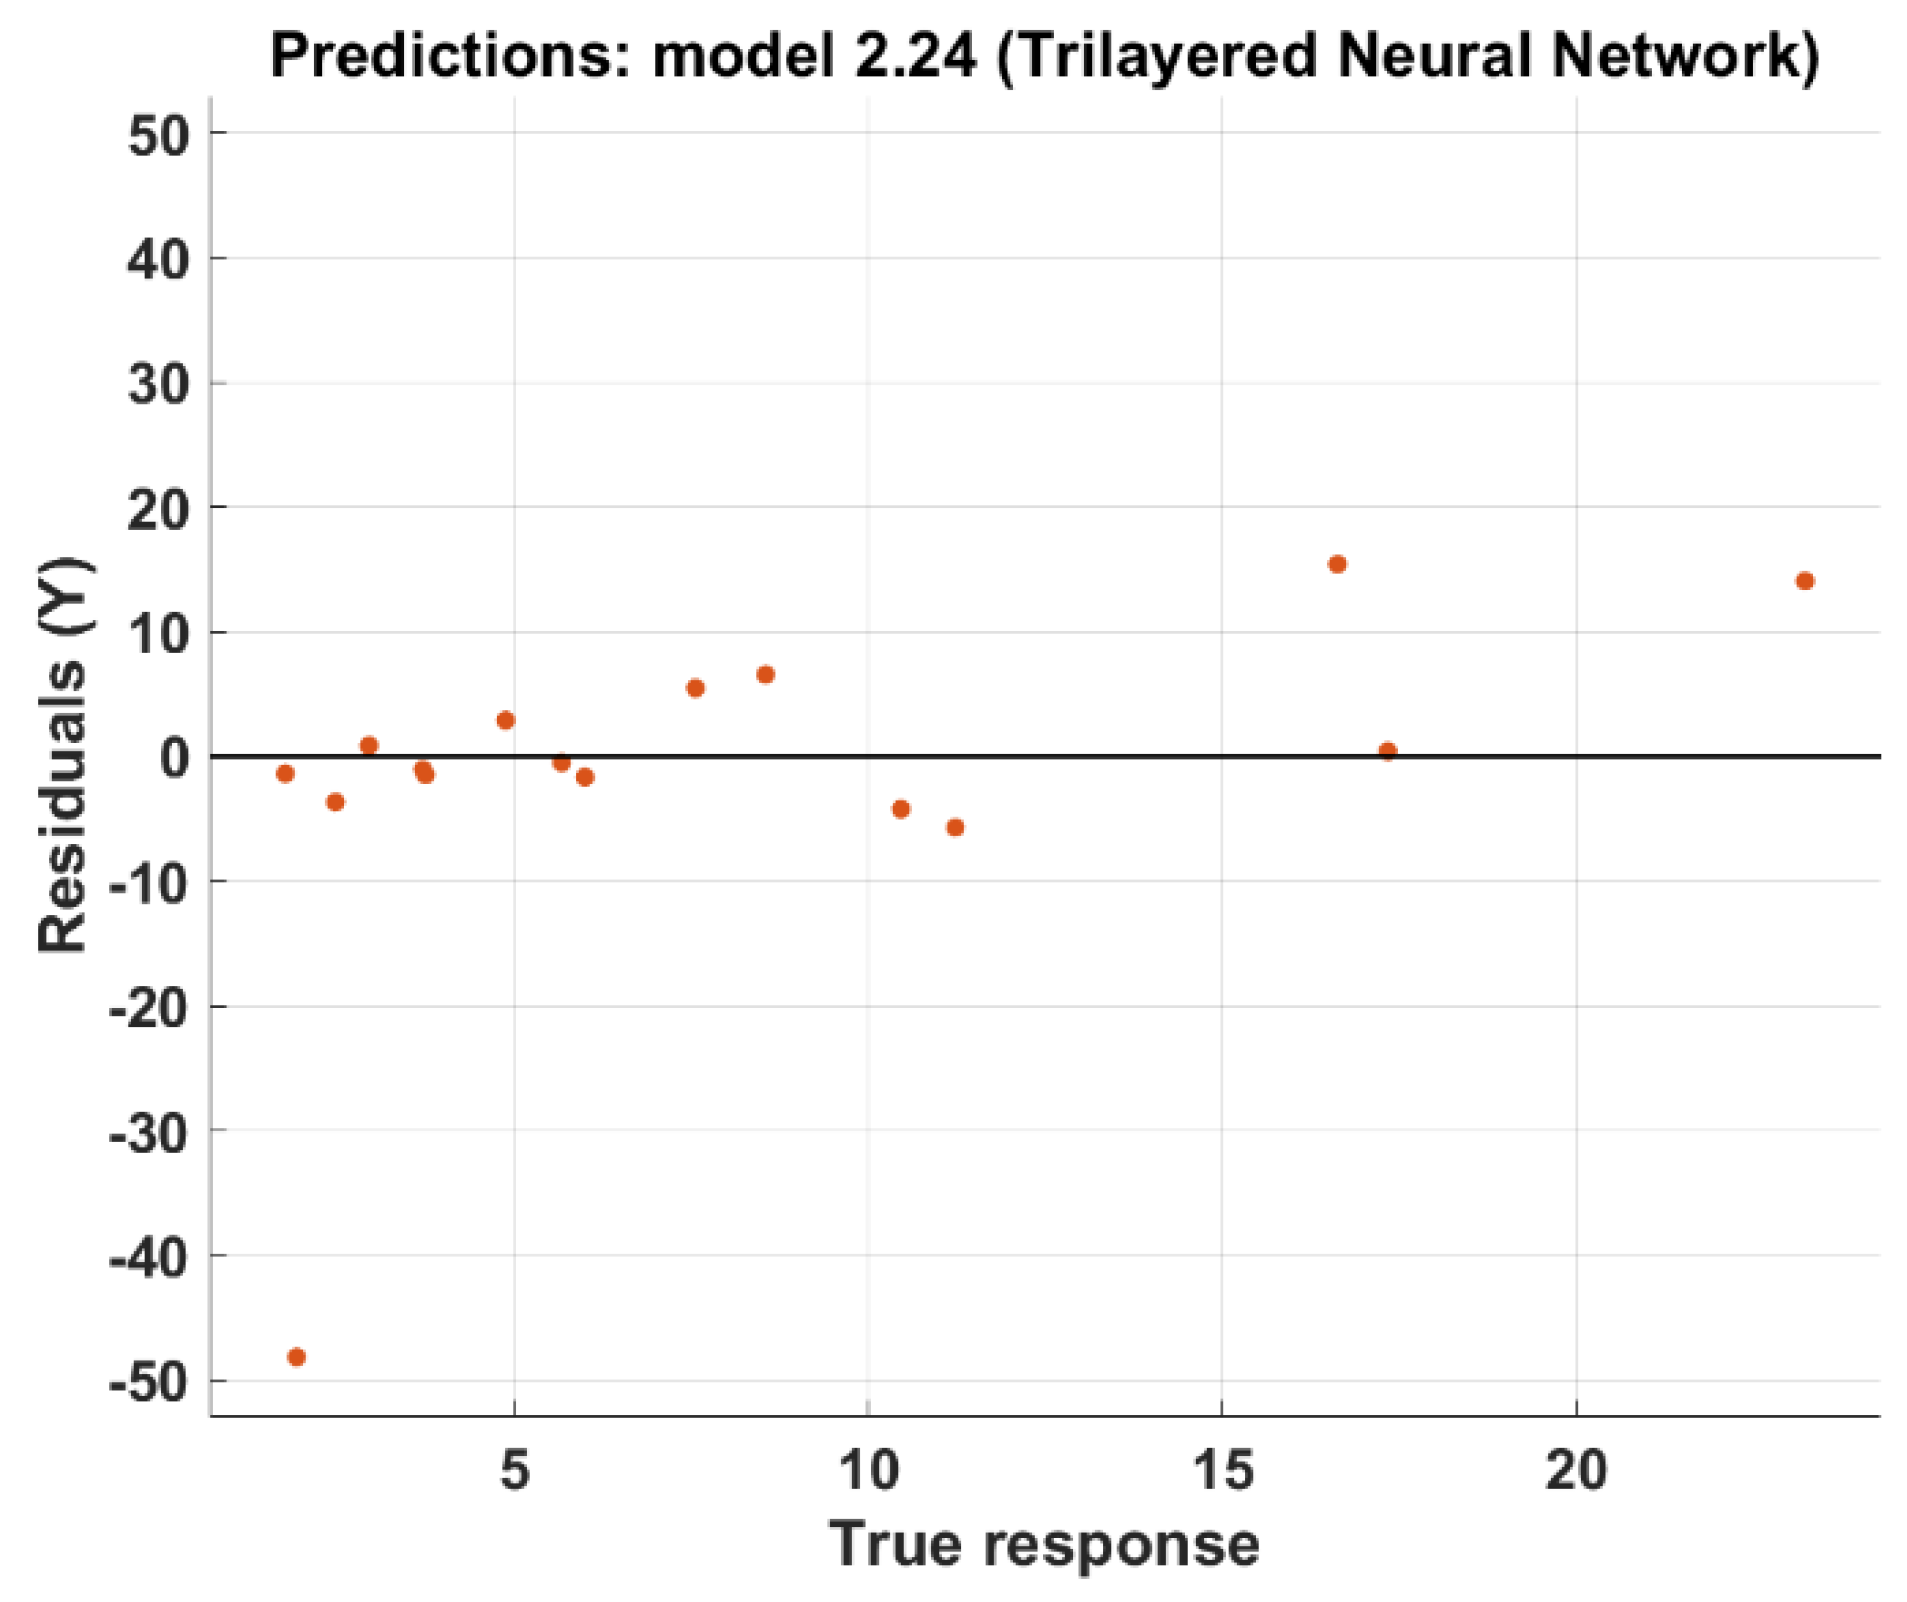
Figure 4.
Effect of input parameter on the output prediction.

Figure 5.
Optimized Wide Neural Network.
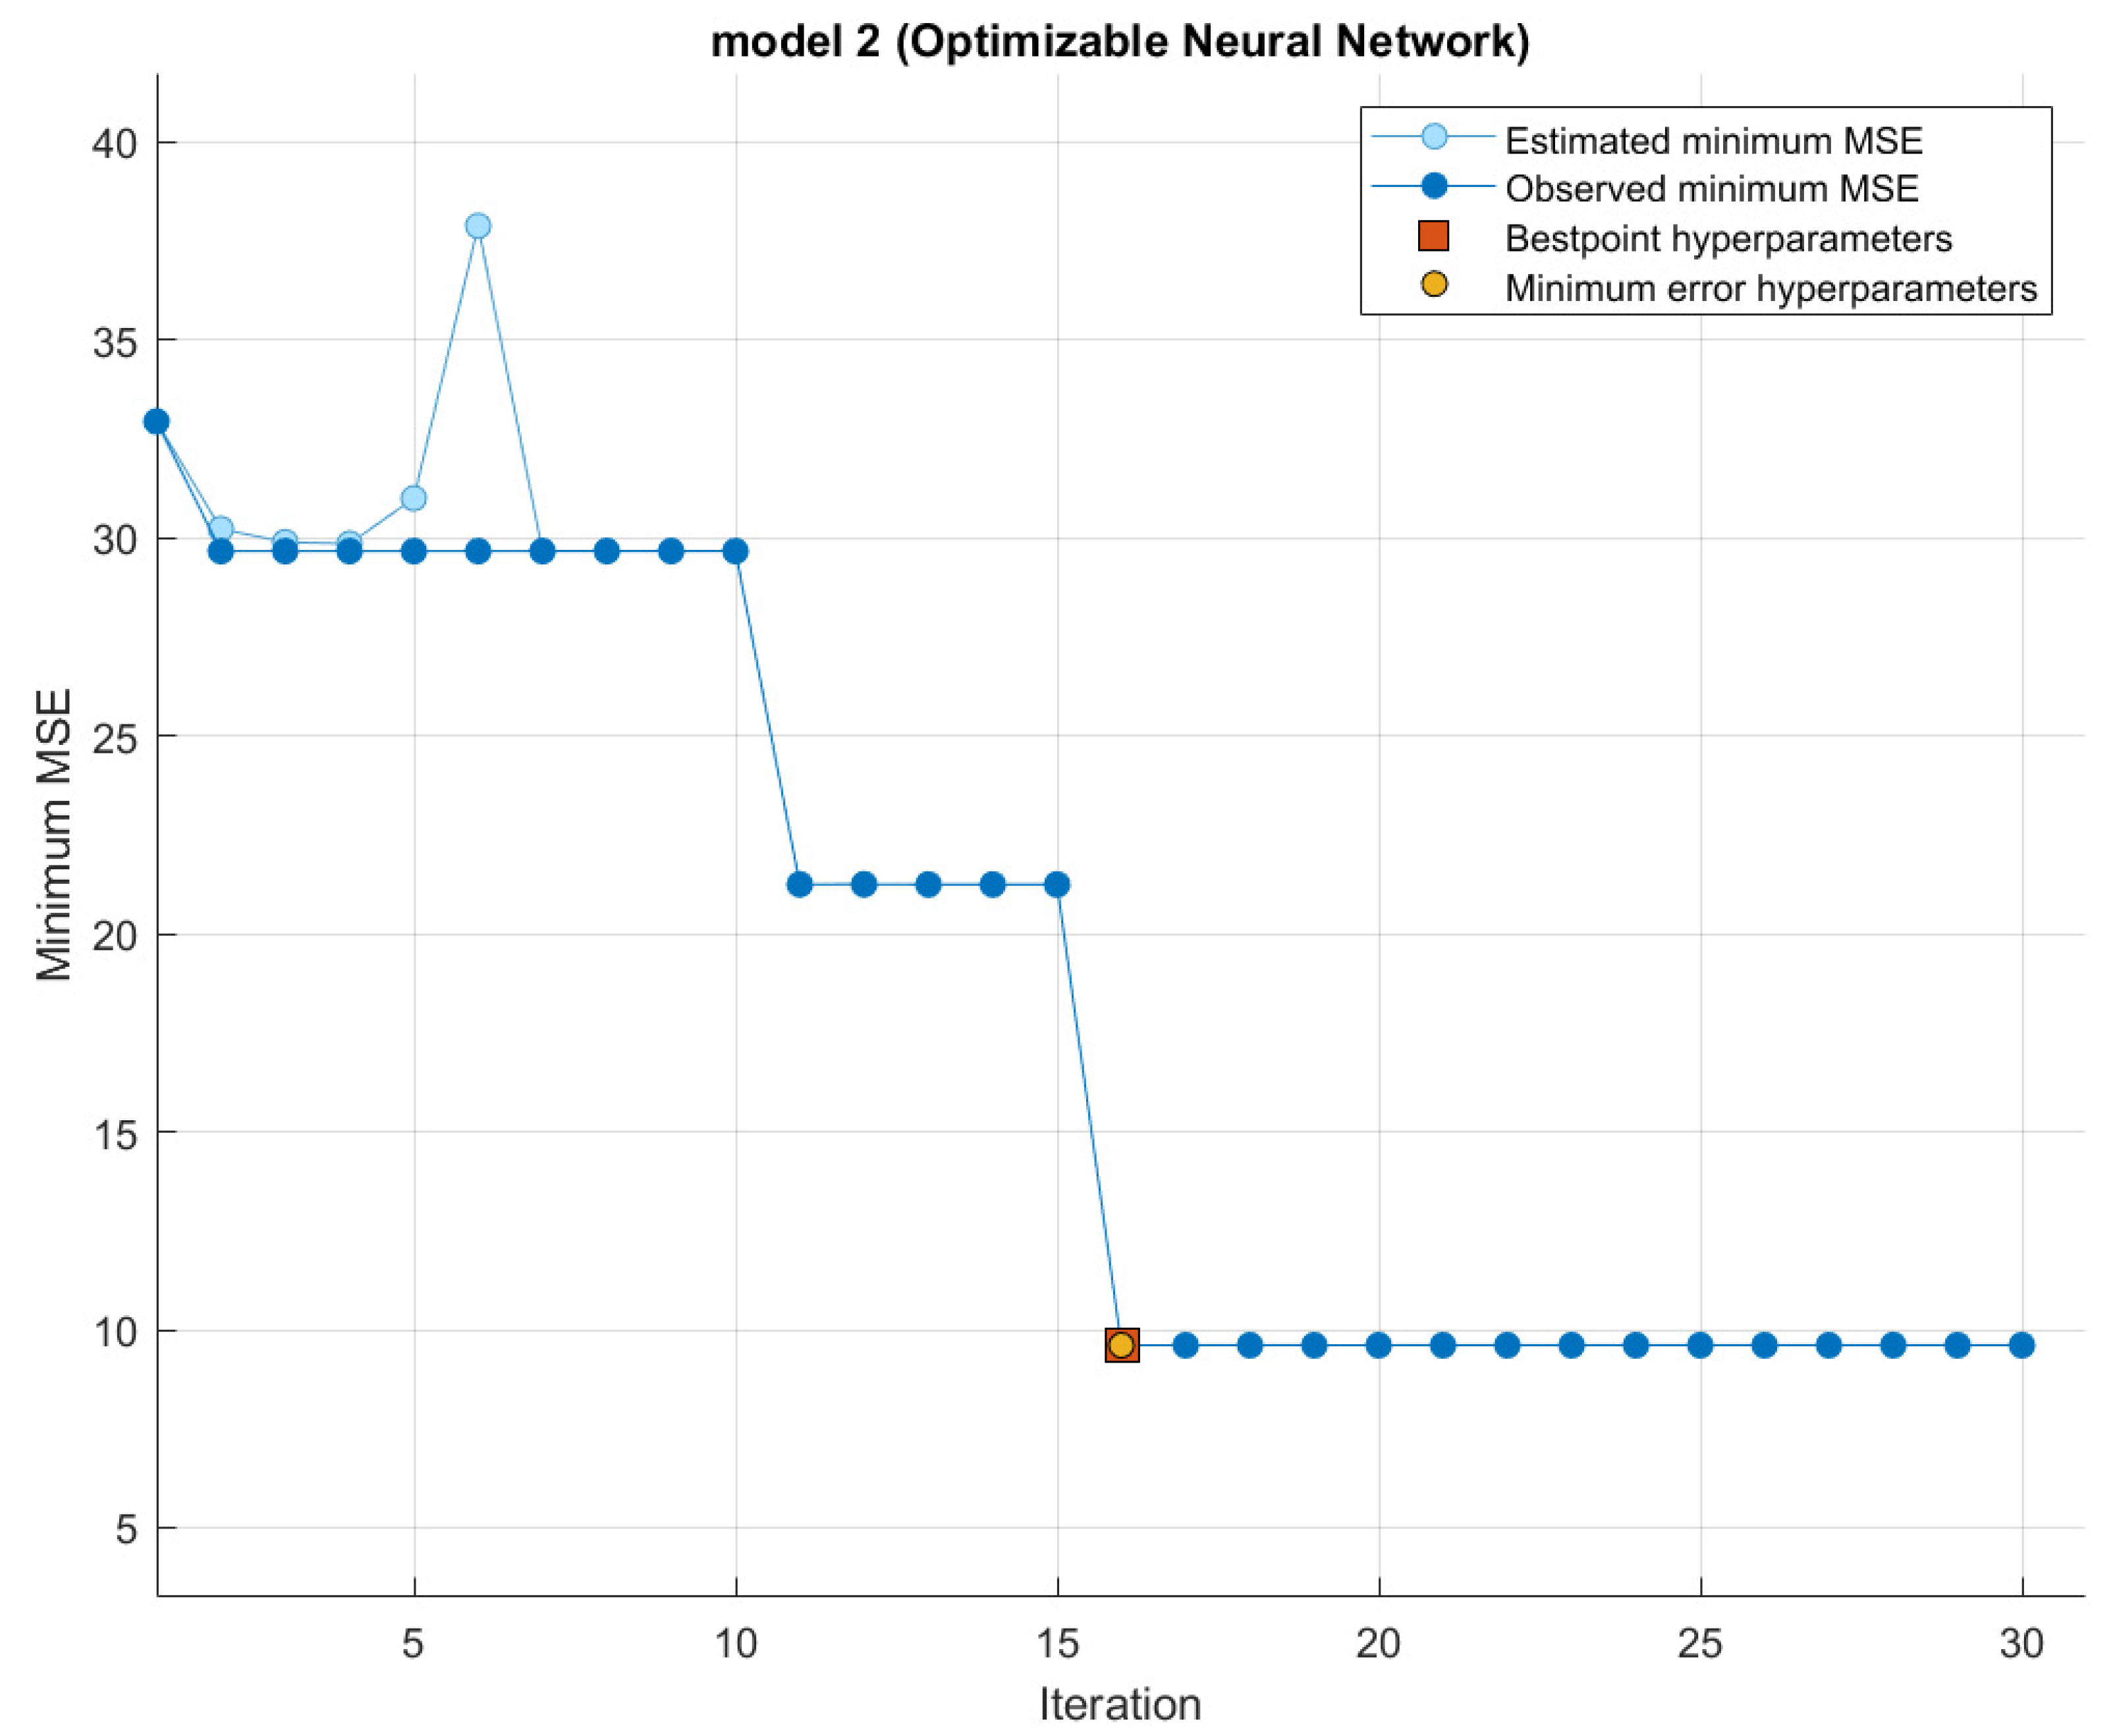
Figure 6.
Calculated ultimate strength versus that measured using (a) Fib; (b) Deifalla and Ghobarah; (c) ACI.
Figure 6.
Calculated ultimate strength versus that measured using (a) Fib; (b) Deifalla and Ghobarah; (c) ACI.

Table 1.
Statistical analysis of experimental database.
| b | d | E | β | Torsion Gain | |||
|---|---|---|---|---|---|---|---|
| (mm) | (mm) | (MPa) | (%) | (MPa) | (Degrees) | (kN m) | |
| Overall | |||||||
| Min. | 150 | 90 | 61 | 0.09 | 25 | 0 | 1.04 |
| Max. | 400 | 500 | 287 | 1.67 | 80.56 | 90 | 31.05 |
| Avg. | 288 | 155 | 178 | 0.42 | 37.48 | 85 | 8 |
| SD | 74.6 | 48.6 | 80 | 0.39 | 15.70 | 15 | 6 |
| C.O.V. | 26% | 31% | 45% | 92% | 42% | 18% | 85% |
Table 2.
Profile of previous experimental results.
| Training or Testing | Study | No. of Beams | Shape | < 40 | ≥ 40 | h ≤ 400 mm | GFRP | CFRP | Full | U-Jacket | Side | Top or Bottom | Strips | Continuous | β | |||||
|---|---|---|---|---|---|---|---|---|---|---|---|---|---|---|---|---|---|---|---|---|
| Rectangle | T-Shaped | L-Shaped | Hollow | 0 | 45 | 90 | ||||||||||||||
| Data set used for training | [37] | 9 | 9 | - | - | - | 9 | - | 9 | 9 | 7 | - | 2 | 1 | 7 | 3 | - | 7 | ||
| [38] | 4 | 4 | - | - | - | 4 | - | 4 | 4 | 4 | - | - | - | - | 4 | - | - | 4 | ||
| [39] | 8 | 8 | - | - | - | 8 | - | 8 | 2 | 6 | 8 | - | 1 | - | 5 | 2 | - | - | 6 | |
| [40] | 7 | 7 | - | - | - | 7 | - | 7 | 7 | - | 4 | 3 | - | - | 4 | 3 | 5 | - | 2 | |
| [41] | 7 | 7 | - | - | - | 7 | - | 7 | - | 7 | 5 | 2 | - | - | 5 | 2 | 4 | - | 5 | |
| [42] | 1 | 1 | - | - | - | - | - | 1 | - | 1 | 1 | - | - | - | - | 1 | - | - | ||
| [43] | 4 | - | - | 4 | - | 4 | - | 4 | - | - | - | 4 | - | - | - | 4 | 2 | 1 | 3 | |
| [44] | 6 | 6 | - | - | - | 6 | - | 6 | 3 | 3 | 2 | - | 4 | - | 6 | 2 | 5 | |||
| [45] | 6 | 6 | - | - | - | 6 | - | 6 | 6 | 6 | - | - | - | 3 | 3 | - | - | 6 | ||
| [46] | 2 | 2 | - | - | - | 2 | 2 | 2 | 2 | - | - | - | 2 | - | - | - | 2 | |||
| [23,27,28,29] | 4 | - | 4 | - | - | 4 | - | 4 | - | - | 2 | 2 | - | - | - | 4 | - | 4 | - | |
| [46] | 4 | 1 | - | - | 3 | 4 | - | 4 | - | 4 | 4 | - | - | 4 | - | - | - | - | ||
| [47] | 10 | 10 | - | - | 10 | - | 10 | 5 | 5 | 6 | 4 | - | - | 4 | 6 | - | - | 10 | ||
| [48] | 16 | 10 | 3 | 3 | 16 | - | 16 | 14 | 2 | 8 | 8 | - | - | 14 | 2 | 1 | 2 | 14 | ||
| [49] | 8 | 6 | 2 | - | - | 8 | - | 8 | - | 8 | 6 | 2 | - | - | 3 | 5 | - | - | 8 | |
| [50] | 10 | 10 | - | - | - | 10 | 10 | - | 10 | 8 | 2 | - | - | 2 | 8 | - | - | 10 | ||
| [51] | 2 | 2 | - | - | - | 2 | 2 | 2 | - | - | 2 | - | - | 2 | - | - | 2 | |||
| [52] | 7 | 7 | - | - | - | - | 7 | 7 | - | 7 | 6 | 1 | - | - | 2 | 5 | - | - | 7 | |
| [53] | 8 | 8 | - | - | - | 8 | - | 8 | - | 8 | 6 | 2 | - | - | 3 | 5 | - | - | 8 | |
| [54] | 4 | - | 4 | - | - | 3 | - | 3 | 4 | - | 4 | - | - | 4 | - | - | 1 | 3 | ||
| Dataset for testing | [55] | 8 | 8 | - | - | 8 | - | 8 | 8 | 8 | - | - | - | 6 | 2 | - | 2 | 6 | ||
| [22] | 8 | 2 | 2 | 4 | 8 | - | 8 | - | 8 | 3 | 5 | - | - | 8 | - | - | 3 | 5 | ||
| [56] | 7 | - | - | 7 | 7 | - | 7 | - | 7 | 2 | 5 | - | - | 7 | - | - | - | 7 | ||
| [57] | 1 | 1 | - | - | - | 1 | - | 1 | 1 | - | 1 | - | - | - | 1 | - | - | - | 1 | |
| [58] | 6 | 6 | - | - | - | 6 | - | 6 | 6 | - | 6 | - | - | - | 4 | 2 | 1 | 2 | 3 | |
| Number of tested beams | 157 | 121 | 15 | 18 | 3 | 136 | 19 | 156 | 52 | 97 | 105 | 46 | 7 | 1 | 96 | 58 | 18 | 17 | 124 | |
| Percentage (%) | 77 | 10 | 11 | 2 | 87 | 12 | 99 | 33 | 67 | 67 | 29 | 4 | 1 | 61 | 37 | 11 | 11 | 79 | ||
Table 3.
Parameters investigated by various researchers.
| Study | Anchors | Spacing | Preloading | Plies | Size Effect |
|---|---|---|---|---|---|
| [37] | |||||
| [38] | |||||
| [39] | |||||
| [40] | |||||
| [41] | |||||
| [42] | |||||
| [43] | |||||
| [44] | |||||
| [45] | |||||
| [46] | |||||
| [23,27,29] | |||||
| [46] | |||||
| [47] | |||||
| [48] | |||||
| [49] | |||||
| [50] | |||||
| [51] | |||||
| [52] | |||||
| [53] | |||||
| [54] | |||||
| [55] | |||||
| [22] | |||||
| [56] | |||||
| [57] | |||||
| [58] | |||||
| Number of studies | 7 | 9 | 4 | 12 | 2 |
| Percentage (%) | 28% | 36% | 16% | 48% | 8% |
Table 4.
Statistical analysis of training and validating set.
| b | d | E | β | Torsion Gain | |||
|---|---|---|---|---|---|---|---|
| mm | mm | MPa | (%) | MPa | Degrees | kN m | |
| Training set | |||||||
| Min. | 150 | 90 | 61 | 0.1 | 45 | 25 | 1.04 |
| Max. | 400 | 500 | 287 | 1.7 | 90 | 80.56 | 30.9 |
| Avg. | 297 | 160 | 182 | 0.5 | 87 | 40 | 8 |
| SD | 74 | 53 | 80 | 0.4 | 11 | 17 | 6 |
| C.O.V. | 25% | 33% | 44% | 91% | 13% | 42% | 76% |
| Validation set | |||||||
| Min. | 150 | 90 | 61.58 | 0.09 | 0 | 25 | 1.67 |
| Max. | 400 | 150 | 232 | 0.86 | 90 | 32 | 31.05 |
| Avg. | 258 | 139 | 165 | 0.29 | 79 | 28 | 8 |
| SD | 69 | 17 | 80 | 0.24 | 24 | 3 | 8 |
| C.O.V. | 27% | 12% | 49% | 82% | 30% | 11% | 111% |
Table 5.
Results comparison between ML methods.
| Models | R-Squared | RMSE | MAE | Training Time (s) |
|---|---|---|---|---|
| Ensemble Trees | ||||
| Boosted | 0.71 | 3.4274 | 2.1631 | 2.7569 |
| Bagged | 0.47 | 4.6322 | 3.3205 | 3.1841 |
| Gaussian Process Regression | ||||
| Squared Exponential | 0.93 | 1.6854 | 1.1702 | 5.2342 |
| Marten 5/2 | 0.93 | 1.6778 | 2.8149 | 1.175 |
| Exponential | 0.93 | 1.7447 | 1.1914 | 1.9939 |
| Rational Quadratic | 0.93 | 1.6863 | 1.1523 | 4.8316 |
| Neural Network | ||||
| Narrow | 0.56 | 1.6854 | 2.8724 | 3.1006 |
| Medium | 0.92 | 1.6778 | 1.1643 | 1.175 |
| Wide | 0.93 | 1.6634 | 0.98591 | 7.7472 |
| Bi-layered | 0.71 | 3.4655 | 2.2849 | 2.7611 |
| Tri-layered | 0.92 | 1.8611 | 3.4636 | 3.7419 |
Table 6.
Comparing ratio of measured and predicted torsion strength from various models.
| Models | FIB (2001) | Deifalla and Ghobarah (2005) | ACI (2008) | Wide Neural NetWork Model |
|---|---|---|---|---|
| Average | 8.50 | 2.31 | 1.22 | 1.11 |
| Standard Deviation | 9.48 | 3.58 | 1.53 | 0.40 |
| Maximum | 42.29 | 22.62 | 8.25 | 2.32 |
| Minimum | 0.89 | 0.21 | 0.07 | 0.23 |
| Lower 95% | 6.47 | 1.55 | 0.89 | 1.02 |
| Upper 95% | 10.52 | 3.08 | 1.54 | 1.20 |
Publisher’s Note: MDPI stays neutral with regard to jurisdictional claims in published maps and institutional affiliations. |
© 2022 by the authors. Licensee MDPI, Basel, Switzerland. This article is an open access article distributed under the terms and conditions of the Creative Commons Attribution (CC BY) license (https://creativecommons.org/licenses/by/4.0/).
Share and Cite
MDPI and ACS Style
Deifalla, A.; Salem, N.M. A Machine Learning Model for Torsion Strength of Externally Bonded FRP-Reinforced Concrete Beams. Polymers 2022, 14, 1824. https://doi.org/10.3390/polym14091824
AMA Style
Deifalla A, Salem NM. A Machine Learning Model for Torsion Strength of Externally Bonded FRP-Reinforced Concrete Beams. Polymers. 2022; 14(9):1824. https://doi.org/10.3390/polym14091824
Chicago/Turabian StyleDeifalla, Ahmed, and Nermin M. Salem. 2022. "A Machine Learning Model for Torsion Strength of Externally Bonded FRP-Reinforced Concrete Beams" Polymers 14, no. 9: 1824. https://doi.org/10.3390/polym14091824
Note that from the first issue of 2016, this journal uses article numbers instead of page numbers. See further details here.