
Optimizing the Process of Spot Welding of Polycarbonate-Matrix-Based Unidirectional (UD) Thermoplastic Composite Tapes

 , ,
, ,
Abstract
:1. Introduction
2. Literature Review: Techniques for Joining Thermoplastic Composites
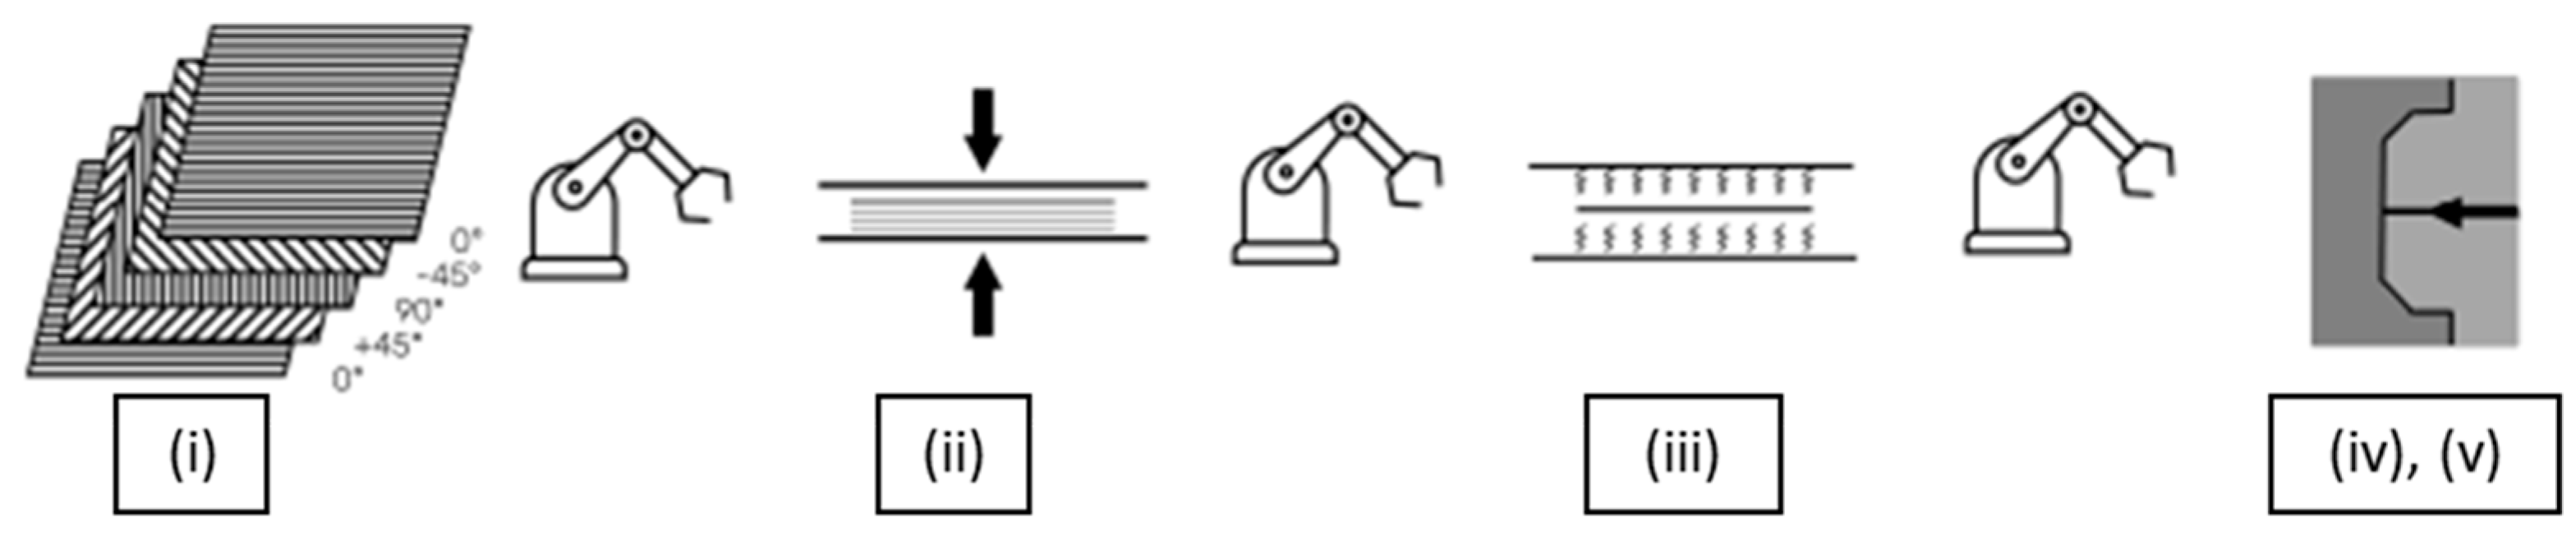
3. Experimental Procedures
3.1. Material
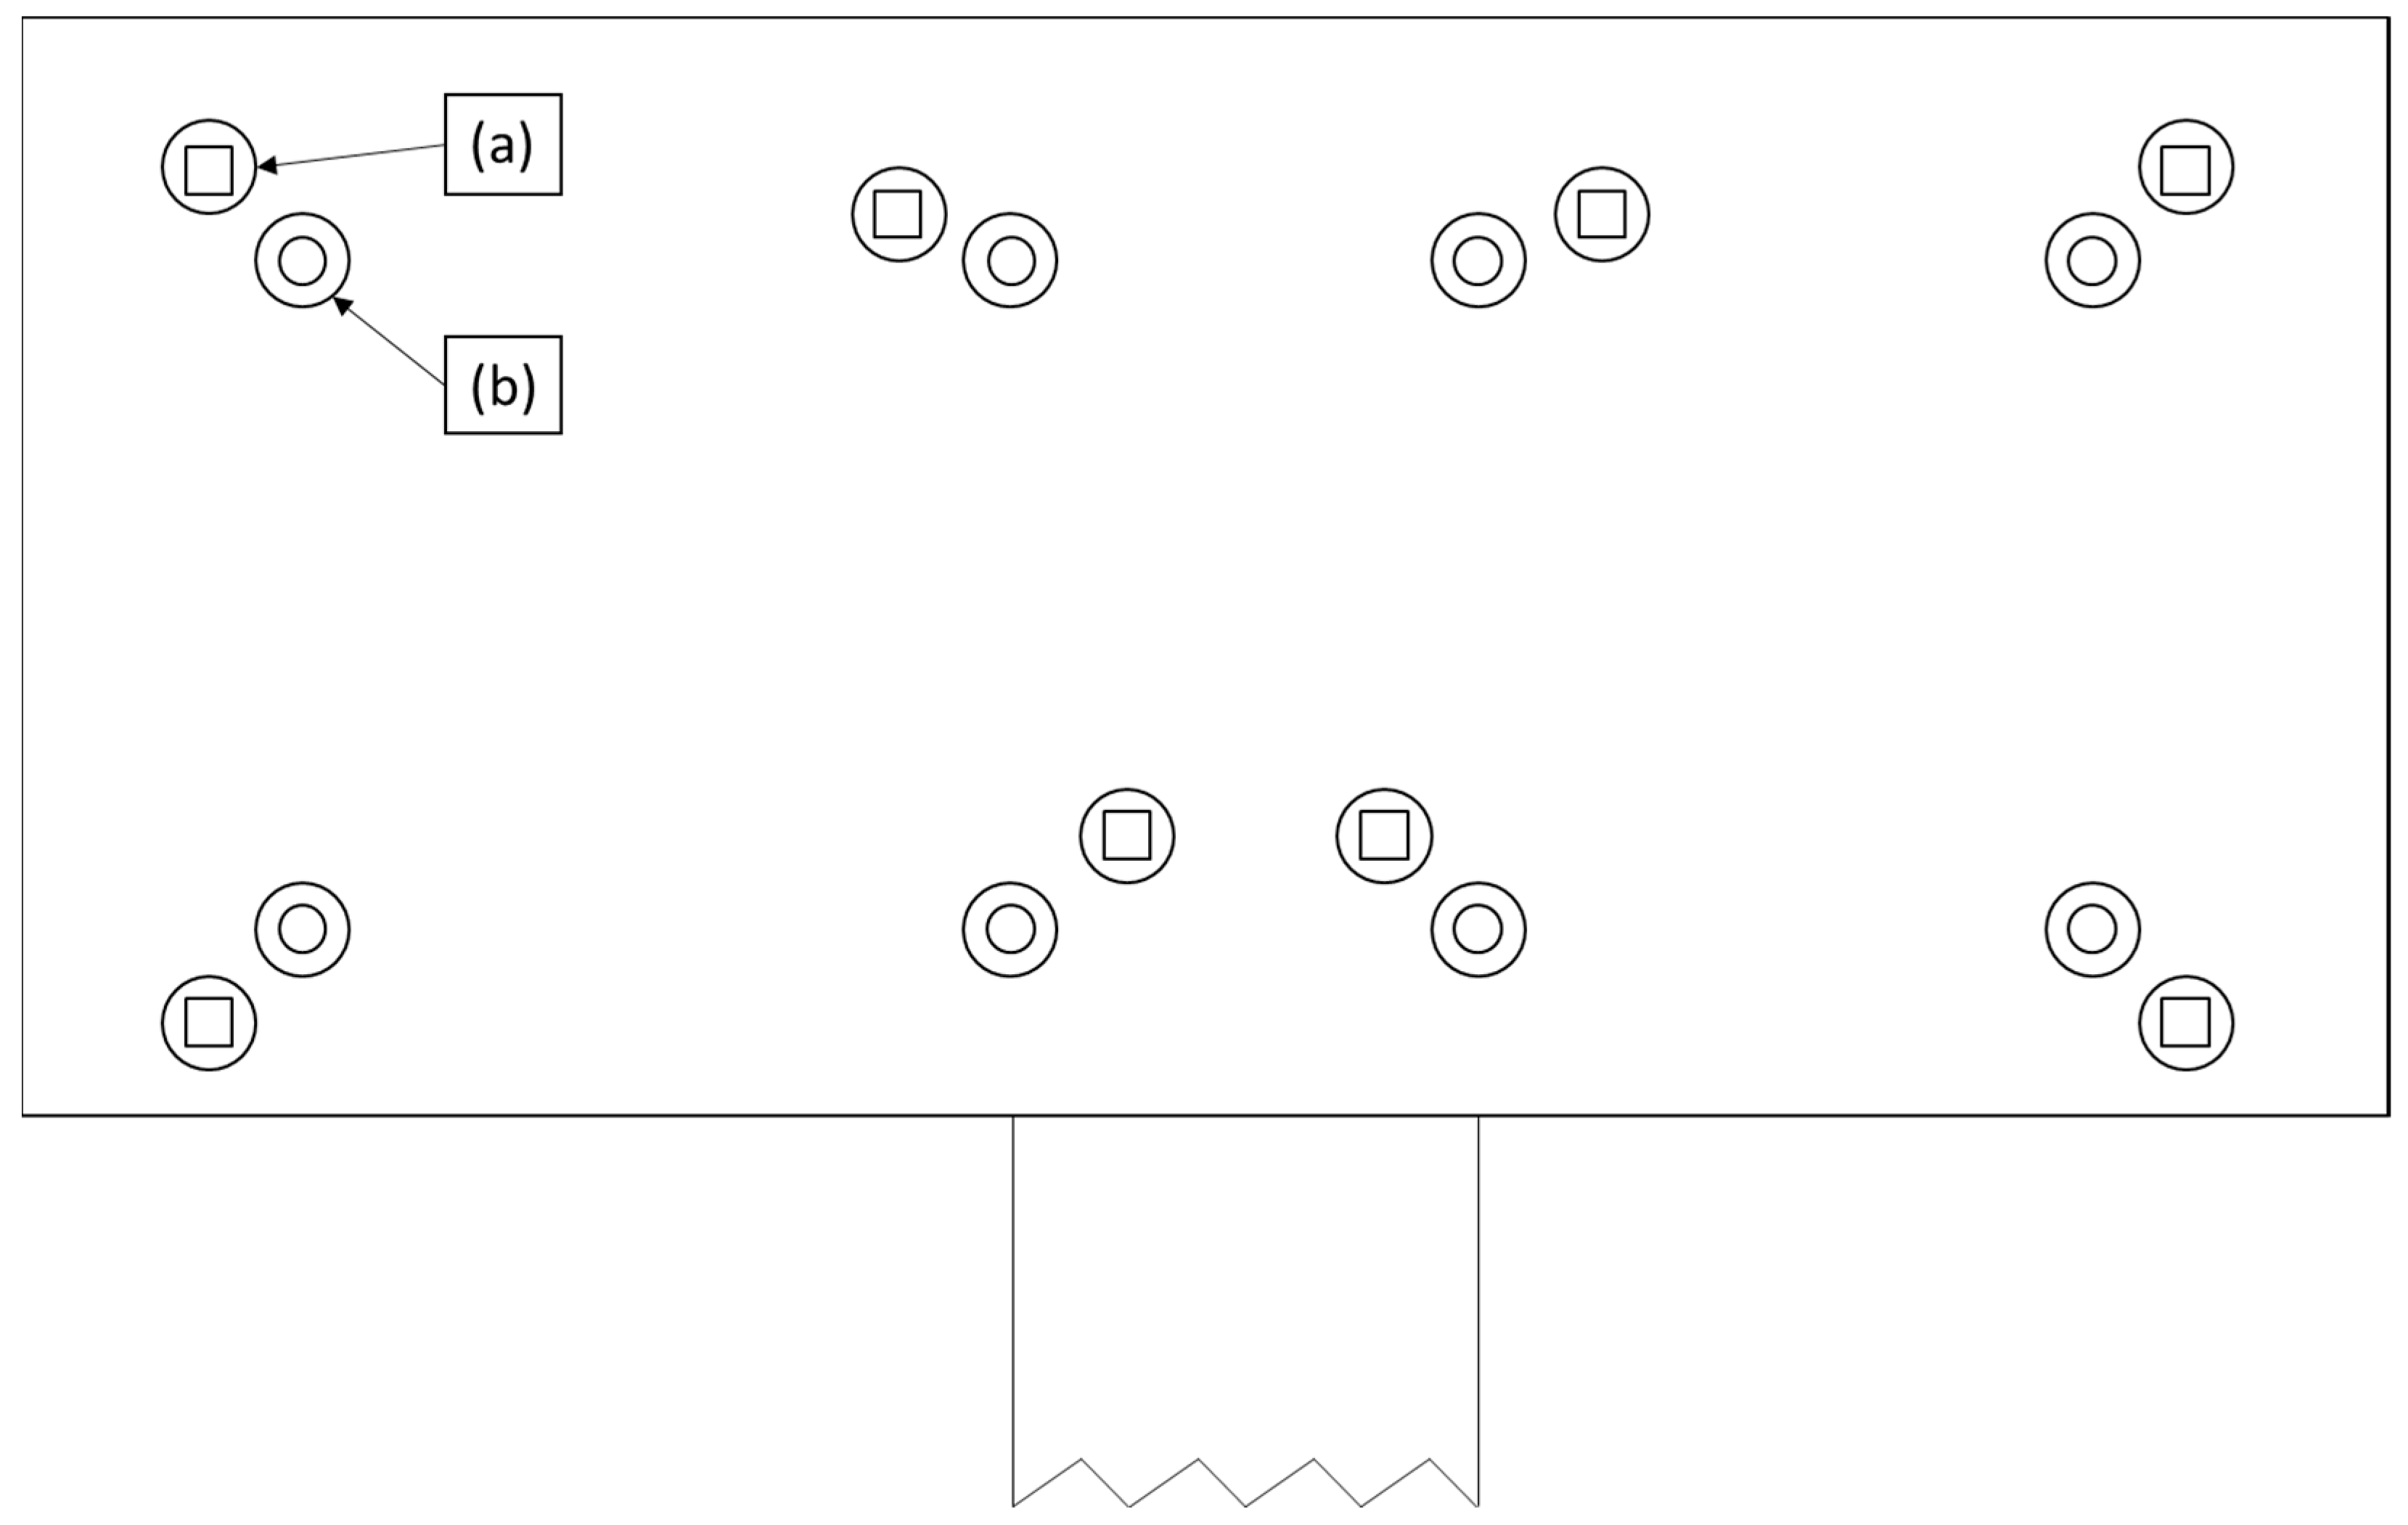
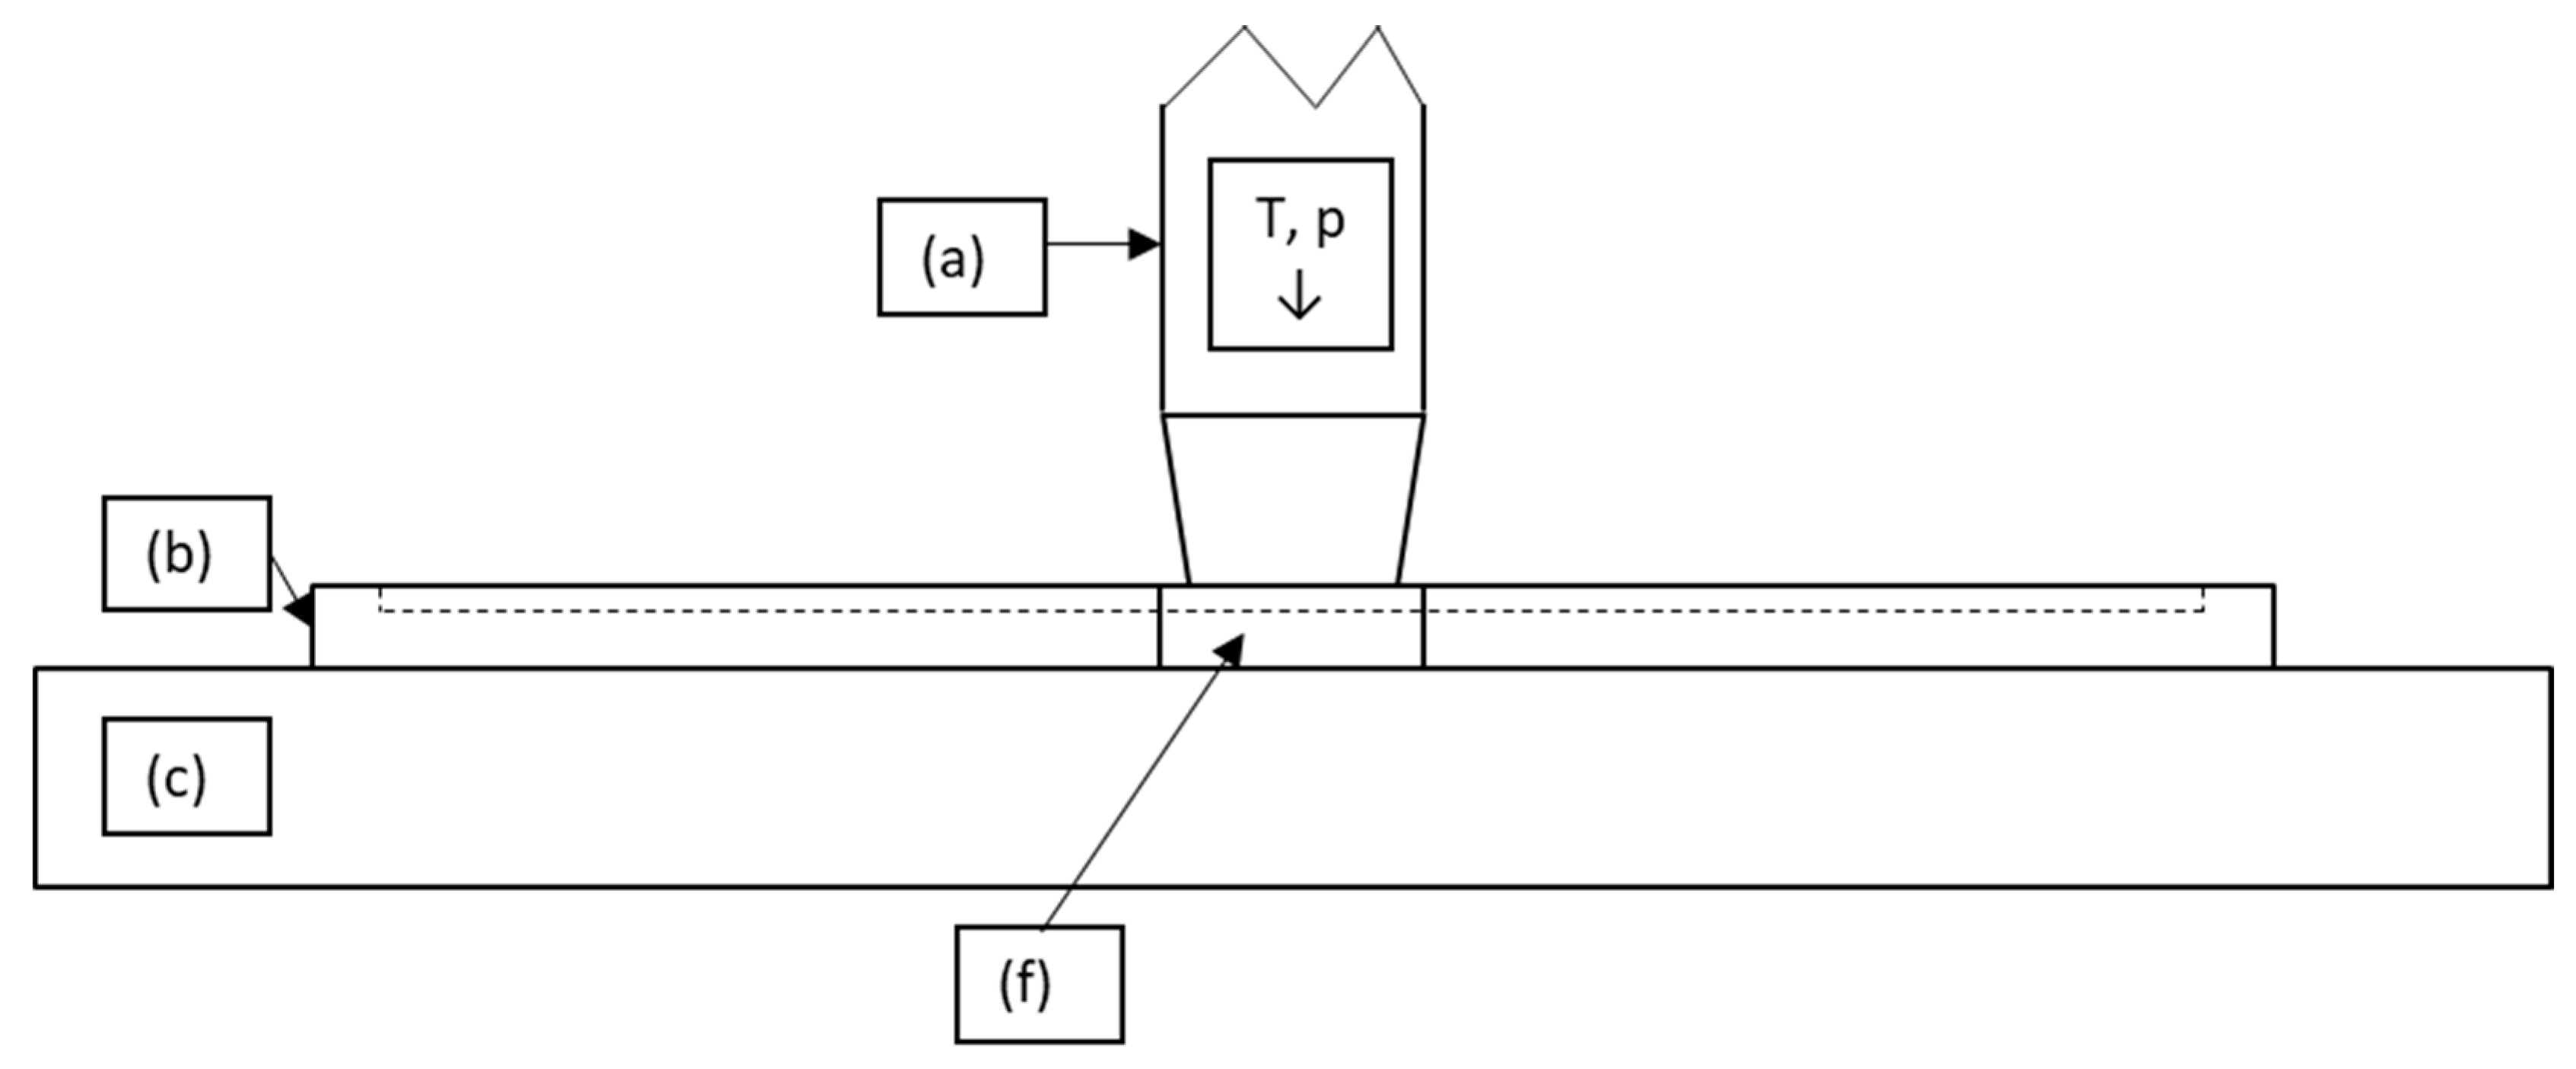
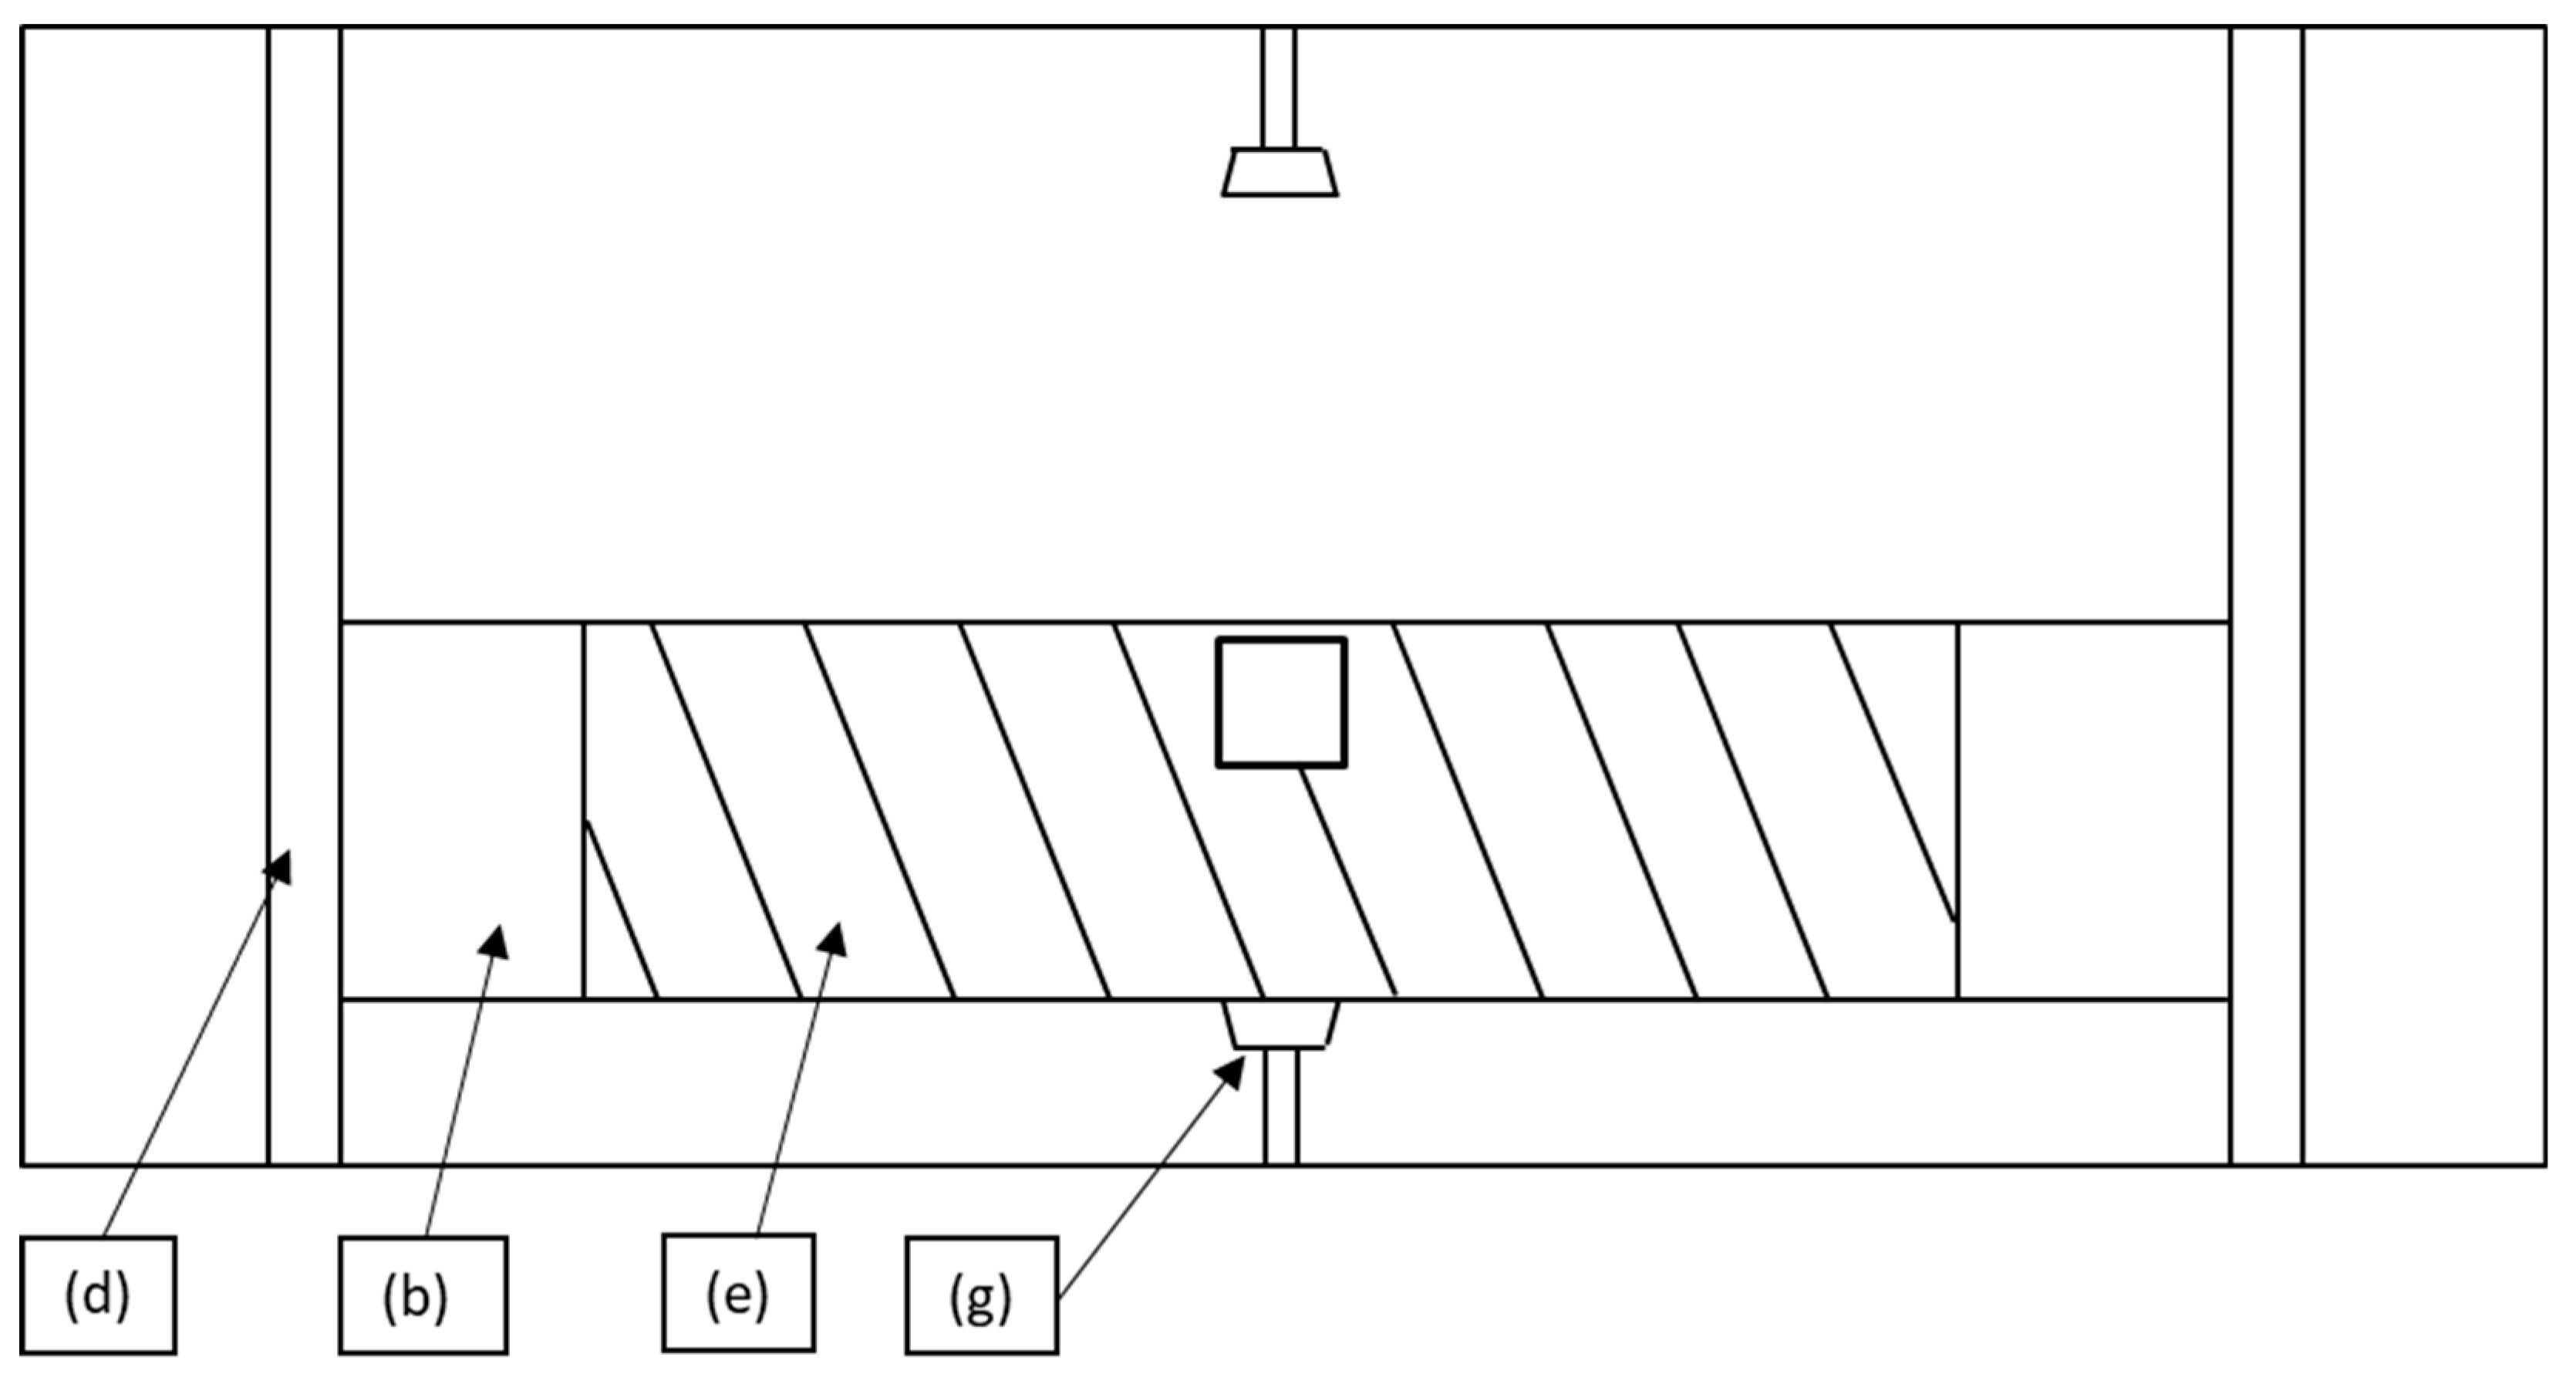
3.2. Experimental Set-Up
3.3. Experimental Design
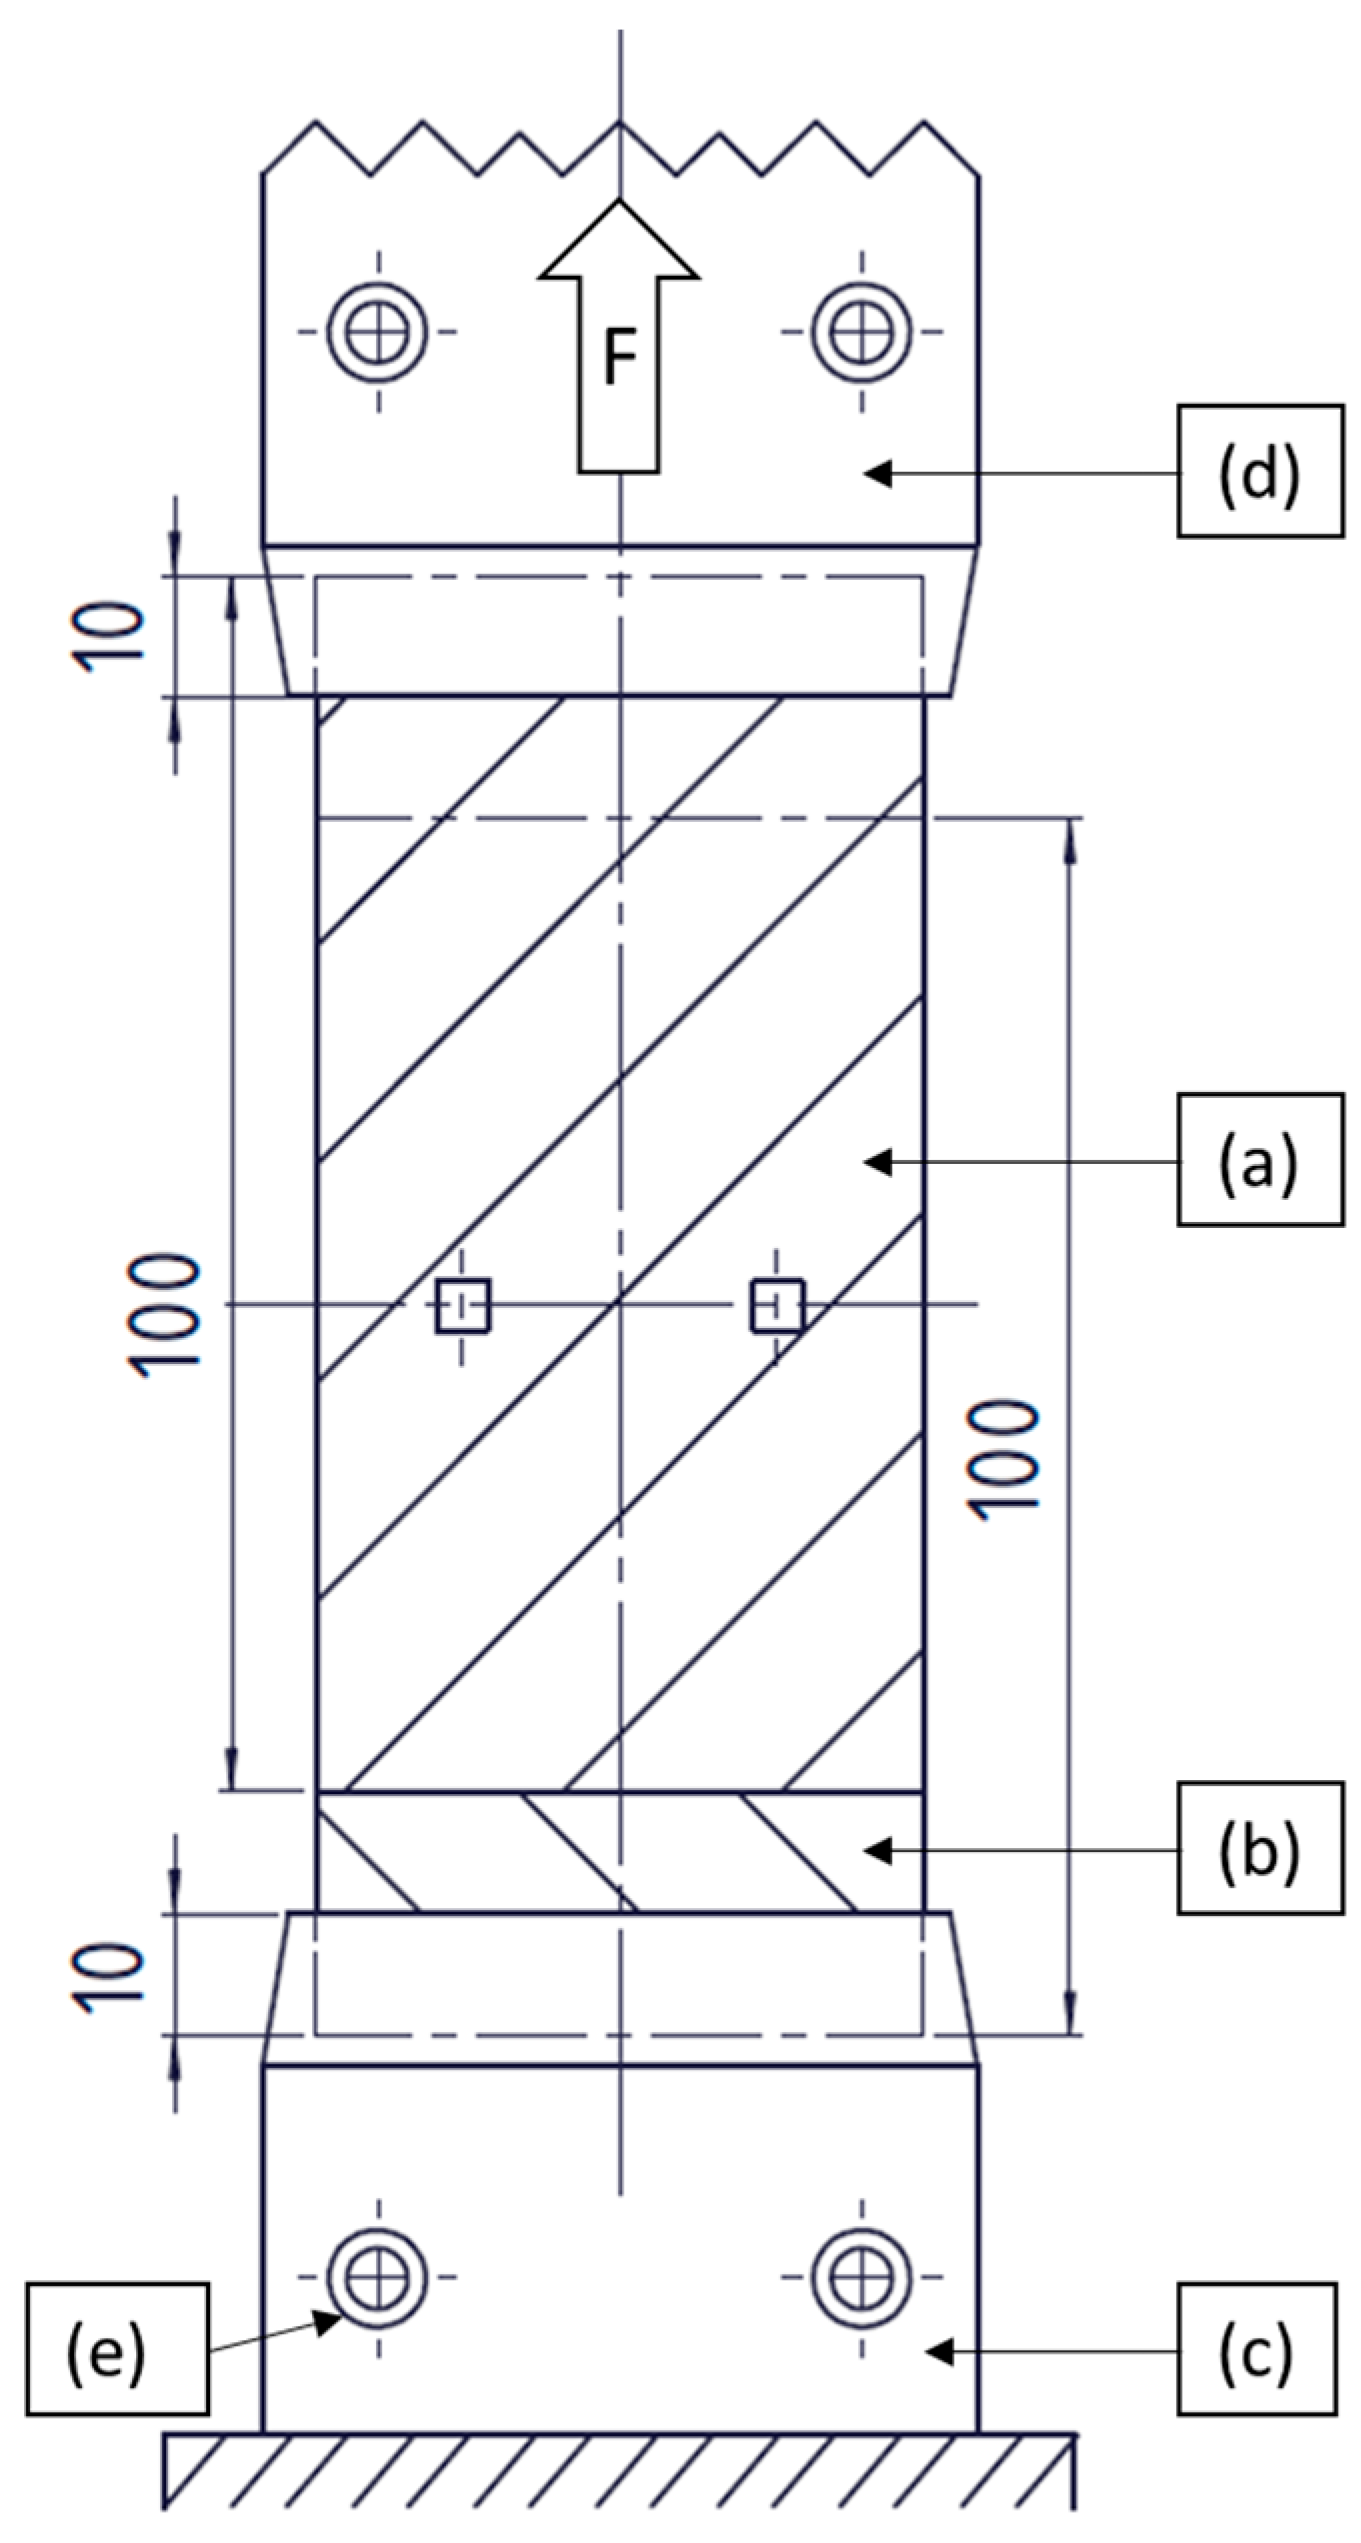
3.4. Mechanical Test Set-Up
3.5. Degradation Measurements
4. Results and Discussion
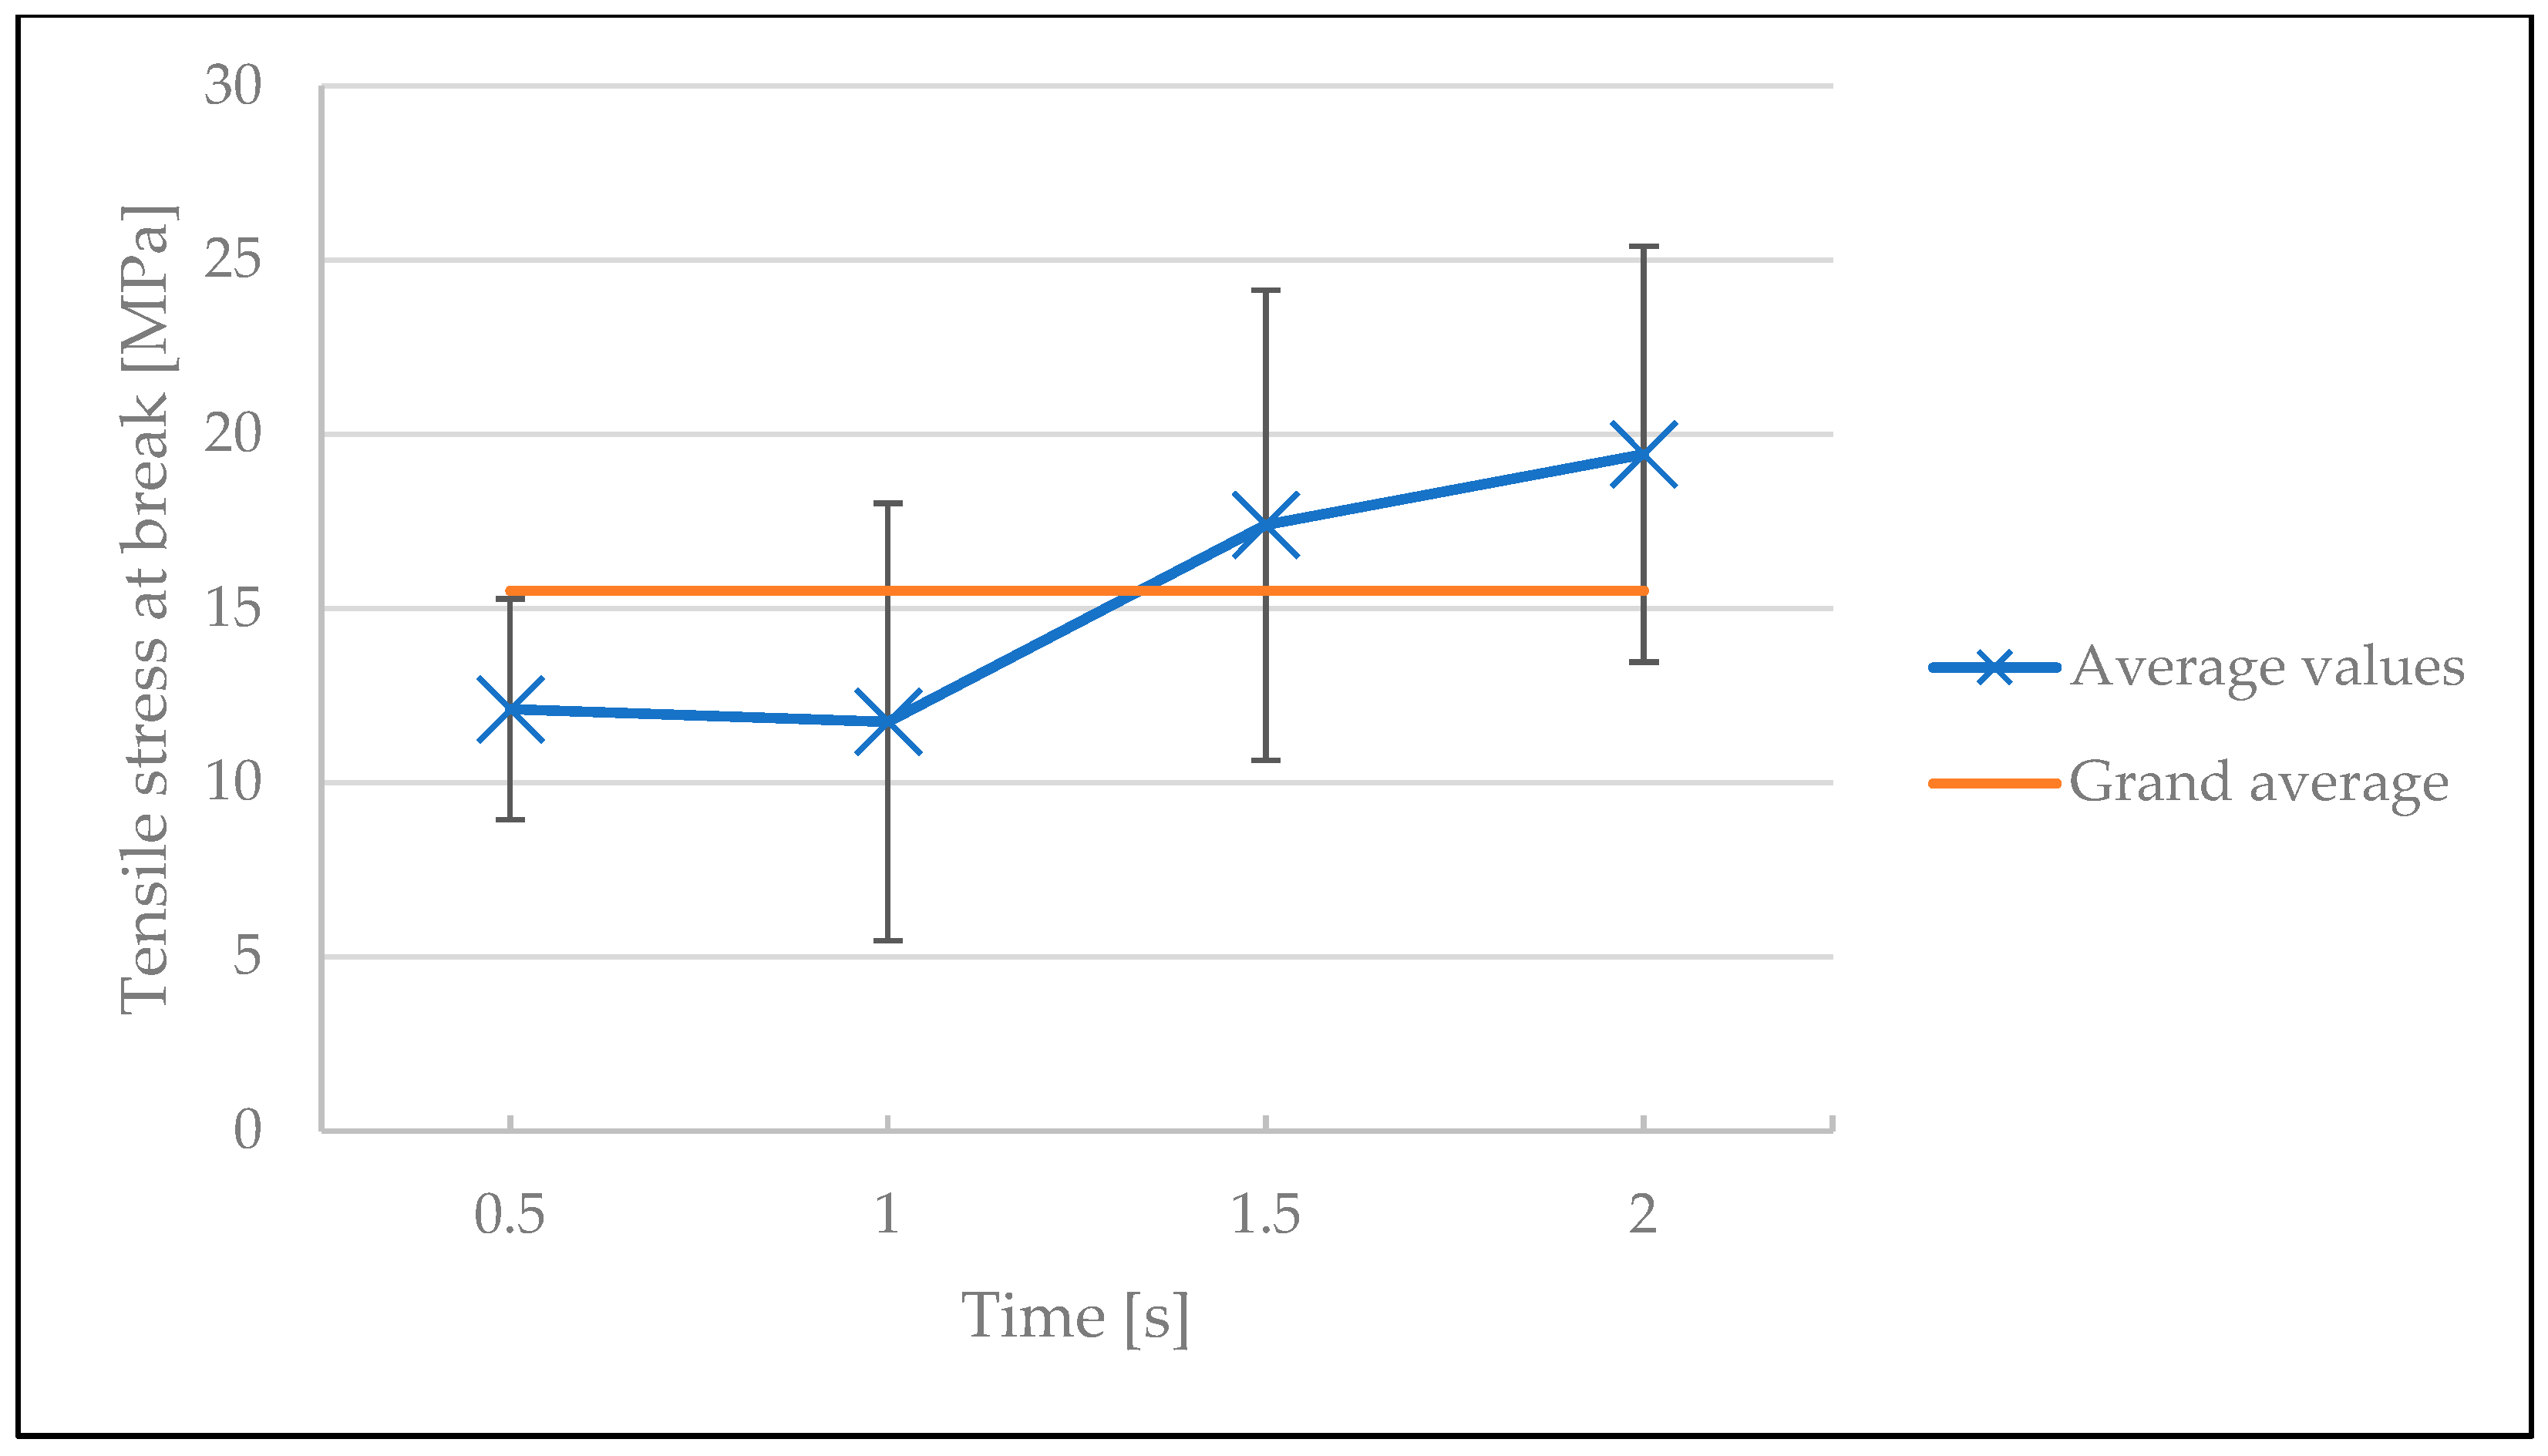
4.1. Screening Test
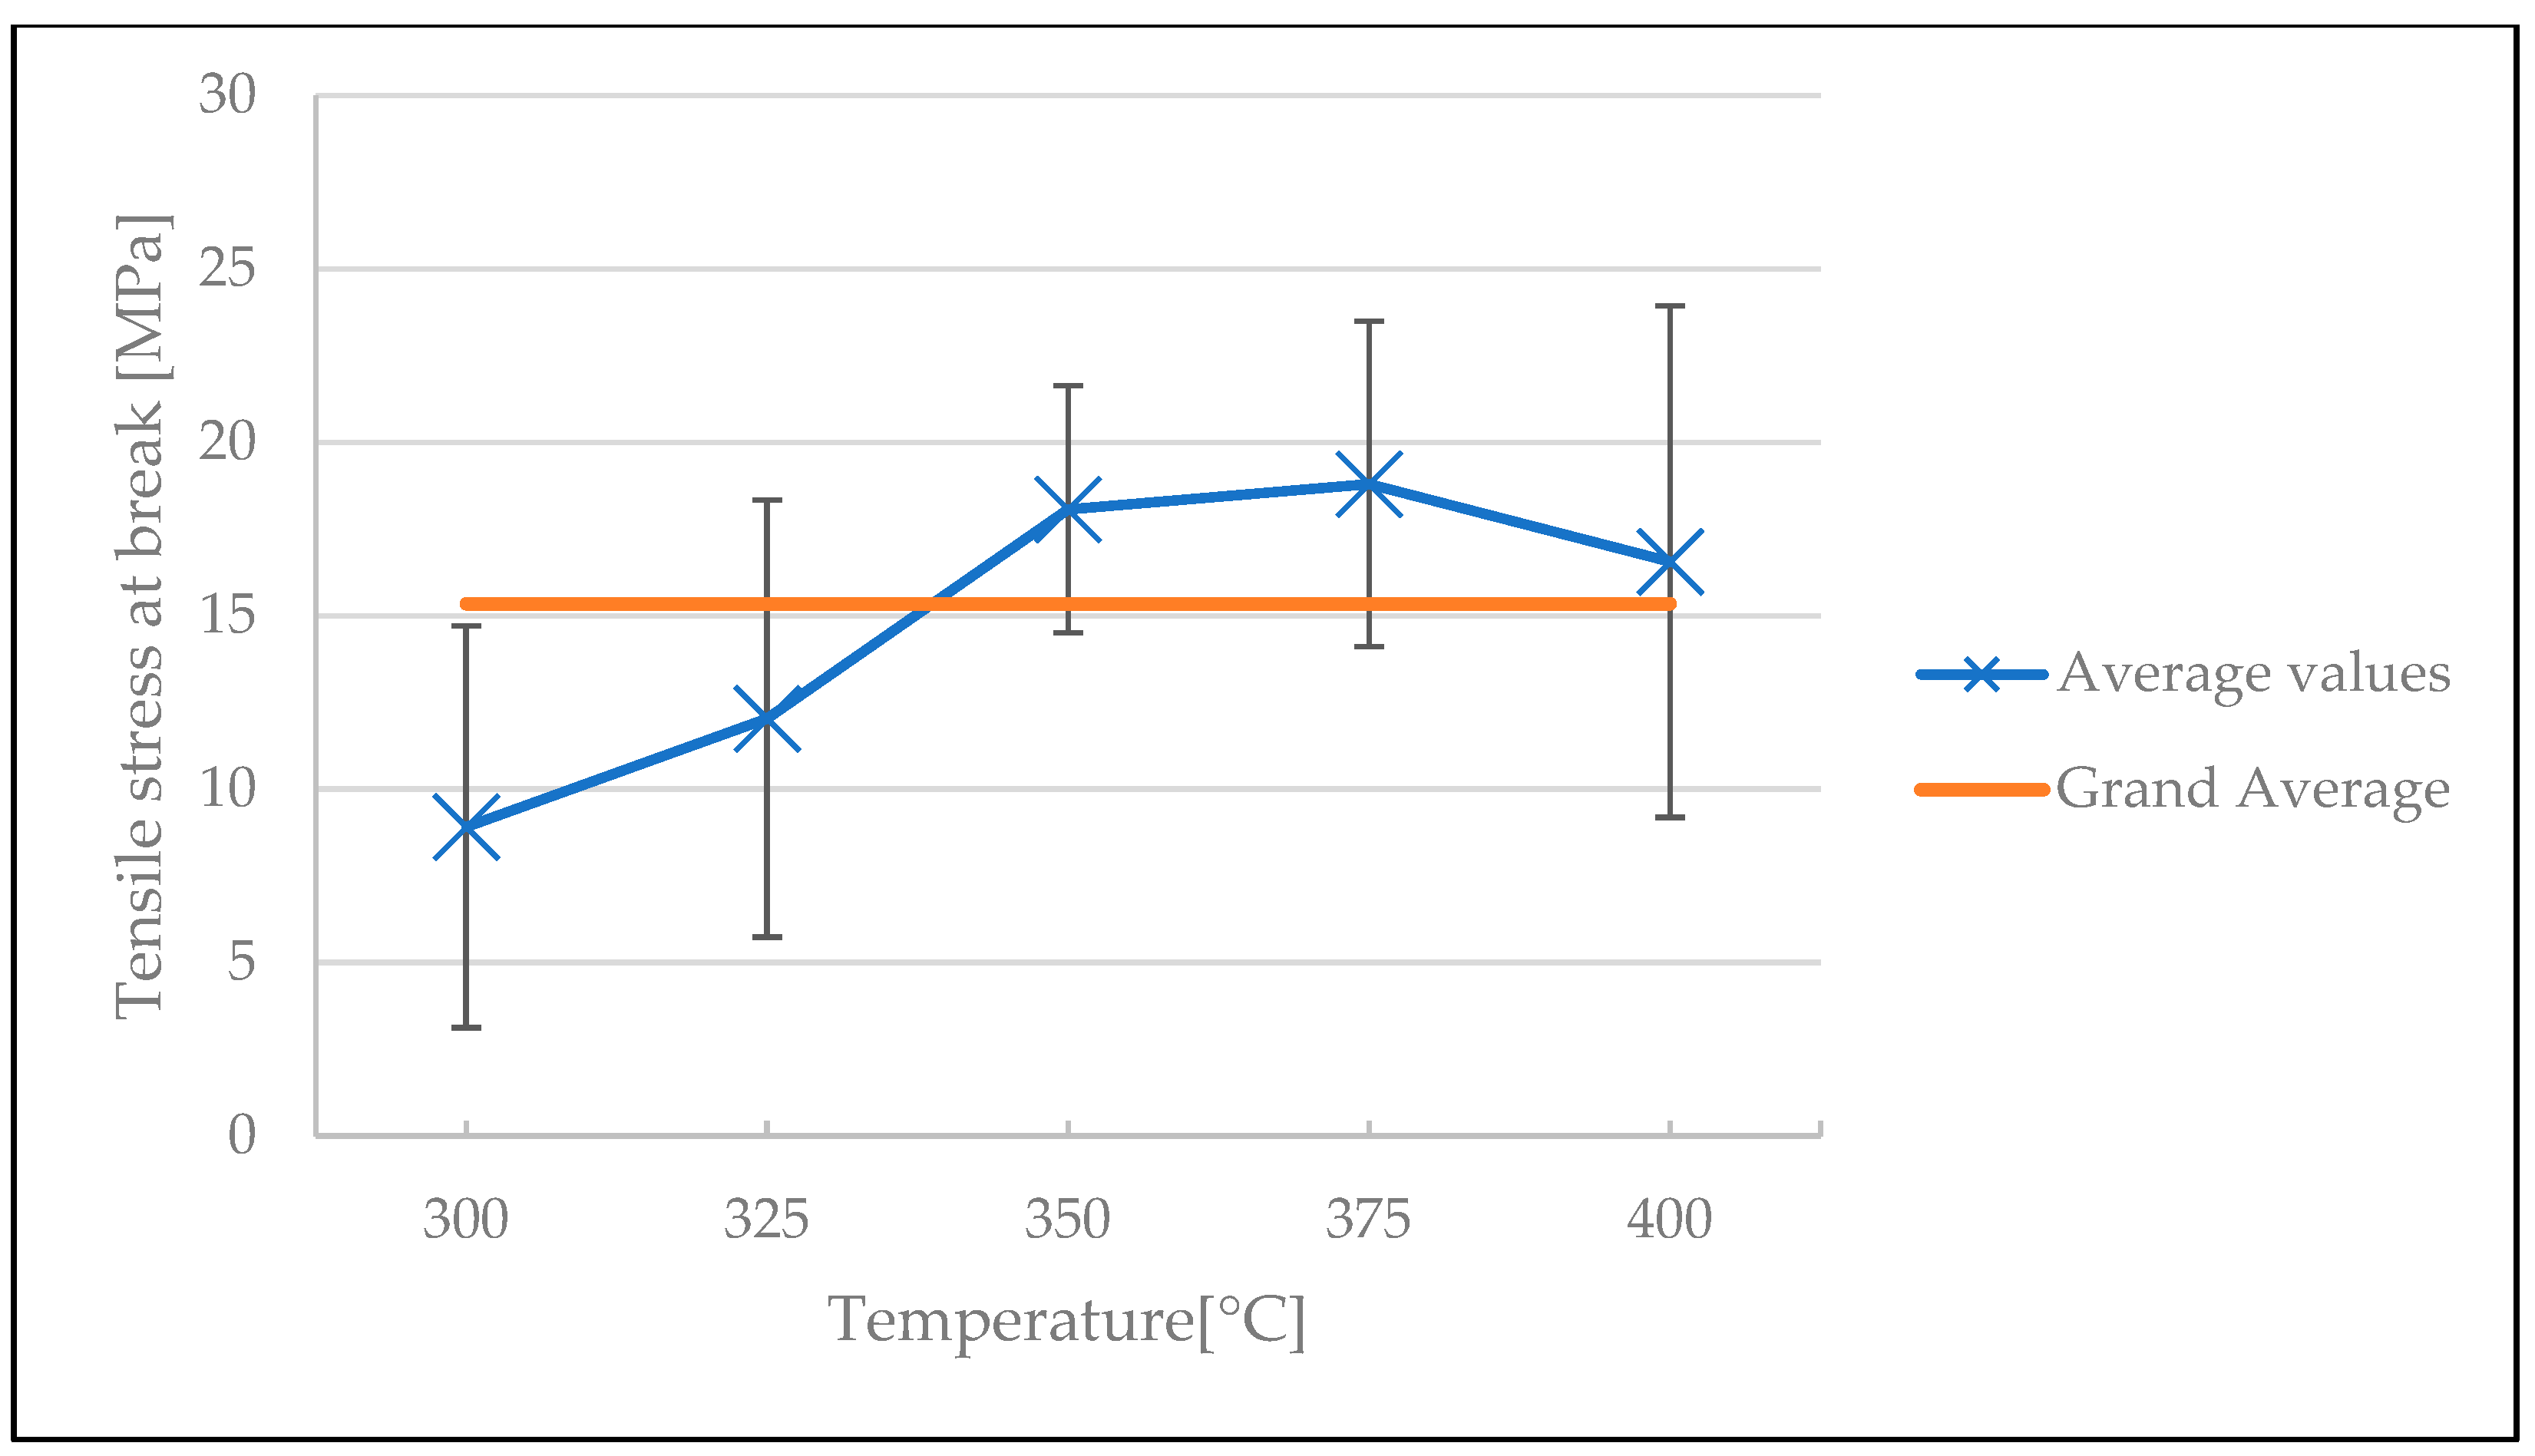
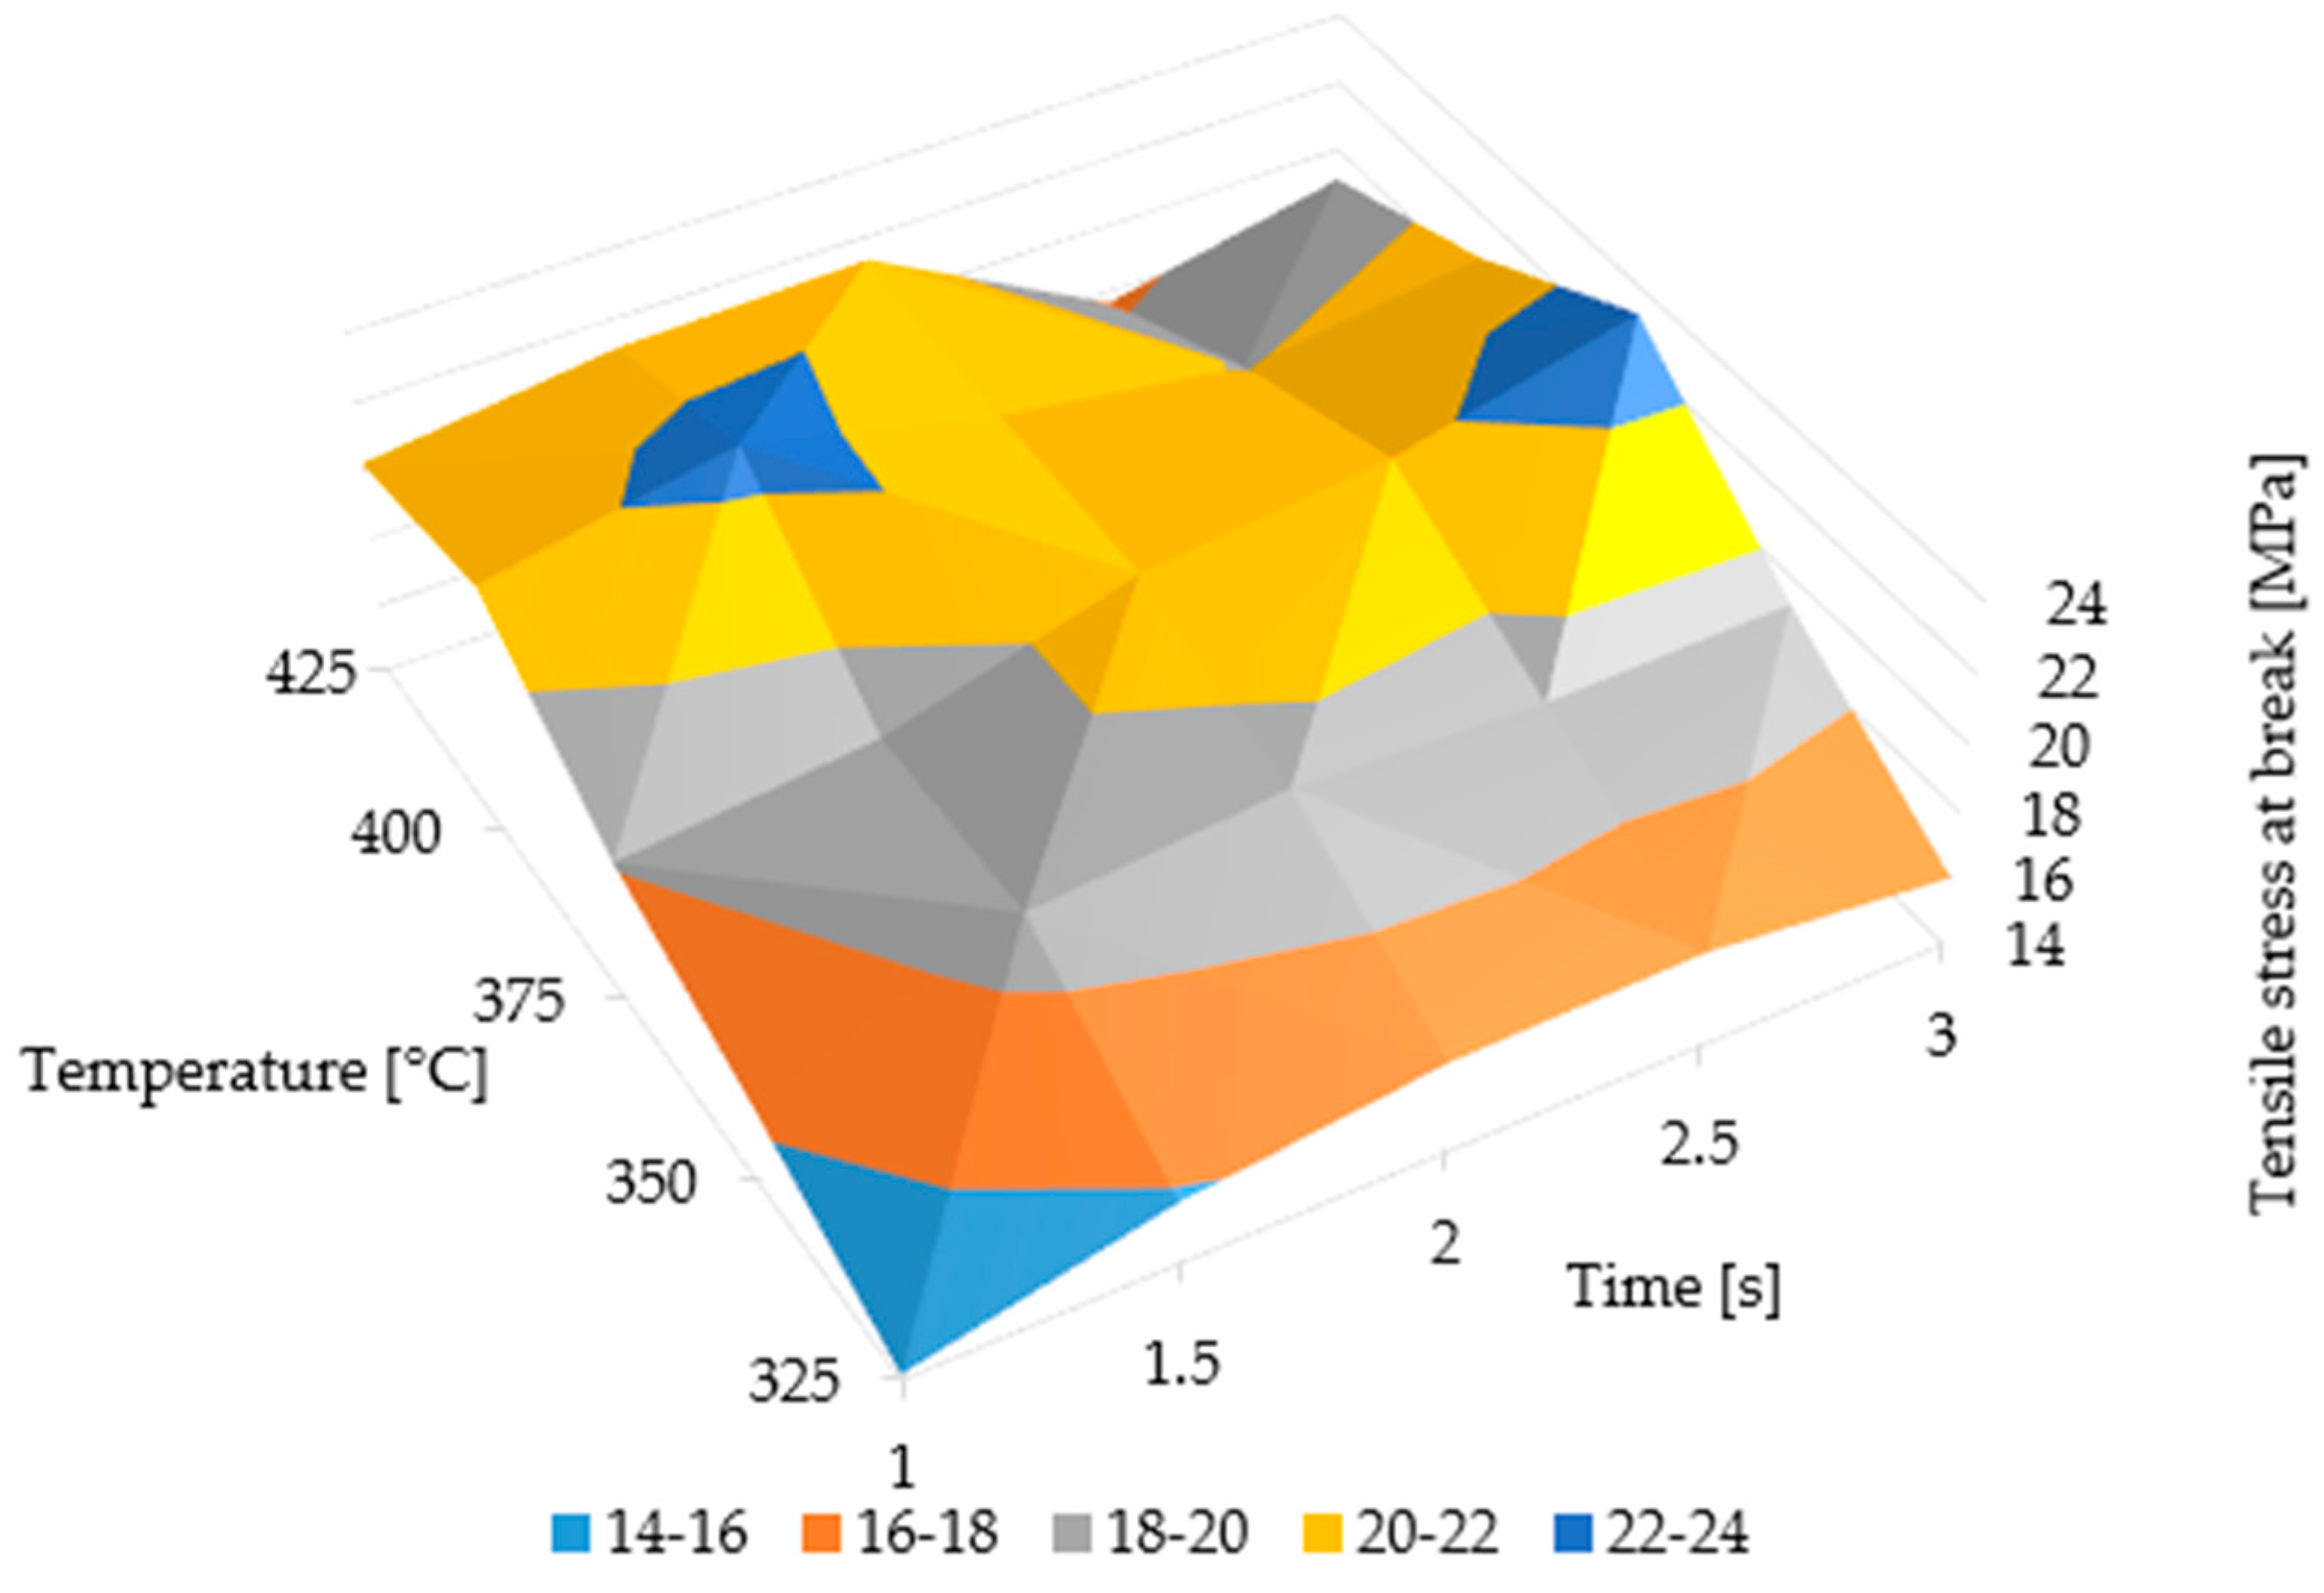
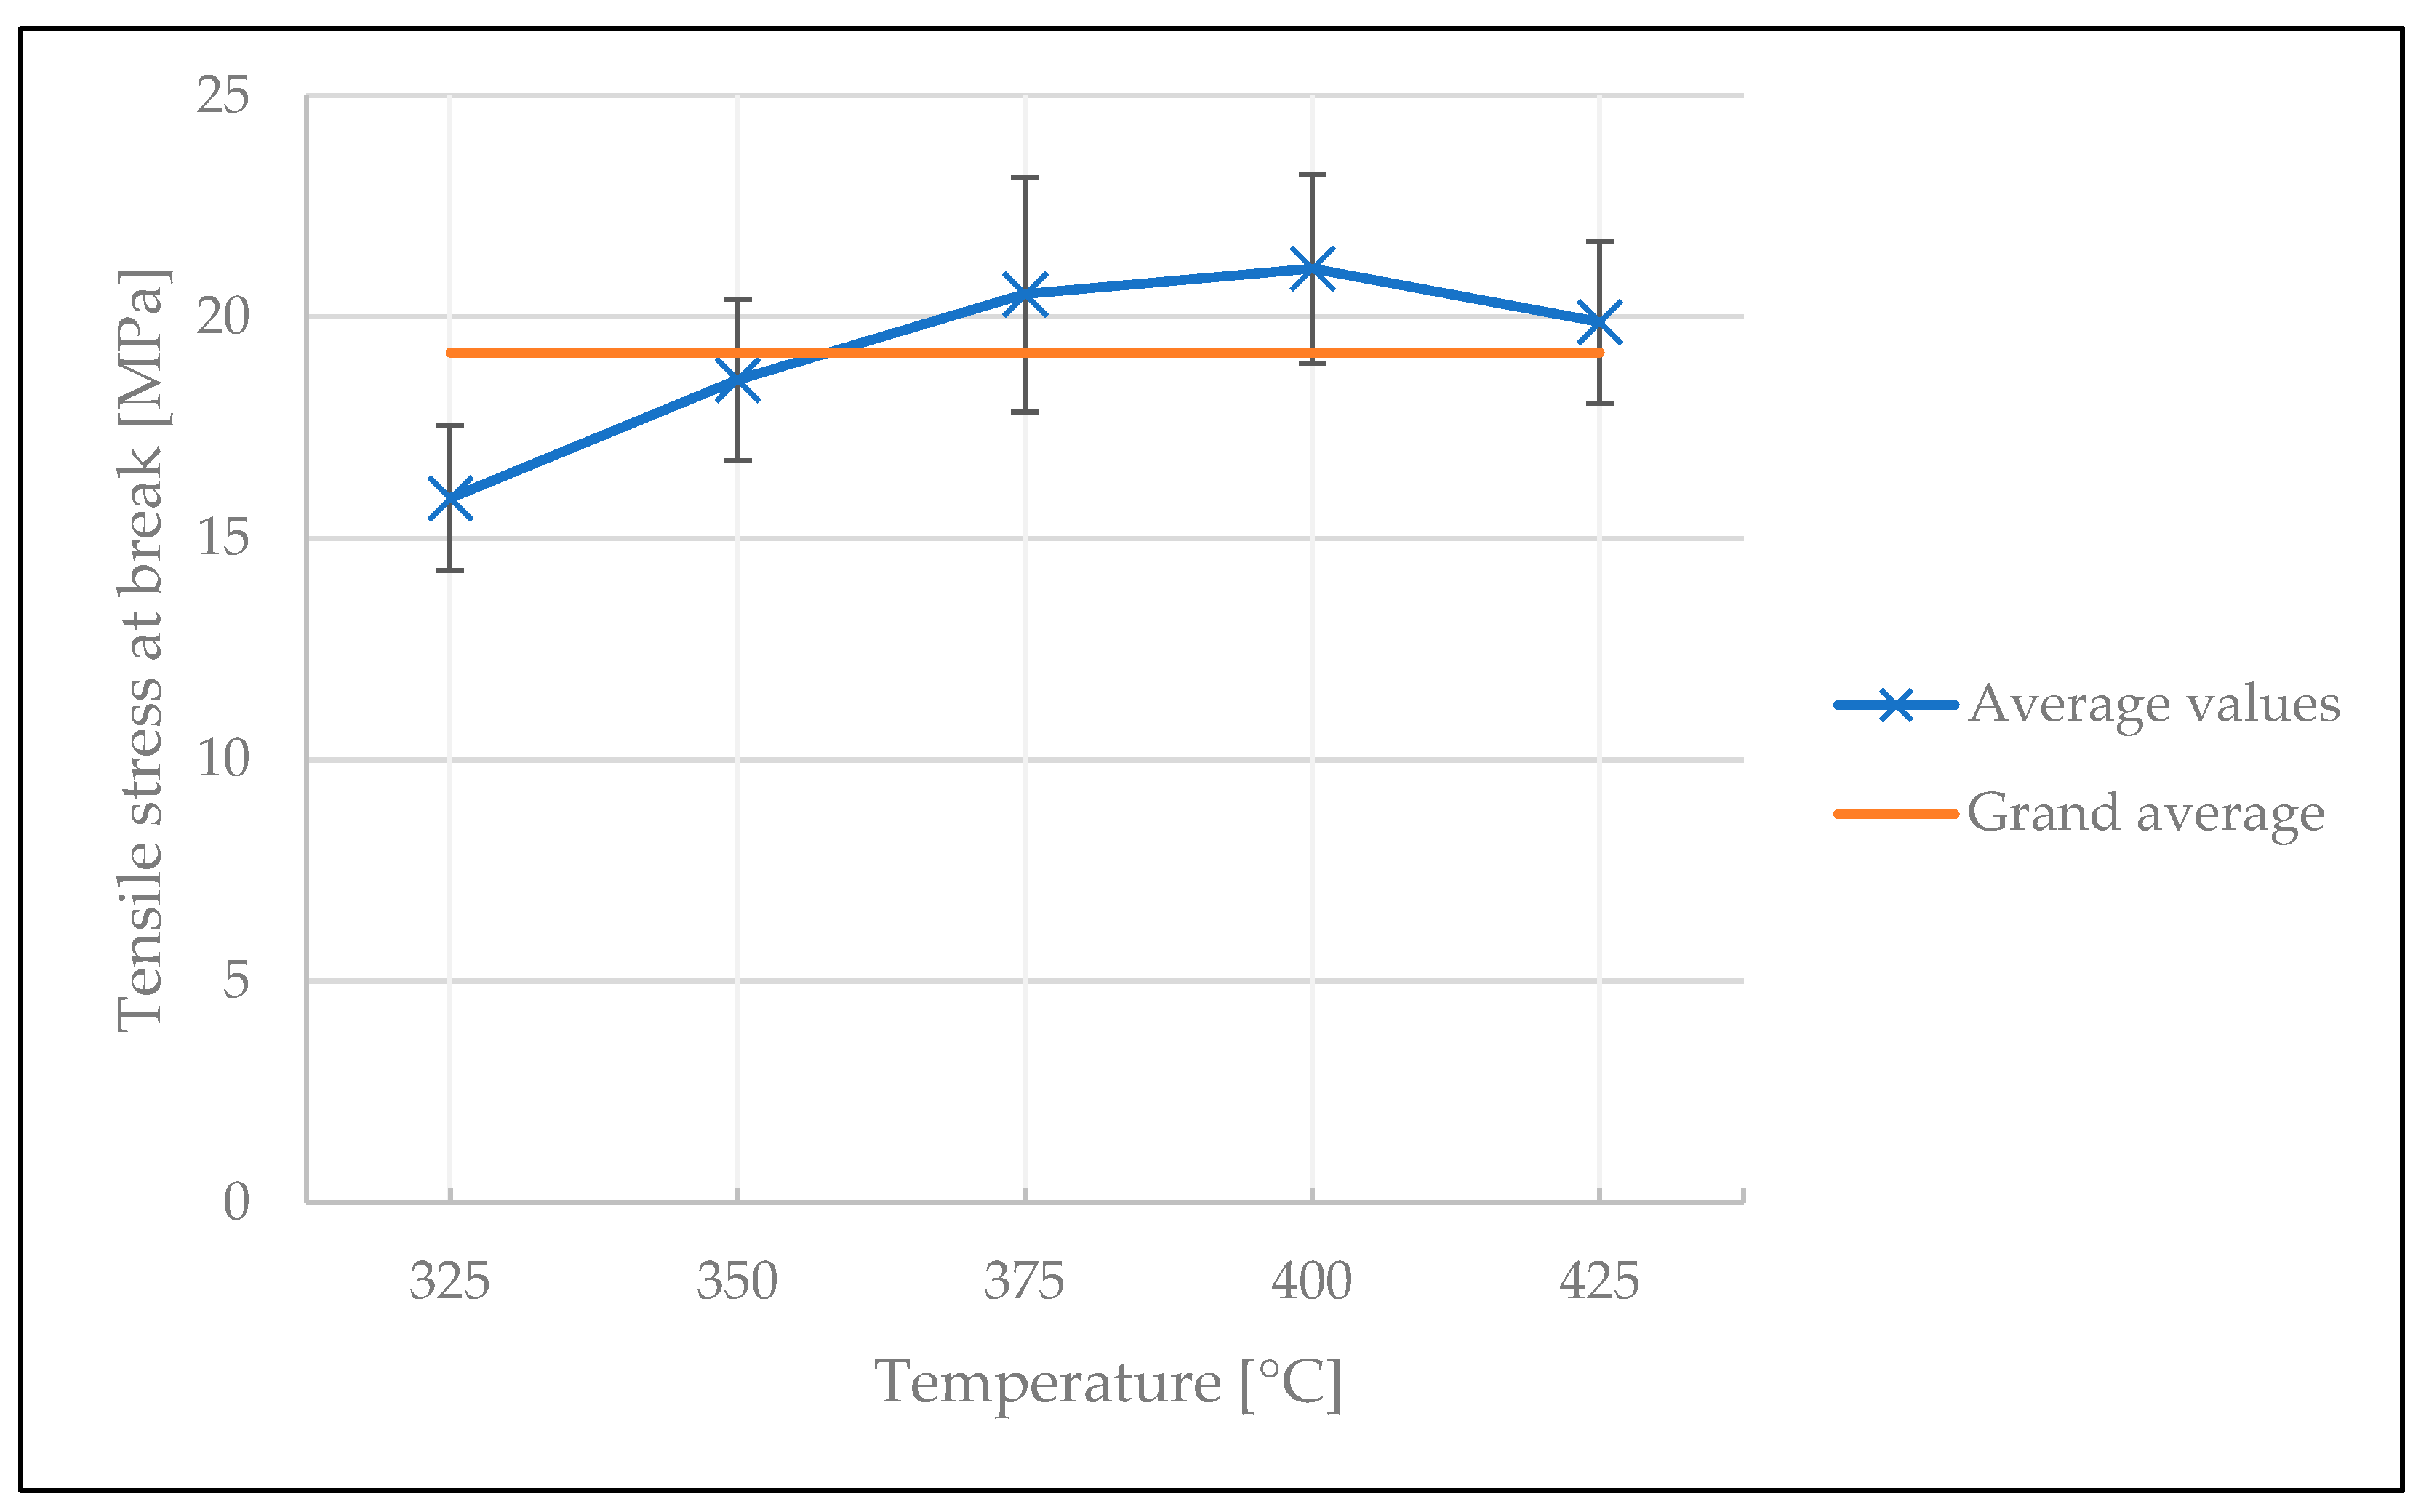
4.2. Optimization Test
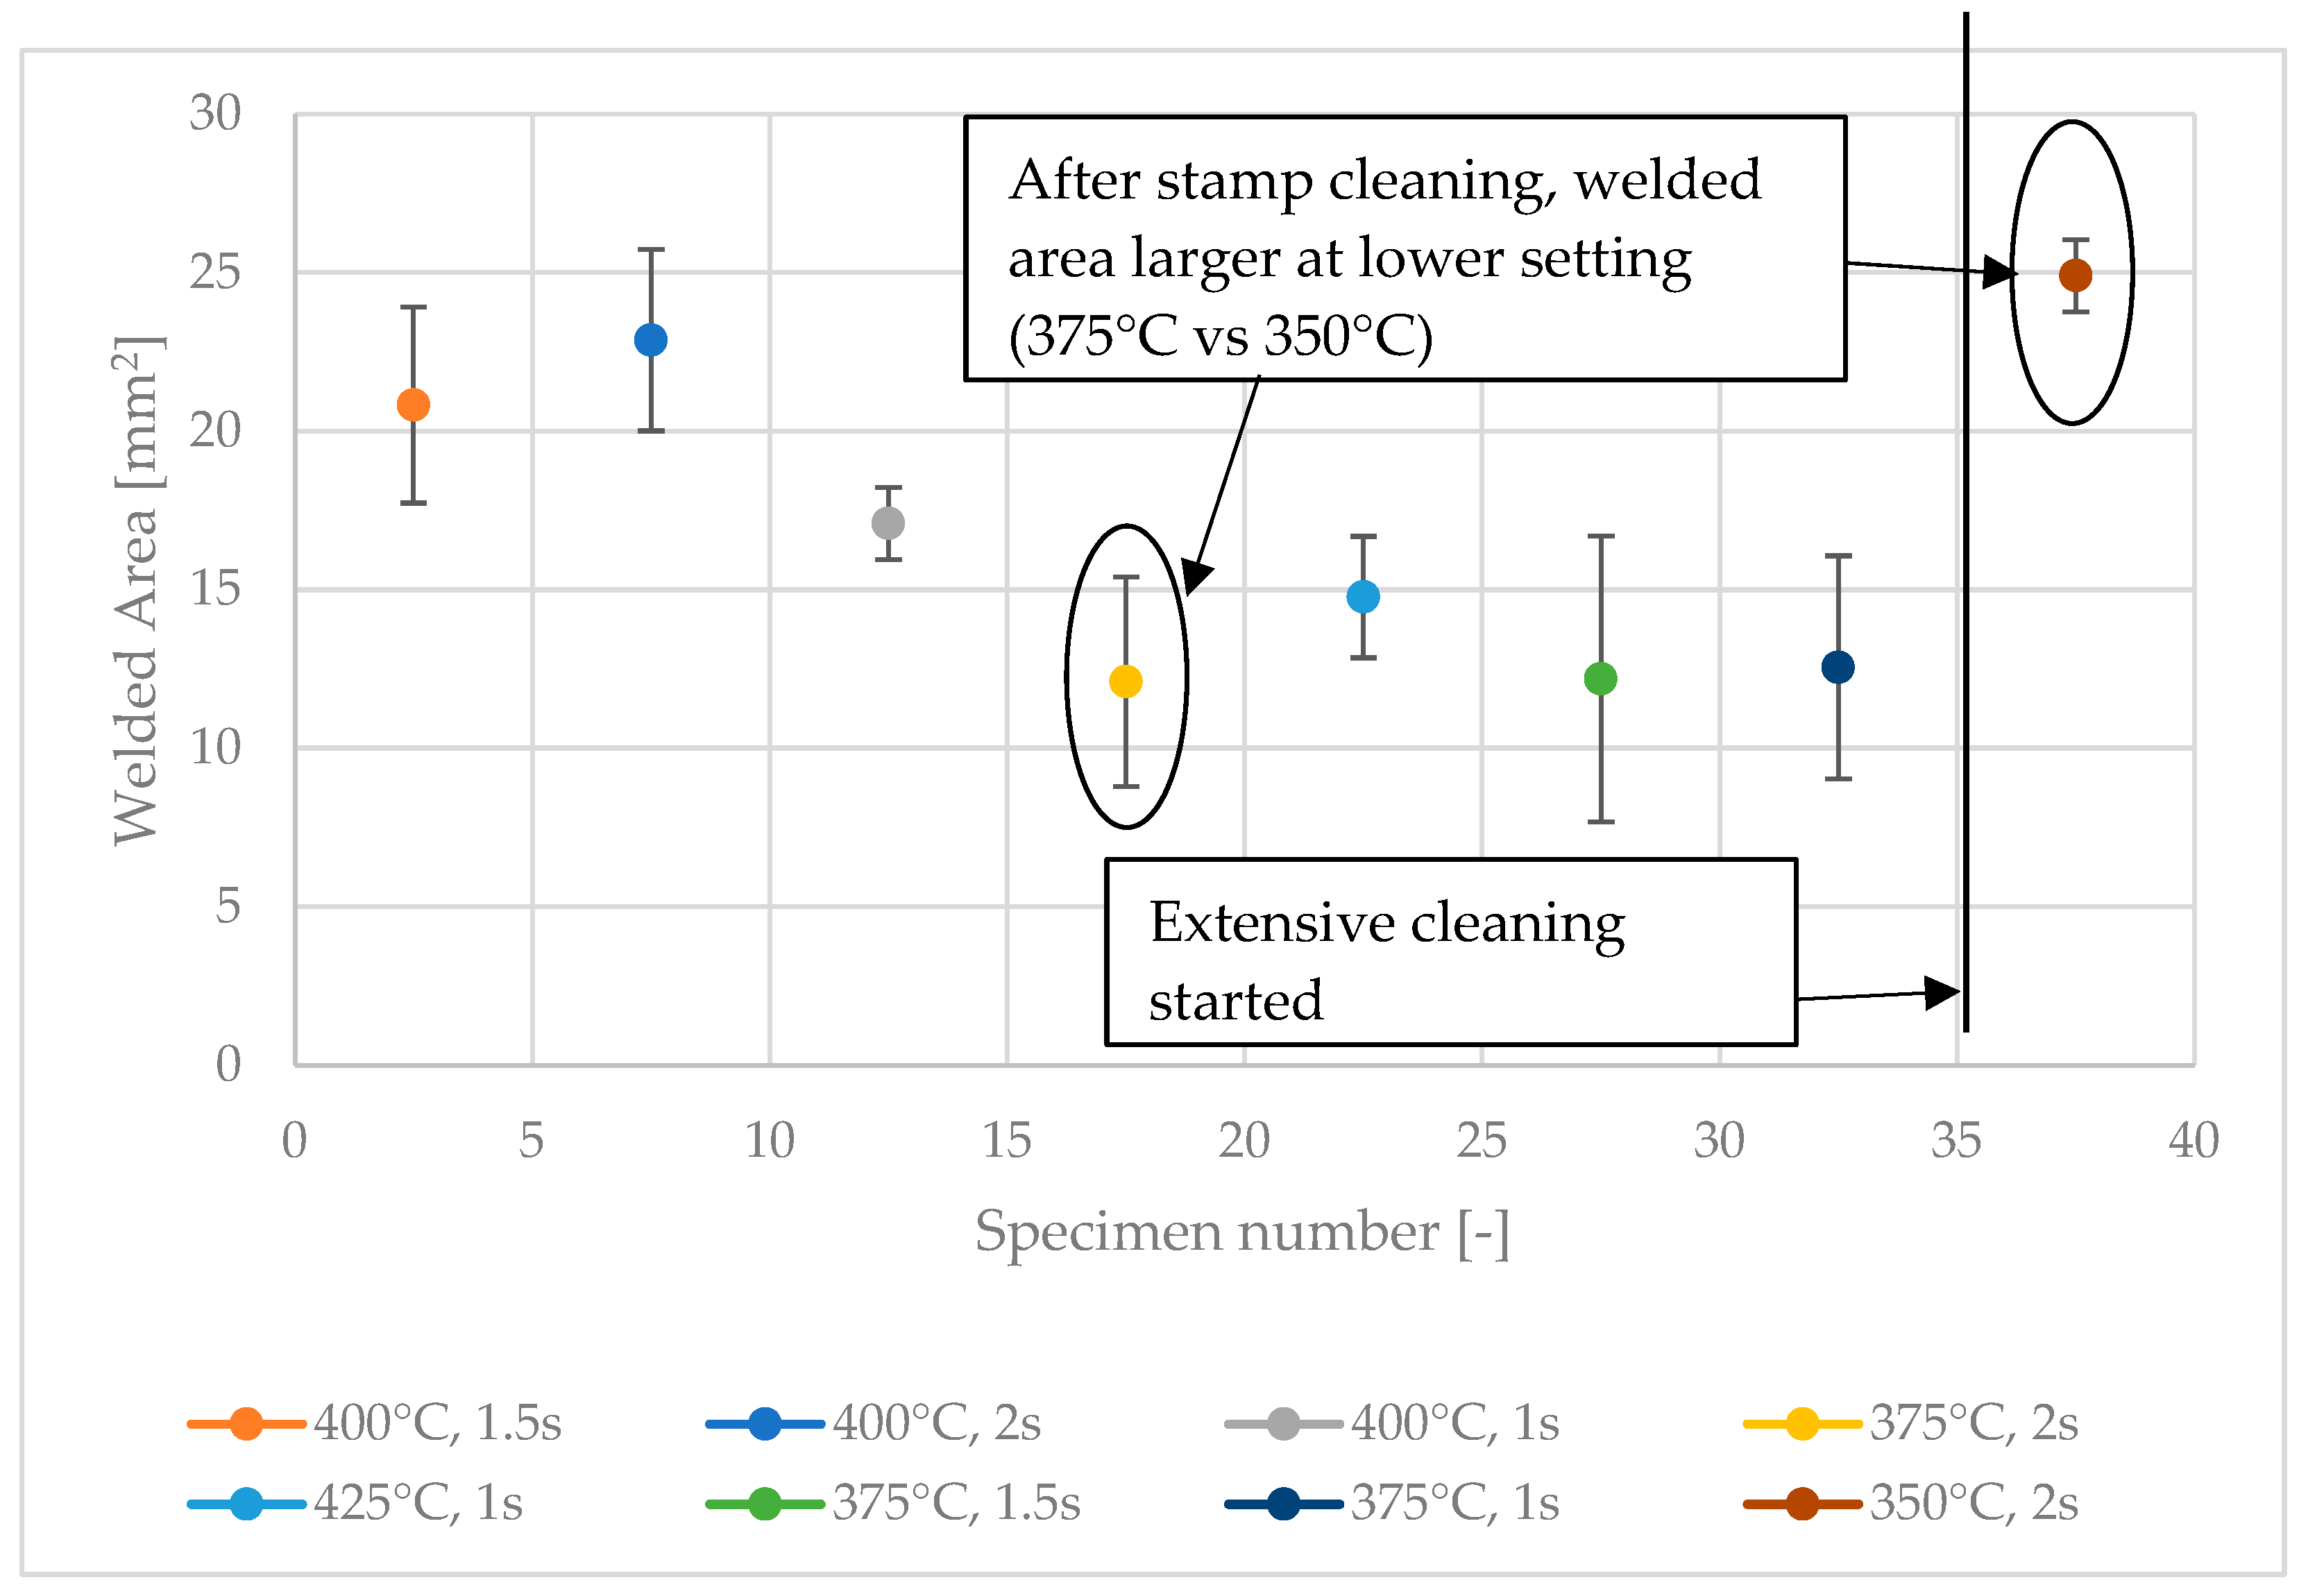
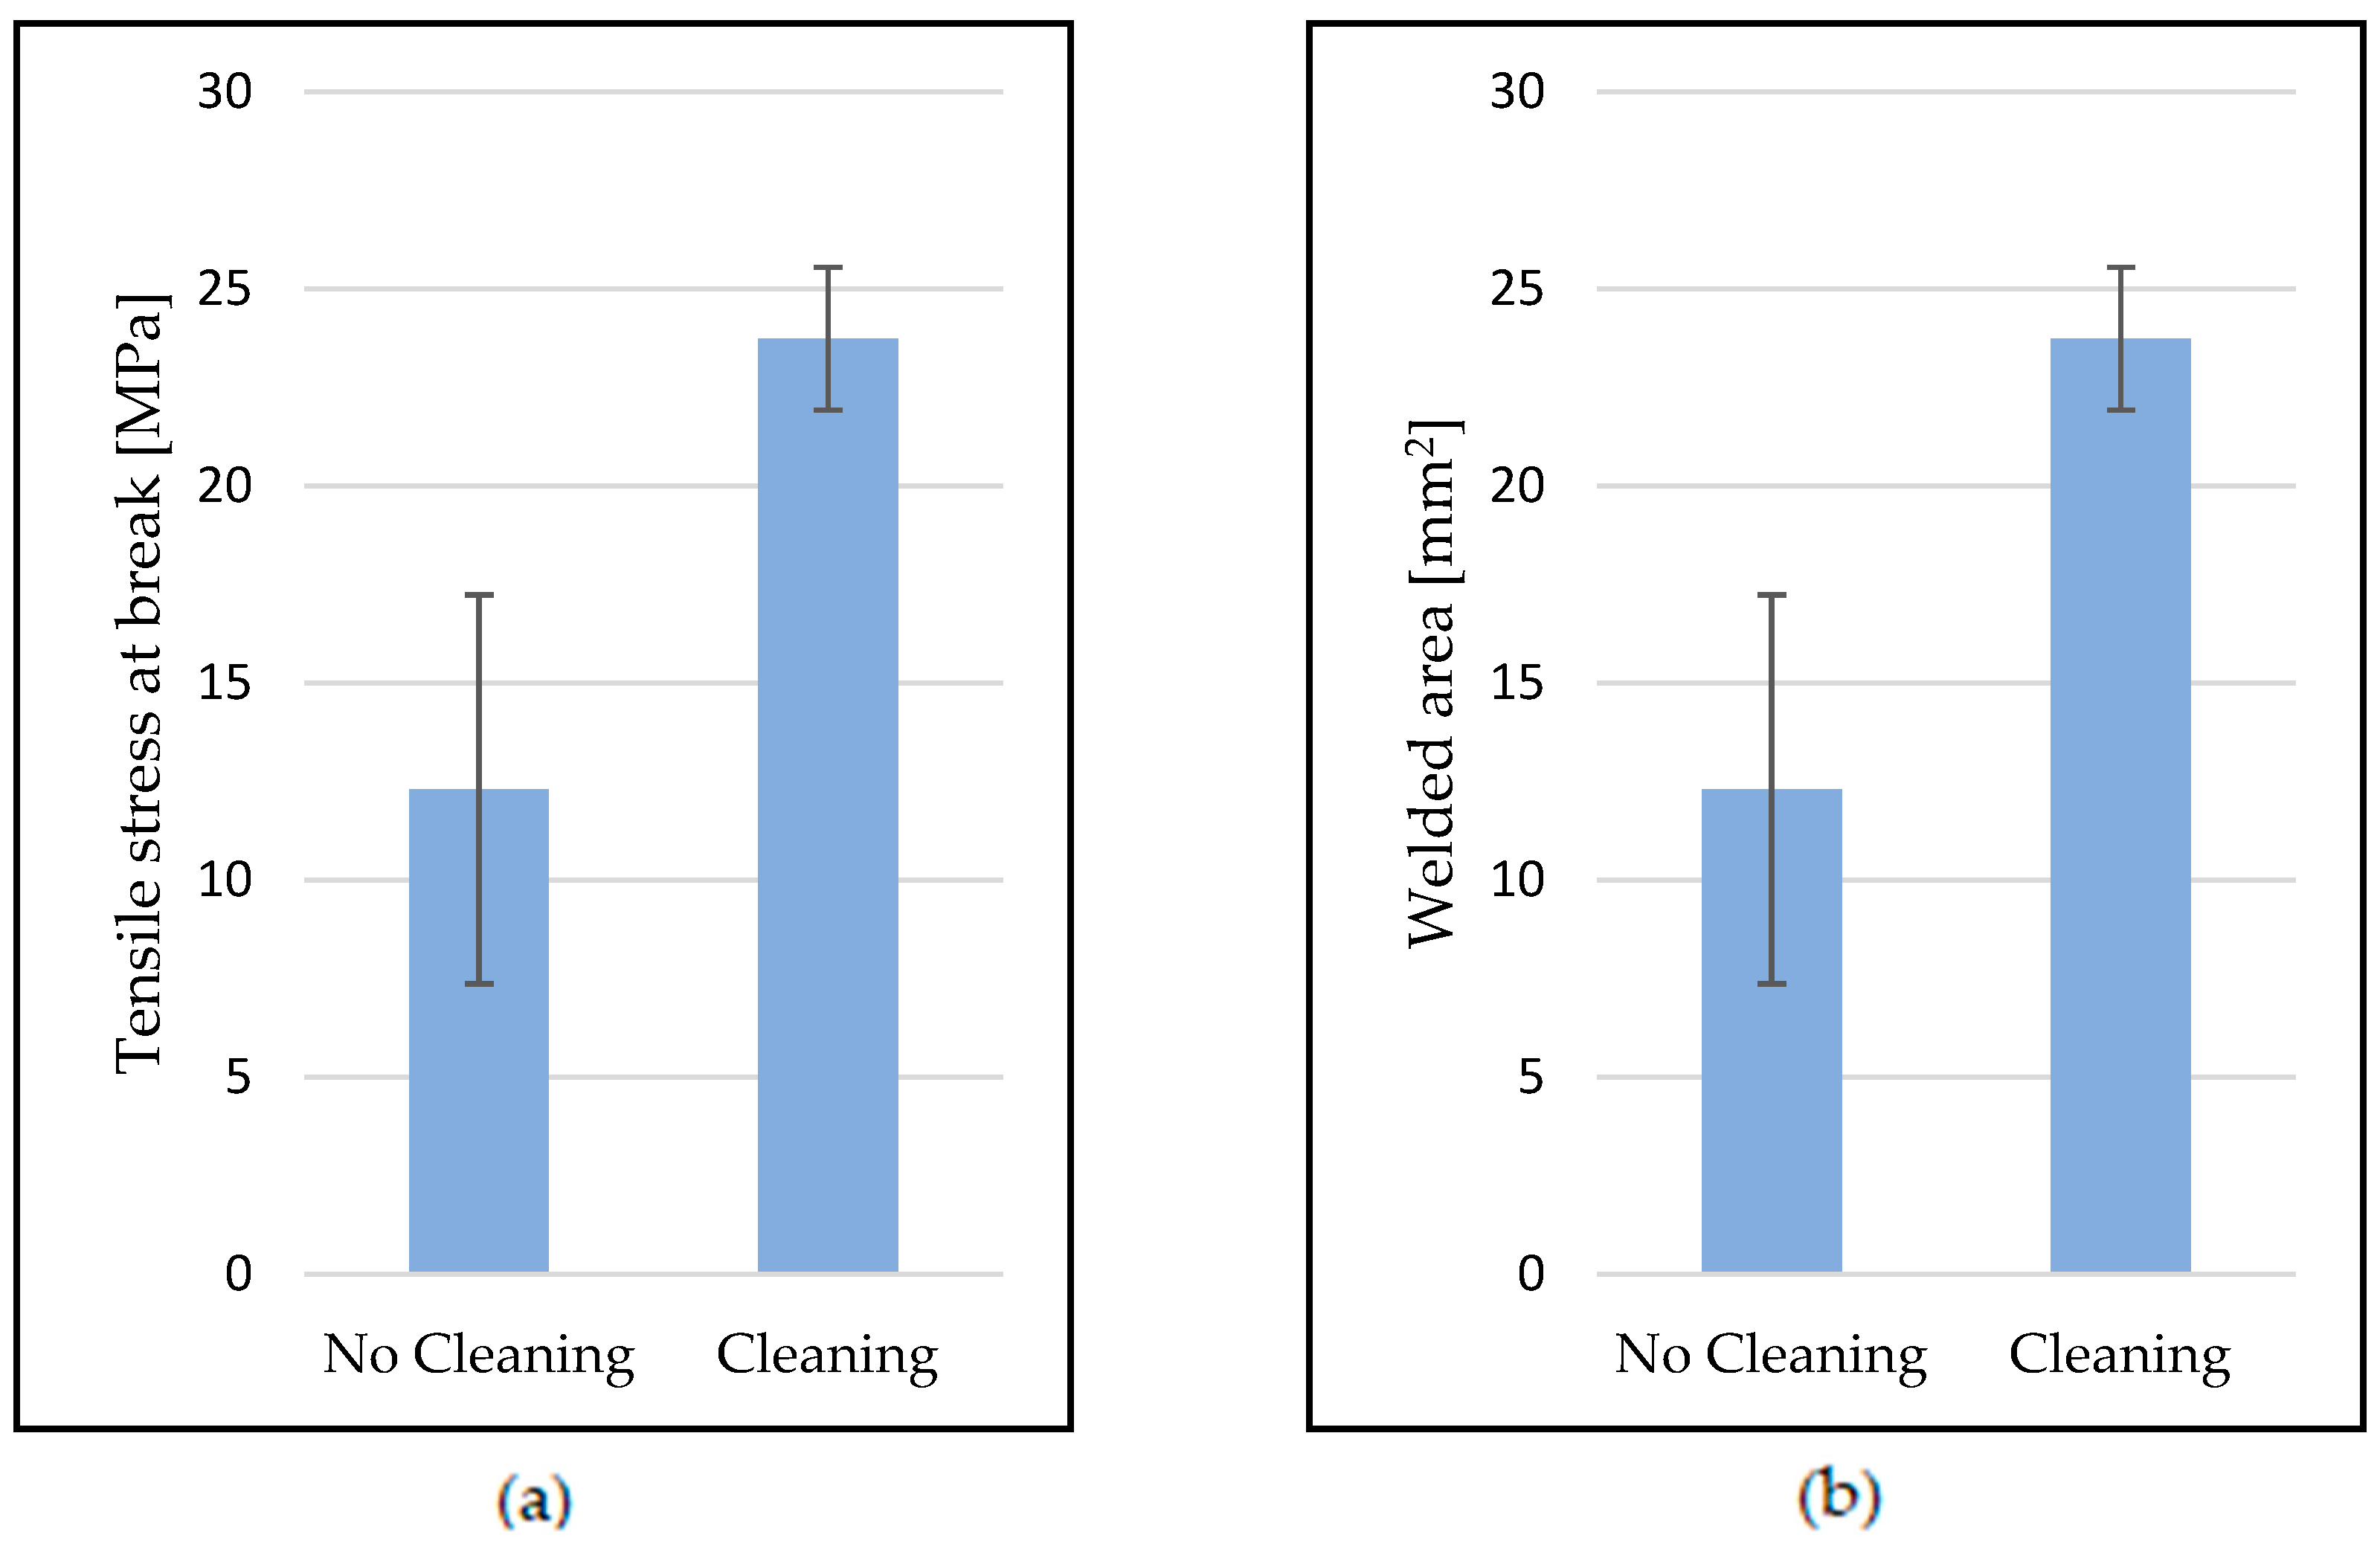
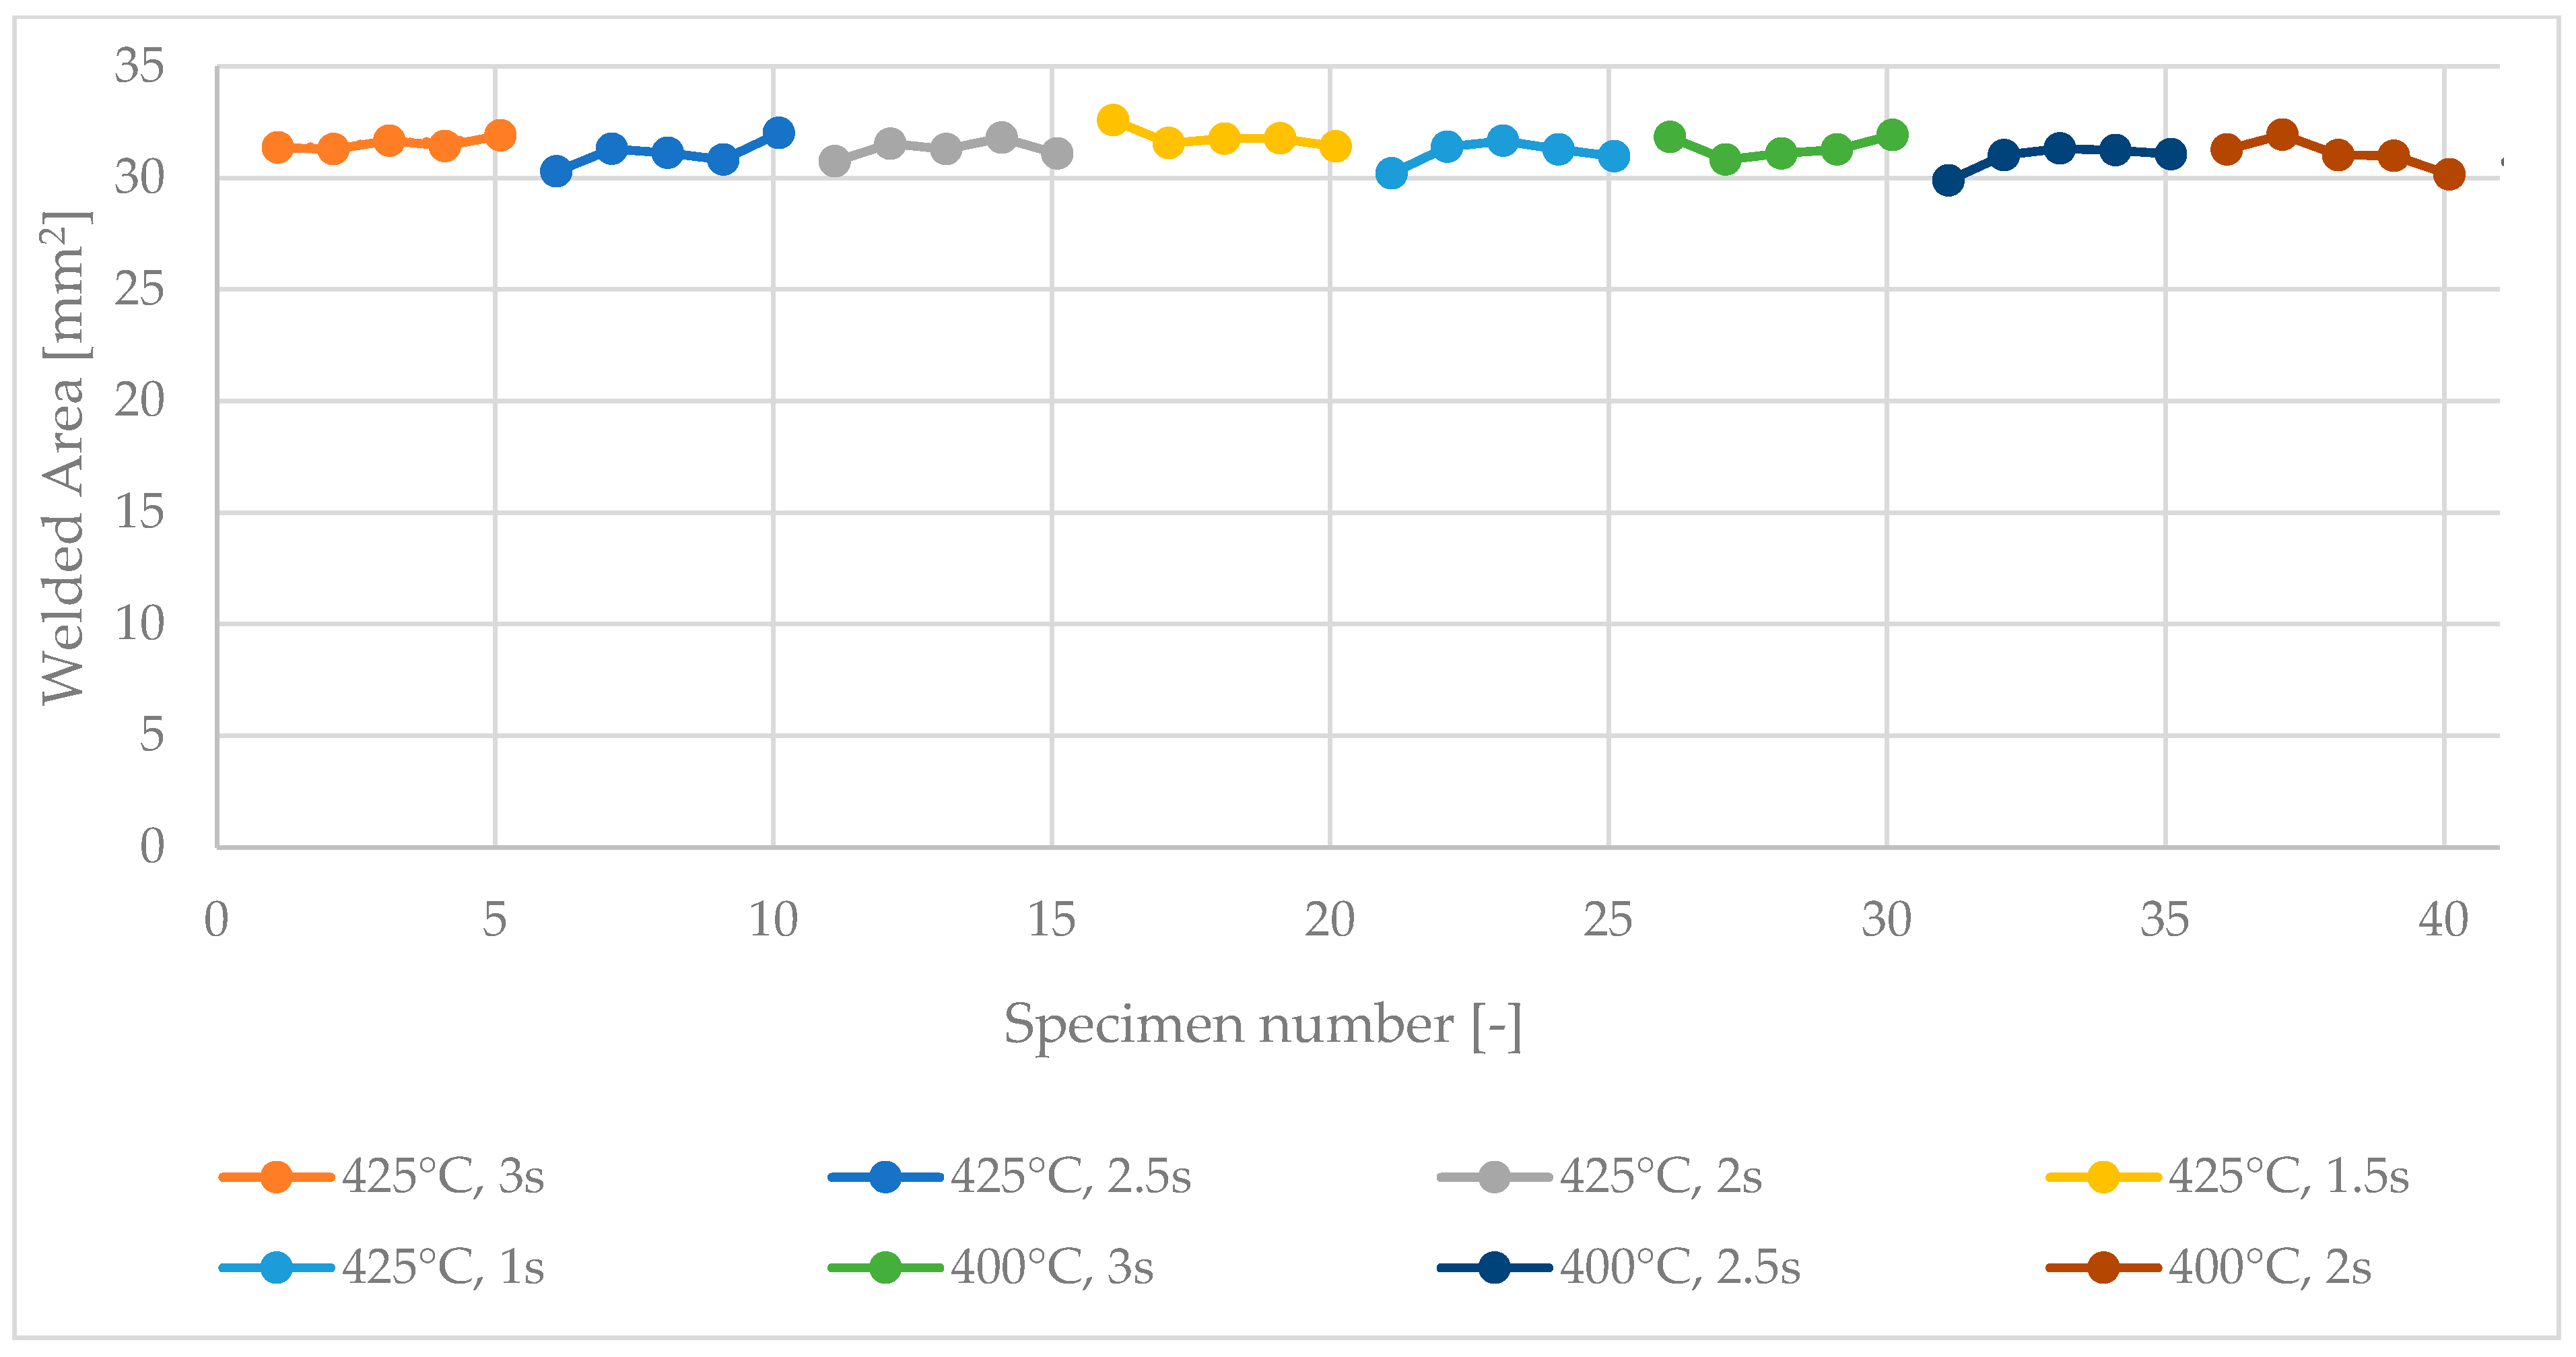
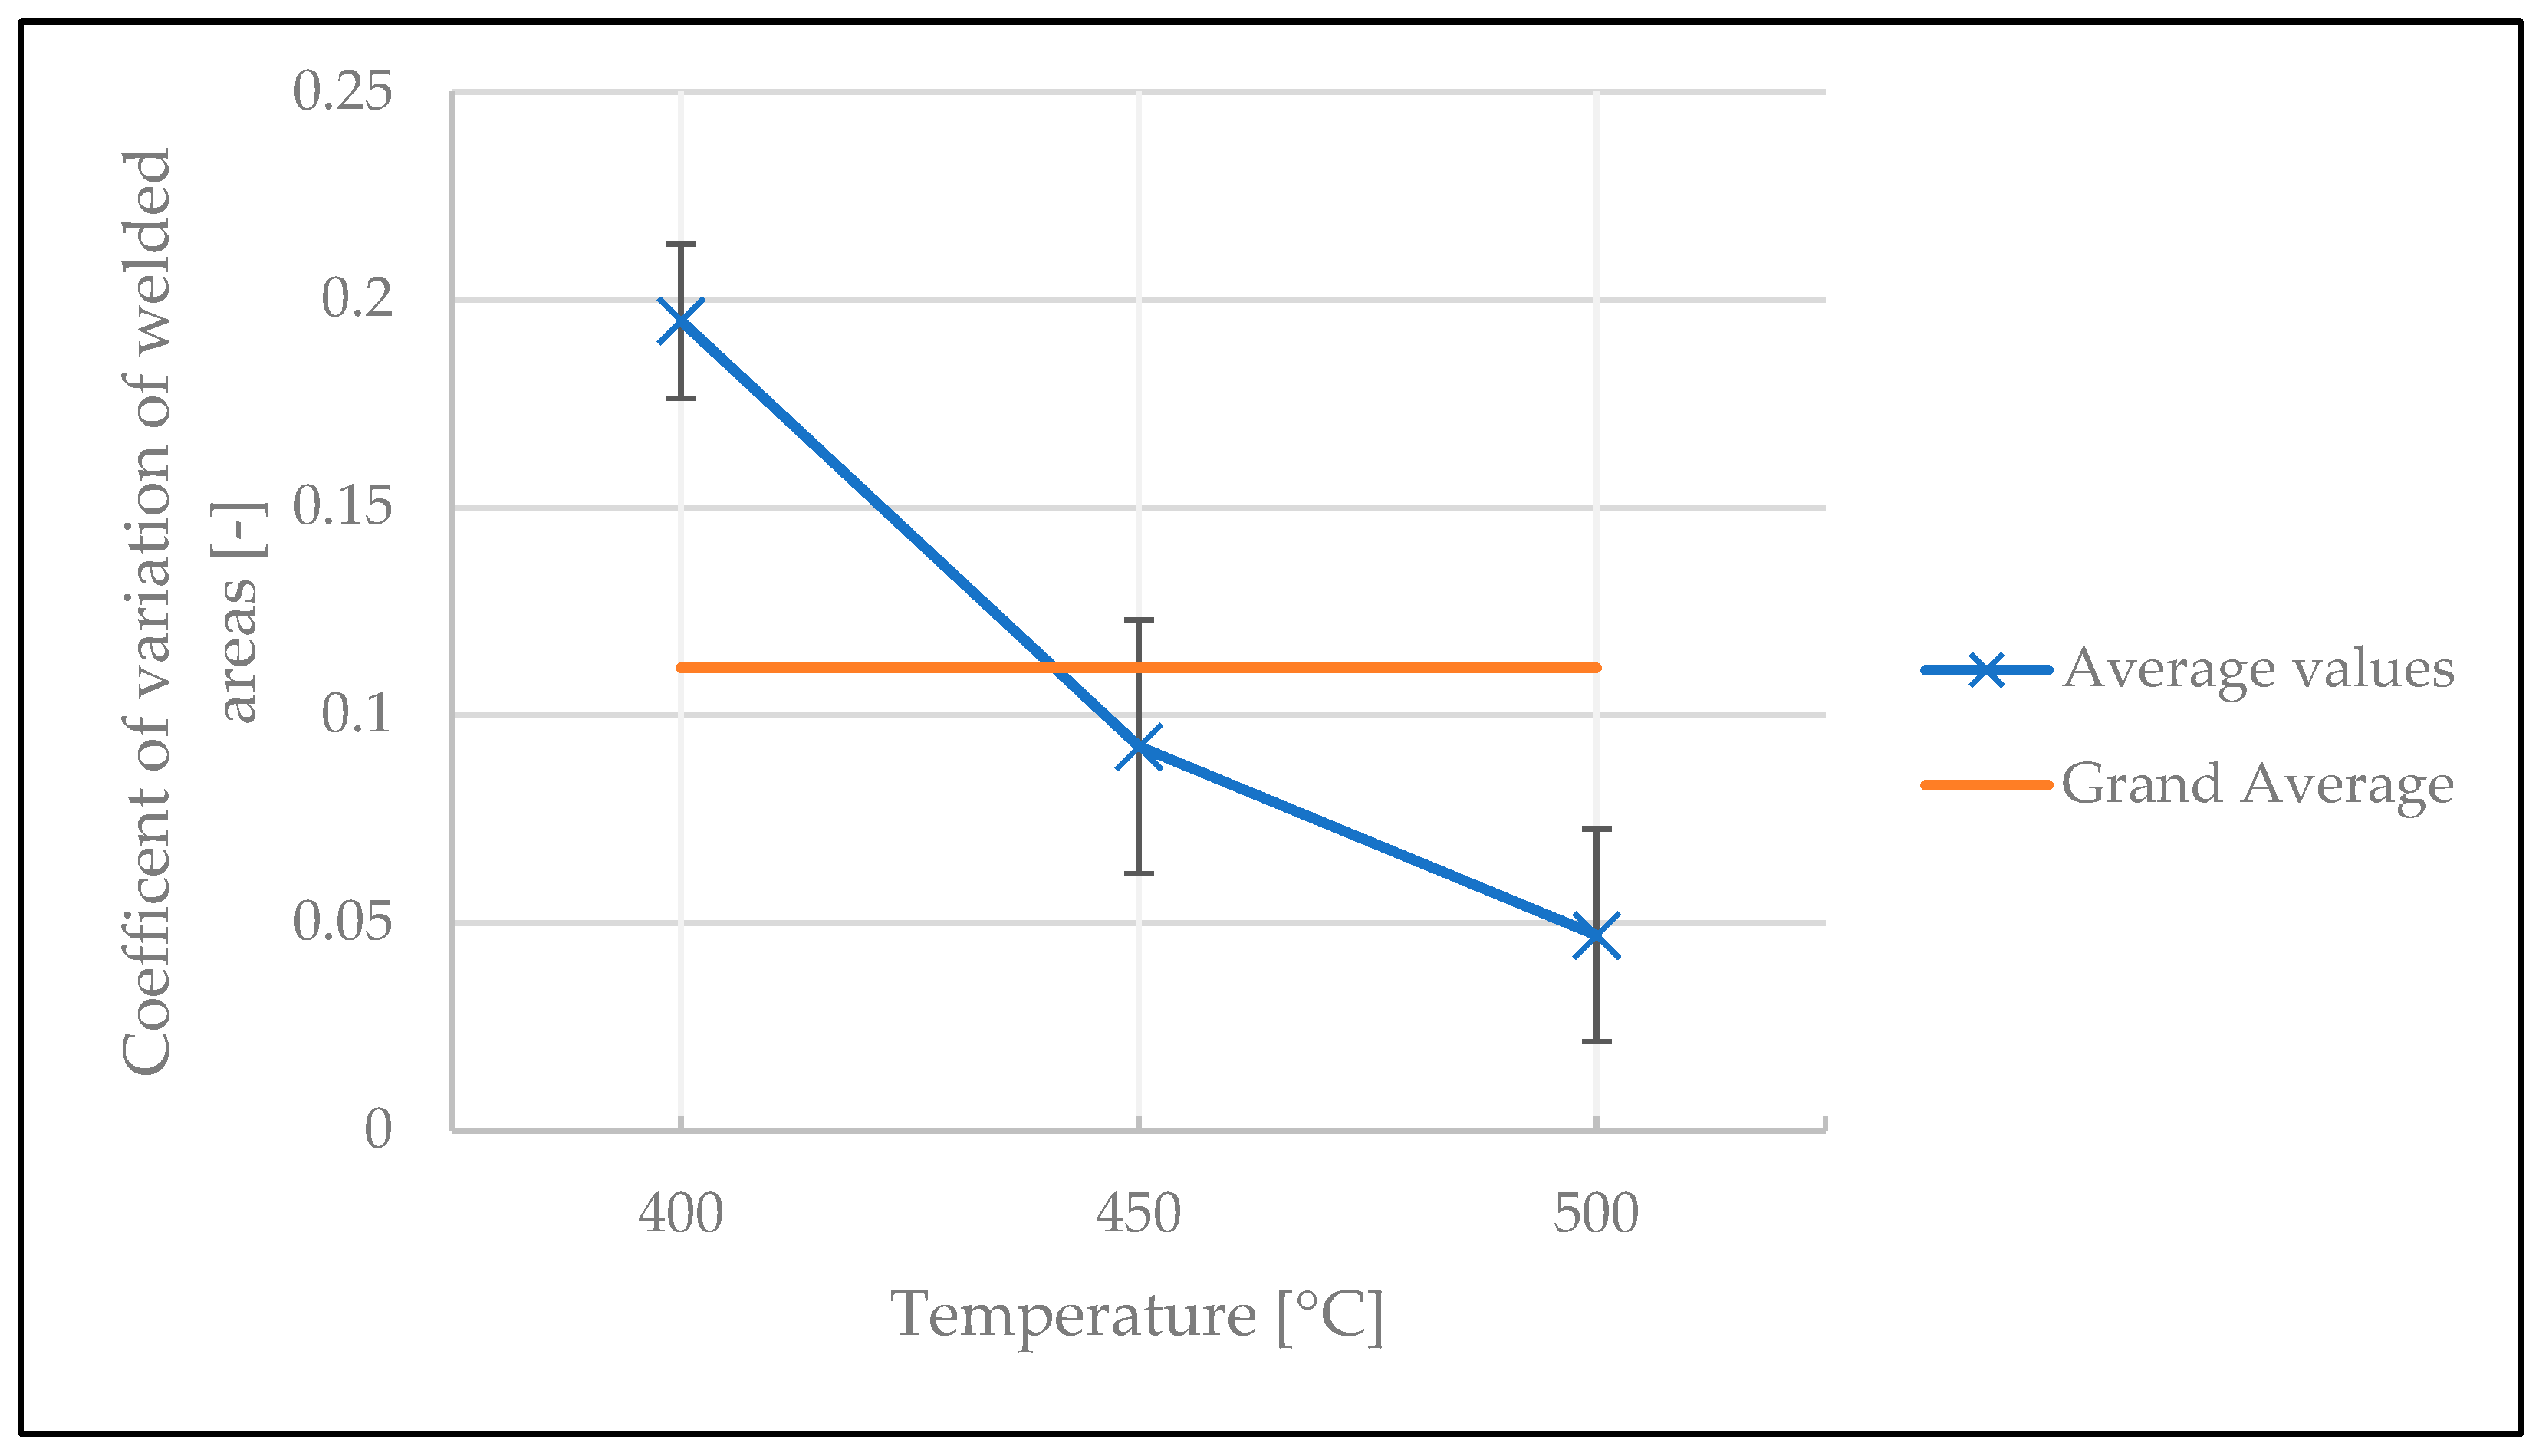
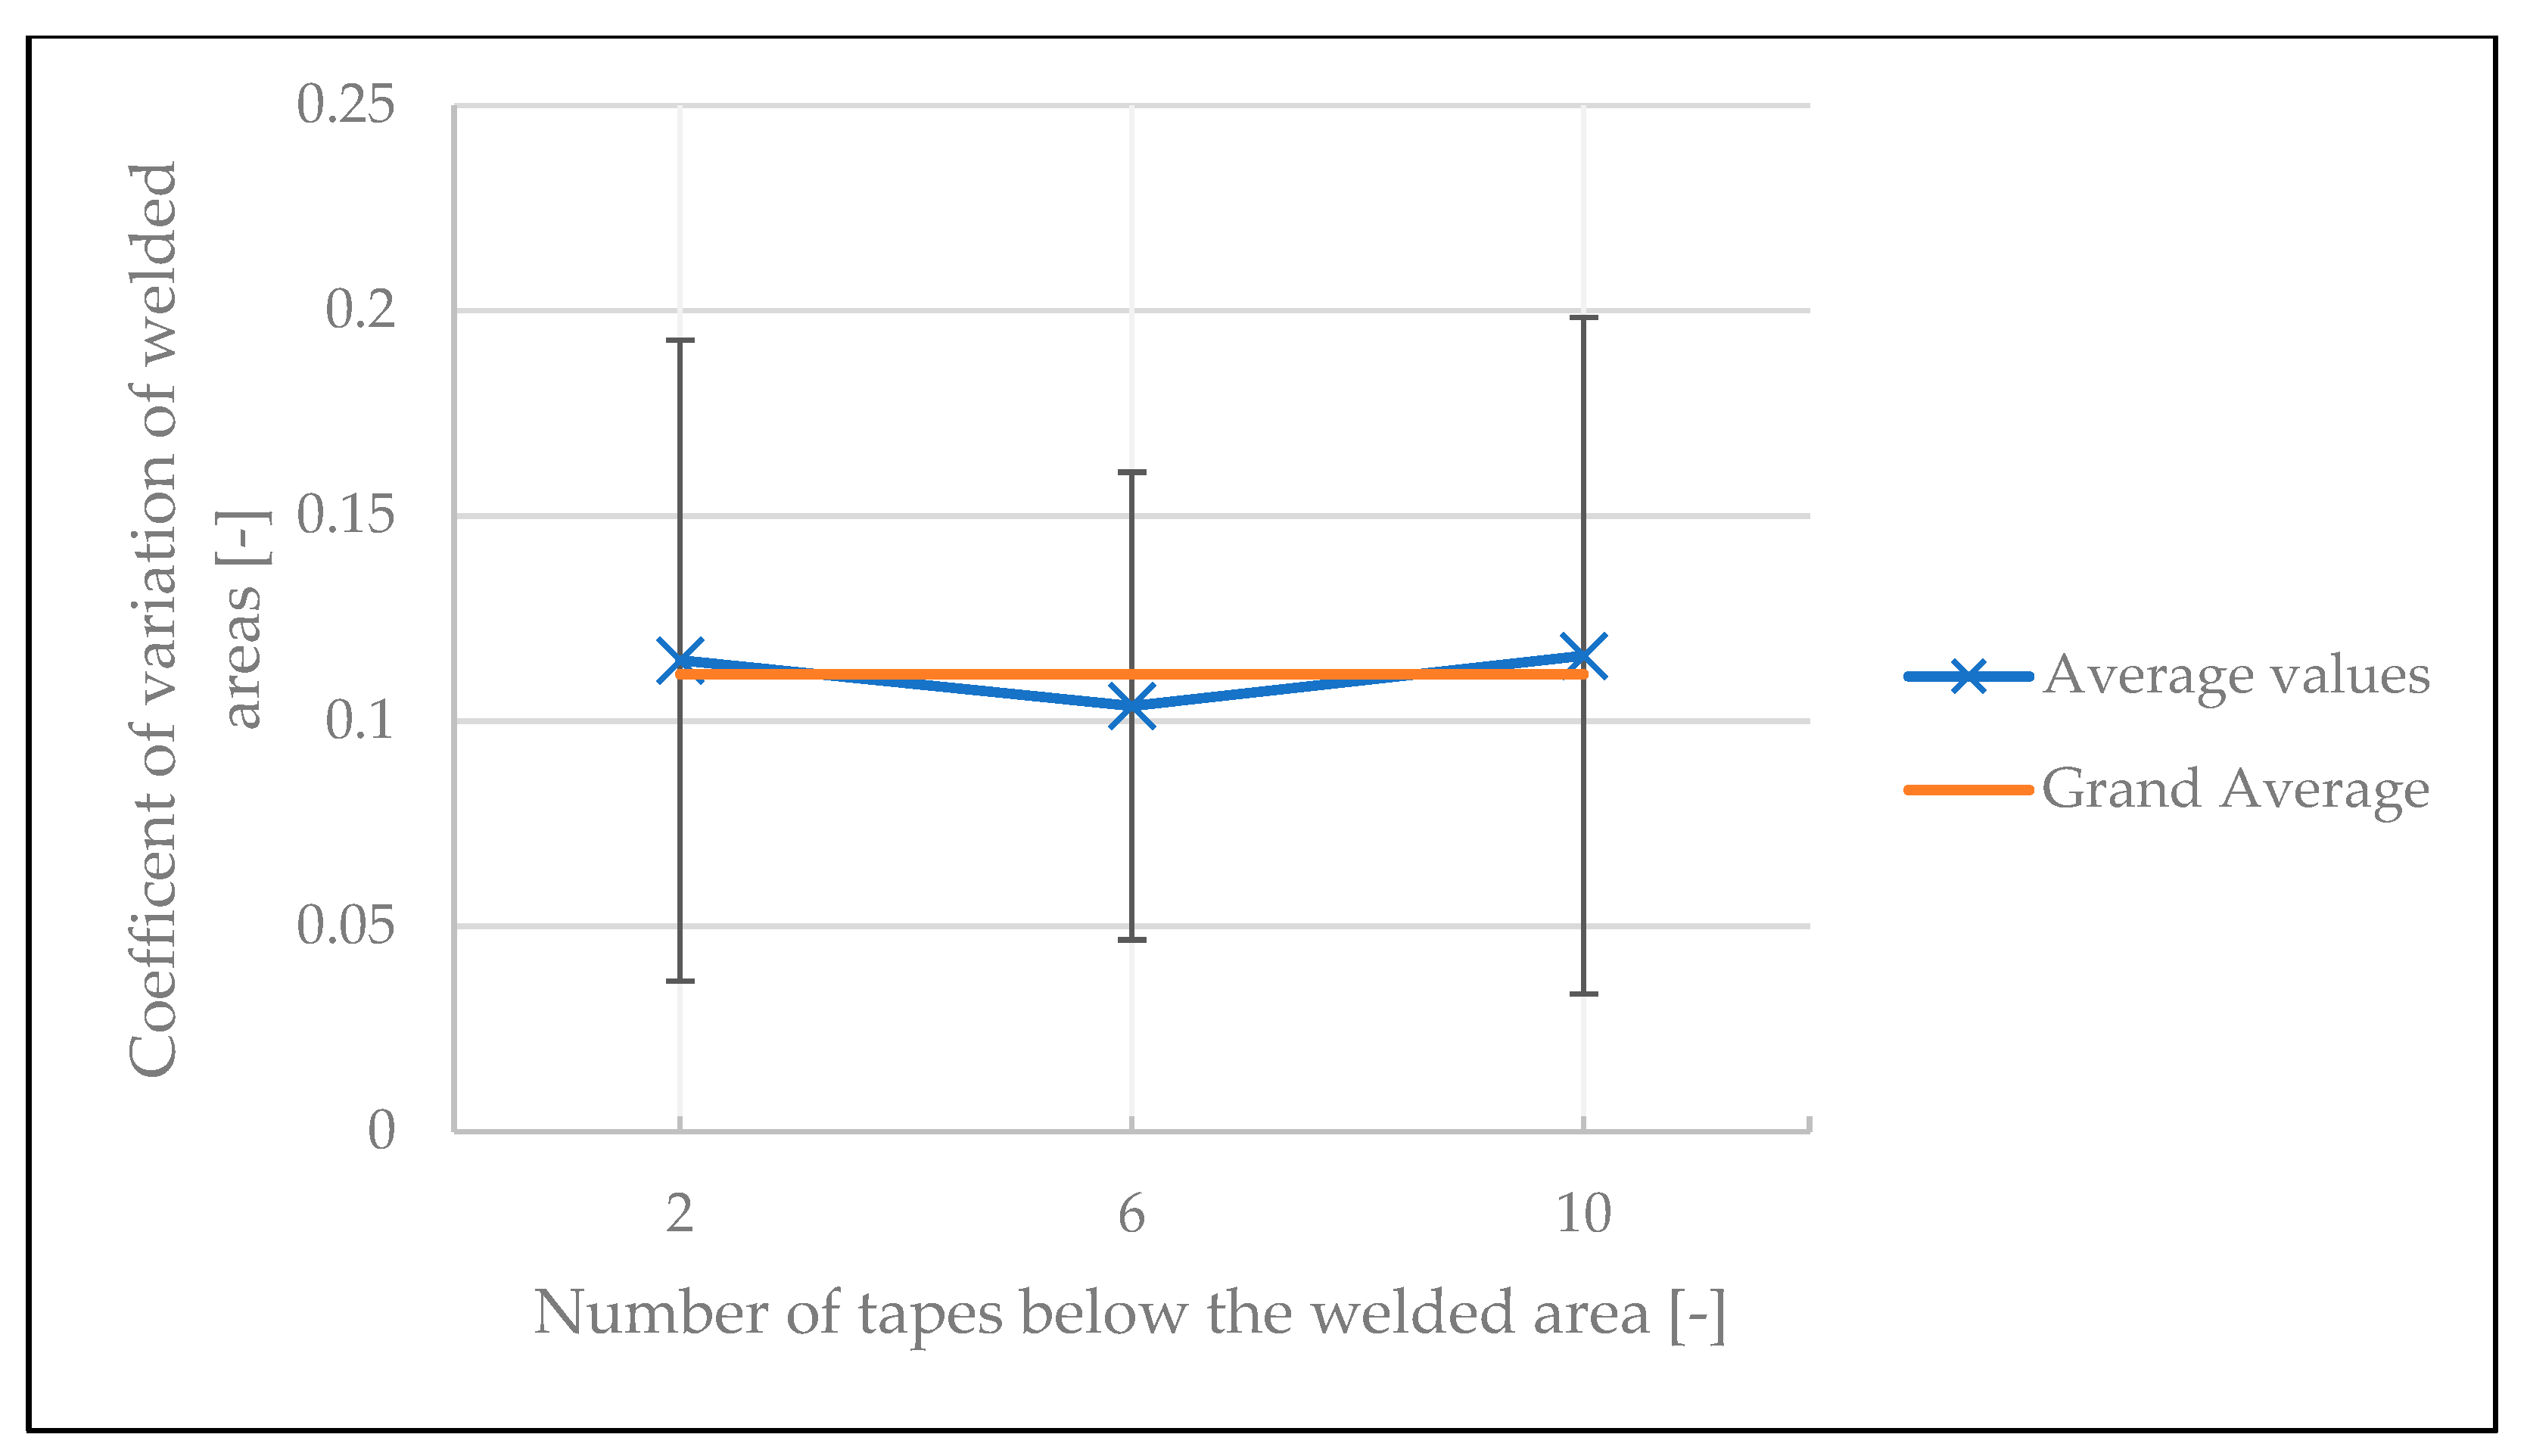
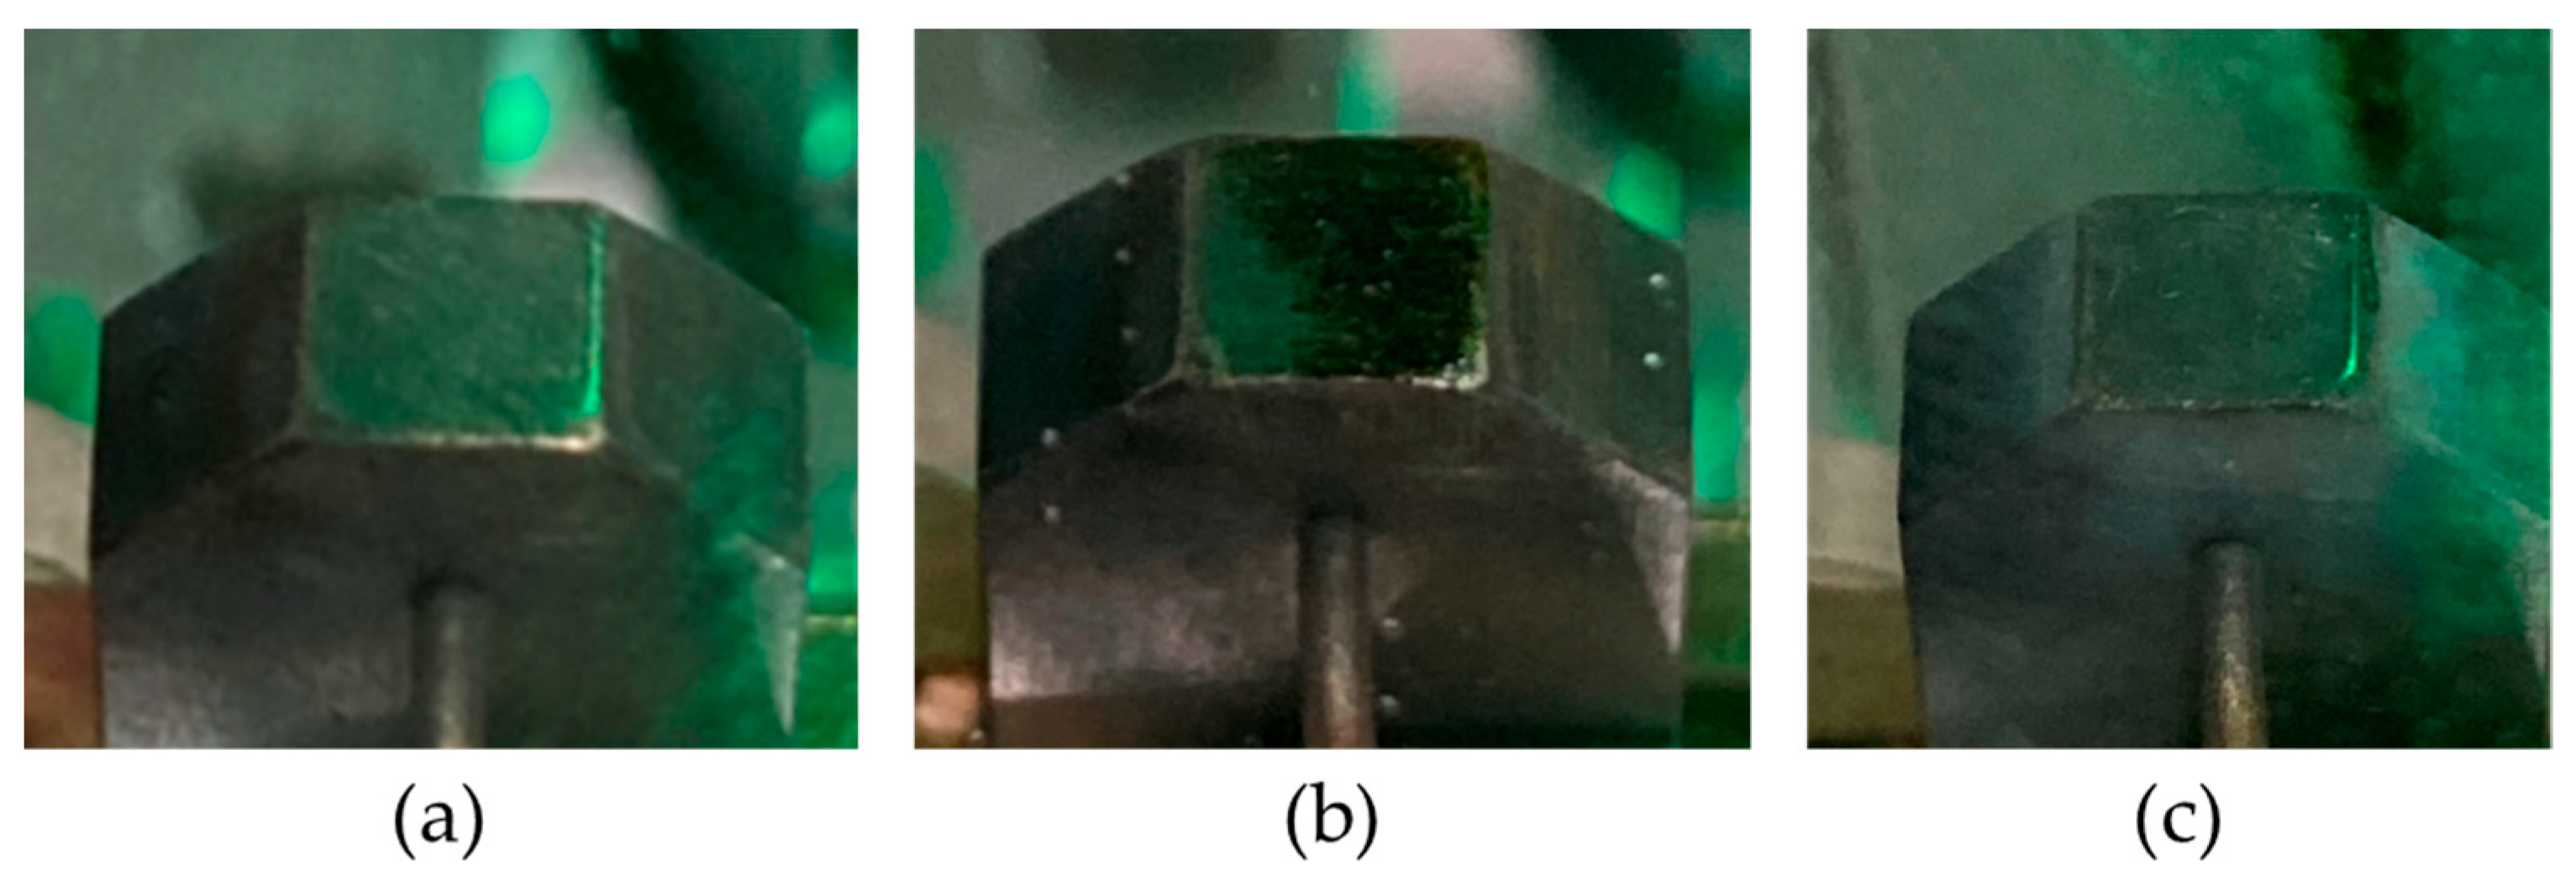
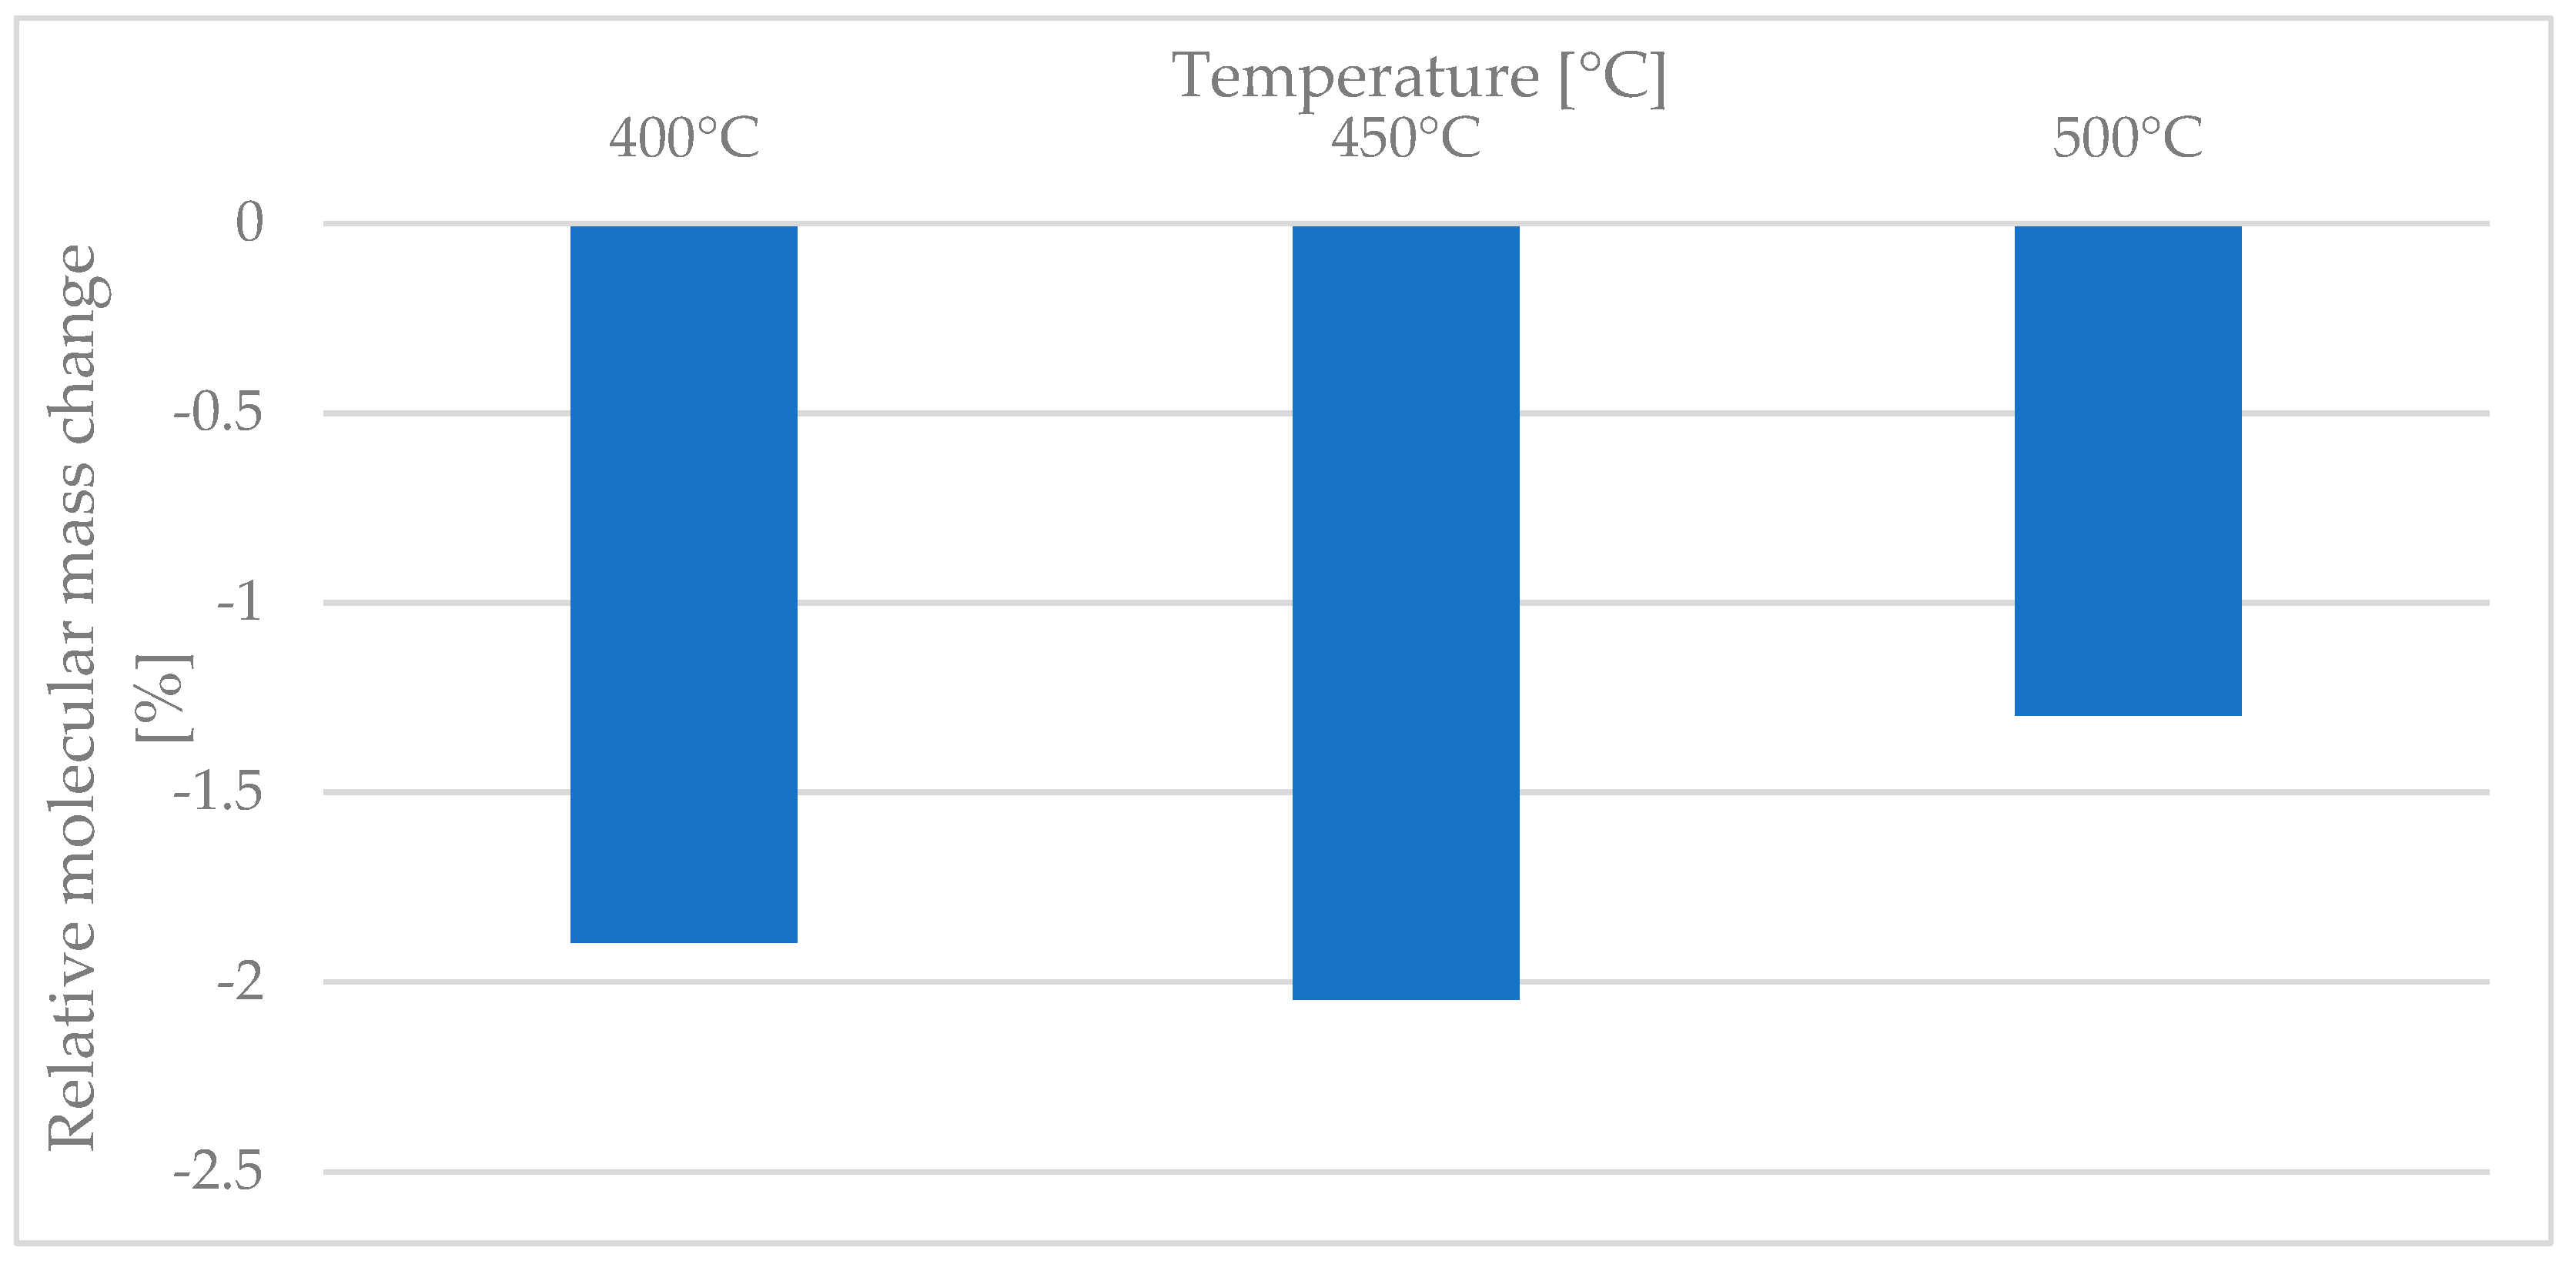
4.3. Continous Test
5. Conclusions and Outlook
Author Contributions
Funding
Institutional Review Board Statement
Informed Consent Statement
Data Availability Statement
Acknowledgments
Conflicts of Interest
Abbreviations
| ANOVA | Analysis of variance |
| CCD | Central composite design |
| DoB | Degree of bonding |
| DoE | Design of experiments |
| FTIR | Fourier transform infrared |
| GPC | Gel permeation chromatography |
| PC | Polycarbonate |
| PC/CF | Polycarbonate/carbon fiber |
| PEEK | Polyether ether ketone |
| UD | Unidirectional |
Appendix A

| ANOVA | ||||||
|---|---|---|---|---|---|---|
| Source of Variation | SS | df | MS | F | p-value | F crit |
| Between Groups | 519.8481 | 1 | 519.8481 | 41.46277 | 9.64 × 10⁻⁷ | 4.241699 |
| Within Groups | 313.4427 | 25 | 12.53771 | |||
| Total | 833.2908 | 26 |
| ANOVA | ||||||
|---|---|---|---|---|---|---|
| Source of Variation | SS | df | MS | F | p-value | F crit |
| Between Groups | 1112.744 | 4 | 278.1861 | 8.701923 | 6.47 × 10⁻⁶ | 2.481661 |
| Within Groups | 2653.373 | 83 | 31.96835 | |||
| Total | 3766.117 | 87 |
| ANOVA | ||||||
|---|---|---|---|---|---|---|
| Source of Variation | SS | df | MS | F | p-value | F crit |
| Between Groups | 971.9521 | 3 | 323.984 | 9.739818 | 1.39 × 10⁻⁵ | 2.713227 |
| Within Groups | 2794.165 | 84 | 33.26387 | |||
| Total | 3766.117 | 87 |
| ANOVA | ||||||
|---|---|---|---|---|---|---|
| Source of Variation | SS | df | MS | F | p-value | F crit |
| Between Groups | 412.0432 | 4 | 103.0108 | 24.6047 | 8.6 × 10⁻¹⁵ | 2.449202 |
| Within Groups | 489.836 | 117 | 4.186632 | |||
| Total | 901.8792 | 121 |
| ANOVA | ||||||
|---|---|---|---|---|---|---|
| Source of Variation | SS | df | MS | F | p-value | F crit |
| Between Groups | 53.48749 | 4 | 13.37187 | 1.825407 | 0.12853 | 2.449202 |
| Within Groups | 857.074 | 117 | 7.325419 | |||
| Total | 910.5615 | 121 |
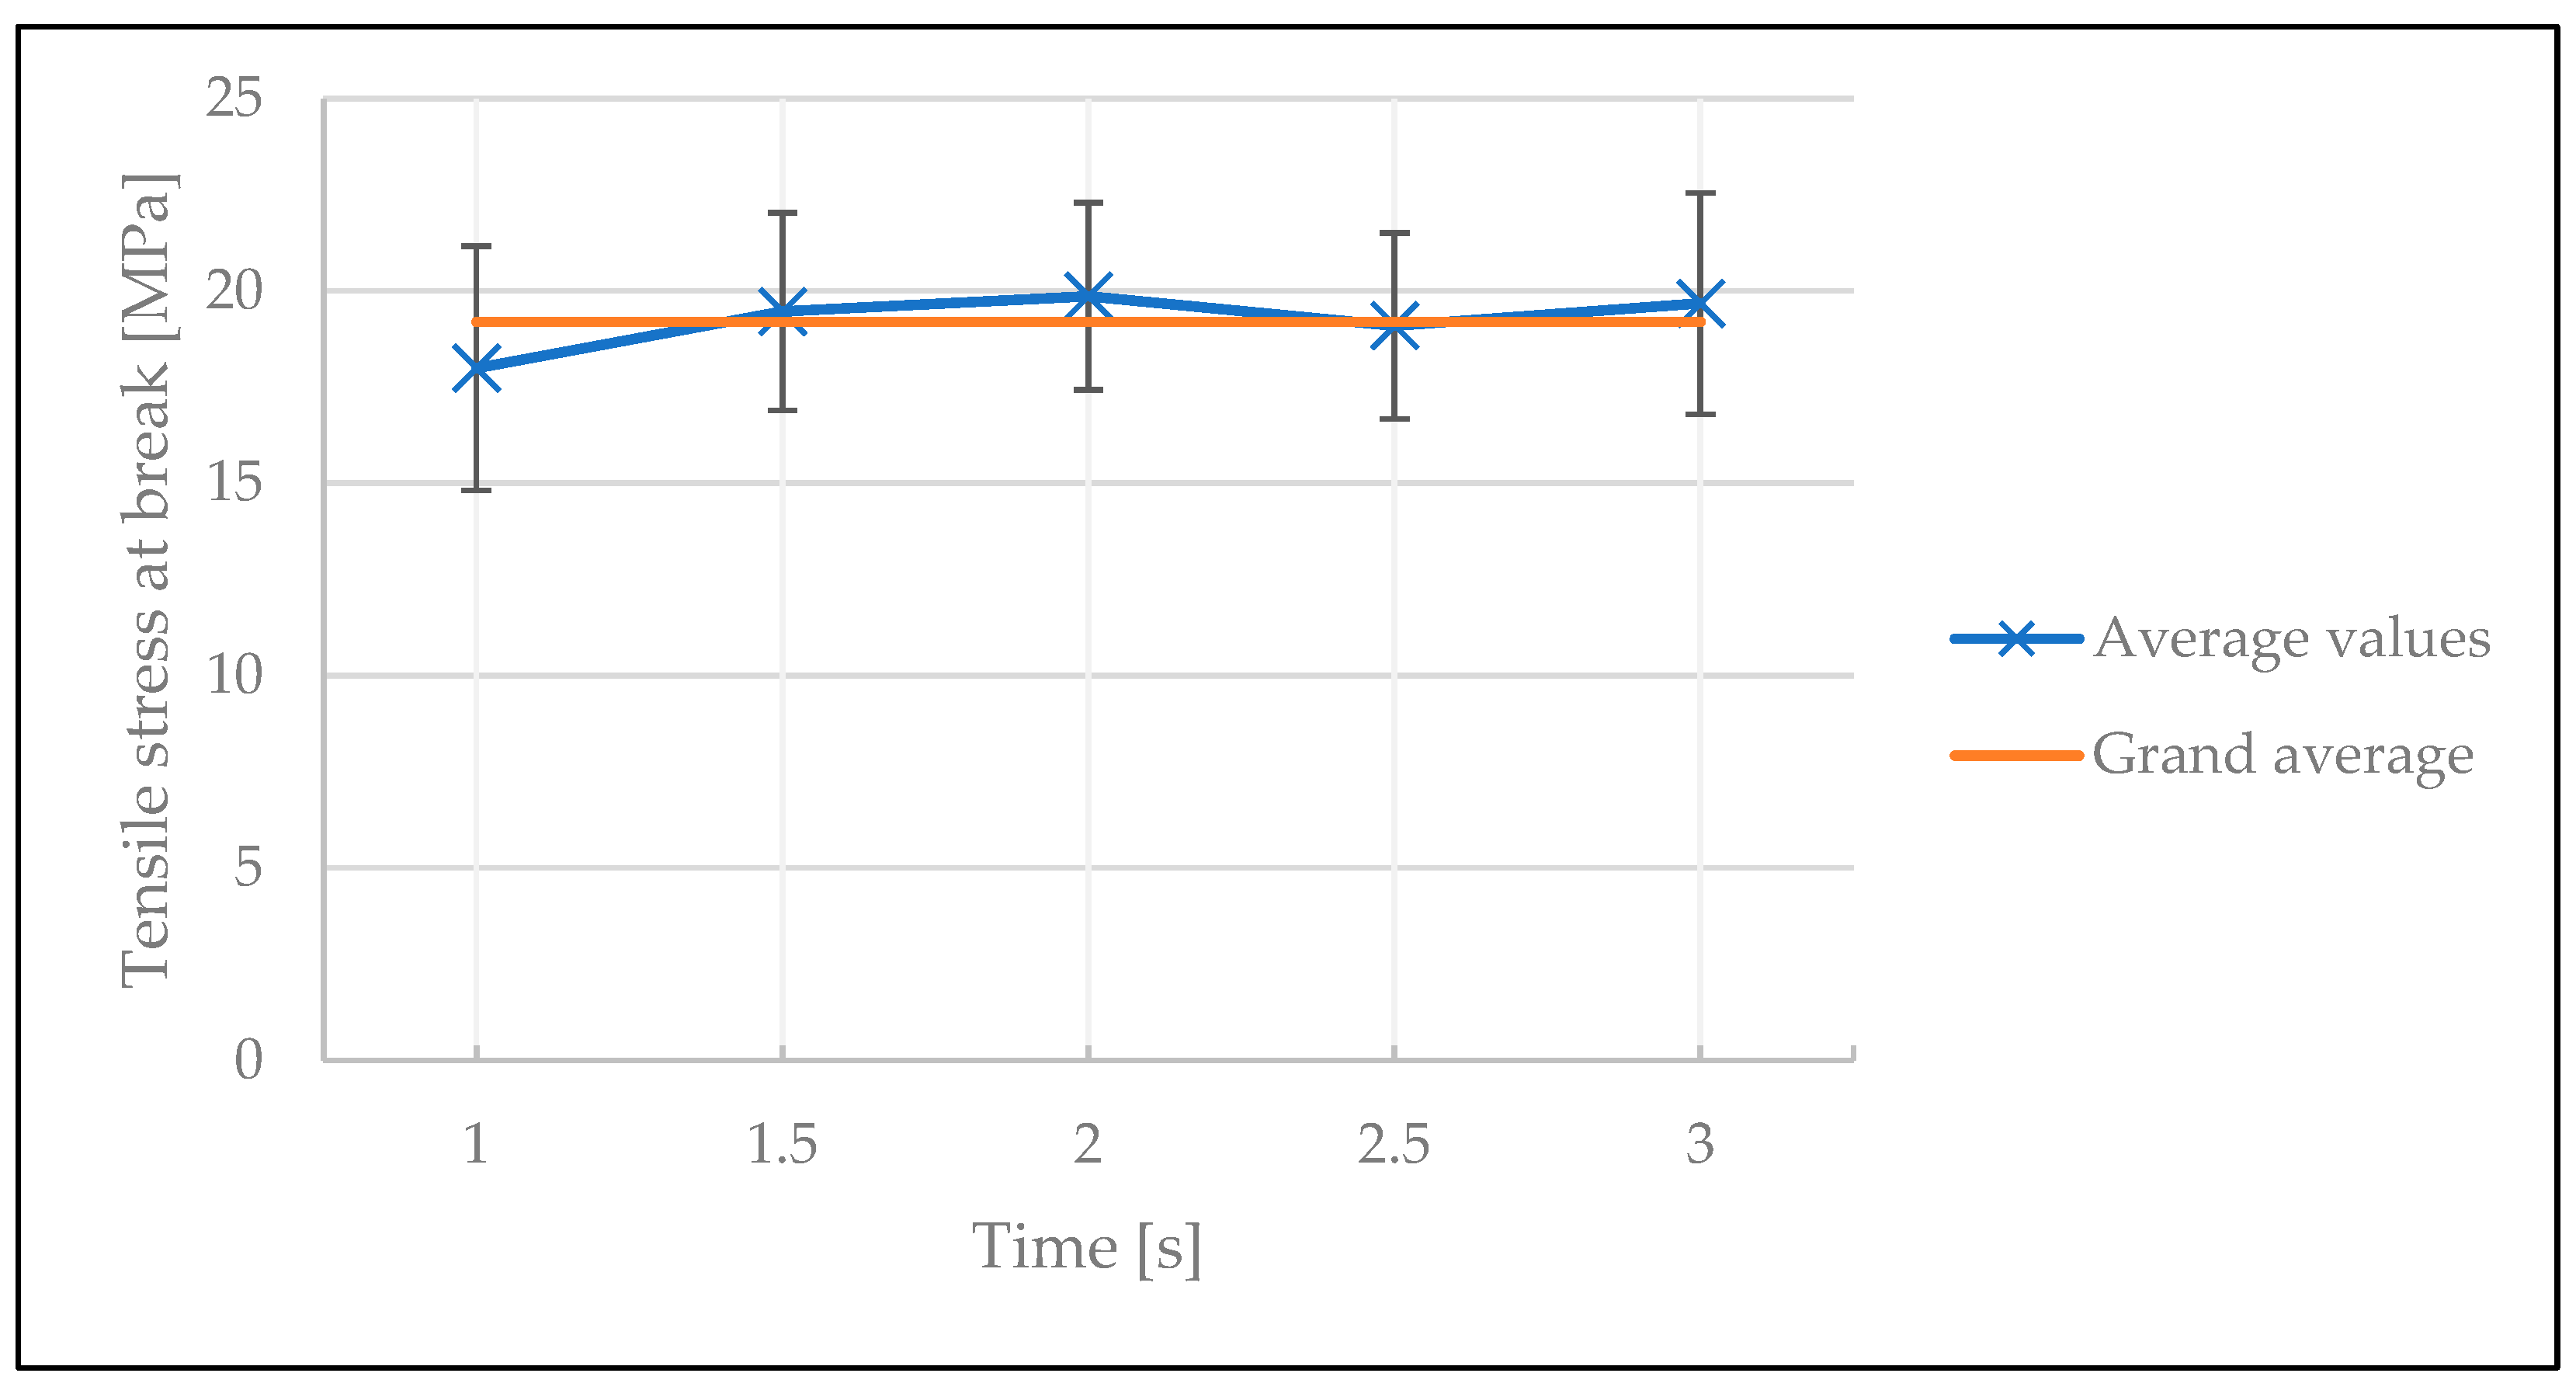
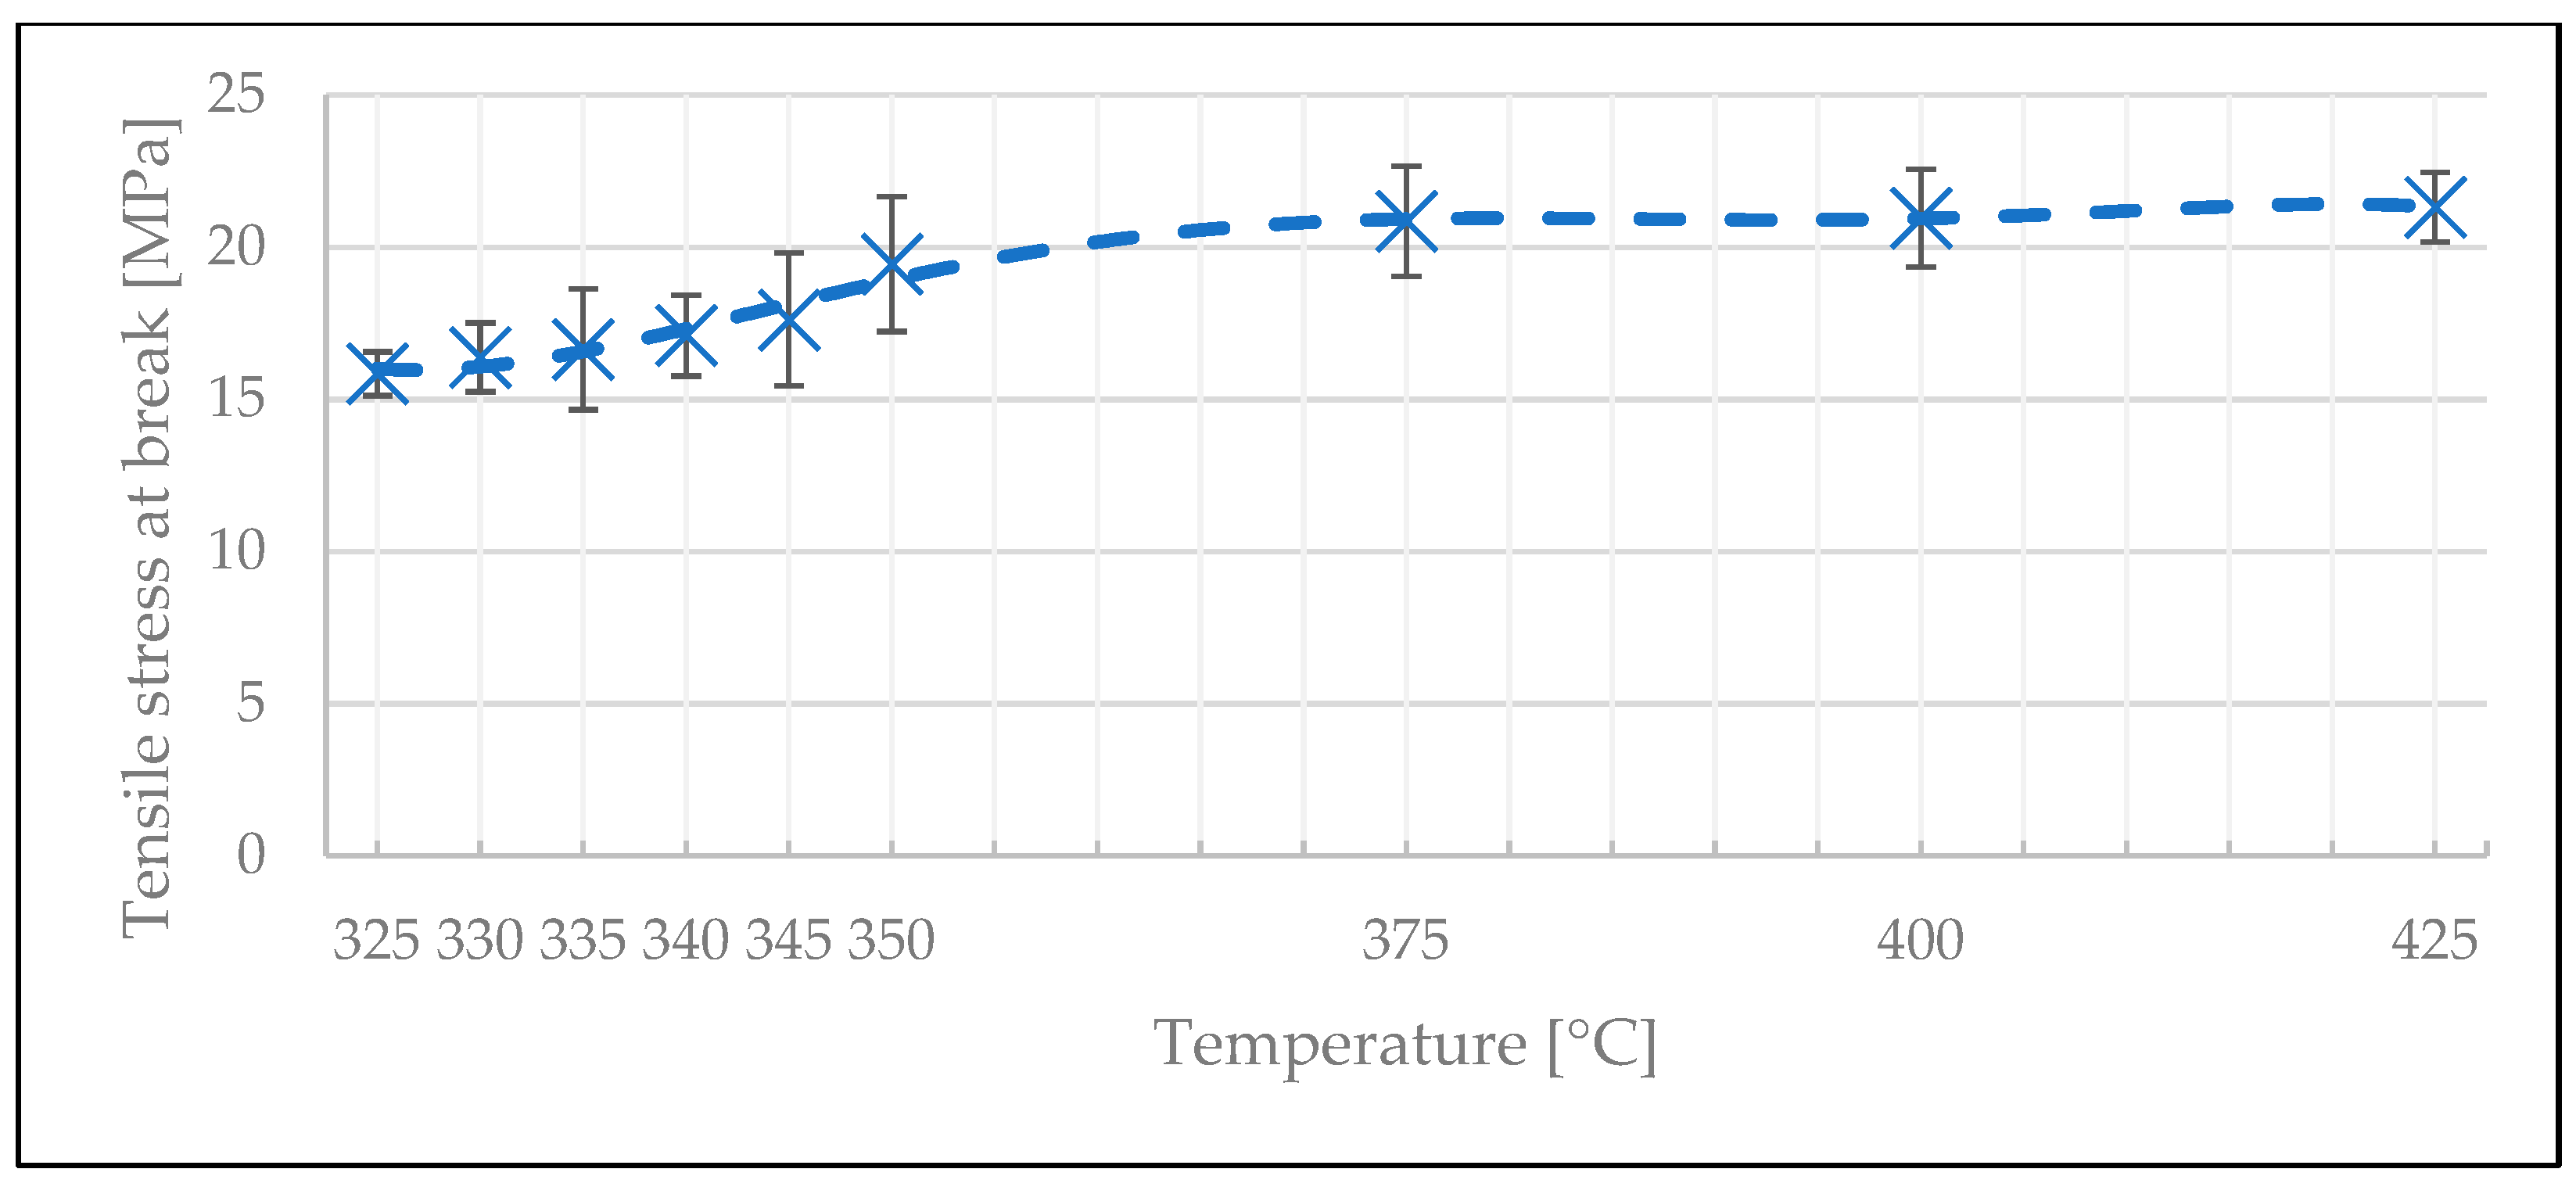
| Temperature [°C] | Time [s] | Average Stress at Break [MPa] | Standard Deviation of Stress at Break [MPa] |
|---|---|---|---|
| 325 | 1 | 14.17 | 1.06 |
| 325 | 1.5 | 15.85 | 0.71 |
| 325 | 2 | 16.71 | 2.2 |
| 325 | 2.5 | 16.84 | 1.77 |
| 325 | 3 | 16.03 | 0.89 |
| 350 | 1 | 16.28 | 1.84 |
| 350 | 1.5 | 18.83 | 1.28 |
| 350 | 2 | 19.46 | 2.22 |
| 350 | 2.5 | 19.1 | 0.97 |
| 350 | 3 | 19.25 | 0.81 |
| 375 | 1 | 18.07 | 1.66 |
| 375 | 1.5 | 18.83 | 0.65 |
| 375 | 2 | 20.86 | 1.81 |
| 375 | 2.5 | 21.57 | 2.7 |
| 375 | 3 | 23.26 | 3 |
| 400 | 1 | 21.21 | 3.08 |
| 400 | 1.5 | 22.66 | 1.38 |
| 400 | 2 | 20.96 | 1.61 |
| 400 | 2.5 | 19.92 | 1.67 |
| 400 | 3 | 20.74 | 2.37 |
| 425 | 1 | 20.24 | 1.29 |
| 425 | 1.5 | 21.14 | 1.26 |
| 425 | 2 | 21.32 | 1.15 |
| 425 | 2.5 | 17.65 | 1.06 |
| 425 | 3 | 19.09 | 1.53 |
| ANOVA | ||||||
|---|---|---|---|---|---|---|
| Source of Variation | SS | df | MS | F | p-value | F crit |
| Between Groups | 0.057349 | 2 | 0.028674 | 44.47129 | 2.82 × 10⁻⁶ | 3.885294 |
| Within Groups | 0.007737 | 12 | 0.000645 | |||
| Total | 0.065086 | 14 |
| ANOVA | ||||||
|---|---|---|---|---|---|---|
| Source of Variation | SS | df | MS | F | p-value | F crit |
| Between Groups | 0.00046 | 2 | 0.00023 | 0.042682 | 0.958361 | 3.885294 |
| Within Groups | 0.064626 | 12 | 0.005386 | |||
| Total | 0.065086 | 14 |
| ANOVA | ||||||
|---|---|---|---|---|---|---|
| Source of Variation | SS | df | MS | F | p-value | F crit |
| Between Groups | 0.002902 | 2 | 0.001451 | 0.280015 | 0.760578 | 3.885294 |
| Within Groups | 0.062184 | 12 | 0.005182 | |||
| Total | 0.065086 | 14 |
References
- Biron, M. Thermosets and Composites. In Material Selection, Applications, Manufacturing and Cost Analysis, 2nd ed.; Elsevier: Amsterdam, The Netherlands, 2014; p. 3. [Google Scholar]
- Njuguna, J. Lightweight Composite Structures in Transport: Design, Manufacturing, Analysis and Performance; Elsevier: Amsterdam, The Netherlands, 2016; p. 31. [Google Scholar]
- Ning, H.; Lu, N.; Hassen, A.A.; Chawla, K.; Selim, M.; Pillay, S. A Review of Long Fibre Thermoplastic (LFT) Composites. Int. Mater. Rev. 2020, 65, 164–188. [Google Scholar] [CrossRef]
- Gibson, R.F. A Review of Recent Research on Mechanics of Multifunctional Composite Materials and Structures. Compos. Struct. 2010, 92, 2793–2810. [Google Scholar] [CrossRef]
- Mark, H.F. Encyclopedia of Polymer Science and Technology, 3rd ed.; John Wiley and Sons Ltd.: New York, NY, USA, 2010; Volume 9, p. 283. [Google Scholar]
- Biron, M. Thermoplastics and Thermoplastic Composites; Elsevier: Amsterdam, The Netherlands, 2013; p. 770. [Google Scholar]
- Lengsfeld, H.; Wolff-Fabris, F.; Krämer, J.; Lacalle, J.; Altstädt, V. Composite Technology; Prepregs and Monolithic Part Fabrication; Hanser Publications: Munich, Germany, 2016; p. 15. [Google Scholar]
- Epple, S.; Bonten, C. Thermoplastic Composites for High Volume Production. In 16. Internationales Stuttgarter Symposium; Bargende, M., Reuss, H.-C., Wiedemann, J., Eds.; Proceedings; Springer Fachmedien Wiesbaden: Wiesbaden, Germany, 2016; pp. 227–238. ISBN 978-3-658-13254-5. [Google Scholar]
- Yao, S.-S.; Jin, F.-L.; Rhee, K.Y.; Hui, D.; Park, S.-J. Recent Advances in Carbon-Fiber-Reinforced Thermoplastic Composites: A Review. Compos. Part B Eng. 2018, 142, 241–250. [Google Scholar] [CrossRef]
- Kobler, E.; Birtha, J.; Marschik, C.; Straka, K.; Steinbichler, G.; Zwicklhuber, P.; Schlecht, S. A Novel Multi-Region, Multi-Phase, Multi-Component-Mixture Modeling Approach to Predicting the Thermodynamic Behaviour of Thermoplastic Composites during the Consolidation Process. Polymers 2022, 14, 4785. [Google Scholar] [CrossRef] [PubMed]
- Butler, C.A.; McCullough, R.L. An analysis of mechanisms governing fusion bonding of thermoplastic composites. J. Thermoplast. Compos. Mater. 1998, 11, 338–363. [Google Scholar] [CrossRef]
- Fink, B.K.; Gillespie, J.W.; Erson, N.B. Thermal degradation effects on consolidation and bonding in the thermoplastic fibre-placement process. In Report nb ARL-TR-2238; US Army Research Lab, Aberdeen Proving Ground: Adelphi, MD, USA, 2000. [Google Scholar]
- Bhudolia, S.K.; Gohel, G.; Leong, K.F.; Islam, A. Advances in Ultrasonic Welding of Thermoplastic Composites: A Review. Materials 2020, 13, 1284. [Google Scholar] [CrossRef]
- Yousefpour, A.; Hojjati, M.; Immarigeon, J.-P. Fusion Bonding/Welding of Thermoplastic Composites. J. Thermoplast. Compos. Mater. 2004, 17, 303–341. [Google Scholar] [CrossRef]
- Zhang, J.; de Souza, M.; Creighton, C.; Varley, R.J. New Approaches to Bonding Thermoplastic and Thermoset Polymer Composites. Compos. Part A Appl. Sci. Manuf. 2020, 133, 105870. [Google Scholar] [CrossRef]
- Aalto-Korte, K.; Suuronen, K. Plastic Materials and Glues. In Contact Dermatitis; Johansen, J.D., Mahler, V., Lepoittevin, J.-P., Frosch, P.J., Eds.; Springer International Publishing: Cham, Switzerland, 2019; pp. 1–28. ISBN 978-3-319-72451-5. [Google Scholar]
- Banea, M.D.; da Silva, L.F.M. Adhesively Bonded Joints in Composite Materials: An Overview. Proc. Inst. Mech. Eng. Part L J. Mater. Des. Appl. 2009, 223, 1–18. [Google Scholar] [CrossRef]
- Don, R.C.; Gillespie, J.W.; McKnight, S.H. Bonding Techniques for High Performance Thermoplastic. Compositions. Patent 5643390, 1 July 1997. [Google Scholar]
- Fernandez Villegas, I.; Vizcaino Rubio, P. On Avoiding Thermal Degradation during Welding of High-Performance Thermoplastic Composites to Thermoset Composites. Compos. Part A Appl. Sci. Manuf. 2015, 77, 172–180. [Google Scholar] [CrossRef]
- Ageorges, C.; Ye, L.; Hou, M. Advances in Fusion Bonding Techniques for Joining Thermoplastic Matrix Composites: A Review. Compos. Part A Appl. Sci. Manuf. 2001, 32, 839–857. [Google Scholar] [CrossRef]
- Vinayak, J.K.; Roos, L.W.M. Welding of Thermoplastic Composites; Faculty of Engineering Technologies, University of Twente: Enschede, The Netherlands, 2016. [Google Scholar] [CrossRef]
- Wise, R.J.; Froment, I.D. Microwave welding of thermoplastics. J. Mater. Sci. 2001, 36, 5935–5954. [Google Scholar] [CrossRef]
- Ku, H.S.; Siu, F.; Siores, E.; Ball, J.A.R. Variable Frequency Microwave (VFM) Processing Facilities and Application in Processing Thermoplastic Matrix Composites. J. Mater. Process. Technol. 2003, 139, 291–295. [Google Scholar] [CrossRef]
- Knapp, W.; Clement, S.; Franz, C.; Oumarou, M.; Renard, J. Laser-Bonding of Long Fiber Thermoplastic Composites for Structural Assemblies. Phys. Procedia 2010, 5, 163–171. [Google Scholar] [CrossRef]
- Jaeschke, P.; Wippo, V.; Suttmann, O.; Overmeyer, L. Advanced Laser Welding of High-Performance Thermoplastic Composites. J. Laser Appl. 2015, 27, S29004. [Google Scholar] [CrossRef]
- Costa, A.P.; da Botelho, E.C.; Costa, M.L.; Narita, N.E.; Tarpani, J.R. A Review of Welding Technologies for Thermoplastic Composites in Aerospace Applications. J. Aerosp. Technol. Manag. 2012, 4, 255–266. [Google Scholar] [CrossRef]
- Ahmadi, H.; Mostafa Arab, N.B.; Ghasemi, F.A. Optimization of Process Parameters for Friction Stir Lap Welding of Carbon Fibre Reinforced Thermoplastic Composites by Taguchi Method. J. Mech. Sci. Technol. 2014, 28, 279–284. [Google Scholar] [CrossRef]
- Bhudolia, S.K.; Gohel, G.; Kantipudi, J.; Leong, K.F.; Barsotti, R.J. Ultrasonic Welding of Novel Carbon/Elium® Thermoplastic Composites with Flat and Integrated Energy Directors: Lap Shear Characterisation and Fractographic Investigation. Materials 2020, 13, 1634. [Google Scholar] [CrossRef]
- Zhang, G.; Lin, T.; Luo, L.; Zhang, B.; Qu, Y.; Meng, B. Multi-Objective Optimization of Resistance Welding Process of GF/PP Composites. Polymers 2021, 13, 2560. [Google Scholar] [CrossRef]
- Huang, Y.; Meng, X.; Xie, Y.; Wan, L.; Lv, Z.; Cao, J.; Feng, J. Friction Stir Welding/Processing of Polymers and Polymer Matrix Composites. Compos. Part A Appl. Sci. Manuf. 2018, 105, 235–257. [Google Scholar] [CrossRef]
- Talbot, É.; Hubert, P.; Dubé, M.; Yousefpour, A. Optimization of Thermoplastic Composites Resistance Welding Parameters Based on Transient Heat Transfer Finite Element Modeling. J. Thermoplast. Compos. Mater. 2013, 26, 699–717. [Google Scholar] [CrossRef]
- Shi, H.; Fernandez-Villegas, I.; Bersee, H.E.N. Modelling of heat transfer and consolidation for thermoplastic composites resistance welding. In Proceedings of the ICCM International Conferences on Composite Materials, Jeju, Korea, 21–26 August 2011. [Google Scholar]
- Dubé, M.; Chazerain, A.; Hubert, P.; Yousefpour, A.; Bersee, H.E. Characterization of Resistance-Welded Thermoplastic Composite Double-Lap Joints under Static and Fatigue Loading. J. Thermoplast. Compos. Mater. 2015, 28, 762–776. [Google Scholar] [CrossRef]
- Kumar, R.; Singh, R.; Ahuja, I.; Fortunato, A. Thermo-Mechanical Investigations for the Joining of Thermoplastic Composite Structures via Friction Stir Spot Welding. Compos. Struct. 2020, 253, 112772. [Google Scholar] [CrossRef]
- Katsiropoulos, C.V.; Moraitis, G.A.; Labeas, G.N.; Pantelakis, S.G. Optimization of laser welding process for thermoplastic composite materials with regard to quality and cost. Plast. Rubber Compos. 2009, 38, 153–161. [Google Scholar] [CrossRef]
- Paoletti, A.; Lambiase, F.; Di Ilio, A. Optimization of Friction Stir Welding of Thermoplastics. Procedia CIRP 2015, 33, 562–567. [Google Scholar] [CrossRef]
- Raza, S.F.; Khan, S.A.; Mughal, M.P. Optimizing the Weld Factors Affecting Ultrasonic Welding of Thermoplastics. Int. J. Adv. Manuf. Technol. 2019, 103, 2053–2067. [Google Scholar] [CrossRef]
- Jaiganesh, V.; Maruthu, B.; Gopinath, E. Optimization of Process Parameters on Friction Stir Welding of High Density Polypropylene Plate. Procedia Eng. 2014, 97, 1957–1965. [Google Scholar] [CrossRef]
- Colak, Z.S.; Sonmez, F.O.; Kalenderoglu, V. Process Modeling and Optimization of Resistance Welding for Thermoplastic Composites. J. Compos. Mater. 2002, 36, 721–744. [Google Scholar] [CrossRef]
- Sonmez, F.O.; Hahn, H.T. Analysis of the On-Line Consolidation Process in Thermoplastic Composite Tape Placement. J. Thermoplast. Compos. Mater. 1997, 10, 543–572. [Google Scholar] [CrossRef]


| Material | Property | Value |
|---|---|---|
| Matrix | Melt mass-flow rate [g/10 min] | 37 |
| Density [kg/m3] | 1190 | |
| Glass transition temperature [°] | 145 | |
| Tensile modulus [MPa] | 2400 | |
| Yield stress [MPa, at 50 mm/s] | 65 | |
| Fiber | Density [g/cm3] | 1.82 |
| Denier [den] | 14,400 | |
| Tensile modulus [GPa] | 36 |
| Process Parameters | Values | Metrics |
|---|---|---|
| Temperature [°C] | 300 325 350 375 400 | Welded area Maximum force Tensile stress |
| Welding time [s] | 0.5 1 1.5 2 |
| Process Parameters | Values | Metrics |
|---|---|---|
| Temperature [°C] | 325 350 375 400 425 At 2 s weld time: 330 335 340 345 | Welded area Maximum force Tensile stress |
| Welding time [s] | 1 1.5 2 2.5 3 |
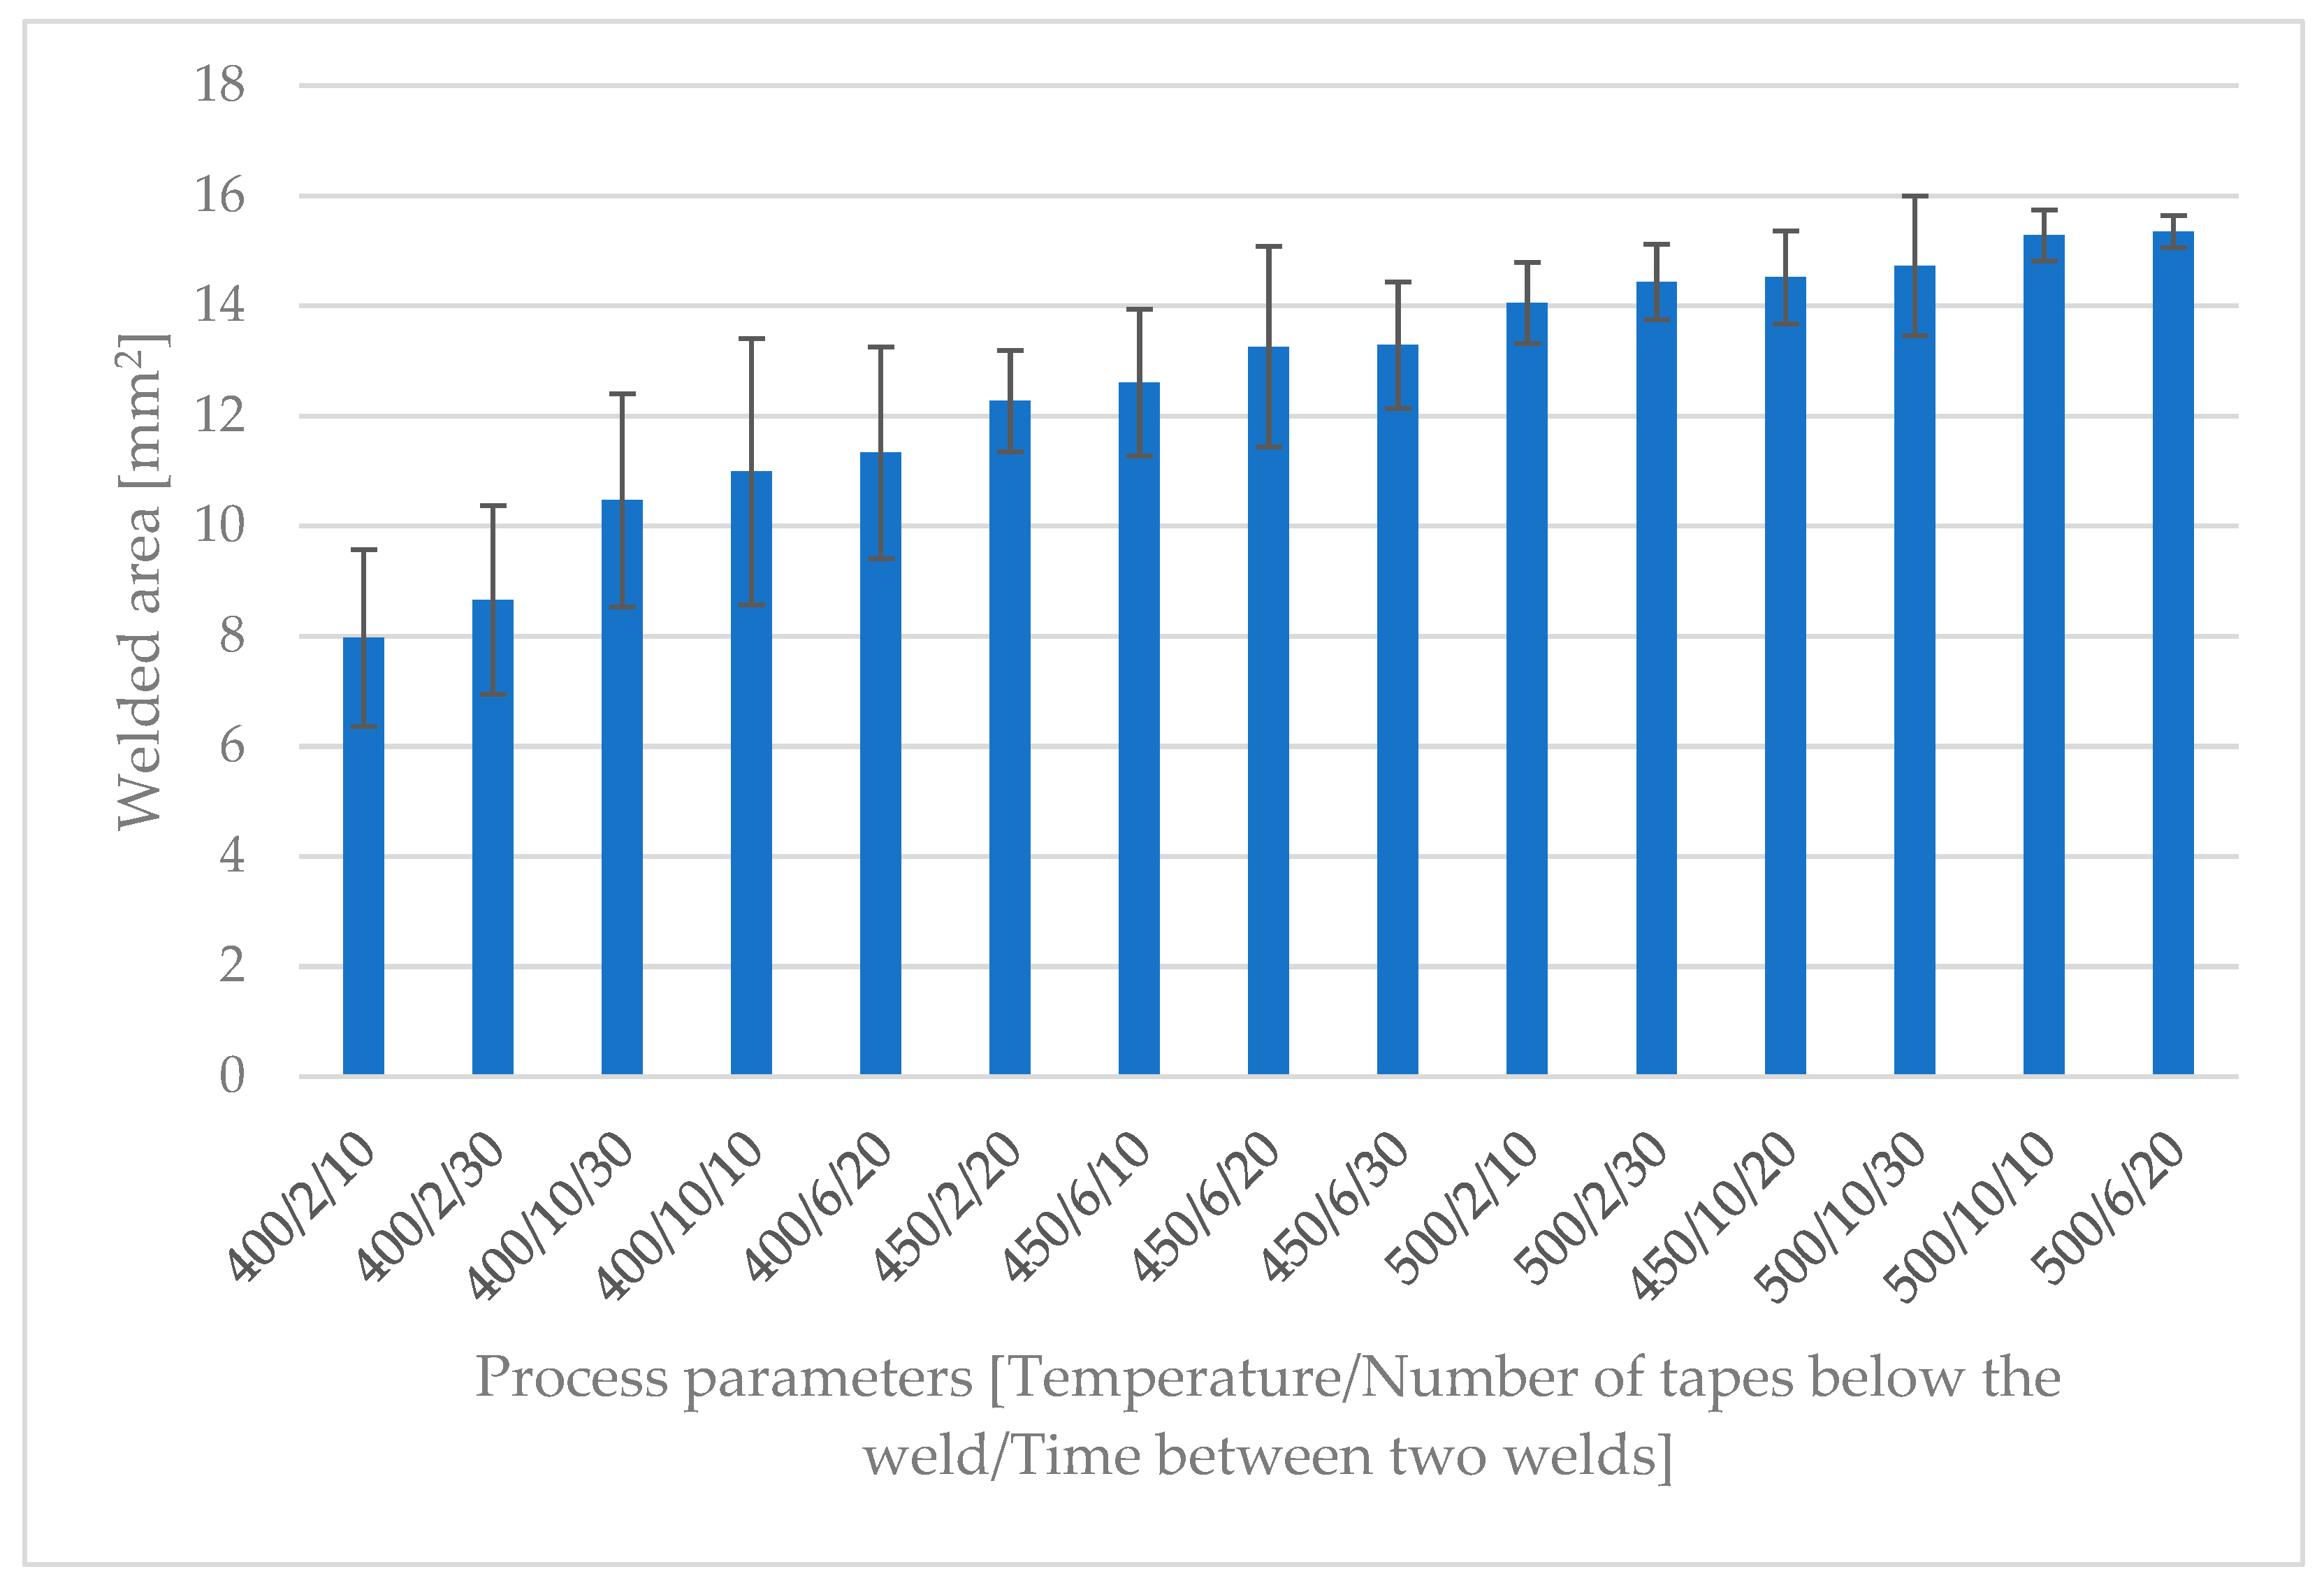
| Process Parameters | Values | Metrics |
|---|---|---|
| Temperature [°C] | 400 450 500 | Welded area Gel Permeation Chromatography |
| Time between two welds [s] | 10 20 30 | |
| Number of tapes below the weld [-] | 2 6 10 |
Disclaimer/Publisher’s Note: The statements, opinions and data contained in all publications are solely those of the individual author(s) and contributor(s) and not of MDPI and/or the editor(s). MDPI and/or the editor(s) disclaim responsibility for any injury to people or property resulting from any ideas, methods, instructions or products referred to in the content. |
© 2023 by the authors. Licensee MDPI, Basel, Switzerland. This article is an open access article distributed under the terms and conditions of the Creative Commons Attribution (CC BY) license (https://creativecommons.org/licenses/by/4.0/).
Share and Cite
Birtha, J.; Marschik, C.; Kobler, E.; Straka, K.; Steinbichler, G.; Schlecht, S.; Zwicklhuber, P. Optimizing the Process of Spot Welding of Polycarbonate-Matrix-Based Unidirectional (UD) Thermoplastic Composite Tapes. Polymers 2023, 15, 2182. https://doi.org/10.3390/polym15092182
Birtha J, Marschik C, Kobler E, Straka K, Steinbichler G, Schlecht S, Zwicklhuber P. Optimizing the Process of Spot Welding of Polycarbonate-Matrix-Based Unidirectional (UD) Thermoplastic Composite Tapes. Polymers. 2023; 15(9):2182. https://doi.org/10.3390/polym15092182
Chicago/Turabian StyleBirtha, Janos, Christian Marschik, Eva Kobler, Klaus Straka, Georg Steinbichler, Sven Schlecht, and Paul Zwicklhuber. 2023. "Optimizing the Process of Spot Welding of Polycarbonate-Matrix-Based Unidirectional (UD) Thermoplastic Composite Tapes" Polymers 15, no. 9: 2182. https://doi.org/10.3390/polym15092182