Communication

Fabrication and Characterization of Electrospun Cu-Doped TiO2 Nanofibers and Enhancement of Photocatalytic Performance Depending on Cu Content and Electron Beam Irradiation

1
Department of Advanced Materials Engineering, Gangneung-Wonju National University, 7 Jukheongil, Gangneung 25457, Republic of Korea
2
Smart Hydrogen Energy Center, Gangneung-Wonju National University, 7 Jukheongil, Gangneung 25457, Republic of Korea
3
Research Institute for Dental Engineering, Gangneung-Wonju National University, 7 Jukheongil, Gangneung 25457, Republic of Korea
4
Department of Energy Science, Sungkyunkwan University, Suwon 16419, Republic of Korea
*
Author to whom correspondence should be addressed.
These authors contributed equally to this work.
Polymers 2024, 16(5), 694; https://doi.org/10.3390/polym16050694
Submission received: 25 January 2024 / Revised: 16 February 2024 / Accepted: 23 February 2024 / Published: 4 March 2024
(This article belongs to the Special Issue Electrospun Nanofibers: Current Advances and Future Perspective)

Abstract

:
Titanium dioxide (TiO₂) is a widely studied material with many attractive properties such as its photocatalytic features. However, its commercial use is limited due to issues such as deactivation in the visible spectrum caused by its wide bandgap and the short lifetime of photo-excited charge carriers. To overcome these challenges, various modifications could be considered. In this study, we investigated copper doping and electron beam treatment. As-spun TiO2 nanofibers were fabricated by electrospinning a TiO2 sol, which obtained viscosity through a polyvinylpyrrolidone (PVP) matrix. Cu-doped TiO2 nanofibers with varying dopant concentrations were synthesized by adding copper salts. Then, the as-spun nanofibers were calcined for crystallization. To evaluate photocatalytic performance, a photodegradation test of methylene blue aqueous solution was performed for 6 h. Methylene blue concentration was measured over time using UV-Vis spectroscopy. The results showed that Cu doping at an appropriate concentration and electron-beam irradiation showed improved photocatalytic efficiency compared to bare TiO2 nanofibers. When the molar ratio of Cu/Ti was 0.05%, photodegradation rate was highest, which was 10.39% higher than that of bare TiO2. As a result of additional electron-beam treatment of this sample, photocatalytic efficiency improved up to 8.93% compared to samples without electron-beam treatment.

Graphical Abstract

1. Introduction

In modern society, the emission of environmental pollutants such as waste, wastewater, and smoke are increasing due to population growth and industrial development [1,2,3]. As solutions to these issues are demanded, interest in eco-friendly and effective water treatment systems is increasing [4,5]. There are various water treatment methods utilizing mechanisms such as filtration, coagulation, centrifugation, and flocculation [6,7,8,9]. Among these, photocatalytic degradation, which harnesses renewable energy, has attracted attention for its efficient cost-effectiveness and environmentally friendly advantages [10,11,12]. Due to their cost efficiency and durability, transition metal-based semiconductors like TiO2, CdS, ZrO2, ZnO, and WO3 are commonly discussed as representative photocatalyst materials [13,14,15,16]. When semiconductor photocatalysts are exposed to light with a wavelength equal to or smaller than their energy bandgap, electrons in the valence band become excited to the conduction band, forming electron–hole pairs. As these charge carriers diffuse to the surface of the photocatalyst, they react with water and then generate free radicals such as superoxide (•O2) or hydroxyl radicals (•OH). These radicals contact pollutants in water, resulting in the decomposition of molecular structures [16,17]. Since the demonstration of water splitting using ultraviolet light by Honda and Fujishima in 1972, TiO2 has become the most widely researched photocatalytic material [18,19,20]. Due to its low cost, high chemical stability, and non-toxic properties, TiO2 is a suitable material for photocatalytic applications [21,22,23]. However, the wide bandgap of 3.2 eV restricts its reaction in the visible light spectrum, and the rapid recombination of photoexcited electron–hole pairs poses a challenge for applying TiO2 as a photocatalyst [24,25]. To overcome the challenges associated with TiO2 photocatalysts, many studies have applied methods such as impurity doping, heterojunction constructions, surface/microstructure modification, and sensitization [26,27,28,29,30,31,32]. However, it is difficult to find studies that irradiate electron beams on Cu-doped TiO2 nanofibers. In this study, TiO2 nanofibers (TNFs) were fabricated using an electrospinning process, and the effects of copper doping and electron-beam (e-beam) treatment on photocatalytic performance were evaluated. The electrospinning process can fabricate nanoscale samples simply and inexpensively and is widely used due to its high yield [33,34]. TiO2 in nanofiber form has a high aspect ratio and good mechanical properties, which can improve photocatalytic performance [35,36]. Copper (Cu) is abundant in nature and inexpensive. In addition to its metallic form, both Cu(I) and Cu(II) species (including Cu2O and CuO) act as electron mediators, enhancing charge transfer and broadening the absorption spectrum into the long-wavelength region [37,38]. Therefore, copper doping can be an economical method to improve the efficiency of TiO2 photocatalysts. Furthermore, high-energy e-beam treatment can induce changes in crystal field energy, bonding states, and electronic structures, leading to greater enhancement in photocatalytic performance [39,40]. In this study, photocatalytic performance was evaluated through photodegradation tests using methylene blue (MB) solution. An MB photodegradation test was performed using samples with different molar ratios of copper to confirm the dopant concentration that optimizes photocatalytic performance. Subsequently, e-beams at different radiation doses were irradiated to samples with the optimal dopant concentration, and the MB photodegradation test was repeated. It was proven that photolysis efficiency increases as the electron beam irradiation dose increases. These results show that photocatalytic performance is improved by transition metal doping and high-energy e-beam treatment.

2. Results and Discussion

2.1. FE-SEM

FE-SEM images were obtained to observe the microstructure of TNFs fabricated via electrospinning. Figure 1 shows the as-spun bare and Cu-doped TNFs, while Figure 2 shows the TNFs after calcination. As can be seen in Figure 1 and Figure 2, even after the removal of the PVP matrix through calcination, the nanofibers retained a homogeneous and continuous surface and morphology. The average diameter of the TNFs was determined by measuring at least 200 diameters from each sample, using the open-source software Image-J (ver. 1.8.0). The average diameters of the calcined TNFs were measured to be 377.52 nm, 317.71 nm, 316.77 nm, and 243.19 nm, respectively, as shown in Figure 3. As the Cu content increased, the average diameter of the TNFs decreased. Numerous studies have indicated that a reduction in fiber diameter may lead to an increased specific surface area, potentially enhancing photocatalytic efficiency [41,42,43].
Figure 4 presents the results of the Energy-dispersive X-ray spectroscopy (EDS) mapping of TNF2. After calcination, the presence of Ti, O, and Cu in the fibers was confirmed, and it was observed that the Cu signal was evenly distributed throughout the TiO2 nanofibers.

2.2. Photocatalytic Efficiency Depending on Cu Content
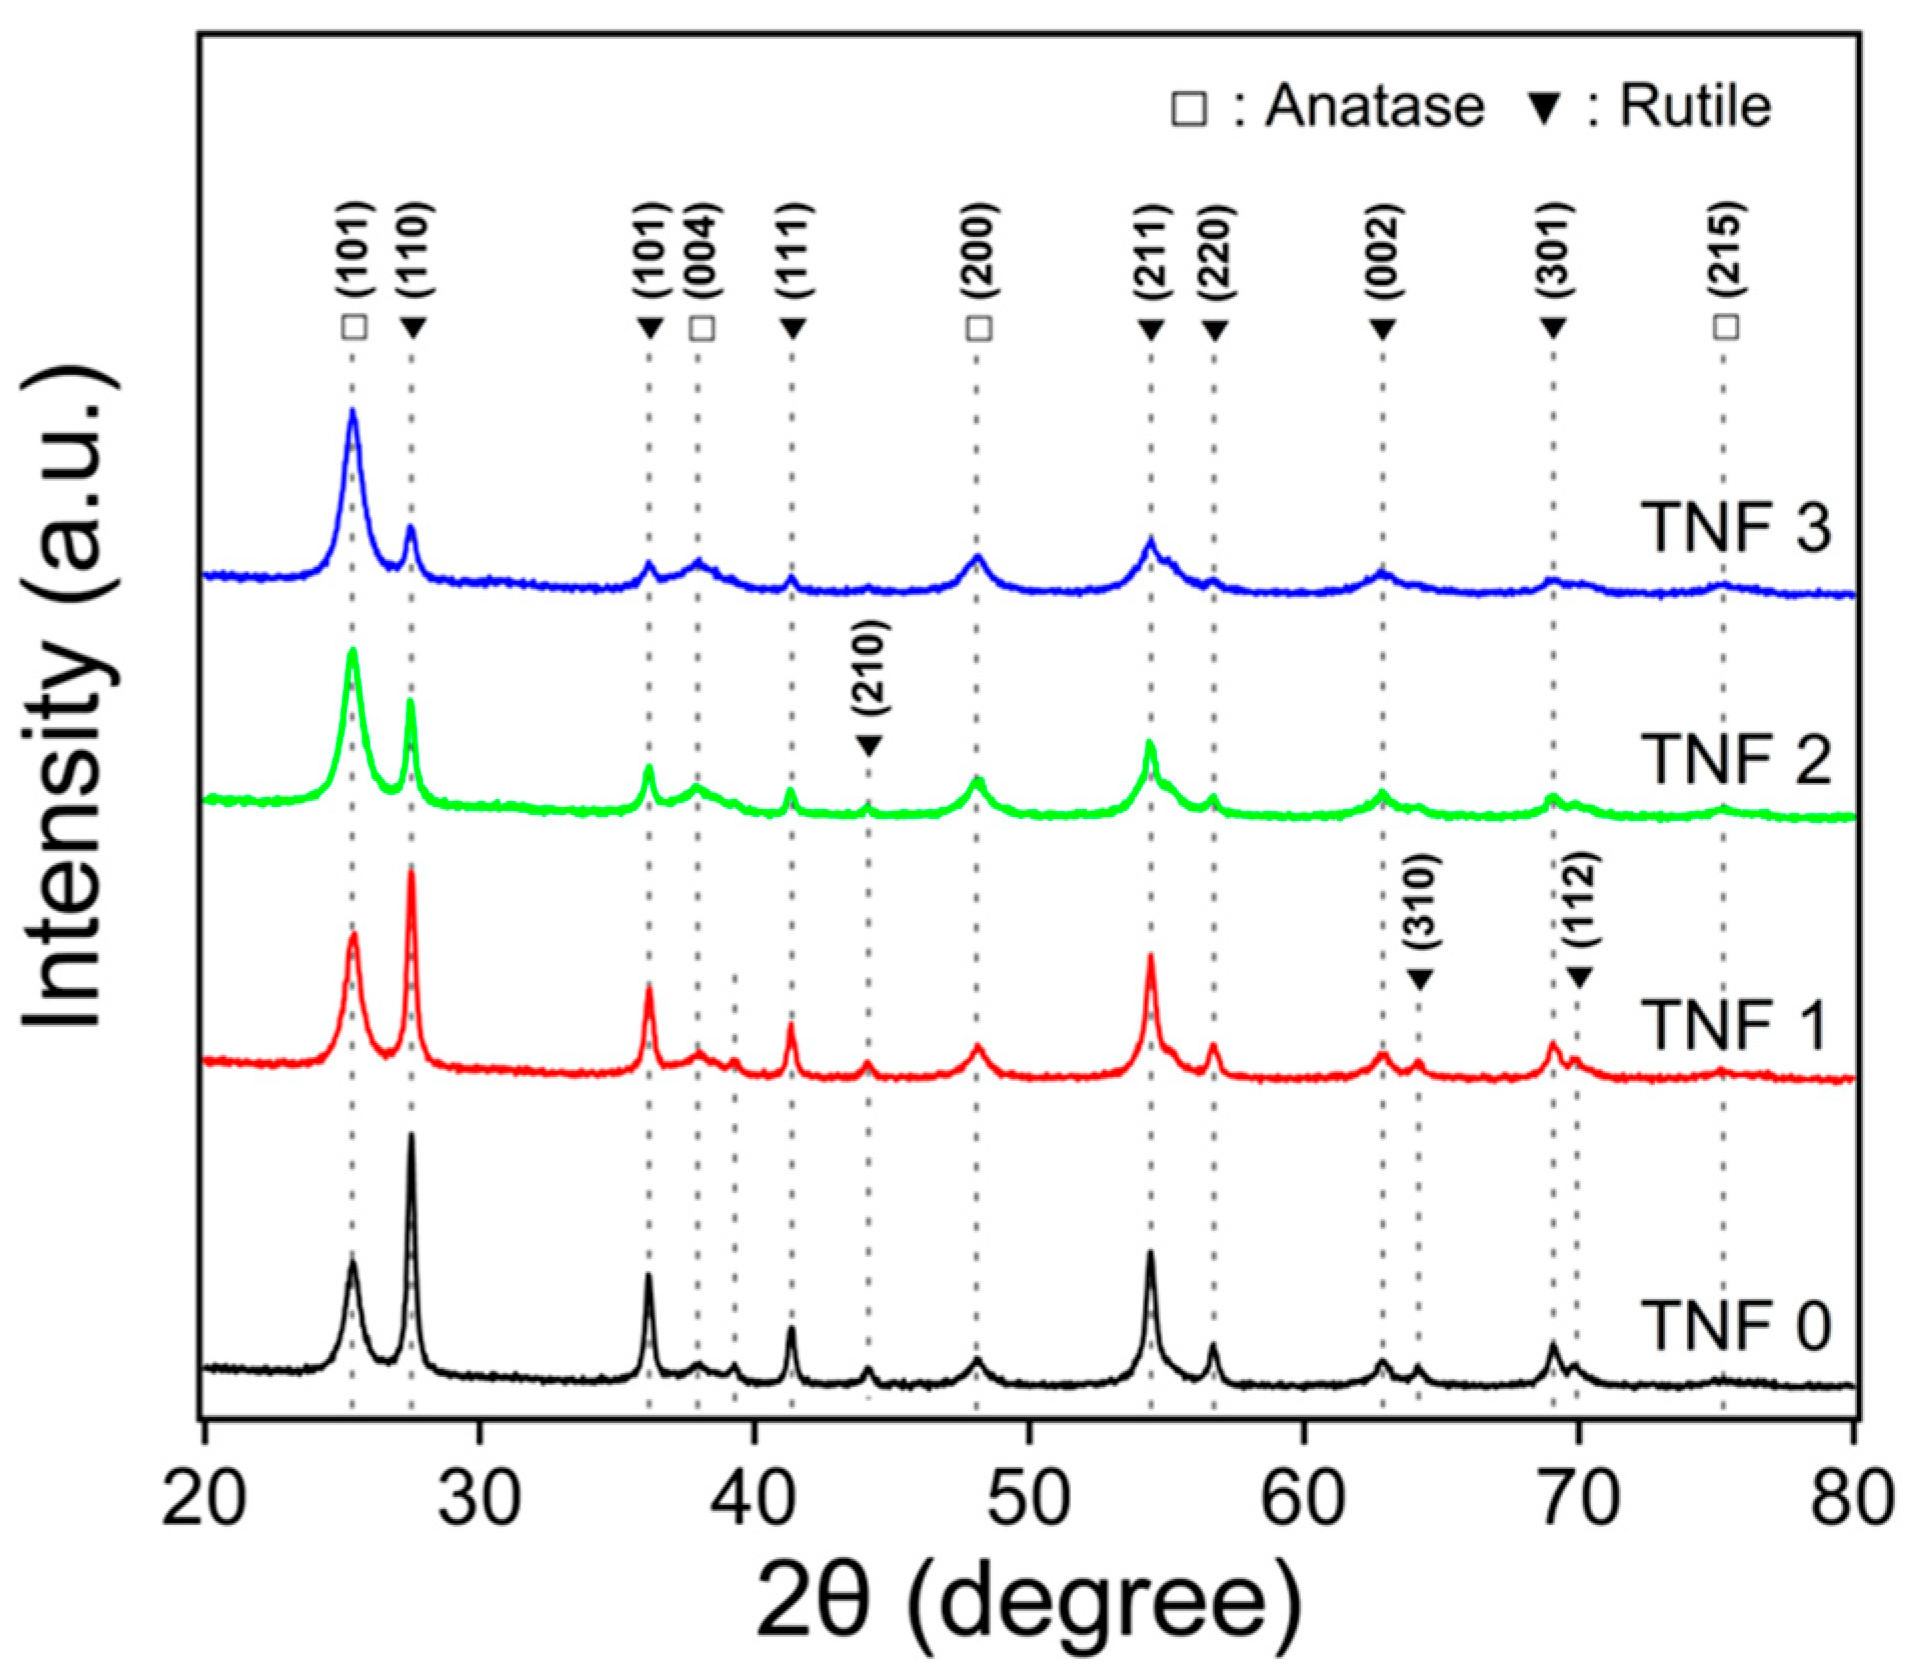
The photocatalytic activity according to the Cu content was evaluated by the degradation of methylene blue (MB) in an aqueous solution. Figure 5 shows the absorption spectrum of the MB aqueous solution, sampled every hour during the photocatalytic reaction. A weakening absorption peak over time indicates the photodegradation of MB molecules by the TNFs. The maximum absorbance of MB was designated as the C value to calculate normalized values (C/C0) and ln(C0/C). The C value considers the fact that the maximum absorption wavelength is shifted to a shorter wavelength due to N-demethylation of methylene blue during the reaction process [44,45]. The changes in C/C0 and ln(C0/C) values over time are shown in Figure 6. The MB dye degradation rate was determined using the following Equation (1):
R e m o v a l % = C 0 C x C 0 × 100
C0 is the initial concentration of the MB aqueous solution and Cx is the concentration at time t.
As can be seen in Table 1, TNF2 was confirmed to have the highest photocatalytic activity. The addition of Cu was observed to improve the photodegradation rate. Many studies suggest that transition metals and metal doping can reduce the band gap of TiO2 and induce oxygen vacancies, thereby improving photocatalytic efficiency [46,47,48,49,50]. CuO and Cu2O have a lower Fermi level than TiO2, which leads to the transfer of excited electrons from TiO2 to CuO and Cu2O [51]. Cu2+ ions form Cu+ ions while acting as traps to capture photoexcited electrons of TiO2 (Equation (2)), and this electron trapping is effective in reducing the electron–hole recombination rate [51,52,53,54,55,56,57]. Cu+ ions can accelerate interfacial electron transfer by transferring electrons to oxygen adsorbed on the catalyst surface [56,57,58]. Equation (3) is the related reaction equation:
C u 2 + + e C u +
C u + + O a d s C u 2 + + O a d s
However, TNF3 showed lower photocatalytic activity than TNF0, which was undoped with Cu. This observation can be attributed to research findings indicating that photocatalytic activity decreases when the concentration of metal or transition metal doping exceeds a certain threshold [26,51,59,60]. Excessive oxygen vacancies and Cu species can act as recombination centers for photoexcited electron–hole pairs [51,61]. Another cause is CuO deposition on the TiO2 surface [51,61]. Therefore, an excessive dopant amount can reduce photocatalytic activity, and photocatalytic efficiency is greatly dependent on the concentration of the dopant.

2.3. XRD Analysis

Figure 7 shows the XRD diffraction pattern of Cu-doped TNFs calcined at 400 °C for 3 h. All samples exhibited the anatase phase of titanium dioxide and the rutile phase of titanium dioxide. The diffraction peaks at 2θ = 25.4°, 38.0°, 48.1°, and 75.2° correspond to the (101), (004), (200), (215) peaks, indicating the anatase phase of TiO2. Peaks at 27.5°, 36.2°, 41.3°, 44.1°, 54.4°, 56.7°, 62.8°, 64.1°, 69.1°, and 69.9° diffraction peaks are indexed with the (110), (101), (111), (210), (211), (220), (002), (310), (301), and (112) peaks, indicating the rutile phase of TiO2 [62]. In TNF2, the (310) and (112) peaks indicating the rutile phase were not observed, and in TNF3, the (210) peak was also not observed. Additionally, as the copper content increased, the peak intensity for the rutile phase decreased. Consequently, it was deduced that with an increase in Cu content, the proportion of the anatase phase became more dominant. The phase ratio of anatase and rutile for each sample are detailed in Table 2. At no concentration were crystalline phases corresponding to Cu, CuO, or Cu2O observed, suggesting that the Cu ions might be uniformly dispersed or that the amount of CuO or Cu2O was too minimal to detect.

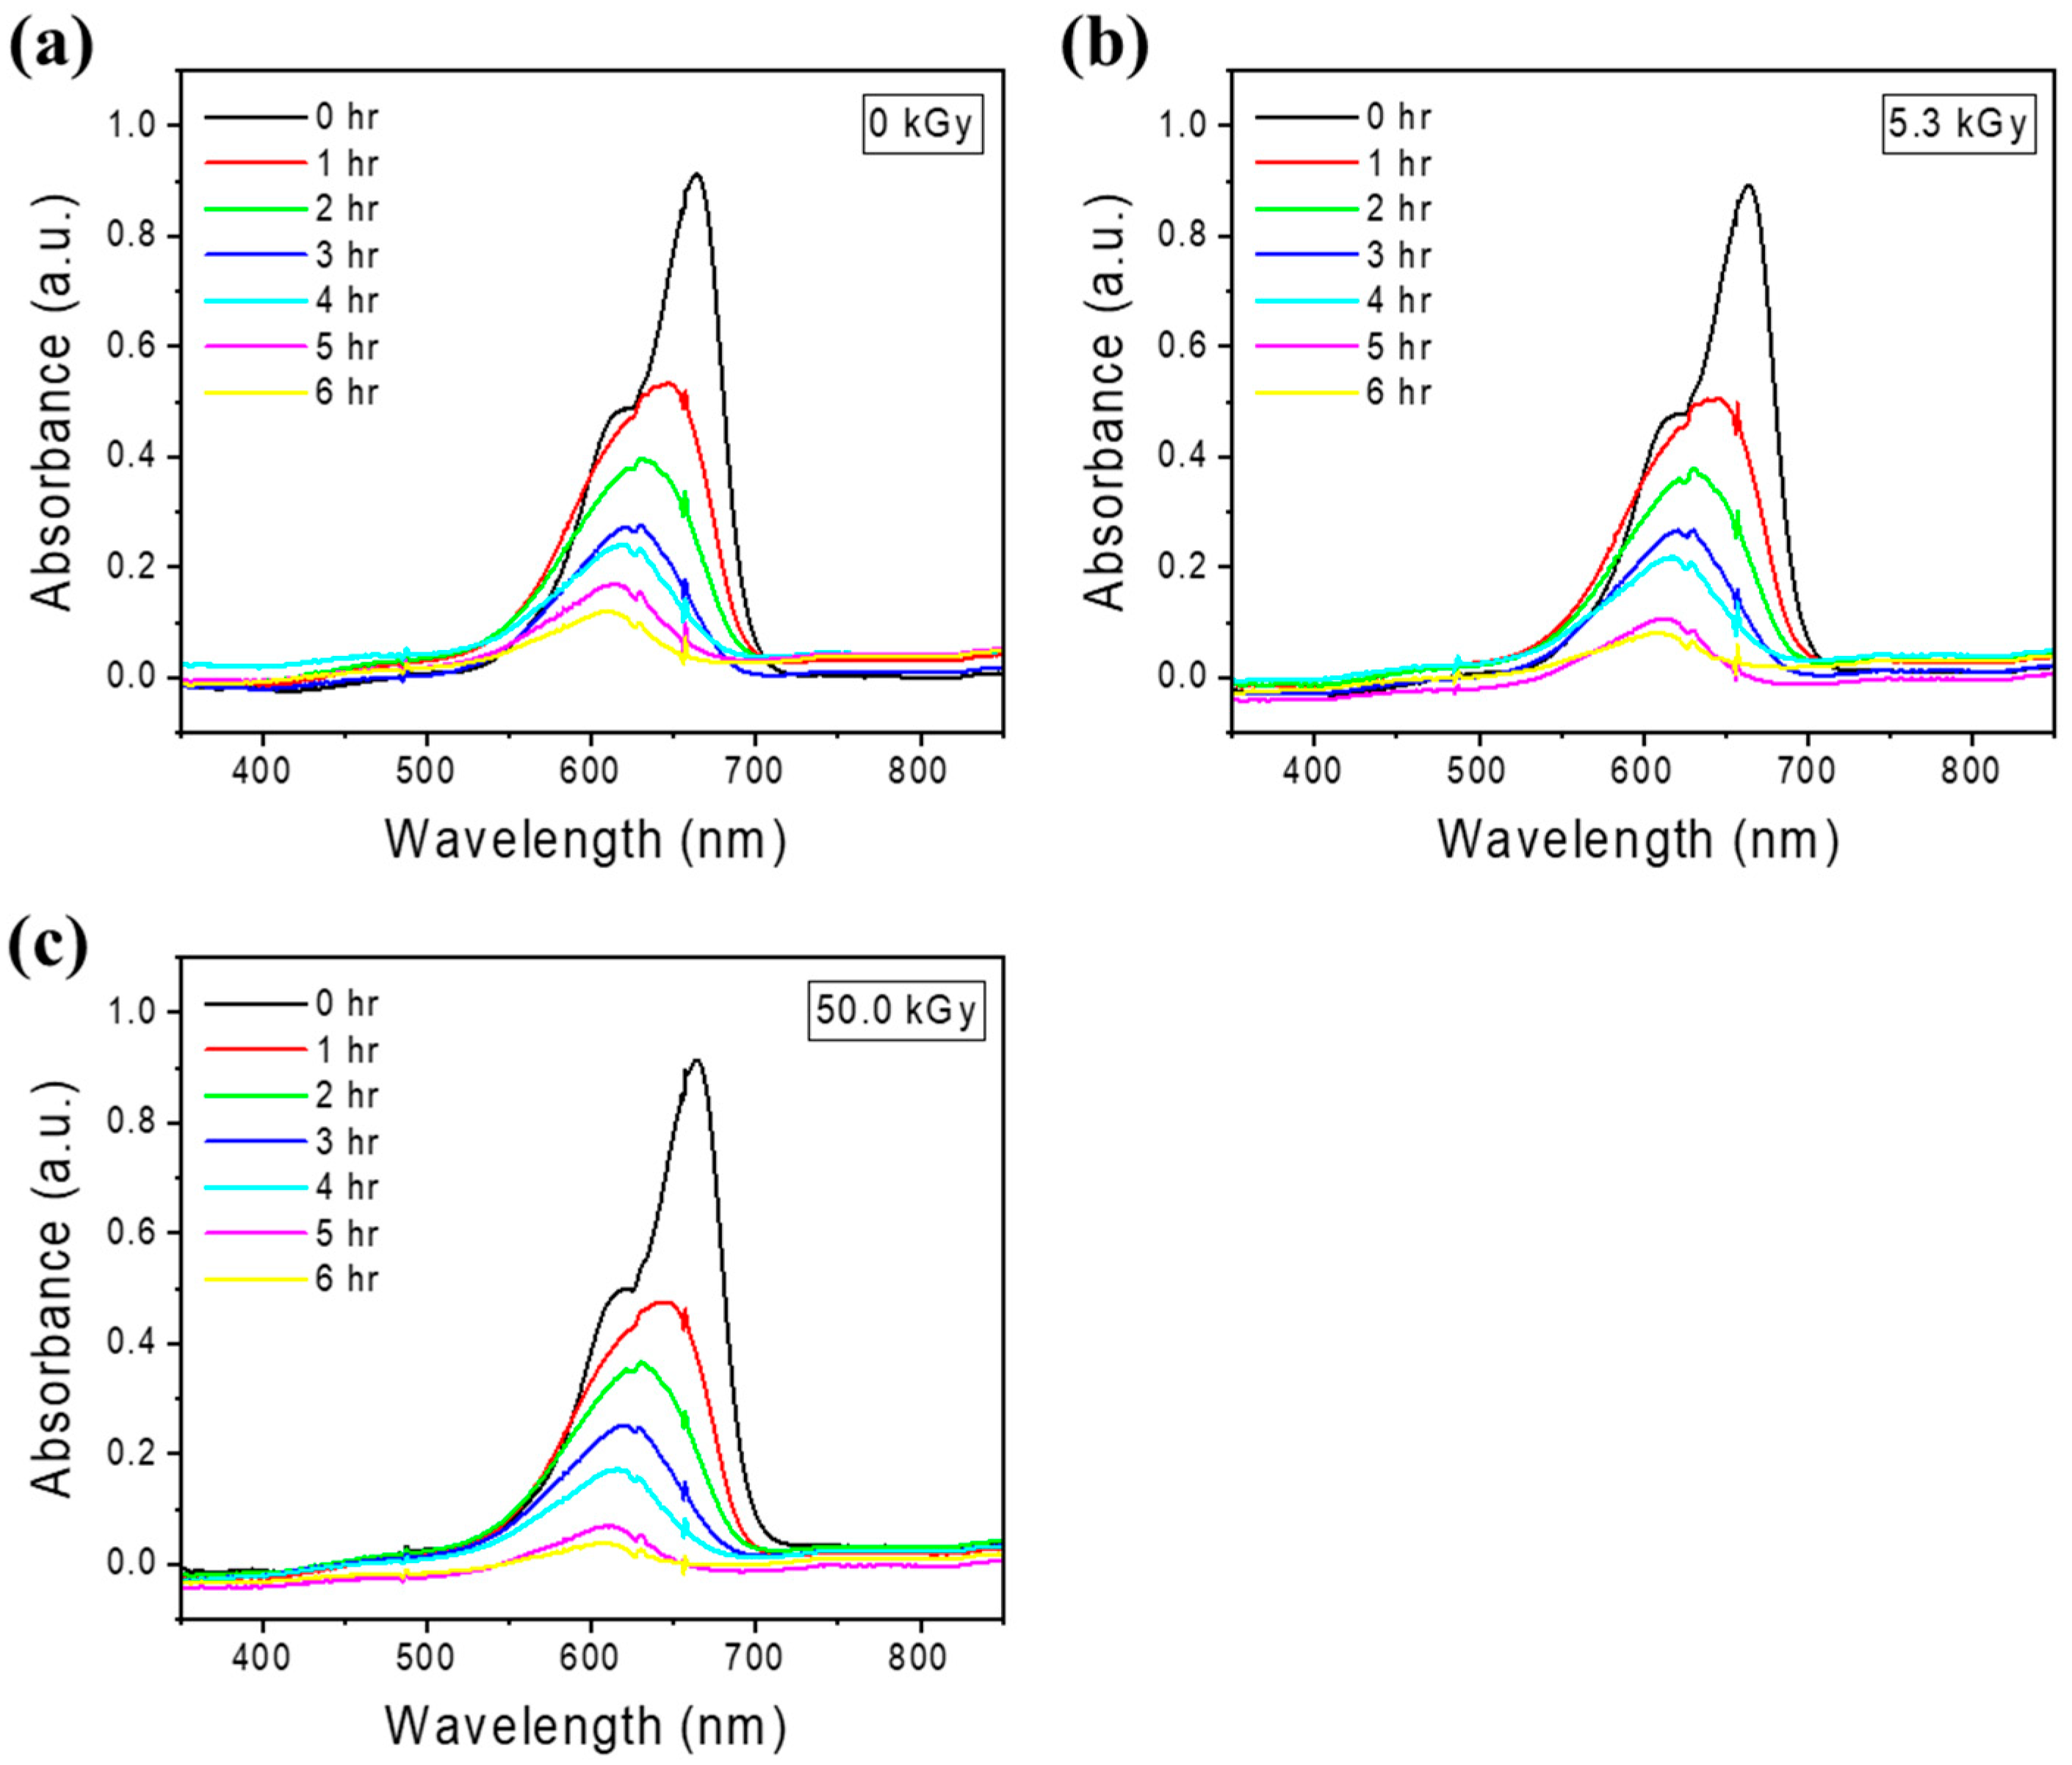
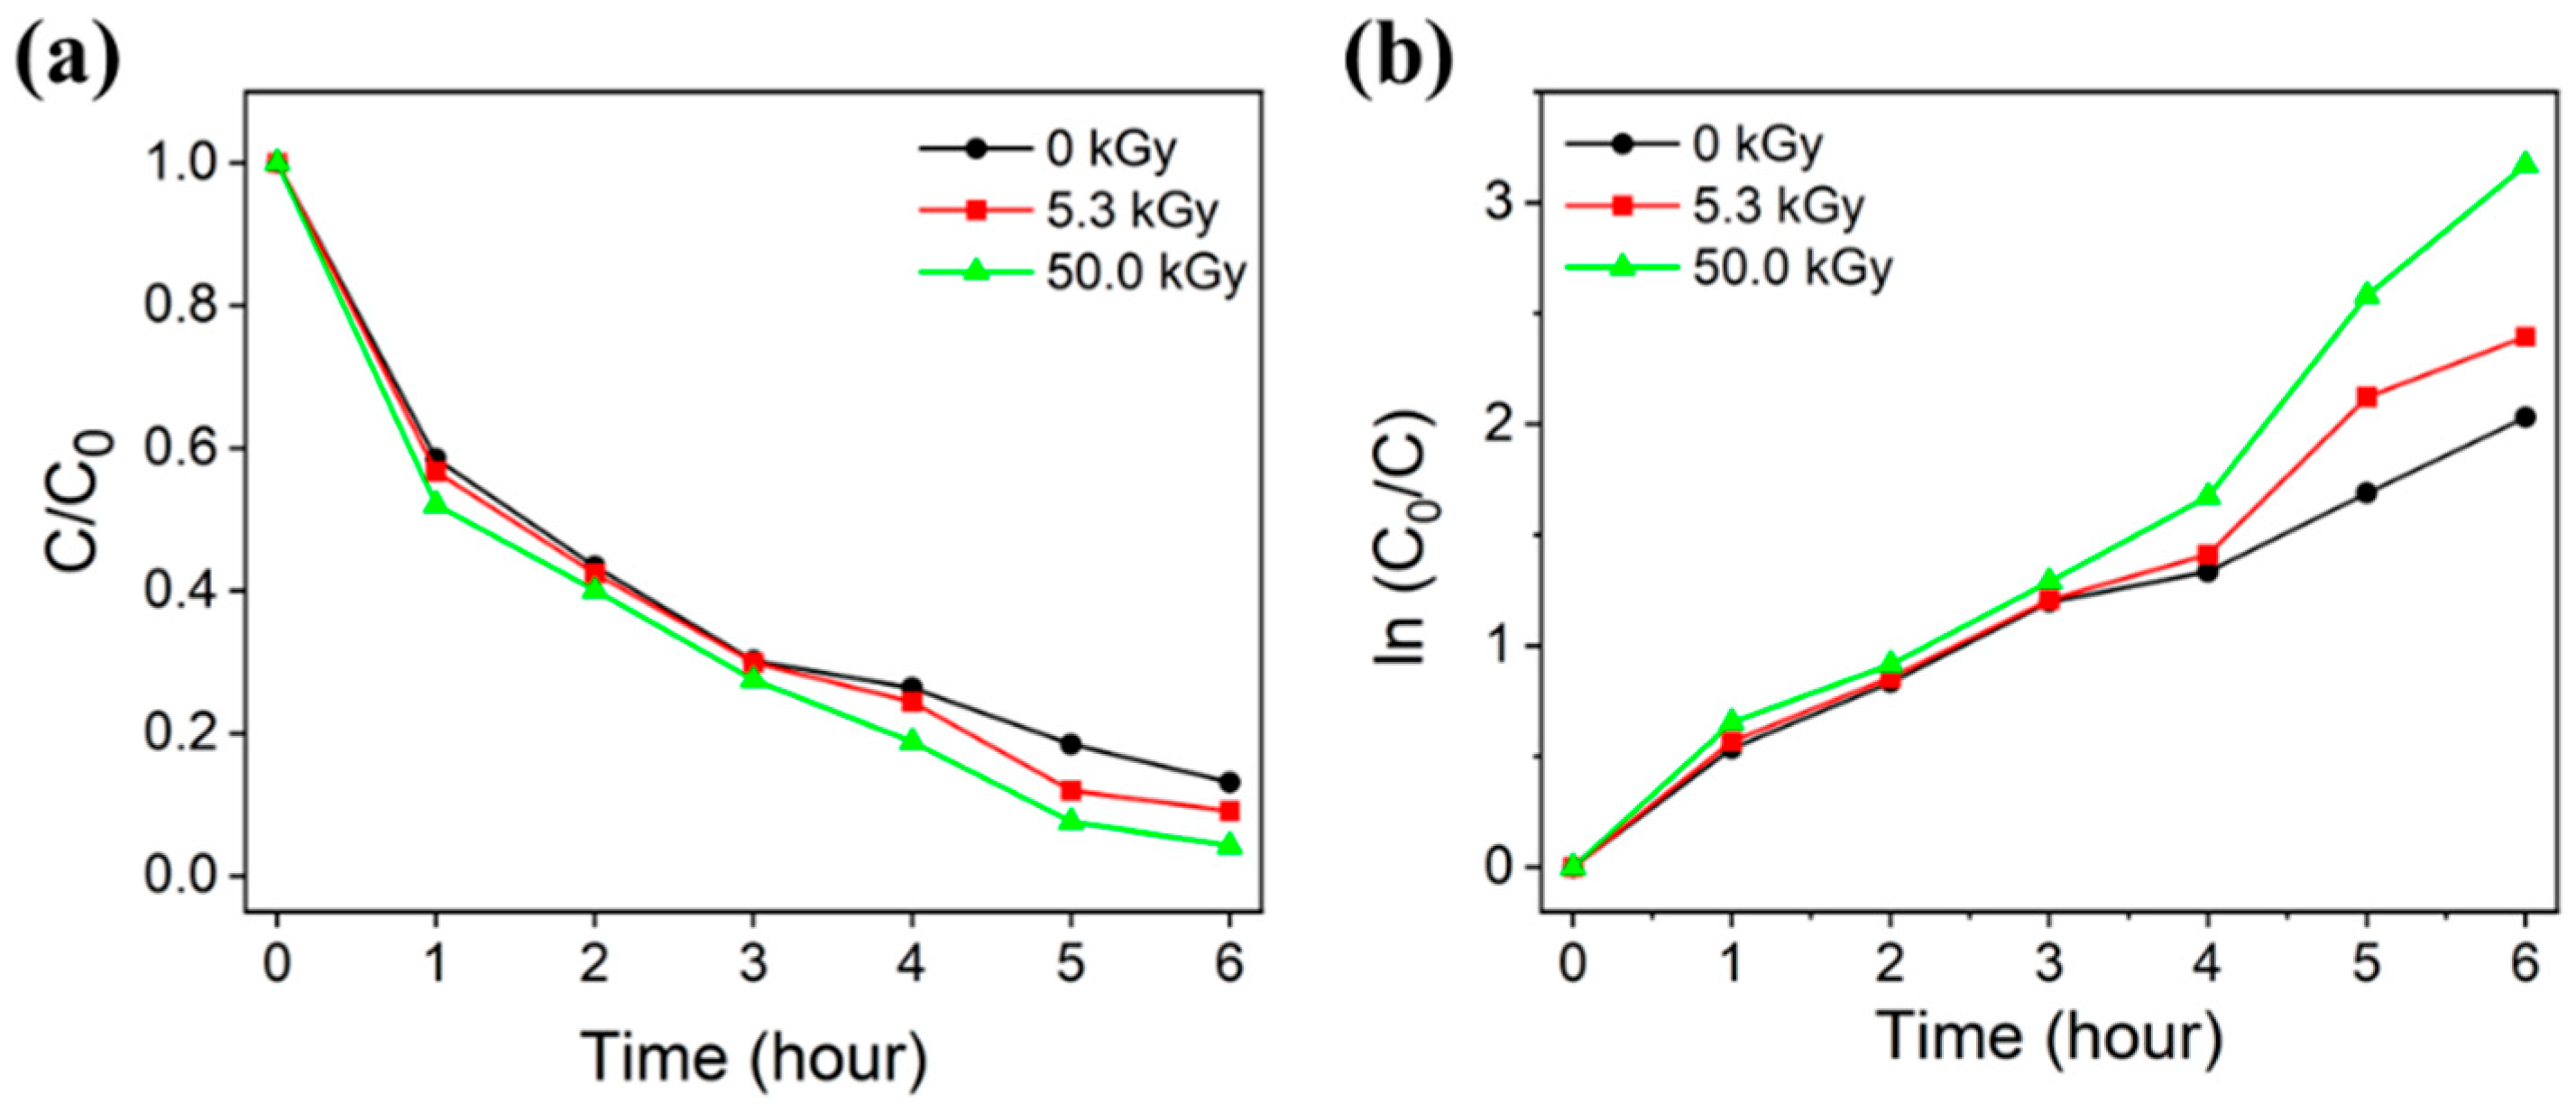
2.4. Photocatalytic Efficiency According to E-Beam Irradiation

The photocatalytic efficiency according to e-beam irradiation was evaluated using the same method and conditions as those used to evaluate photocatalytic efficiency according to Cu content. Samples were prepared by e-beam irradiation on TNF2, which showed the highest photodegradation rate in the evaluation of photocatalytic efficiency according to Cu content. A comparative analysis of the photodegradation rates of MB in aqueous solutions was conducted among samples not subjected to e-beam irradiation and those treated with 5.3 kGy and 50 kGy e-beam doses. It was observed that photodegradation efficiency increased with increased e-beam irradiation doses. Figure 8 shows the absorption spectrum of the MB aqueous solution sampled every hour during the photocatalytic reaction, and Figure 9 shows the C/C0 and ln(C/C0) values over time. The irradiation of e-beam significantly improved the efficiency and rate of photodegradation of MB by TNFs. As can be seen in Table 3, the sample irradiated with 50.0 kGy of e-beam photodegraded up to 95.80% after 6 h.

2.5. Raman Spectroscopy

Figure 10 shows the Raman spectrum of Cu-doped TNFs (a) and the Raman spectrum following e-beam treatment (b). All samples showed similar spectra, and the fingerprints closely matched the XRD patterns. The intense peak observed at 144 cm−1, along with Raman bands around 396, 514, 519, and 639 cm−1, correspond to the symmetry species Eg, B1g, A1g, B1g, and Eg, respectively. These Raman active modes are characteristic of anatase-TiO2 [63,64]. Also, the bands at 112, 143 (superimposed with the 144 cm−1 band by the anatase phase), 448, and 610 cm−1 correspond to symmetry species B1g, B1g, Eg, and A1g, respectively, and are attributed to the rutile-TiO2 [63,64]. In Raman active vibrational modes, the Eg mode mainly corresponds to the symmetric stretching vibration of O-Ti-O, the B1g mode is caused by the symmetric bending vibration of O-Ti-O, and the A1g mode is caused by the anti-symmetric bending vibration of O-Ti-O [65,66].

2.6. XPS Analysis

For surface characterization of e-beam treated and untreated TNFs samples, the X-ray spectroscopy (XPS) method was used. Figure 11 shows the XPS spectra of samples without e-beam irradiation and those irradiated with 5.3 kGy and 50.0 kGy, respectively. Figure 12 shows the Ti 2p peak for the three samples. Among the two peaks, the one with lower intensity corresponds to Ti4+ 2p1/2, and the one with relatively higher intensity corresponds to Ti4+ 2p3/2. As e-beam irradiation was performed, the height of the two peaks for Ti4+ 2p decreased, and the binding energy of Ti4+ 2p3/2 was the same at 458.5 eV, but the binding energy of Ti4+ 2p1/2 was 464.3, 464.2, and 464.1 eV, respectively, showing a tendency to decrease as the e-beam irradiation amount increased. This shift may be attributed to the growing influence of the Ti3+ 2p peak on the Ti4+ 2p peak. These peak shifts can be considered as a result of ionization, occurring when high-energy electron beams irradiate TiO2 nanofibers, causing some Ti4+ ions to capture electrons and convert into Ti3+ states. This change in the bonding state can promote the trapping of photo-excited charge carriers, thereby delaying recombination and enhancing the redox reactions on the surface, contributing to an improvement in photocatalytic performance. [67,68,69]. Additionally, high-energy e-beam irradiation creates oxygen vacancies in the surface layer and boosts the production of oxidizing agents such as hydroxyl radicals (•OH) and reactive oxygen species (•O2), thereby enhancing the adsorption and decomposition of pollutants [70,71,72]. Equations (2)–(5) represent the previously mentioned chemical reactions:
T i O 2 + h ν h + + e
T i 4 + + e T i 3 +
O 2 + e O 2
H 2 O + h + O H + O H +

3. Materials and Methods

3.1. Materials

Polyvinylpyrrolidone (PVP) (M.W. 1,300,000) was purchased from Alfa Aesar Korea Co., Ltd. (Incheon, Republic of Korea). Titanium (IV) isopropoxide (TTIP) (≥98.0%), Acetylacetone (ACAC) (≥99.0%), and Copper (II) acetate monohydrate (≥98.0%) were purchased from Junsei Co., Ltd. (Tokyo, Japan). Ethyl alcohol (EtOH) (anhydrous, ≥99.9%) was purchased from Samchun (Seoul, Republic of Korea). Methylene blue (MB) was purchased from Sigma-Aldrich Co., Ltd. (St. Louis, MO, USA).

3.2. Fabrication of Cu-Doped and Bare TiO2 Nanofibers

The precursor solutions for the electrospinning of TNFs were prepared with varying contents of Cu acetate, and the composition of each solution is shown in Table 4. The Cu content was adjusted to achieve molar ratios of 0, 0.02, 0.05, and 0.1% with titanium. In the first beaker, 40 g of PVP and the designed content of Cu acetate were added to 250 g of EtOH and stirred for 24 h. Subsequently, 50 g of ethanol, ACAC, and TTIP were added to another beaker and stirred until the solution became a homogenous, transparent yellow. The two solutions were then mixed and stirred at room temperature for an additional 24 h.
The precursor solution was fabricated and collected in nanofiber form using electrospinning, and Figure 13 shows a schematic of the electrospinning process. The electrospinning parameters were as follows: a needle tip-to-collector distance of 12 cm, a flow rate of 1 mL/h, and a 23-gauge needle tip diameter. A high voltage of 20 kV was applied through a power supply. Each fabricated sample was first dried in an oven at 60 °C and then calcined by heating in a box furnace to 400 °C for 3 h at a rate of 5 °C/min.

3.3. Characterization

The surface and diameter of the TiO2 nanofiber samples were characterized using a field-emission scanning electron microscope (FE-SEM). The crystal structure and crystallinity of the TiO2 sample were analyzed using an X-ray diffractometer (XRD) with Cu Kα line radiation. Raman spectroscopy was used to analyze the chemical structure of the sample, using a laser with a 532 nm wavelength. UV-visible spectrophotometer (UV-Vis) measurements were recorded in the range of 350–850 nm. The X-ray Photoelectron Spectroscopy (XPS) method was employed to analyze the surface properties of the e-beam irradiated samples. A monochromatic X-ray source Al-Kα was used, and all binding energies (BEs) were calibrated by the BE (284.8 eV) of C 1 s.

3.4. Photocatalytic MB Degradation

To evaluate the photocatalytic efficiency of both bare TiO2 and Cu-doped TiO2, the degradation test of methylene blue (MB) dye was performed. An aqueous MB solution was prepared at a concentration of 5 mg/L by dissolving MB powder in distilled water. A mixture of 10 mL of distilled water and 0.1 g of the TiO2 catalyst was added in a quartz beaker and stirred for 30 min in darkness. Subsequently, 100 mL of the MB aqueous solution was added, followed by its exposure to UV light with a 365 nm wavelength for 6 h. The UV lamp (VL-6.LM, Vilber Lourmat, Eberhardzell, Germany) was positioned 10 cm from the beaker, with a stirring speed of 220 rpm. Throughout the photodegradation test, approximately 5 mL of samples were extracted every hour using a syringe. The TiO2 catalyst was filtered from these samples using a syringe filter (PTFE, 0.2 µm, CHMLAB group, Barcelona, Spain), and the filtrate was then placed into a cuvette. The photocatalytic efficiency was determined by measuring the absorbance between 350 and 850 nm using a UV-Vis spectrophotometer.

3.5. E-Beam Treatment Test

To investigate the effect of e-beam irradiation on photocatalyst efficiency, Cu-doped TiO2, which exhibited the highest photodegradation efficiency, was irradiated with an e-beam at doses of approximately 5.3 kGy and 50.0 kGy. The TNFs, pulverized into powder and contained in a PE bag, were exposed to the e-beam using an electron accelerator (ELV-8 type), as per the parameters shown in Table 5. Then, a photocatalytic MB degradation test using UV-Vis spectroscopy was performed to measure the absorbance of the filtered MB aqueous solution, comparing the photodegradation efficiency between the samples treated with and without electron beam irradiation.

4. Conclusions

TiO2 nanofibers, fabricated by controlling the amount of Cu added, were irradiated with e-beams and compared in terms of their photocatalytic properties. An appropriate amount of Cu doping and high-dose e-beam irradiation significantly improved the decomposition rate of MB dye on the TiO2 photocatalyst. Cu doping reduced the average diameter of TiO2 nanofibers and increased the anatase-TiO2 phase fraction, but the photocatalytic efficiency of samples doped with more than a certain amount of Cu decreased. This decrease is attributed either to the generation of excessive oxygen vacancies or to the Cu species acting as recombination centers for photoinduced electrons and holes. Therefore, it was confirmed that an optimal concentration exists for performance improvement via Cu doping. As the e-beam irradiation dose increased, the photocatalytic efficiency increased too. Irradiation with an e-beam creates oxygen vacancies on the surface and increases the generation of Ti3+ ions, which can serve as a medium for interfacial charge transfer.

Author Contributions

Conceptualization, K.-H.N. and W.-Y.C.; methodology, S.-H.L.; validation, S.-H.L. and K.-H.N.; formal analysis, S.-H.L. and H.H.; investigation, S.-H.L.; resources, W.-Y.C.; data curation, S.-H.L. and J.-Y.K.; writing—original draft preparation, S.-H.L.; writing—review and editing, K.-H.N. and W.-Y.C.; visualization, K.-H.N. and H.-S.Y.; supervision, H.H. and W.-Y.C.; project administration, W.-Y.C.; funding acquisition, W.-Y.C. All authors have read and agreed to the published version of the manuscript.

Funding

This research was supported by “Regional Innovation Strategy (RIS)” through the National Research Foundation of Korea (NRF) funded by the Ministry of Education (MOE) (2022RIS-005), “Basic Science Research Program” through the National Research Foundation of Korea (NRF) funded by the Ministry of Education (MOE) (No. 2022R1F1A1074025), and “Basic Science Research Program” through the National Research Foundation of Korea (NRF) funded by the Ministry of Education (MOE) (NRF-2022R1A6A3A01087614).

Institutional Review Board Statement

Not applicable.

Informed Consent Statement

Not applicable.

Data Availability Statement

Data are contained within the article.

Conflicts of Interest

The authors declare no conflicts of interest.

References

  1. Omer, A.M. Energy, Environment and Sustainable Development. Renew. Sustain. Energy Rev. 2008, 12, 2265–2300. [Google Scholar] [CrossRef]
  2. Appannagari, R.R. Environmental Pollution Causes and Consequences: A Study. North Asian Int. Res. J. Soc. Sci. Humanit. 2017, 3, 151–161. [Google Scholar]
  3. Singh, R.L.; Singh, P.K. Global Environmental Problems. In Principles and Applications of Environmental Biotechnology for a Sustainable Future; Springer: Singapore, 2017; pp. 13–41. [Google Scholar]
  4. Wasi, S.; Tabrez, S.; Ahmad, M. Toxicological Effects of Major Environmental Pollutants: An Overview. Environ. Monit. Assess. 2013, 185, 2585–2593. [Google Scholar] [CrossRef]
  5. Ali, I. New Generation Adsorbents for Water Treatment. Chem. Rev. 2012, 112, 5073–5091. [Google Scholar] [CrossRef]
  6. Aboulhassan, M.A.; Souabi, S.; Yaacoubi, A.; Baudu, M. Removal of Surfactant from Industrial Wastewaters by Coagulation Flocculation Process. Int. J. Environ. Sci. Technol. 2006, 3, 327–332. [Google Scholar] [CrossRef]
  7. Markiewics, R. Eco-Friendly Alternative for Water Treatment from Nanotechnology. Nano Sci. Technol. 2016, 4, 28–34. [Google Scholar]
  8. Li, H.; Tu, W.; Zhou, Y.; Zou, Z. Z-Scheme Photocatalytic Systems for Promoting Photocatalytic Performance: Recent Progress and Future Challenges. Adv. Sci. 2016, 3, 1500389. [Google Scholar] [CrossRef] [PubMed]
  9. Leiknes, T. The Effect of Coupling Coagulation and Flocculation with Membrane Filtration in Water Treatment: A Review. J. Environ. Sci. 2009, 21, 8–12. [Google Scholar] [CrossRef] [PubMed]
  10. Lee, S.-Y.; Park, S.-J. TiO2 Photocatalyst for Water Treatment Applications. J. Ind. Eng. Chem. 2013, 19, 1761–1769. [Google Scholar] [CrossRef]
  11. Chong, M.N.; Jin, B.; Chow, C.W.K.; Saint, C. Recent Developments in Photocatalytic Water Treatment Technology: A Review. Water Res. 2010, 44, 2997–3027. [Google Scholar] [CrossRef] [PubMed]
  12. Kim, W.-T.; Na, K.-H.; Park, D.-C.; Yang, W.-H.; Choi, W.-Y. Photocatalytic Methylene Blue Degradation of Electrospun Ti–Zn Complex Oxide Nanofibers. Nanomaterials 2020, 10, 1311. [Google Scholar] [CrossRef]
  13. Shen, R.; Ren, D.; Ding, Y.; Guan, Y.; Ng, Y.H.; Zhang, P.; Li, X. Nanostructured CdS for Efficient Photocatalytic H2 Evolution: A Review. Sci. China Mater. 2020, 63, 2153–2188. [Google Scholar] [CrossRef]
  14. Grätzel, M. Photoelectrochemical Cells. Nature 2001, 414, 338–344. [Google Scholar] [CrossRef]
  15. Lee, C.-G.; Na, K.-H.; Kim, W.-T.; Park, D.-C.; Yang, W.-H.; Choi, W.-Y. TiO2/ZnO Nanofibers Prepared by Electrospinning and Their Photocatalytic Degradation of Methylene Blue Compared with TiO2 Nanofibers. Appl. Sci. 2019, 9, 3404. [Google Scholar] [CrossRef]
  16. Hoffmann, M.R.; Martin, S.T.; Choi, W.; Bahnemann, D.W. Environmental Applications of Semiconductor Photocatalysis. Chem. Rev. 1995, 95, 69–96. [Google Scholar] [CrossRef]
  17. Hou, H.; Zeng, X.; Zhang, X. Production of Hydrogen Peroxide by Photocatalytic Processes. Angew. Chem. Int. Ed. 2020, 59, 17356–17376. [Google Scholar] [CrossRef] [PubMed]
  18. Fujishima, A.; Honda, K. Electrochemical Photolysis of Water at a Semiconductor Electrode. Nature 1972, 238, 37–38. [Google Scholar] [CrossRef]
  19. Chen, X.; Selloni, A. Introduction: Titanium Dioxide (TiO2) Nanomaterials. Chem. Rev. 2014, 114, 9281–9282. [Google Scholar] [CrossRef] [PubMed]
  20. Li, Z.; Wang, S.; Wu, J.; Zhou, W. Recent Progress in Defective TiO2 Photocatalysts for Energy and Environmental Applications. Renew. Sustain. Energy Rev. 2022, 156, 111980. [Google Scholar] [CrossRef]
  21. Braun, J.H.; Baidins, A.; Marganski, R.E. TiO2 Pigment Technology: A Review. Prog. Org. Coat. 1992, 20, 105–138. [Google Scholar] [CrossRef]
  22. He, Z.; Tang, J.; Shen, J.; Chen, J.; Song, S. Enhancement of Photocatalytic Reduction of CO2 to CH4 over TiO2 Nanosheets by Modifying with Sulfuric Acid. Appl. Surf. Sci. 2016, 364, 416–427. [Google Scholar] [CrossRef]
  23. Tang, H.; Prasad, K.; Sanjines, R.; Schmid, P.E.; Levy, F. Electrical and Optical Properties of TiO2 Anatase Thin Films. J. Appl. Phys. 1994, 75, 2042–2047. [Google Scholar] [CrossRef]
  24. Zhang, G.-W.; He, G.-H.; Xue, W.-L.; Xu, X.-F.; Liu, D.-N.; Xu, Y.-H. Enhanced Photocatalytic Performance of Titania Nanotubes Modified with Sulfuric Acid. J. Mol. Catal. A Chem. 2012, 363–364, 423–429. [Google Scholar] [CrossRef]
  25. Silva, A.M.T.; Silva, C.G.; Dražić, G.; Faria, J.L. Ce-Doped TiO2 for Photocatalytic Degradation of Chlorophenol. Catal. Today 2009, 144, 13–18. [Google Scholar] [CrossRef]
  26. Litter, M.I. Heterogeneous Photocatalysis: Transition Metal Ions in Photocatalytic Systems. Appl. Catal. B 1999, 23, 89–114. [Google Scholar] [CrossRef]
  27. Ge, J.; Zhang, Y.; Heo, Y.-J.; Park, S.-J. Advanced Design and Synthesis of Composite Photocatalysts for the Remediation of Wastewater: A Review. Catalysts 2019, 9, 122. [Google Scholar] [CrossRef]
  28. Wang, H.; Sun, Y.; Jiang, G.; Zhang, Y.; Huang, H.; Wu, Z.; Lee, S.C.; Dong, F. Unraveling the Mechanisms of Visible Light Photocatalytic NO Purification on Earth-Abundant Insulator-Based Core–Shell Heterojunctions. Environ. Sci. Technol. 2018, 52, 1479–1487. [Google Scholar] [CrossRef] [PubMed]
  29. Xia, C.; Wang, H.; Kim, J.K.; Wang, J. Rational Design of Metal Oxide-based Heterostructure for Efficient Photocatalytic and Photoelectrochemical Systems. Adv. Funct. Mater. 2021, 31, 2008247. [Google Scholar] [CrossRef]
  30. Bavykin, D.V.; Friedrich, J.M.; Walsh, F.C. Protonated Titanates and TiO2 Nanostructured Materials: Synthesis, Properties, and Applications. Adv. Mater. 2006, 18, 2807–2824. [Google Scholar] [CrossRef]
  31. Kim, W.-T.; Kim, I.-H.; Choi, W.-Y. Fabrication of TiO2 Nanotube Arrays and Their Application to a Gas Sensor. J. Nanosci. Nanotechnol. 2015, 15, 8161–8165. [Google Scholar] [CrossRef]
  32. Daghrir, R.; Drogui, P.; Robert, D. Modified TiO2 for Environmental Photocatalytic Applications: A Review. Ind. Eng. Chem. Res. 2013, 52, 3581–3599. [Google Scholar] [CrossRef]
  33. Sigmund, W.; Yuh, J.; Park, H.; Maneeratana, V.; Pyrgiotakis, G.; Daga, A.; Taylor, J.; Nino, J.C. Processing and Structure Relationships in Electrospinning of Ceramic Fiber Systems. J. Am. Ceram. Soc. 2006, 89, 395–407. [Google Scholar] [CrossRef]
  34. Bhardwaj, N.; Kundu, S.C. Electrospinning: A Fascinating Fiber Fabrication Technique. Biotechnol. Adv. 2010, 28, 325–347. [Google Scholar] [CrossRef]
  35. Kanjwal, M.A.; Barakat, N.A.M.; Sheikh, F.A.; Baek, W.; Khil, M.S.; Kim, H.Y. Effects of Silver Content and Morphology on the Catalytic Activity of Silver-Grafted Titanium Oxide Nanostructure. Fibers Polym. 2010, 11, 700–709. [Google Scholar] [CrossRef]
  36. Barakat, N.A.M.; Kanjwal, M.A.; Chronakis, I.S.; Kim, H.Y. Influence of Temperature on the Photodegradation Process Using Ag-Doped TiO2 Nanostructures: Negative Impact with the Nanofibers. J. Mol. Catal. A Chem. 2013, 366, 333–340. [Google Scholar] [CrossRef]
  37. Bao, Y.; Chen, K. A Novel Z-Scheme Visible Light Driven Cu2O/Cu/g-C3N4 Photocatalyst Using Metallic Copper as a Charge Transfer Mediator. Mol. Catal. 2017, 432, 187–195. [Google Scholar] [CrossRef]
  38. Colón, G.; Maicu, M.; Hidalgo, M.C.; Navío, J.A. Cu-Doped TiO2 Systems with Improved Photocatalytic Activity. Appl. Catal. B 2006, 67, 41–51. [Google Scholar] [CrossRef]
  39. Latthe, S.S.; An, S.; Jin, S.; Yoon, S.S. High Energy Electron Beam Irradiated TiO2 Photoanodes for Improved Water Splitting. J. Mater. Chem. A Mater. 2013, 1, 13567–13575. [Google Scholar] [CrossRef]
  40. Gallegos, E.; Muñoz Bisesti, F.; Vaca-Escobar, K.; Santacruz, C.; Fernández, L.; Debut, A.; Espinoza-Montero, P.J. Degradation of Direct Blue 1 through Heterogeneous Photocatalysis with TiO2 Irradiated with E-Beam. Processes 2020, 8, 1181. [Google Scholar] [CrossRef]
  41. Ghasemi, S.; Rahimnejad, S.; Setayesh, S.R.; Rohani, S.; Gholami, M.R. Transition Metal Ions Effect on the Properties and Photocatalytic Activity of Nanocrystalline TiO2 Prepared in an Ionic Liquid. J. Hazard. Mater. 2009, 172, 1573–1578. [Google Scholar] [CrossRef]
  42. Barakat, N.A.M.; Abdelkareem, M.A.; El-Newehy, M.; Kim, H.Y. Influence of the Nanofibrous Morphology on the Catalytic Activity of NiO Nanostructures: An Effective Impact toward Methanol Electrooxidation. Nanoscale Res. Lett. 2013, 8, 402. [Google Scholar] [CrossRef]
  43. Li, H.; Zhang, W.; Li, B.; Pan, W. Diameter-dependent Photocatalytic Activity of Electrospun TiO2 Nanofiber. J. Am. Ceram. Soc. 2010, 93, 2503–2506. [Google Scholar] [CrossRef]
  44. Zhang, T.; Oyama, T.; Aoshima, A.; Hidaka, H.; Zhao, J.; Serpone, N. Photooxidative N-Demethylation of Methylene Blue in Aqueous TiO2 Dispersions under UV Irradiation. J. Photochem. Photobiol. A Chem. 2001, 140, 163–172. [Google Scholar] [CrossRef]
  45. Jeon, H.W.; Jeong, M.G.; An, B.Y.; Hong, M.S.; Seong, S.H.; Lee, G.D. Photocatalytic Degradation of Rhodamine B, Methyl Orange and Methylene Blue with CdS and CdZnS/ZnO Catalysts under Visible Light Irradiation. Clean Technol. 2020, 26, 311–320. [Google Scholar]
  46. Karakitsou, K.E.; Verykios, X.E. Effects of Altervalent Cation Doping of Titania on Its Performance as a Photocatalyst for Water Cleavage. J. Phys. Chem. 1993, 97, 1184–1189. [Google Scholar] [CrossRef]
  47. Linsebigler, A.L.; Lu, G.; Yates, J.T., Jr. Photocatalysis on TiO2 Surfaces: Principles, Mechanisms, and Selected Results. Chem. Rev. 1995, 95, 735–758. [Google Scholar] [CrossRef]
  48. Navas, J.; Sánchez-Coronilla, A.; Aguilar, T.; Hernández, N.C.; de los Santos, D.M.; Sánchez-Márquez, J.; Zorrilla, D.; Fernández-Lorenzo, C.; Alcántara, R.; Martín-Calleja, J. Experimental and Theoretical Study of the Electronic Properties of Cu-Doped Anatase TiO2. Phys. Chem. Chem. Phys. 2014, 16, 3835–3845. [Google Scholar] [CrossRef]
  49. Nagaveni, K.; Hegde, M.S.; Madras, G. Structure and Photocatalytic Activity of Ti1−xMxO2±δ (M = W, V, Ce, Zr, Fe, and Cu) Synthesized by Solution Combustion Method. J. Phys. Chem. B 2004, 108, 20204–20212. [Google Scholar] [CrossRef]
  50. Kumaravel, V.; Rhatigan, S.; Mathew, S.; Michel, M.C.; Bartlett, J.; Nolan, M.; Hinder, S.J.; Gascó, A.; Ruiz-Palomar, C.; Hermosilla, D. Mo Doped TiO2: Impact on Oxygen Vacancies, Anatase Phase Stability and Photocatalytic Activity. J. Phys. Mater. 2020, 3, 025008. [Google Scholar] [CrossRef]
  51. Xin, B.; Wang, P.; Ding, D.; Liu, J.; Ren, Z.; Fu, H. Effect of Surface Species on Cu-TiO2 Photocatalytic Activity. Appl. Surf. Sci. 2008, 254, 2569–2574. [Google Scholar] [CrossRef]
  52. Sawicka-Chudy, P.; Sibiński, M.; Rybak-Wilusz, E.; Cholewa, M.; Wisz, G.; Yavorskyi, R. Review of the Development of Copper Oxides with Titanium Dioxide Thin-Film Solar Cells. AIP Adv. 2020, 10, 010701. [Google Scholar] [CrossRef]
  53. Raguram, T.; Rajni, K.S. Synthesis and Characterisation of Cu—Doped TiO2 Nanoparticles for DSSC and Photocatalytic Applications. Int. J. Hydrogen Energy 2022, 47, 4674–4689. [Google Scholar] [CrossRef]
  54. Yang, Y.; Xu, D.; Wu, Q.; Diao, P. Cu2O/CuO Bilayered Composite as a High-Efficiency Photocathode for Photoelectrochemical Hydrogen Evolution Reaction. Sci. Rep. 2016, 6, 35158. [Google Scholar] [CrossRef]
  55. Wang, Z.; Liu, Y.; Martin, D.J.; Wang, W.; Tang, J.; Huang, W. CuOx–TiO2 Junction: What Is the Active Component for Photocatalytic H2 Production? Phys. Chem. Chem. Phys. 2013, 15, 14956–14960. [Google Scholar] [CrossRef]
  56. Shu-Xin, W.; Zhi, M.; Yong-Ning, Q.; Fei, H.; Li Shan, J.; Yan-Jun, Z. XPS Study of Cooper Dopping TiO2 Photocatalyst. Acta Phys. Chim. Sin. 2003, 19, 967–969. [Google Scholar] [CrossRef]
  57. Doong, R.; Chang, S.; Tsai, C. Enhanced Photoactivity of Cu-Deposited Titanate Nanotubes for Removal of Bisphenol A. Appl. Catal. B 2013, 129, 48–55. [Google Scholar] [CrossRef]
  58. Ward, M.D.; Bard, A.J. Photocurrent Enhancement via Trapping of Photogenerated Electrons of Titanium Dioxide Particles. J. Phys. Chem. 1982, 86, 3599–3605. [Google Scholar] [CrossRef]
  59. Brezová, V.; Blažková, A.; Borošová, E.; Čeppan, M.; Fiala, R. The Influence of Dissolved Metal Ions on the Photocatalytic Degradation of Phenol in Aqueous TiO2 Suspensions. J. Mol. Catal. A Chem. 1995, 98, 109–116. [Google Scholar] [CrossRef]
  60. Choi, W.; Termin, A.; Hoffmann, M.R. The Role of Metal Ion Dopants in Quantum-Sized TiO2: Correlation between Photoreactivity and Charge Carrier Recombination Dynamics. J. Phys. Chem. 2002, 98, 13669–13679. [Google Scholar] [CrossRef]
  61. Rajamannan, B.; Mugundan, S.; Viruthagiri, G.; Praveen, P.; Shanmugam, N. Linear and Nonlinear Optical Studies of Bare and Copper Doped TiO2 Nanoparticles via Sol Gel Technique. Spectrochim. Acta A Mol. Biomol. Spectrosc. 2014, 118, 651–656. [Google Scholar] [CrossRef] [PubMed]
  62. He, J.; Du, Y.; Bai, Y.; An, J.; Cai, X.; Chen, Y.; Wang, P.; Yang, X.; Feng, Q. Facile Formation of Anatase/Rutile TiO2 Nanocomposites with Enhanced Photocatalytic Activity. Molecules 2019, 24, 2996. [Google Scholar] [CrossRef]
  63. Tuschel, D. Raman Spectroscopy and Polymorphism. Spectroscopy 2019, 34, 10–21. [Google Scholar]
  64. Yan, J.; Wu, G.; Guan, N.; Li, L.; Li, Z.; Cao, X. Understanding the Effect of Surface/Bulk Defects on the Photocatalytic Activity of TiO2: Anatase versus Rutile. Phys. Chem. Chem. Phys. 2013, 15, 10978–10988. [Google Scholar] [CrossRef]
  65. Tian, F.; Zhang, Y.; Zhang, J.; Pan, C. Raman Spectroscopy: A New Approach to Measure the Percentage of Anatase TiO2 Exposed (001) Facets. J. Phys. Chem. C 2012, 116, 7515–7519. [Google Scholar] [CrossRef]
  66. Bhorde, A.; Bhopale, S.; Waykar, R.; Nair, S.; Borate, H.; Pandharkar, S.; Funde, A.; More, M.; Jadkar, S. Field Emission Investigations of Solvothermal Synthesized and Soaked Rutile-TiO2 Nanostructures. J. Mater. Sci. Mater. Electron. 2019, 30, 4920–4930. [Google Scholar] [CrossRef]
  67. Jun, J.; Dhayal, M.; Shin, J.-H.; Kim, J.-C.; Getoff, N. Surface Properties and Photoactivity of TiO2 Treated with Electron Beam. Radiat. Phys. Chem. 2006, 75, 583–589. [Google Scholar] [CrossRef]
  68. Kim, M.; Jo, W.; Lee, D.; Baeck, S.-H.; Shin, J.; Lee, B.-C. Enhanced Photocatalytic Activity of TiO2 Modified by E-Beam Irradiation. Bull. Korean Chem. Soc. 2013, 34, 1397–1400. [Google Scholar] [CrossRef]
  69. Kim, B.-H.; Kim, C.H.; Yang, K.S.; Lee, B.C.; Woo, H.-G. Electron Beam Irradiation Effect on the Photocatalytic Activity of TiO2 on Carbon Nanofibers. J. Nanosci. Nanotechnol. 2011, 11, 1438–1442. [Google Scholar] [CrossRef] [PubMed]
  70. Han, B.; Kyu Kim, J.; Kim, Y.; Seung Choi, J.; Young Jeong, K. Operation of Industrial-Scale Electron Beam Wastewater Treatment Plant. Radiat. Phys. Chem. 2012, 81, 1475–1478. [Google Scholar] [CrossRef]
  71. Capodaglio, A.G. Critical Perspective on Advanced Treatment Processes for Water and Wastewater: AOPs, ARPs, and AORPs. Appl. Sci. 2020, 10, 4549. [Google Scholar] [CrossRef]
  72. Xu, G.; Bu, T.; Wu, M.; Zheng, J.; Liu, N.; Wang, L. Electron Beam Induced Degradation of Clopyralid in Aqueous Solutions. J. Radioanal. Nucl. Chem. 2011, 288, 759–764. [Google Scholar] [CrossRef]
Figure 1. FE-SEM images of as-spun bare TiO2 and Cu-doped TiO2 at low and high magnification: (A1,A2) TNF0; (B1,B2) TNF1; (C1,C2) TNF2; (D1,D2) TNF3.
Polymers 16 00694 g001
Figure 2. FE-SEM images of calcined bare TiO2 and Cu-doped TiO2: (a) TNF0; (b) TNF1; (c) TNF2; (d) TNF3.
Polymers 16 00694 g002
Figure 3. Average diameter graph of TNFs after calcination.
Polymers 16 00694 g003
Figure 4. FE-SEM images of calcined TNF2 (a) and observed elemental distribution mapping of O (b), Ti (c), and Cu (d) in Cu-doped TiO2 nanocomposite sample TNF2.
Polymers 16 00694 g004
Figure 5. UV-Vis absorption spectra of photodegradation of methylene blue by bare TiO2 and Cu-doped TiO2: (a) TNF0; (b) TNF1; (c) TNF2; (d) TNF3.
Polymers 16 00694 g005
Figure 6. Methylene blue degradation curves (a) and kinetic curves (b) of bare TiO2 and Cu-doped TiO2.
Polymers 16 00694 g006
Figure 7. XRD patterns of bare TiO2 and Cu-doped TiO2.
Polymers 16 00694 g007
Figure 8. UV-Vis absorption spectra of photodegradation of methylene blue by unirradiated TiO2 and e-beam-treated TiO2: (a) 0 kGy; (b) 5.3 kGy; (c) 50 kGy.
Polymers 16 00694 g008
Figure 9. Methylene blue degradation curves (a) and kinetic curves (b) of unirradiated TNFs and e-beam treated TNFs.
Polymers 16 00694 g009
Figure 10. Raman spectra of TNFs: (a) bare TiO2 and Cu-doped TiO2; (b) unirradiated TiO2 and e-beam-treated TiO2.
Polymers 16 00694 g010
Figure 11. XPS spectra of unirradiated TiO2 and e-beam-treated TiO2.
Polymers 16 00694 g011
Figure 12. XPS spectra of Ti 2p on the surface of unirradiated TiO2 and e-beam-treated TiO2.
Polymers 16 00694 g012
Figure 13. Schematic diagram of electrospinning process.
Polymers 16 00694 g013
Table 1. MB dye degradation rate (%) after 6 h according to Cu content.
TNF0TNF1TNF2TNF3
76.4880.7586.8761.30
Table 2. The phase ratio of each sample depending on the Cu content.
SampleAnatase (%)Rutile (%)
TNF02080
TNF12674
TNF24159
TNF35941
Table 3. MB dye degradation rate (%) after 6 h according to e-beam treatment.
0 kGy5.3 kGy50.0 kGy
86.8790.8795.80
Table 4. The composition of precursor solutions (unit: g).
SamplePVPEtOHCu AcetateTTIPACACMolar Ratio
Cu/Ti (%)
TNF040300050500
TNF1403000.00750500.02
TNF2403000.01850500.05
TNF3403000.03550500.10
Table 5. The E-beam irradiation conditions for each sample.
Acceleration
Voltage (MeV)
Beam Current
(mA)
Processing
Number
Radiation
Exposure (kGy)
0000
0.8415.3
1.25550.0
Disclaimer/Publisher’s Note: The statements, opinions and data contained in all publications are solely those of the individual author(s) and contributor(s) and not of MDPI and/or the editor(s). MDPI and/or the editor(s) disclaim responsibility for any injury to people or property resulting from any ideas, methods, instructions or products referred to in the content.

