
Optical Anisotropy of Polyethylene Terephthalate Films Characterized by Spectral Means

1
Petru Poni Institute of Macromolecular Chemistry, 41A Grigore Ghica Voda Alley, RO-700487 Iasi, Romania
2
Faculty of Physics, Alexandru Ioan Cuza University, 11 Carol I Blvd., RO-700506 Iasi, Romania
*
Author to whom correspondence should be addressed.
Polymers 2024, 16(6), 850; https://doi.org/10.3390/polym16060850
Submission received: 12 February 2024
/
Revised: 13 March 2024
/
Accepted: 17 March 2024
/
Published: 20 March 2024
(This article belongs to the Special Issue Advanced Polymeric Films II)
Abstract
:Polyethylene terephthalate (PET) films are the subject of intensive research because of great interest in using them in applications, especially in medicine. From an optical point of view, PET films with a low degree of stretching can be considered uniaxial materials, for which the determination of the linear birefringence and its dispersion is very important. Two methods were applied here for the estimation of these parameters: the ellipsometric method and the channeled spectra method. The ellipsometric method uses monochromatic radiation; therefore, the linear birefringence of the PET films is determined for a given value of the radiation wavelength. The channeled spectra method allows for the estimation of the linear birefringence and its dispersion for a large range of wavelengths in the visible spectrum. A decrease in both parameters with the increase in the wavelength was recorded. To evidence the microstructure of PET films and the conformational changes induced by elongation and to evaluate the degree of orientation, a polarized infrared spectral study in attenuated total reflection (ATR-FTIR) mode was performed. The dichroic ratio (between the absorbance measured with linearly polarized radiation parallel and orthogonal relative to the stretching direction, respectively) and the ATR absorbance ratio for the machine direction (MD) and transversal direction (TD) configurations both for the stretched and unstretched PET samples were measured.
1. Introduction
Polyethylene terephthalate (PET) is a thermoplastic polymer, a polyester with a partially aliphatic and aromatic structure, that can be amorphous or semi-crystalline [1], made starting from ethylene and paraxylene, whose derivatives, i.e., ethylene glycol (a diol) and terephthalic acid (a dicarboxylic acid) react in the presence of a catalyst to obtain the PET resin in the shape of long polymer chains. They can be subsequently further stretched by means of several techniques, which improve their crystallinity by accentuating the reciprocal orientation of the molecules, and thus change their properties, not only the optical ones but also others, e.g., the thermal stability improves, but the transparency decreases [2,3].
Commercial PET has a density of 1.41 g/cm3, a breaking strength of 50 MPa, a Young’s modulus of 1700 MPa, a melting temperature of 265 °C, and a glass transition temperature between 69 and 115 °C, above which PET is highly stiff [4].
Other key features of PET are its low production cost and recyclability [3,4]. Various preparation methods are available for PET films: casting, blowing, and extrusion. The as-prepared PET can be post-processed via surface modifications, printing, and lamination in order to be used for various applications. The preparation and post-processing parameters can be used to control the properties of the resulting PET. As recyclability is concerned, PET is the most recyclable plastic to date, with three groups of methods: primary methods or mechanical ones, secondary methods, namely chemical ones, and tertiary recycling, consisting of the recovery of energy content from the plastic waste by incineration [4].
Originally produced for synthetic fibers in the 1930s, PET also started to be used for film packaging, and then, in the early 1970s, the biaxially oriented bottle-blowing technique was commercially developed. The strength of the material caused PET to become successful. Thus, in the industry of carbonated soft drinks, the pressure inside the bottle can reach up to 600 kPa, but PET can stand such a high pressure due to the alignment of macromolecules after stretching the material during the technological process of film manufacturing and bottle shaping [5]. The same property, along with stiffness, determined the use of PET for fiber and textile production, including carpets. Except for its strength, there are other properties of PET films that make them useful for various applications, especially for packaging and electrical insulation. PET has high chemical resistance to acids, bases, and solvents, making it suitable in harsh chemical environments. Also, moisture, gases, and other environmental factors are stopped by PET films acting as barriers. Along with the latter property, its high transparency (above 90%) made it popular for food packaging and consumer electronics. The same transparency led to the use of PET films as a laminated protective layer against environmental hazards for flexible electroluminescence devices [6].
PET is thermally stable up to high temperatures; therefore, it can be easily thermally processed. Two features make it very useful. One refers to its biocompatibility, and thus, it can be used for various medical applications since it can come in contact with living tissues without inducing any negative reaction. PET films can be used not only for medical packaging and sterilization wraps (given their transparency, barrier properties, chemical attack, and high temperature resistance, including those during the sterilization processes) but also for medical implants as coatings, such as for cardiovascular prostheses [7,8,9,10] and blood vessels’ metallic stents [11], especially since it was proved that PET has the ability to reduce thrombus formation [12,13]. Still, microorganisms (e.g., bacteria and viruses) can proliferate on the surface of PET films, but the problem was solved in more than one way. A chitosan layer was coated on the PET surface, a coating that was then loaded with silver nanoparticles that are well known for their antiseptic properties [14]. Also, chitosan is a polymer that exhibits efficient antimicrobial activity against different pathogenic microorganisms [14,15]. Another method for avoiding the proliferation of microorganisms on PET is the functionalization of its surface by means of gas and/or plasma exposure, leading to a more hydrophilic or hydrophobic surface [15,16]. Thus, it was found that fluorinated PET films have a higher surface hydrophilicity than unfluorinated PET films and also that the hydrophilicity increases with fluorination time due to the number increase in polar groups in the fluorinated molecules that repel water [16]. Fluorination is also used to improve PET surface concerning its low surface free energy and high chemical inertness, disadvantages inducing poor wettability, printability, and adhesion of PET films, requesting solutions to overcome these issues [17].
In dentistry, studies have shown that PET surface modification improves cell biocompatibility, increases cell production and adhesion, and enhances osseointegration [18]. The intensification of osseointegration has been verified in the case of PET when associated with other compounds, such as hydroxypropylcellulose (HPC) or hyaluronic acid, which, when added to the surface of the polymer, firstly favors the formation of collagen [19,20]. Moreover, pure PET manifests resistance to dye staining, thus being recommended as dental material [18].
Among the multiple applications, polyethylene terephthalate is used as a nanoporous membrane material for polymeric nuclear track detectors [21,22] or for the detection of heavy metal ions in water [23]. Also, transparent PET substrates with low haze and high optical smoothness are ideal for applications in touch panels and solar cells [24,25]. Conductors such as indium tin oxide (ITO) [26] and silver nanoparticles [27] were deposited onto PET substrates, obtaining films with suitable properties for applications in flexible displays, integrated circuits, or optoelectronic devices.
For PET films, the draw ratio, namely the ratio of the final film thickness to the initial film thickness after the film has been stretched/drawn, determines most of the properties of the resulting film, including its mechanical strength, optical transparency, and thermal stability. In general, the draw ratio of PET films can be controlled by adjusting the stretching temperature, stretching rate, film orientation (i.e., uniaxial stretching typically yields higher draw ratios compared to biaxial stretching), and chemical composition (e.g., additives and copolymers) in order to produce films with specific properties, such as high mechanical strength or improved optical clarity [28].
Birefringence is the property of a material that exhibits two different indices of refraction for light polarized in different directions, a property which can be observed as a double refraction of light when passing through the material, leading to the splitting of a single incident light beam into two separate beams that are polarized in perpendicular directions. The birefringence degree of a material, computed as the difference between the two refractive indexes of polarized refracted/transmitted radiation, depends on the molecular structure of the substance and on the wavelength of light. Highly ordered materials, such as crystals or stretched molecular structures, have higher levels of birefringence than materials with disordered structures, such as amorphous materials, and thus, birefringence measurements can be used for the structural characterization of materials. PET layers are characterized by a greater value of birefringence in the range of shorter wavelengths compared with that one corresponding to higher values of wavelength. The wavelength dependence of birefringence for PET films is generally minimal. Birefringence is sometimes undesirable, while other times is useful. Thus, the birefringence of PET films makes them useful for polarizing filters, LCD displays, and optical fibers.
For PET films, it was found that if uniaxial stretched, the refractive index corresponding to the tensile direction changes significantly as compared to the refractive index corresponding to the direction perpendicular to the tensile stress, while the birefringence exhibits a linear increase with strain [29,30]. This happens because large orientation effects were obtained in the stretching direction [31] due to PET’s ability to crystallize at large draw ratios during the deformation process [32]. In this way, an anisotropic structure of PET can be obtained, usually used in polarization control devices [33].
The polymeric chains mostly lie in-plane during the fabricating process [34] and a supplementary applied uniaxial tension has a slight impact on the structure of the molecular chains situated in the out-of-plane direction [29]. In this way, the out-of-plane optical parameters are supposed to remain unchanged and only the in-plane optical properties modifications along the stretching direction are considered [29,30]. According to this, and due to the very close values of the two extraordinary refractive indices [35], it can be considered that, from an optical point of view, PET films act as uniaxial materials, and there is a single direction governing the optical anisotropy. This direction is called the optical axis of the material, and it coincides with the main axis of stress [34].
Birefringence can be measured using various techniques: optical microscopy using cross-polarized light, interference techniques—measurement of the phase difference between two polarized components of light that pass through a birefringent material, ellipsometry [29,30,34,35,36,37,38,39]. The latter allows for measuring the change in polarization of light as it passes through a material. By measuring the changes in polarization, the birefringence of the material can be determined, along with its thickness. Ellipsometric measurements consist of sending a polarized beam onto the sample and analyzing the polarization degree of the reflected light. Such a technique is nondestructive, and it is widely used in optical engineering, materials science, and semiconductor industry.
The aim of this research was to estimate the birefringence and its dispersion in visible range by two methods, namely the ellipsometric method and the channeled spectra method, for PET films with different degrees of stretching corroborated the microstructure of PET films and the orientation of conformers in PET samples. The polarized ATR-FTIR analysis allowed us to determine the dichroism, D (the ratio between the absorbance measured with linearly polarized radiation parallel and orthogonal relative to the stretching direction), and the ATR absorbance ratio for the machine direction (MD) and transversal direction (TD) configurations both for the stretched and unstretched PET samples.
This study characterizes the anisotropic properties of the commercial PET samples and demonstrates the applicability of the new method based on ellipsometric measurements of the birefringence, recently applied to polyvinyl alcohol (PVA) films [39].
2. Materials and Methods
The studied PET is from a roll of commercial origin (Terom, Iasi, Romania, with the following specifications: Tg = 80 ± 2 °C, 40% crystallinity, 1.38 g/cm3 density) of 75 μm thickness. The surface contaminants were removed by successive washings with acetone and double distilled water.
Small samples of 1.0 × 1.5 and 5 × 3 cm2 size were cut and uniaxially stretched (the long side of the sample parallel to the stretching direction) with the help of a lab-made machine (that also assures the heating of the sample during stretching).
When the polymer layers are stretched, the alignment of the polymer chains is enhanced, and the difference between their optical parameters increases. The linear birefringence of the stretched polymer layers is composed of an intrinsic one and one induced by stretching, called orientation birefringence. The stretching direction coincides with the optical axis of the polymer layer.
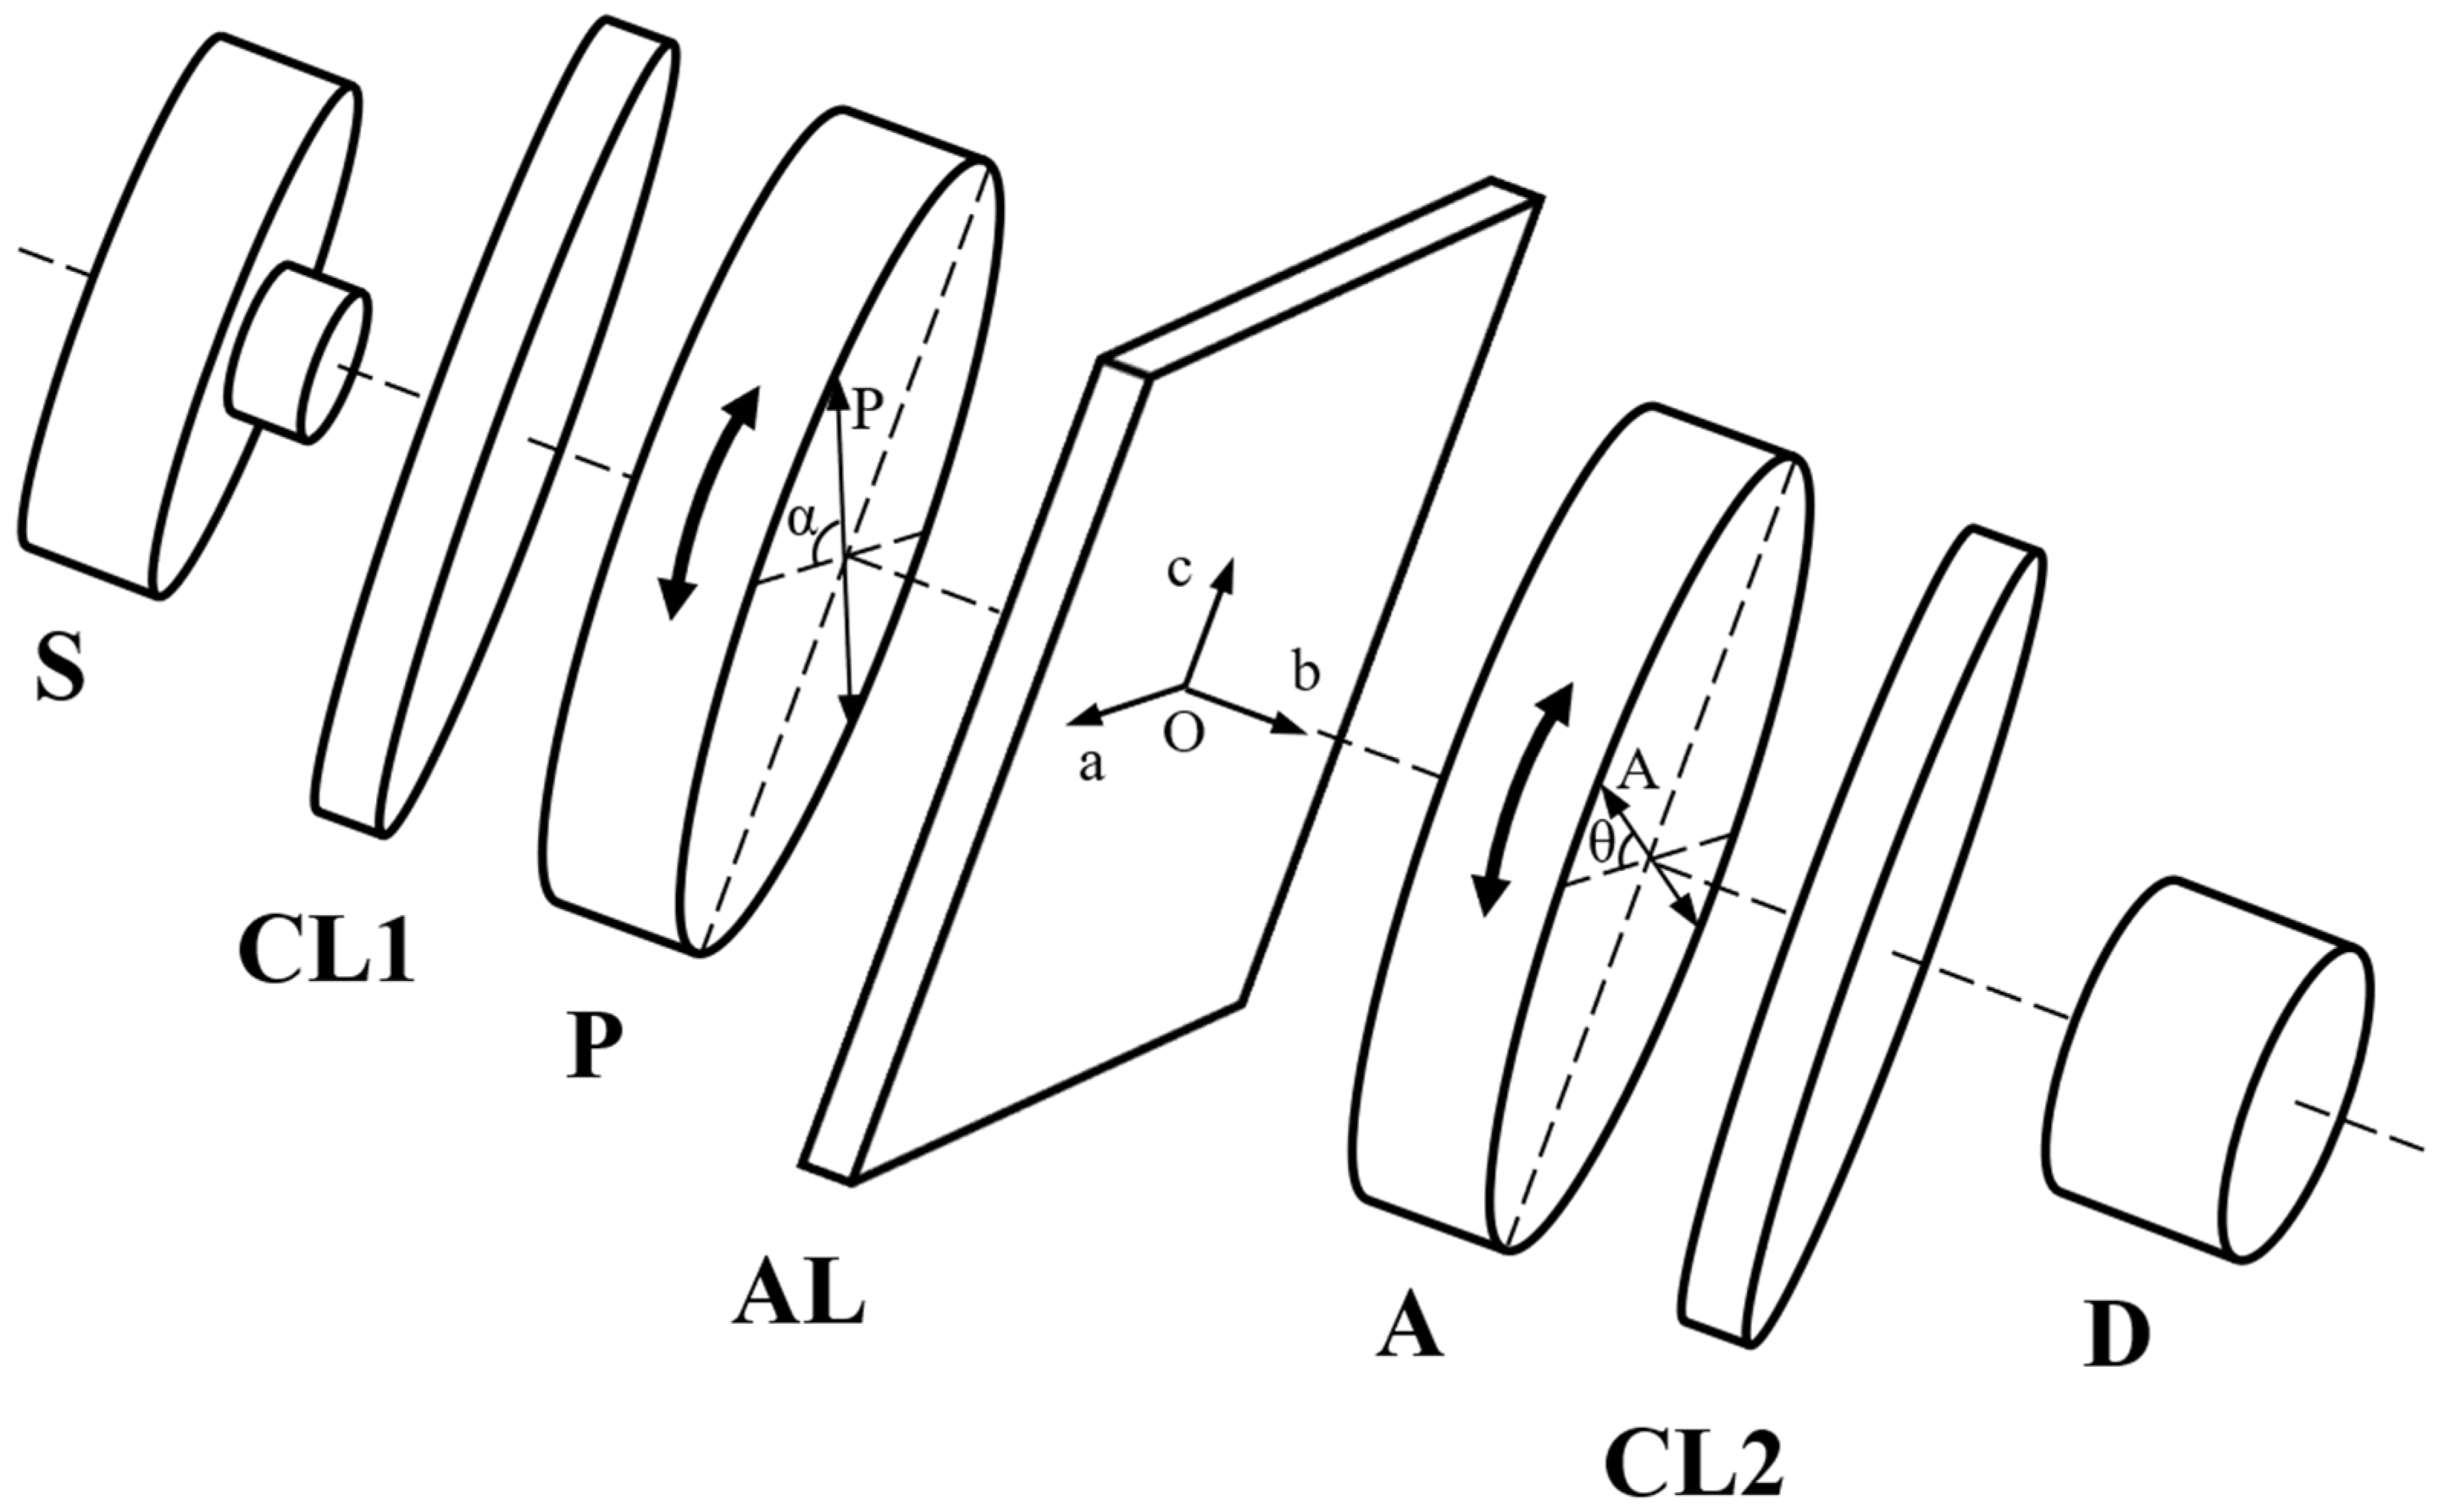
To establish the polarization state of the emergent light from the anisotropic layer, a device schematically shown in Figure 1 is used. The light emitted by a monochromatic source S is converted into linearly polarized light by the polarizing filter P. By passing through the anisotropic layer, the light changes its polarization state, being established by the analyzer A, which is also a polarizing filter, together with the detector D. The converging lens CL1 and CL2 have the roles to transform the light beam emitted by the source S into a collimated one and to condensate the collimated light beam passing through the analyzer A onto the entrance slit of the detector, respectively.
The polarization state of light after AL depends on the phase difference Δψ introduced between the ordinary and extraordinary components of light (with their electric field intensity acting perpendicular and parallel to the optical axis, respectively):
In relation (1), λ is the wavelength of the monochromatic light, and L represents the thickness of the anisotropic layer crossed by light at normal incidence.
The linear polarized light crossing the anisotropic layer at normal incidence changes its polarization state as follows:
- When Δψ = mπ, m = 0, 1, 2, …, the light remains linearly polarized, keeping its azimuth α (inclination of the electric field intensity relative to the optical axis of the anisotropic layer) if m is an even number or changing its azimuth to −α for an odd number m;
- When , m = 0, 1, 2, …, the light becomes elliptic polarized with its semiaxes parallel to the principal axes of the anisotropic layer (or circular polarized for azimuth angles being an odd number of π/4);
- For any other cases, the light is elliptically polarized with its polarization ellipse rotated relative to the principal axes of the anisotropic layer. The rotation angle θ depends on the phase difference introduced by AL.
The changes in the polarization state of the light are used for estimating the value of the difference Δψ introduced by AL between the ordinary and the extraordinary components of light.
Two methods were used in the present research for estimating the linear birefringence of PET films: the ellipsometric method, allowing for establishing the linear birefringence value for monochromatic radiation, and the channeled spectrum method, estimating the linear birefringence and its dispersion for the entire visible range. The two methods use the P-AL-A system schematically represented in Figure 1.
In the case of the ellipsometric method, the P-AL-A system (see Figure 1) is illuminated by a monochromatic source in a collimating arrangement with a convergent lens (CL1 in Figure 1). A second convergent lens (CL2 in Figure 1) gives the image of the source S on the entrance slit of the detector D, in whose external electrical circuit the signal produced by the photoelectric effect is recorded.
If, at a complete rotation of the analyzer A around the propagation direction of the light, one obtains maxim and null values of the electric current in the detector, the radiation is linearly polarized, and the above condition (a) is accomplished. If two maxima and two minima different from zero are obtained for the same rotation of the analyzer A, the radiation is elliptically polarized, and the above condition (b) or (c) is fulfilled. When the transmission direction of P is parallel or perpendicular to the stretching direction of the polymer layer, the above condition (b) is accomplished. In this case, for azimuth angles with values quarters of π, one obtains circularly polarized radiation, and the detector D will indicate a constant value of the current in its external circuit when the analyzer A is rotated around the direction of the light propagation. If an azimuth angle α exists between the transmission direction of P and the principal axis of AL, the above condition (c) is fulfilled when the phase difference introduced by AL is mπ < Δψ < (2m + 1)π/2. In this case, one notes the angle θ between the transmission direction of the analyzer A and the principal axis of AL for which the current in the external circuit of the detector D is maximum. This case is described in Figure 2. Between the azimuth angle α and the angle θ, the next relation was established [39]:
The phase difference between the ordinary and extraordinary components of light, introduced by passing through AL, can be determined with a precision limited by the periodicity of the trigonometric function cosine. For the case of the anisotropic layer with high thickness or high value of the birefringence, this imprecision can be eliminated by using two polymer foils with close values of thickness, L1 and L2, having their optical axes crossed (to minimize the phase difference at the first dial of the trigonometric circle), as it was demonstrated in [39].
The solutions of Equation (2) are
For the case 0 < Δψ < π/2, Equation (3) has a unique solution. To eliminate the imprecision of evaluation, two PET films cut from the same stretched foil and with close values of the thickness, L1 and L2, were used, having their stretching directions crossed. In this way, the ordinary ray emerging from the first film becomes an extraordinary ray in the second film, and the phase difference is diminished, according to
The ellipsometric method [40] allows for the estimation of the linear birefringence for a monochromatic component from the visible spectrum range. To determine the linear birefringence and its dispersion for the whole visible spectrum range, the method of channeled spectrum is recommended. This method supposes the use of a white light source and a spectrophotometer as a detector. Two identical polarization filters having parallel transmission directions must be introduced in the compensation beam. In the measuring beam of the spectrophotometer, the P-AL-A system is introduced with crossed polarizing filters and the principal axis of the anisotropic layer at 45° relative to the transmission directions of P and A.
To establish the conditions for the channels’ appearance, let us consider the variation in the linear birefringence with the light wavelength (Figure 3a), as well as two successive channels, corresponding to the wavelengths λm+1/2 and λm−1/2, and the maximum between them, at λm, in a channeled spectrum (Figure 3b).
According to Figure 3, the conditions of the appearance of two successive minima and the maximum between them can be written as follows:
The solutions of the equations system (5) for birefringence and its dispersion are
The method of channeled spectra allows for the estimation of the birefringence and its dispersion for a large spectral range, by measuring only the wavelengths of the maxima and minima from the channeled spectrum and the thickness of the anisotropic layer.
The polarized ATR-FTIR measurements were performed using a Bruker Vertex 70 spectrometer (Bruker Optics GMBh, Ettlingen, Germany) by using a Golden GateTM ATR accessory, with a single bounce diamond crystal at the incidence angle of 45°. The wire grid polarizer was from PerkinElmer, Waltham, MA, USA. The polarized ATR spectra were achieved for a complete rotation cycle (0–360° polarization angles) and with steps of 15°. Each spectrum was an average of 128 scans at 2 cm−1 resolution, in the 4000–600 cm−1 wavelength range. Data analysis was performed using OPUS 6.5 software (Bruker Optiks GMbH, Ettlingen, Germany).
The polarized infrared spectra of elongated PET film were measured inside the polarization ellipse in two different experimental setups by placing the sample on the ATR crystal with the uniaxial stretching direction aligned parallel (machine direction) and perpendicular (transverse direction) to the IR beam direction, set at the x axis of laboratory coordinates. The transversal electric (TE) and transversal magnetic (TM) polarized waves have the electric field direction oriented perpendicularly and, respectively, parallel on the incidence plane of radiation. The dichroic measurements of stretched PET film used the TE wave, and the ATR absorbance ratios for the MD and TD configurations of a specific band were calculated. Depending on the spectral domain under analysis, the spectra were normalized to the skeletal ν(C=C) vibrations at 1503, 1410 cm−1 or to δ(CH)o-o-p at 793 cm−1. The dichroic ratios of specific bands for initial PET have been calculated using the TE and TM waves for a fixed configuration of the sample. For the uniaxially stretched PET, the calculus of the dichroic ratio used the TE wave in the MD and TD configurations.
The dichroism spectrum was calculated as the difference between the 90° and 0° polarized spectrum, taking into consideration the difference in the relative intensity of the evanescent field for each polarization.
3. Results and Discussion
The birefringence of stretched PET films was measured using the two methods described in the above section. The degree of stretching, γ, was determined by drawing a 1 cm segment on the unstretched film and measuring its length after stretching. The stretched PET film behaves as a uniaxial anisotropic layer, and its optical axis is located along the stretching direction.
3.1. Determination of the Stretched PET Films Birefringence by Ellipsometric Method
To measure the birefringence of the stretched PET films by the ellipsometric method, a device like the one described in Figure 1 was used. As a source, a sodium lamp was used, which provides yellow light at λ = 589.3 nm. The sample is illuminated by a collimated light beam with a diameter of 6 mm. The luminous flux is recorded using a Si-based photodetector with an amplifier, consisting of the spectral range of 390–1150 nm.
The light propagates perpendicular to the film’s surface, parallel with one principal axis of the anisotropic layer (direction Ob in Figure 2 and Figure 3). The azimuth angle α is fixed by rotating the polarizer P around the propagation direction. For a given value of α, the angle θ is measured by rotating the analyzer A around the same direction until the flux density (recorded by the detector D) reaches its maximum value. The rotation angles α and θ were measured with digital inclinometers fixed on the mounts of the polarizer P and analyzer A, respectively, with an accuracy of 0.01°.
Because of the rather high values of the PET film’s birefringence, two PET films cut from the same stretched foil, having close values of the thickness, and assembled with their optical axes crossed were used. In this case, the phase difference between the ordinary and extraordinary rays introduced by the anisotropic layer is reduced, it being proportional to the difference between the thickness values of the two PET films (see Equation (4)).
The results of the measurements, made for three values of the stretching degree, are given in Table 1, Table 2 and Table 3. The values given in these tables are the average values of ten measurements.
According to Equation (2), cos Δψ is equal to the slope of the linear dependence between tan 2θ and tan 2α. Figure 4 shows this dependence for the data in Table 1, Table 2 and Table 3, respectively.
By linearly fitting the data in Figure 4, the phase difference Δψ between the ordinary and extraordinary rays can be obtained (according to Equations (2) and (3)), and then the value of the birefringence is determined using Equation (4). The obtained data are presented in Table 4.
As can be observed from Table 4, the birefringence is proportional to the stretching degree of the PET film.
3.2. Determination of the Stretched PET Films Birefringence by Channeled Spectra Method
For this method, a deuterium–tungsten halogen UV-Vis-NIR light source was used for the illumination of the PET samples, while the channeled spectra were recorded with an Ocean Optics QE65000 spectrometer (Ocean Insight, Orlando, FL, USA).
If the polarizing filters P and A are crossed and the principal axes of the PET film make an angle π/4 with the transmission directions of the polarizing filters, the transmission factor, defined as the ratio between the measured light flux and the light flux before the polymer film, is given by [40] as follows:
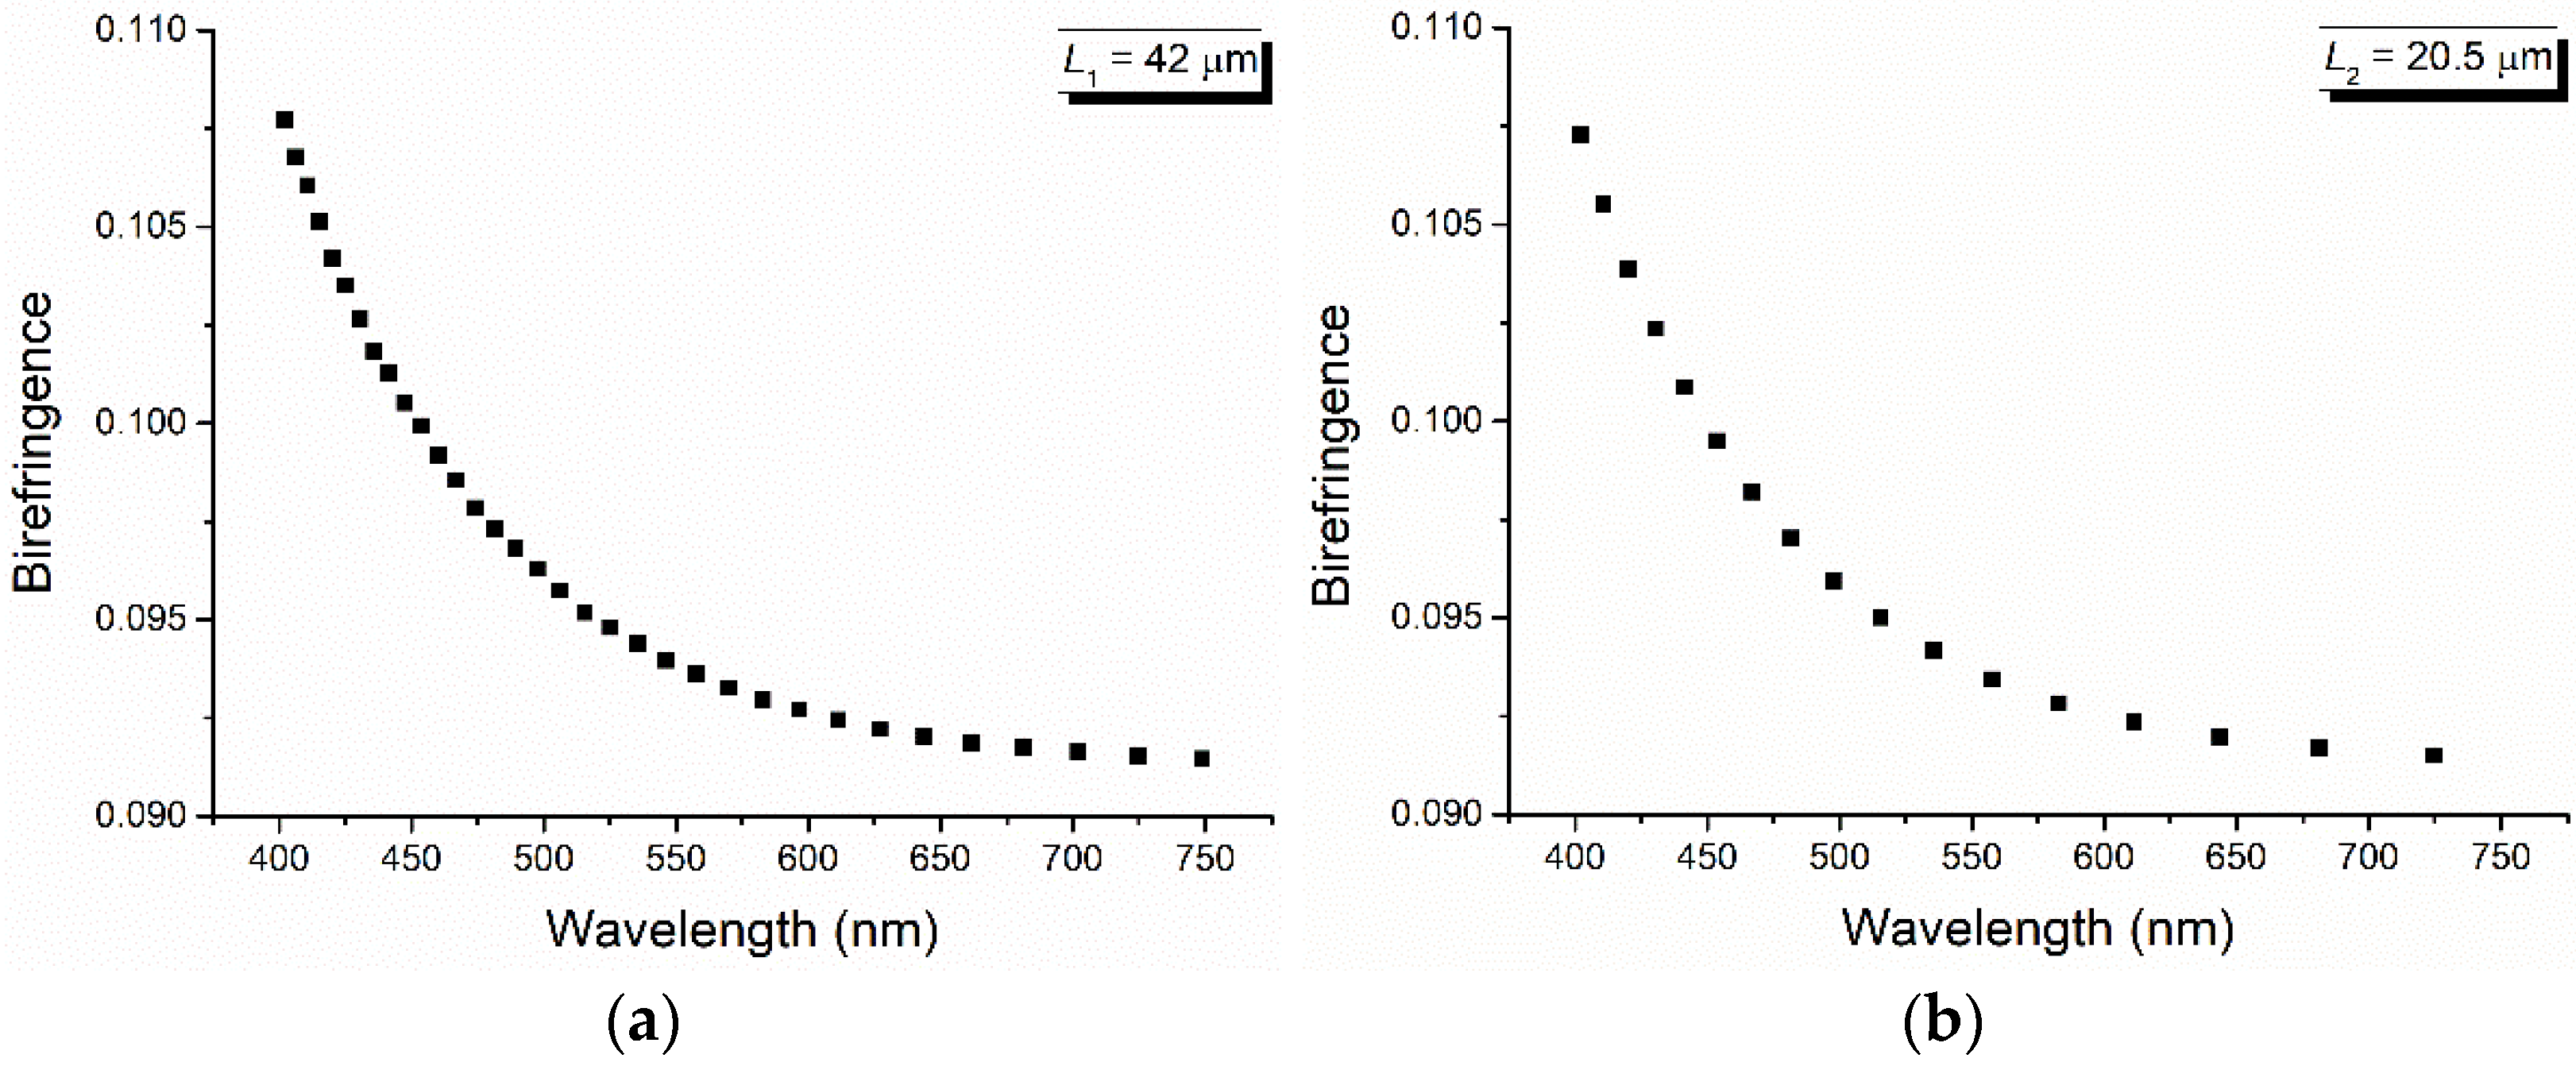
The channeled spectra obtained for two stretched PET foils with γ = 2.4 and the thickness L1 = 42 μm and L2 = 20.5 μm, respectively, are shown in Figure 5. From these spectra, by reading the values of the wavelength corresponding to the maxima and minima and applying the relations (6) and (7) (similar results are also obtained by considering two maxima and the minimum between them), the values of the birefringence and its dispersion are obtained, as shown in Figure 6 and Figure 7.
From Figure 6, a decrease in the linear birefringence for the two stretched PET films (calculated by the channeled spectra method) with the increase in the wavelength is observed. Also, the dispersion of the PET birefringence decreases with the increase in the wavelength, and its results are shown in Figure 7. This late decrease is accentuated by high values of the wavelength, a region in which it becomes linear.
3.3. Infrared Spectral Analysis
Inherently, the uniaxial drawing of a PET film is accompanied by microstructural and conformational changes. The long macromolecular chains generally become oriented towards the drawing direction, but the specific orientation may differ between conformers. The monomeric unit of PET is characterized by several rotational isomers, each pair being specifically located in one chemical moiety and giving rise to specific infrared absorptions. The trans and gauche conformers of the ethylene unit are responsible for the ordered and disordered arrangement of PET chains, so the deformation vibrations of CH2 groups are usually employed to identify and quantify the crystalline and amorphous fractions of PET. The mutual arrangement of the ester carbonyl in either cis or trans position and two other gauche and trans isomers, which arise from a free rotation in the glycol O–CH2 bond, raise the number of possible conformations in the monomeric unit and complicate the infrared spectrum. The conventional ATR infrared spectroscopy catches the average population and orientation of these conformers, but a spectral differentiation of them could be made by means of polarized ATR-FTIR spectroscopy.
3.3.1. General Remarks
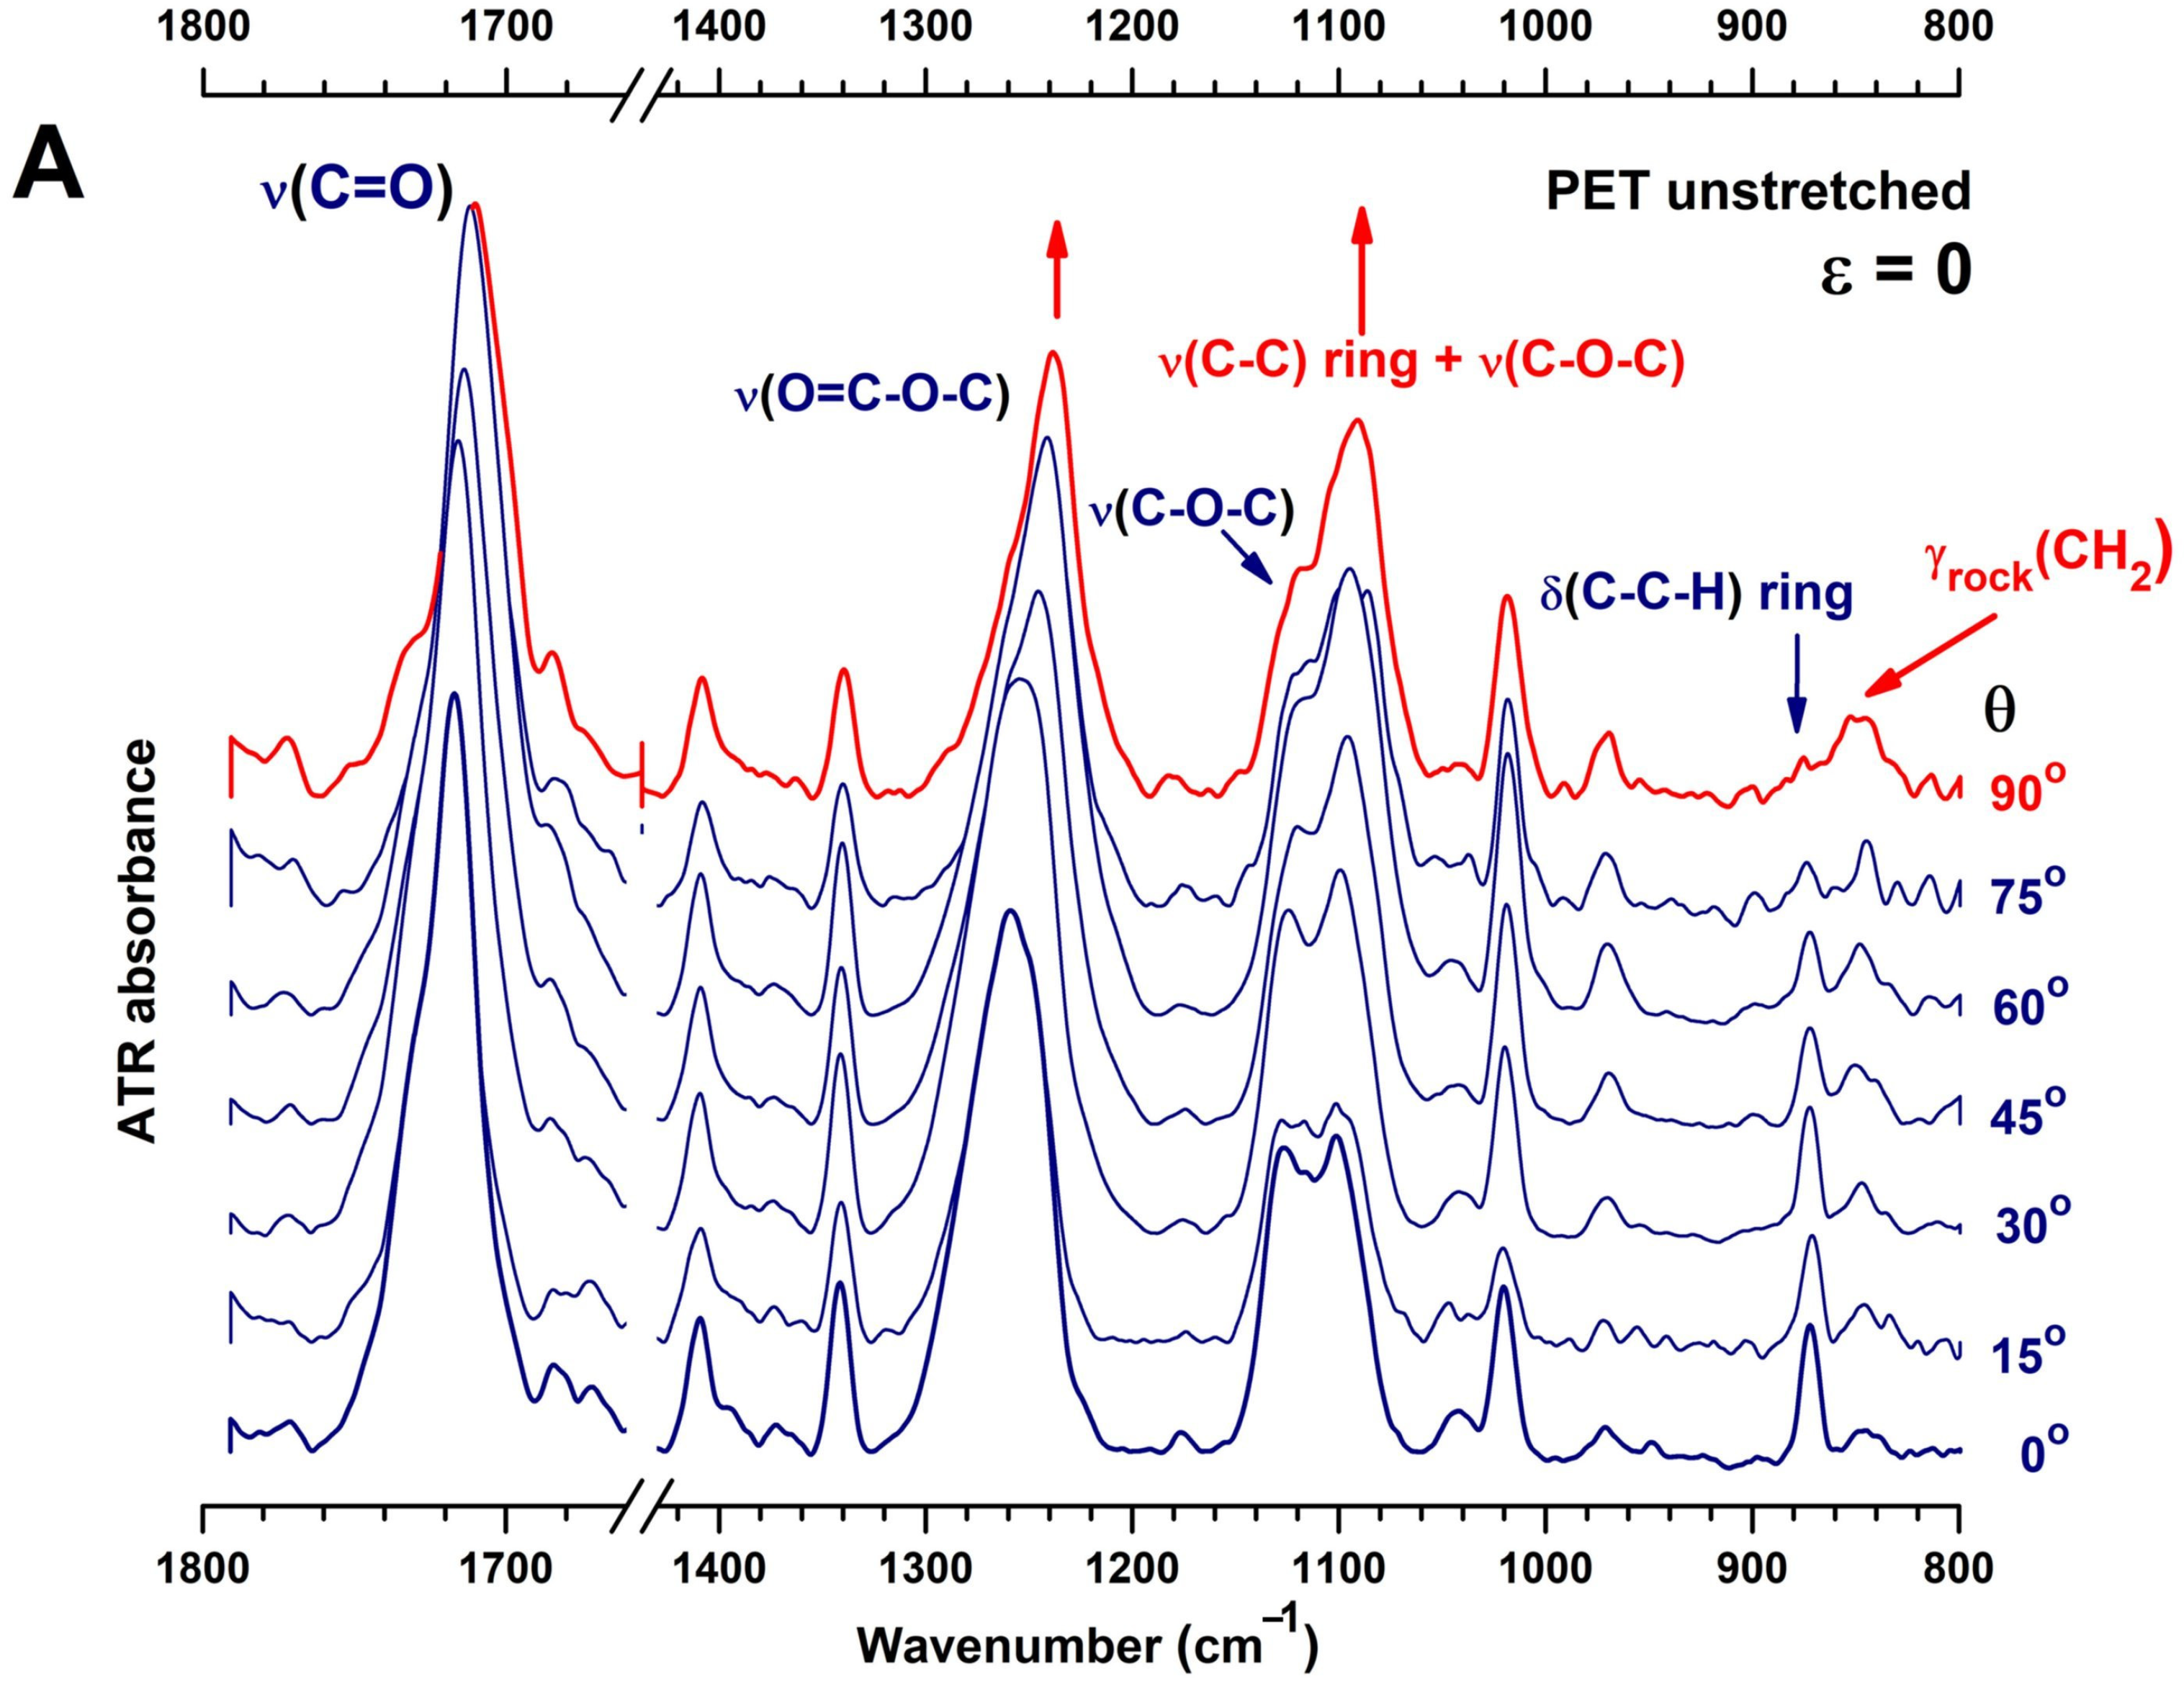
The polarized ATR-FTIR spectra of the initial PET shown in Figure 8A are selected from the spectra recorded by rotating the polarizer every 15° until a complete rotation is achieved. The strong ν(C=O), ν(O=C-O-C), [ν(C-C)ring + ν(C-O-C)], δ(C-C-H)ring and γrock(CH2) vibrations observed around 1720, 1259, 1120, 872, and 845 cm−1 change their profile according to the polarization of light and show the native anisotropy of the unstretched PET film. The bands with perpendicular polarization (referenced to the ATR–sample interface) at 1717, 1685, 1341, 1258, 1126/1101, and 872 cm−1 seem to characterize a mixture of amorphous fraction and isolated trans sequences or possessing a low degree of order. The S⊥ spectrum resembles the TX spectrum obtained by Cole et al. by factor analysis [41]. The dominance of gauche conformers is indicated by the vibrations located at 1258 cm−1 (ester ν(O=C-O-C)), 1102 and 1042 cm−1 (glycol ν(C-O)) [42]. The trans conformers are indicated by the CH2 wagging vibration at 1341 cm−1. The in-plane δ(C-H)ring peaking at 1020 cm−1 corresponds to a trans amorphous conformer [42]. The benzene δ(C-C-H)ring mode at 872 cm−1 has the transition moment oriented perpendicular to the plane of the benzene ring, and this position belongs to the trans conformational isomer [43].
The spectrum recorded with parallel polarization contains the counterpart vibrations located at 1710, 1239, and 1091 cm−1, while the 872 cm−1 band (δ(C-C-H)ring) is greatly reduced and displays a very weak mode at 876 cm−1. This peak is very close to the 878 cm−1 position that Santoro et al. assigned to disordered regions [44]. Several more vibrations appear in SII: the “folding” band at 990 cm−1 that is associated with the crystalline lamellae [45], ν(O-CH2) at 969 cm−1, and γrock(CH2) at 845 cm−1, the last two bands belonging to the trans configuration of ethylene glycol in ordered phase [41].
3.3.2. Conformational Analysis
The in-depth analysis of the S⊥ and SII spectra of the unstretched PET film allows us to differentiate several glycol and ester species. The ν(C=O) vibration is composed of the sub-bands at 1717 and 1685 cm−1 in the S⊥ spectrum and at 1735, 1710, and 1685 cm−1 in the SII spectrum. The lower band at 1685 cm−1 corresponds to carbonyl groups in crystalline regions of “all-trans” structure [41,45,46,47], probably with a high density of packing and whose great redshift results from the strong intermolecular hydrogen bonds between the ordered chains. The lack of dichroism of the 1685 cm−1 band may arise from the uniform distribution of the crystal in the 3D space. The two maxima that selectively appear at 1717 cm−1 (S⊥) and at 1710 cm−1 (SII) seem to belong to two conformers of the terephthalate moiety, which interconvert via the rearrangement of the carbonyl group with respect to the phenyl ring. This mechanism has been used by Cole et al. to partially explain the crystallization process of amorphous PET [41]. Still, the position at 1710 cm−1 indicates a higher degree of packing of adjacent chains as compared to that at 1717 cm−1, which suggests that successive carbonyl groups framing the aromatic ring have a trans orientation and the whole fragment is in planar conformation [48]. The component at 1735 cm−1 is evident in both polarizations but is distinctive in parallel polarization as it is far away from the component at 1710 cm−1. As the carbonyls groups of PET are generally oriented perpendicularly to the backbone axis, the ester species at 1735 cm−1 seem to belong to chains having a random orientation in space, with a non-planar conformation of the terephthalate segment, so they belong to fully amorphous domains.
Similarly, the complex band centered on 1120 cm−1 displays different components as a function of light polarization, which suggests that each of them has a specific orientation to the sample–ATR crystal interface. Bahl et al. described this band as a complex combination of ether and aromatic ring modes, consisting of ν(C-O-C), δ(C-O-C), δ(C-C-O), and ν(C-C) vibrations [49]. Thus, in the SII spectrum, the asymmetric band centered on 1096 cm−1 is mostly the ν(C-O-C) mode in a gauche configuration [46] and whose transition moment is oriented along the chain axis and along the interface. Its pair is observed in the S⊥ spectrum at 1102 cm−1, although Štokr et al. assigned this band to a δ(C-C-H)ring mode [46]. The peak at 1126 cm−1 that appears only in the S⊥ spectrum combines mainly ν(C-C)ring ring mode and ester ν((C=O)-O) mode, being characteristic of the ordered phase [45,46].
Application of uniaxial stretching stress of ε = 0.4 () in the so-called machine direction (MD), slightly above the Tg temperature of PET, resulted in absorbance variations that changed the shape of bands. The two sets of ATR-FTIR spectra were recorded in the MD and TD direction for a full rotation cycle of the polarizer. Figure 8B,C present the angle–resolved spectra for polarization angles between 0° and 90°. All spectra were normalized to the ring C=C stretching mode at 1410 cm−1. The first thing to notice is the reciprocal intensity variations in the ether modes centered on 1120 cm−1, broadening of the ν(C=O) vibration at 1717 cm−1, and decreasing of the chain folding band at 990 cm−1. The following spectral analysis of the stretched PET combines observations from the as-recorded spectra, dichroism spectra, and structural factor spectra.
3.3.3. Dichroism and Structural Factor Spectra
The dichroism spectra shown in Figure 9A highlight the peaks with evident dichroic character. The ester components at 1707 cm−1 (ν(C=O)) and 1234 cm−1 (ν(O=C-O-C), the glycol sub-bands at 1085 cm−1 (ν(C-O-C) and 969 cm−1 (ν(O-CH2)), and the benzene vibration at 1016 cm−1 (in-plane δ(C-H)ring) have the dipole moment oriented more or less close to the normal to the interface. The ester species that absorb at 1730 cm−1 and 1272 cm−1 have a perpendicular dichroism, with the transition moment oriented close to the ATR–film interface.
For the stretched PET, the enhanced dichroic character of the in-plane δ(C-H)ring at 1018 cm−1 was attributed by Mecozzi and Nisini [50] and Santoro et al. [44] to a planarization of the benzene ring–ester frame. The ν(C=O) component, which in native PET appeared at 1707 cm−1, downshifted to 1706 cm−1 after stretching the film and has a narrow shape due to the same phenomenon. The glycol ν(O-CH2) band at 971 cm−1 has a new profile and covers two types of trans conformers: the amorphous trans at 975 cm−1 and crystalline trans around 969 cm−1 [44,50].
By using the S⊥ and SII spectra recorded in MD mode, the “structural factor” spectrum was computed [41]. This approach eliminates the effects of the chain orientation and evidences the conformational changes or crystallization phenomena. The S0 spectrum of the stretched film resembles that of the initial film (Figure 9B). Large spectral changes are observed on the ester and glycol functionalities, and little changes in the wagging and rocking vibrations of ethylene groups, as the contour maps in Figure 9C show. Small increases in the γrock(CH2) located now at 846 cm−1, which could be thought of as an increase in the fraction of isolated and quite ordered trans sequences [45,50], is in parallel with the enhancement of the ν(O-CH2) band at 970 cm−1 (redshifted from the initial 971 cm−1). Heuvel et al. showed that the 971 cm−1 band is redshifting under stress in PET yarns due to the uncoiling of disordered chains upon elongation and planarization in the ethylene glycol segment, followed by conformational gauche-trans change [50]. In our case, the chain elongation indeed produced the alignment of the glycol segment. But the gauche-trans isomerization took place to a small extent, and the fraction of converted gauche isomers is low.
3.3.4. Dichroic Ratios and Molecular Orientation Function
The dichroism of an ATR absorption band is informative about the orientation of that specific vibration in reference to the macromolecular chain axis and to the ATR–film interface. The in-plane dichroic ratio D has been calculated as the ratio of normalized absorbances in the MD and TD modes by using the TE wave, that is . The reference peak was the aromatic ν(C=C) vibration at 1410 cm−1 for the 1500–1000 cm−1 domain and δ(CH)o-o-p at 793 cm−1 for the 1000–750 cm−1 domain. The dichroic ratio D has been further used to determine Herman’s orientation function f, expressed in its simplified form as [42]:
where D0 is the dichroic ratio of a perfect oriented sample and has the expression
The parameter α is the angle between the transition moment of a particular vibration mode and the macromolecular chain axis. The calculated values of D and f for the characteristic vibrations of PET film before and after stretching are listed in Table 5. For most of the PET vibrations, the α values are not known. However, Cunningham determined the tilt angle for the 872 cm−1 vibration of benzene as 85° [51], from which we determined the dichroic ratio as 0.28 in unstretched PET and 1.05 in oriented PET. The orientation function could be determined in our case only for the stretched PET (f = 0.02). In contrast with the literature [51,52], the values calculated by us for the dichroic ratios and for the orientation parameter are lower. The native anisotropy of the PET film, as it has been determined above in the general spectral analysis, may result from the manufacturing process of the roll.
The trans crystalline γrock(CH2) at 848 cm−1 has the initial Du = 3.79, which decreased drastically after stretching to Ds = 1.3. It appears that this band contains the absorption of a fraction of trans amorphous isomers that respond accordingly to the strain.
The dichroic ratio of the gauche γrock(CH2) vibration at 896 cm−1 can estimate the orientational behavior of amorphous regions of PET upon uniaxially stretching. The Du and Ds values are very close to each other, which is around 2, which suggests the gauche amorphous content of PET had almost zero orientation by stretching.
According to Spiby et al., the α value for the glycol ν(O-CH2) band at 975 cm−1 band is 34° [53], which leads to Du values of around 3.33 and 4.42, respectively, for the two species of trans isomers at 969 and 975 cm−1 (Table 5, Column 2). The Ds values decrease after stretching the PET film, which is quite uncommon at low stress rates, and instead appeared at draw rates higher than 3.5 due to the development of a uniplanar structure [53].
Guèvremont et al. calculated α = 21.3° for δ(CH2)wagg at 1340 cm−1 [52]. With this value, we obtained Du cryst = 0.85 and Du am = 0.98, which are much lower than those reported by Cole et al. [42] but are close to the values of Donelli et al. [54]. Uniaxial elongation of PET produced a small increase to ≈1.35 in stretched PET, and the increased dichroic ratios have been reported for both uniaxially and biaxially stretched PET [55]. The orientation factors fs in stretched PET are around 0.06 and 0.11, which are extremely close to the values calculated for the ν(O-CH2) vibrations at 969 and 975 cm−1, of 0.05 and 0.16, respectively.
3.3.5. Microstructure of Stretched PET Revealed by Polarized ATR-FTIR Spectroscopy
To relate the orientation of the above sensitive vibrations to the polarization angle of the IR radiation, the infrared response is represented in anisotropy diagrams. The polar plot representations in Figure 10 give the angle-resolved normalized ATR absorbances of unstretched and stretched PET under two experimental configurations in reference to the unstretched, isotropic PET, measured every 15°. The experimental data points were fitted with a cosine function.
These anisotropy diagrams show that the ATR-FTIR spectral changes upon uniaxial stretching can be divided into three major groups:
- A change in intensity of the stretching vibrations of elliptically symmetric ester (1234 cm−1), ether (1100 cm−1), and ring modes (1020 and 872 cm−1);
- A change in symmetry for several deformation and stretching vibrations in CH2 groups (1341 cm−1), glycol (969/975 cm−1), and ester–glycol bridge (1120 cm−1);
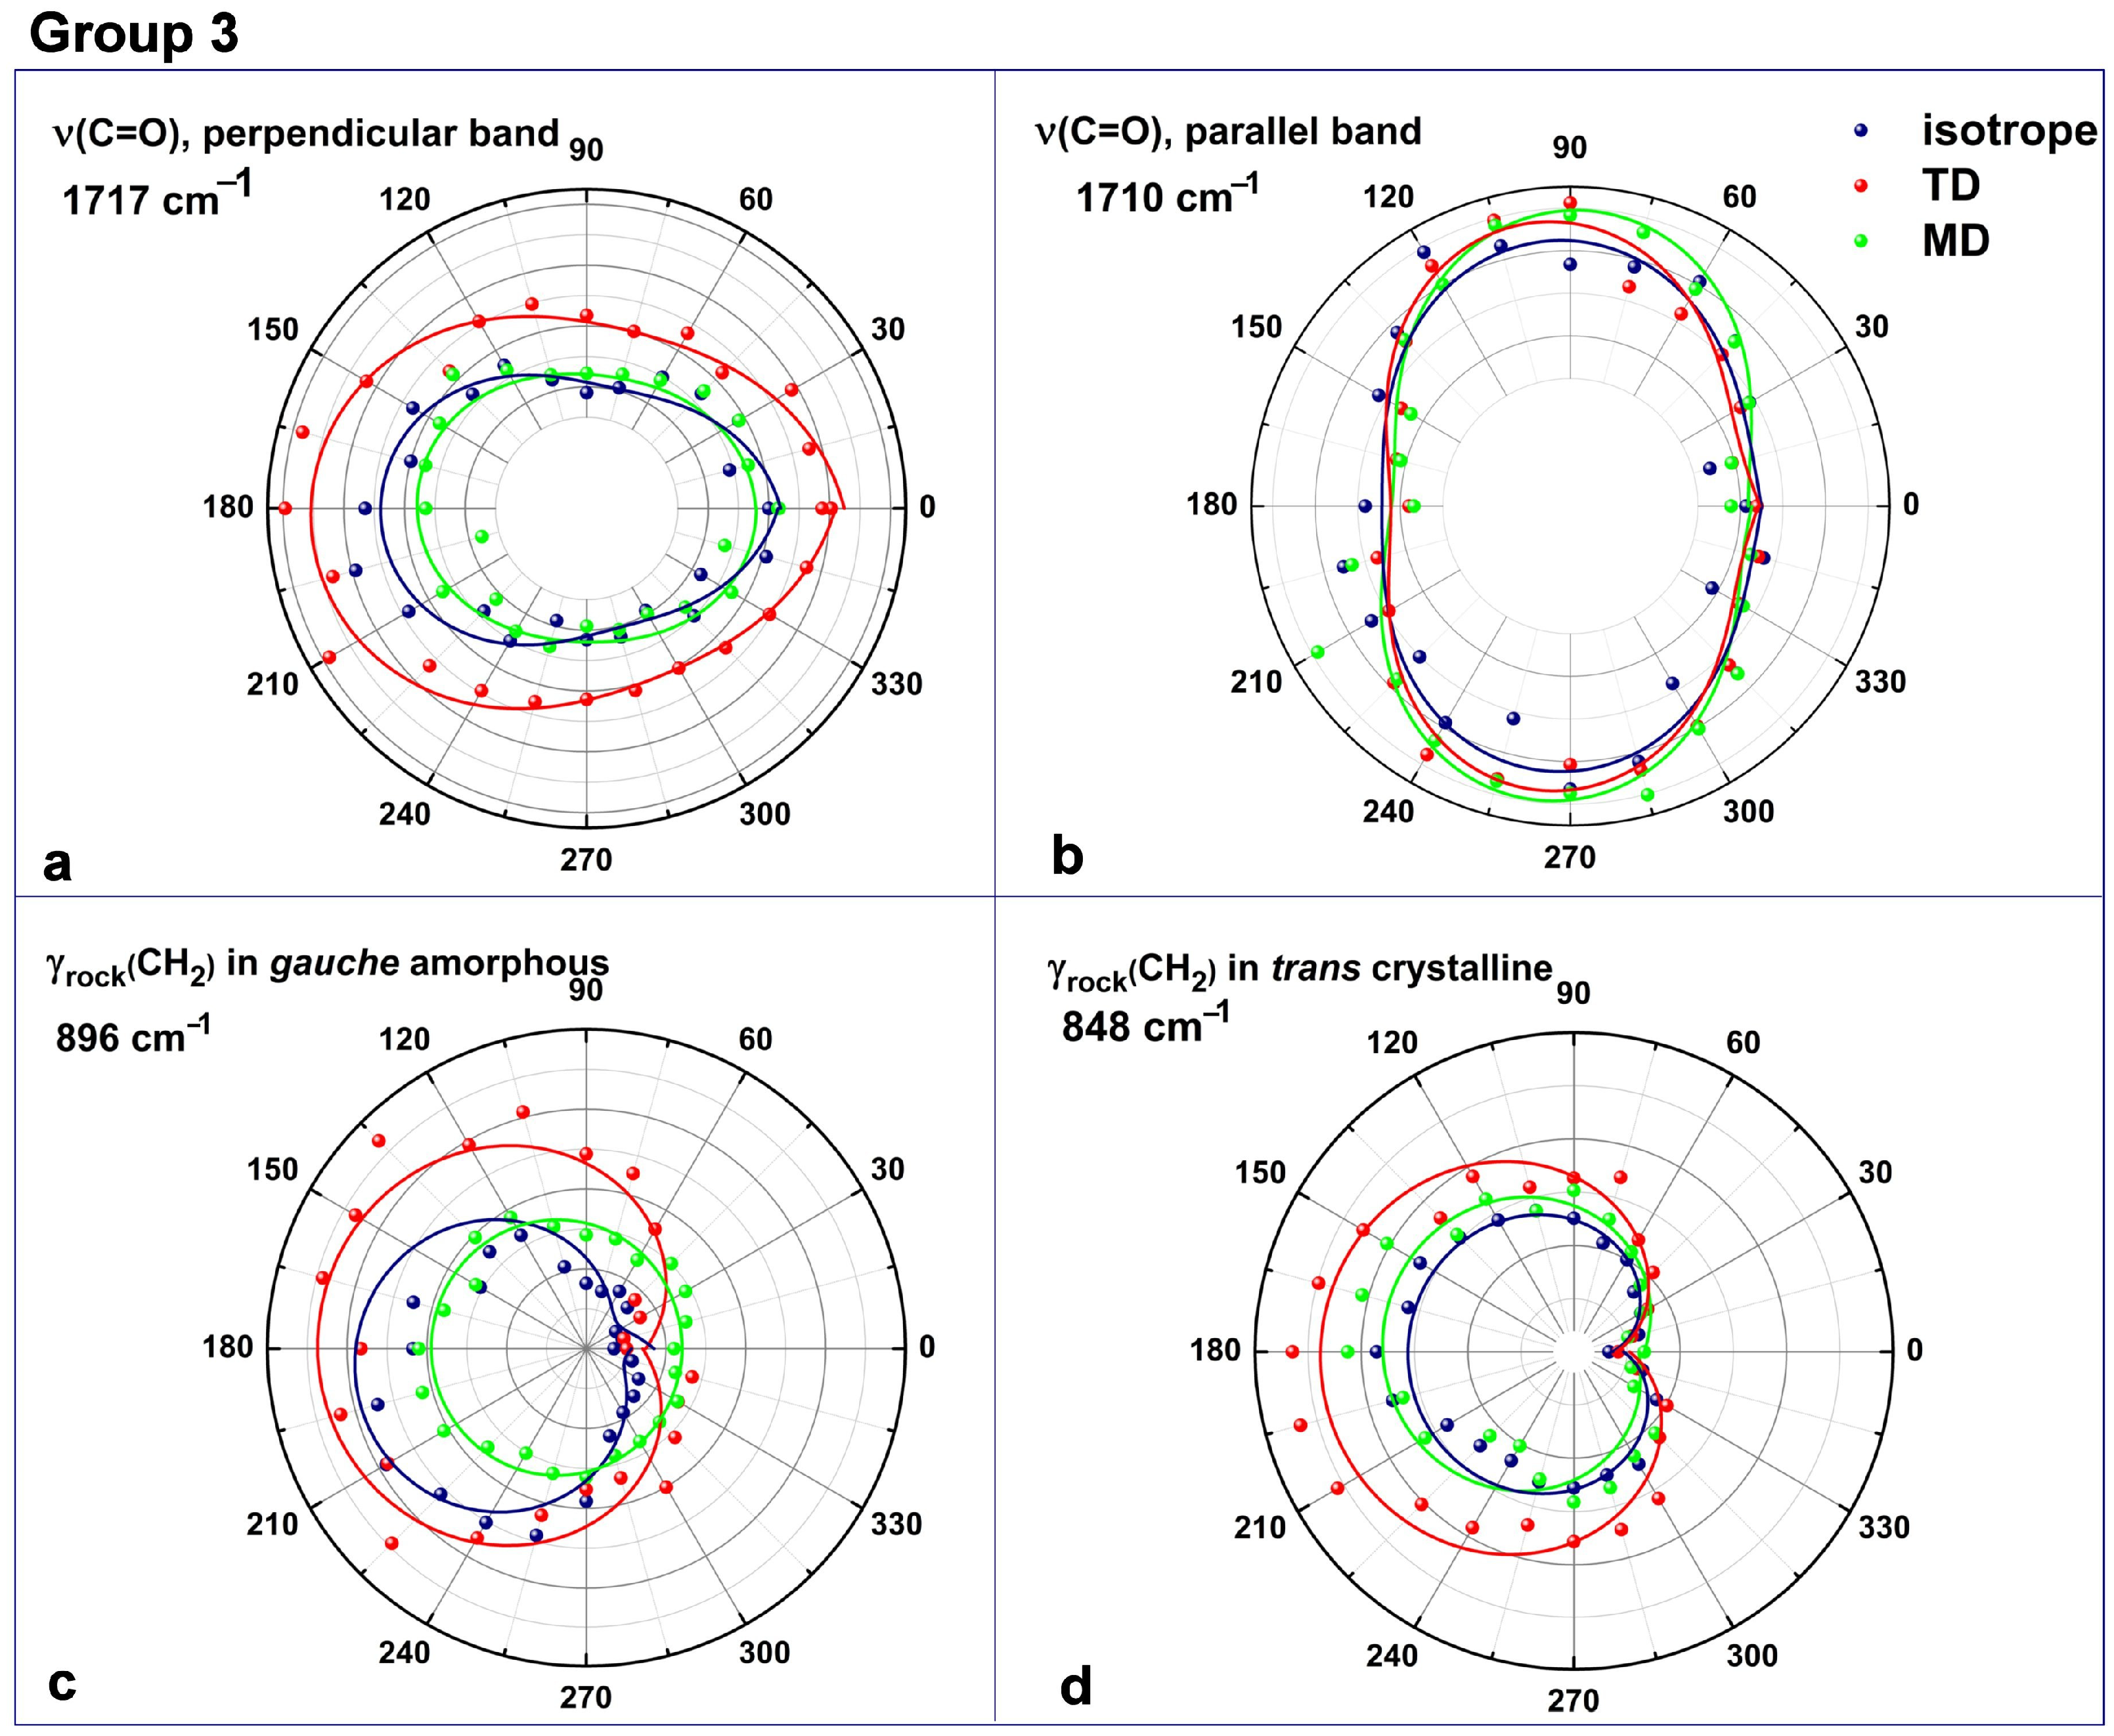
- Intensity changes without symmetry change in the rocking CH2 vibrations at 845 and 896 cm−1, and in the carbonyl stretching at 1717/1710 cm−1.
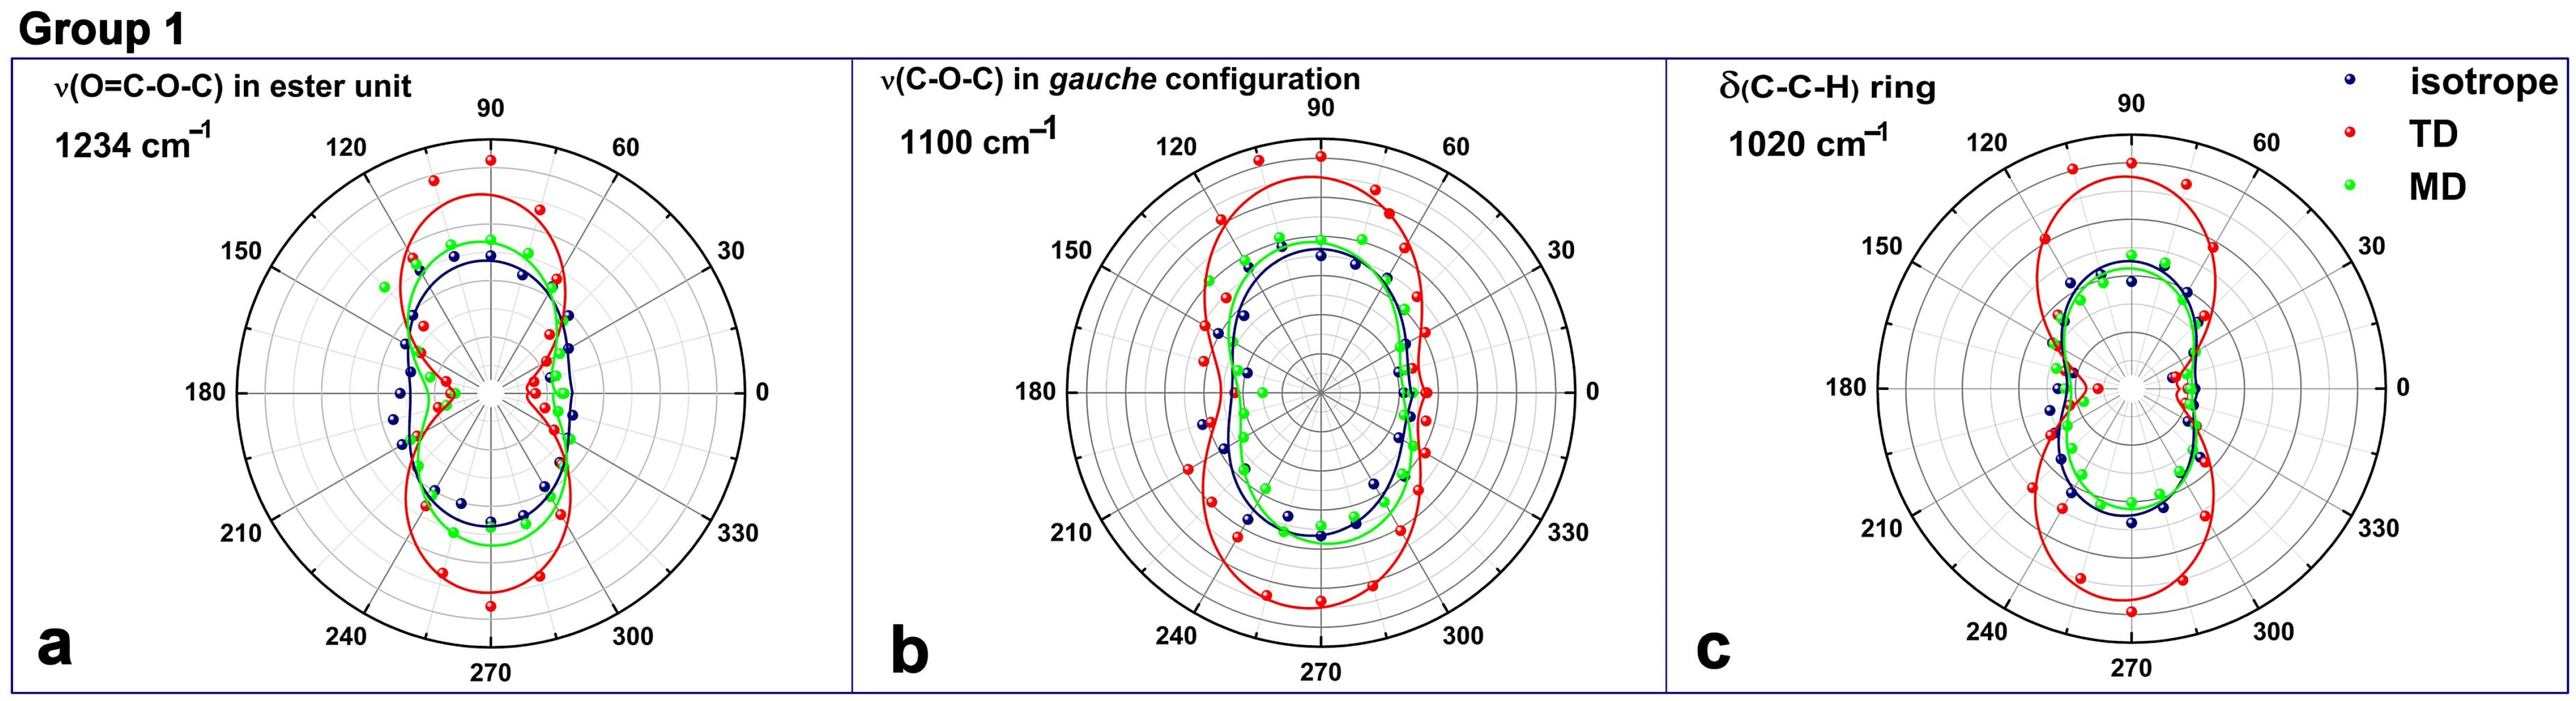
The first group contains vibrations whose polar representations have a quadrantal elliptical anisotropy in the unstretched PET, according to Figure 10. The maximum IR intensity is towards 90° and 270°, showing the preferential alignment of the dipole moment parallel to the chain axis. In stretched PET, these vibrations show a conversion towards a 2-fold symmetry with a transition period of 180° and an increase in the magnitude of the components. Still, all these modes are characteristic of gauche/amorphous domains, and in addition, the ring modes are sensitive mainly to orientational effects. So, these variations do not indicate conformational changes but suggest that more chains became oriented to a certain degree.
The second group, presented in Figure 11, consists mainly of δwagg(CH2) at 1342 cm−1 (Figure 11a), ν(C-C)ring + ν(C-O-C) at 1120 cm−1 (Figure 11b), and ν(O-CH2) at 969/975 cm−1 (Figure 11c); the initially non-symmetric (isotropic) distribution was changed to an elliptical/2-lobe symmetry. The symmetrical axis of the new structures after elongating the PET film is along the chain direction, an alignment that is best captured in the TD measurement mode. These vibrations mainly describe conformational changes in the ethylene–glycol segment and in isolated trans sequences that become ordered structures on a larger scale. Our findings share common points with observations recently evidenced via polarized Raman spectroscopy by González-Córdova et al. [56].
The polar representation of the rocking CH2 vibrations in the third group is isotropic but non-centrosymmetric (Figure 12). The two carbonyl stretching vibrations at 1710 and 1717 cm−1 are oppositely oriented in the PET chain, and their initial symmetry is elliptical with a variation period of 180° (Figure 12a,b). As elongating the PET film did not lead to any change in the relative intensity of the 1710 cm−1 band, this fact confirms the above supposition about its origin in planar sequences from crystalline structures. The distribution of ν(C=O) at 1717 cm−1 shows that, despite the preferential orientation parallel to the chain axis, these carbonyls possess a high degree of freedom, and they belong to non-planar benzene–ester segments. By uniaxial stretching, these carbonyls become more oriented along the chain axis and are closer to the ATR crystal. Like the wagging motions, the rocking vibrations are neither parallel nor perpendicular polarized, as observed from the polarized ATR spectra. The ATR intensity of γrock(CH2) mode (Figure 12c,d) uniformly maximizes with stretching but maintains the strange deviation as it was in native PET.
Finally, the relative fraction of trans and gauche conformers, fT and fG, at the PET surface have been determined on the basis of their respective δwagg(CH2) vibrations at 1341 and 1373 cm−1, respectively, according to the following relations [57]:
where OD is the optical density of the respective ATR absorption band. The polar representations of fT and of fG in Figure 13 are a reflection of the whole analysis from above for the uniaxially stretched PET film. At the elongation rate of ε = 0.4 performed slightly above the glass transition, there is a small reduction in unordered gauche conformers, whose population generally did not respond to orientation. In parallel, the alignment of isolated trans sequences in the stretching direction occurred, and these newly ordered assemblies possess an elliptical symmetry.
4. Conclusions
Two methods were used to determine the linear birefringence of stretched PET films based on the change in the polarization state of linear polarized light crossing the anisotropic layer along one principal axis different from the stretching direction. The ellipsometric method allows the determination of the linear birefringence for monochromatic radiation, while the channeled spectrum method assures the estimation of the linear birefringence and also its dispersion on a large range of the visible spectrum for which the polarization filters can be used.
The linear birefringence of PET films with small values of the stretching degree (between 1.66 and 3.1), for which PET films can be considered as uniaxial materials, increases with the stretching degree and decreases with the increase in the wavelength of visible radiation.
The linear birefringence of PET films is a dispersive parameter whose dispersion also decreases with the increase in the wavelength of visible radiation.
The obtained values for the PET film’s birefringence and its dispersion are in good agreement with the values reported in the literature.
The FTIR studies of the microstructure of PET films and the configuration of some functional groups in PET samples emphasized the anisotropic properties of PET films by the dichroic ratio and ATR ratio for both stretched and unstretched PET samples.
Author Contributions
Conceptualization, D.O.D.; methodology, M.I.A., D.G.D. and D.O.D.; software, M.I.A. and D.G.D.; validation, M.I.A., D.G.D. and D.O.D.; formal analysis, M.I.A., D.G.D. and D.O.D.; investigation, M.I.A., D.G.D. and D.O.D.; resources, M.I.A. and D.G.D.; data curation, M.I.A. and D.G.D.; writing—original draft preparation, M.I.A. and D.O.D.; writing—review and editing, D.G.D. and D.O.D.; supervision, D.O.D.; project administration, D.G.D. All authors have read and agreed to the published version of the manuscript.
Funding
The authors are thankful to the Romanian Ministry of Research, Innovation and Digitization, within Program 1—Development of the national RD system, Subprogram 1.2—Institutional Performance—RDI excellence funding projects, Contract no. 11PFE/30.12.2021, for financial support.
Institutional Review Board Statement
Not applicable.
Data Availability Statement
The data presented in this study are available upon reasonable request from the corresponding author.
Conflicts of Interest
The authors declare no conflicts of interest.
References
- Chen, S.; Xie, S.; Guang, S.; Bao, J.; Zhang, X.; Chen, W. Crystallization and thermal behaviors of poly(ethylene terephthalate)/bisphenols complexes through melt post-polycondensation. Polymers 2020, 12, 3053. [Google Scholar] [CrossRef]
- Irwin, G. Blow molding. In The Wiley Encyclopedia of Packaging Technology, 3rd ed.; Yam, K.L., Ed.; John Wiley & Sons: Hoboken, NJ, USA, 2009; pp. 137–154. [Google Scholar]
- Vallejos, S.; Trigo-López, M.; Arnaiz, A.; Miguel, Á.; Muñoz, A.; Mendía, A.; García, J.M. From classical to advanced use of polymers in food and beverage applications. Polymers 2022, 14, 4954. [Google Scholar] [CrossRef]
- Elamri, A.; Zdiri, K.; Harzallah, O.; Lallam, A. Progress in polyethylene terephthalate recycling. In Polyethylene Terephthalate: Uses, Properties and Degradation; Barber, N.A., Ed.; Nova Science Publishers: Hauppauge, NY, USA, 2017; pp. 155–185. [Google Scholar]
- Benyathiar, P.; Kumar, P.; Carpenter, G.; Brace, J.; Mishra, D.K. Polyethylene terephthalate (PET) bottle-to-bottle recycling for the beverage industry: A review. Polymers 2022, 14, 2366. [Google Scholar] [CrossRef]
- Wiria, F.E.; Tham, C.L.; Subramanian, A.S.; Tey, J.N.; Qi, X.; Cheng, C.K.; Salam, B. Improving surface quality of polyethylene terephthalate film for large area flexible electronic applications. J. Solid State Electrochem. 2016, 20, 1895–1902. [Google Scholar] [CrossRef]
- Singh, S.K.; Kachel, M.; Castillero, E.; Xue, Y.; Kalfa, D.; Ferrari, G.; George, I. Polymeric prosthetic heart valves: A review of current technologies and future directions. Front. Cardiovasc. Med. 2023, 10, 1137827. [Google Scholar] [CrossRef] [PubMed]
- Ara, C.; Akbulut, S.; Ince, V.; Aydin, C.; Gonultas, F.; Kayaalp, C.; Unal, B.; Yilmaz, S. Circumferential fence with the use of polyethylene terephthalate (Dacron) vascular graft for all-in-one hepatic venous reconstruction in right-lobe living-donor liver transplantation. Transplant. Proc. 2015, 47, 1458–1461. [Google Scholar] [CrossRef] [PubMed]
- Tinay, I.; Temiz, Y.; Ilker, Y.; Tuglular, S.; Turkeri, L. An alternative for short renal vein during kidney transplantation: Long-term experience with polyethylene terephthalate (Dacron) vascular graft. Urology 2013, 82, 245–247. [Google Scholar] [CrossRef] [PubMed]
- Gawlikowski, M.; El Fray, M.; Janiczak, K.; Zawidlak-Węgrzyńska, B.; Kustosz, R. In-vitro biocompatibility and hemocompatibility study of new PET copolyesters intended for heart assist devices. Polymers 2020, 12, 2857. [Google Scholar] [CrossRef] [PubMed]
- Szafran, K.; Jurak, M.; Mroczka, R.; Wiącek, A.E. Surface properties of the polyethylene terephthalate (PET) substrate modified with the phospholipide-polypeptide-antioxidant films: Design of functional biocoatings. Pharmaceutics 2022, 14, 2815. [Google Scholar] [CrossRef] [PubMed]
- Al Meslmani, B.; Mahmoud, G.; Strehlow, B.; Mohr, E.; Leichtweiß, T.; Bakowsky, U. Development of thrombus-resistant and cell compatible crimped polyethylene terephthalate cardiovascular grafts using surface co-immobilized heparin and collagen. Mater. Sci. Eng. C 2014, 43, 538–546. [Google Scholar] [CrossRef] [PubMed]
- Ozaltin, K.; Lehocky, M.; Humpolicek, P.; Pelkova, J.; Di Martino, A.; Karakurt, I.; Saha, P. Anticoagulant polyethylene terephthalate surface by plasma-mediated fucoidan immobilization. Polymers 2019, 11, 750. [Google Scholar] [CrossRef]
- Flores-Rojas, G.G.; López-Saucedo, F.; Vera-Graziano, R.; Magaña, H.; Mendizábal, E.; Bucio, E. Silver nanoparticles loaded on polyethylene terephthalate films grafted with chitosan. Polymers 2023, 15, 125. [Google Scholar] [CrossRef]
- Çaykara, T.; Sande, M.G.; Azoia, N.; Rodrigues, L.R.; Silva, C.J. Exploring the potential of polyethylene terephthalate in the design of antibacterial surfaces. Med. Microbiol. Immunol. 2020, 209, 363–372. [Google Scholar] [CrossRef]
- Sant’Ana, P.L.; Bortoleto, J.R.R.; da Cruz, N.C.; Rangel, E.C.; Durrant, S.F.; Botti, L.M.C.; Anjos, C.A.R.; Azevedo, S.; Isabel, C.; Teixeira, V.; et al. Surface properties of PET polymer treated by plasma immersion techniques for food packaging. Int. J. Nano Res. 2018, 1, 33–41. [Google Scholar] [CrossRef]
- Liu, Y.; Chen, Q.; Du, X.; Li, L.; Li, P. Surface modification of polyethylene terephthalate films by direct fluorination. AIP Adv. 2018, 8, 125333. [Google Scholar] [CrossRef]
- Silva, G.G.; da Costa Valente, M.L.; Bachmann, L.; dos Reis, A.C. Use of polyethylene terephthalate as a prosthetic component in the prothesis on an overdenture implant. Mater. Sci. Eng. C 2019, 99, 1341–1349. [Google Scholar] [CrossRef]
- Yang, J.; Jiang, J.; Li, Y.; Li, H.; Jing, Y.; Wu, P.; Yu, D.; Chen, S. A new strategy to enhance artificial ligament graft osseointegration in the bone tunnel using hydroxypropylcellulose. Int. Orthop. 2013, 37, 515–521. [Google Scholar] [CrossRef] [PubMed]
- Huang, J.; Chen, F.; Jian, G.; Ye, Z.; Wang, Z.; Liu, H.; Kang, Y. Effect of culture complex of BMSCs and sodium hydroxide- and GRGDSPC-treated PET on the reconstruction of injured anterior cruciate ligament in a rabbit model. Int. J. Clin. Exp. Med. 2015, 8, 6902–6913. [Google Scholar] [PubMed]
- Apel, P.Y. Fabrication and functional micro- and nanoporous materials from polymers modified by swift heavy ions. Radiat. Phys. Chem. 2019, 159, 25–34. [Google Scholar] [CrossRef]
- Kusumoto, T.; Barillon, R.; Yamauchi, T. Application of radial electron fluence around ion tracks for the description of track response data of polyethylene terephthalate as a polymeric nuclear track detector. Nucl. Instrum. Methods Phys. Res. B 2019, 461, 260–266. [Google Scholar] [CrossRef]
- Zdorovets, M.V.; Korolkov, I.V.; Yeszhanov, A.B.; Gorin, Y.G. Functionalization of PET track-etched membranes by UV-induced graft (co)polymerization for detection of heavy metal ions in water. Polymers 2019, 11, 1876. [Google Scholar] [CrossRef]
- Kim, S.-J.; Phung, T.H.; Kim, S.; Rahman, M.K.; Kwon, K.S. Low-cost fabrication method for thin, flexible, and transparent touch screen sensors. Adv. Mater. Technol. 2020, 5, 2000441. [Google Scholar] [CrossRef]
- Yu, Y.-Y.; Ting, Y.-J.; Chung, C.-L.; Tsai, T.-W.; Chen, C.-P. Comprehensive study on chemical and hot press-treated silver nanowires for efficient polymer solar cell application. Polymers 2017, 9, 635. [Google Scholar] [CrossRef] [PubMed]
- Girtan, M.; Negulescu, B. A review on oxide/metal/oxide thin films on flexible substrates as electrodes for organic and perovskite solar cells. Opt. Mater. X 2022, 13, 100122. [Google Scholar] [CrossRef]
- Chen, C.N.; Chen, C.P.; Dong, T.-Y.; Chang, T.C.; Chen, M.C.; Chen, H.T.; Chen, I.G. Using nanoparticles as direct-injection printing ink to fabricate conductive silver features on a transparent flexible PET substrate at room temperature. Acta Mater. 2012, 60, 5914–5924. [Google Scholar] [CrossRef]
- Breil, J. Future trends for biaxially oriented films and orienting lines. In Biaxial Stretching of Film. Principles and Applications; DeMeuse, M.T., Ed.; Woodhead Publishing: Cambridge, UK, 2011; pp. 240–273. [Google Scholar] [CrossRef]
- Zhou, Z.; Jiang, H.; Gu, H.; Chen, X.; Peng, H.; Liao, Y.; Liu, S.; Xie, X. Strain-optical behavior of polyethylene terephthalate film during uniaxial stretching investigated by Mueller matrix ellipsometry. Polymer 2019, 182, 121842. [Google Scholar] [CrossRef]
- He, Q.; Wang, M.; Du, Y.; Qin, Q.; Qiu, W. Quantitative characterization of the anisotropy of the stress-optical properties of polyethylene terephthalate films based on the photoelastic method. Polymers 2022, 14, 3257. [Google Scholar] [CrossRef] [PubMed]
- Schmidegg, K.; Sun, L.D.; Zeppenfeld, P. Optical and mechanical anisotropies of oriented poly(ethylene terephthalate) films. Appl. Phys. Lett. 2006, 89, 051906. [Google Scholar] [CrossRef]
- El-Farahaty, K.A.; Sadik, A.M.; Hezma, A.M. Study of optical and structure properties of polyester (PET) and copolyester (PETG) fibers by interferometry. Int. J. Polym. Mater. 2007, 56, 715–728. [Google Scholar] [CrossRef]
- Li, L.; Wen, J.; Wang, Y.; Jin, Y.; Wen, Y.; Sun, J.; Zhao, Q.; Bo, L.; Zhou, J. Reflection-type transparent metamaterial polarization rotator with ultra-wide bandwidth. J. Phys. D Appl. Phys. 2023, 56, 475106. [Google Scholar] [CrossRef]
- Yang, S.M.; Hong, S.; Kim, S.Y. Optical, mechanical, and photoelastic anisotropy of biaxially stretched polyethylene terephthalate films studied using transmission ellipsometer equipped with strain camera and stress gauge. J. Polym. Sci. B Polym. Phys. 2019, 57, 152–160. [Google Scholar] [CrossRef]
- Scripa (Tudose), A.E.; Dimitriu, D.G.; Dorohoi, D.O. Linear birefringence of polymer foils determined by optical means. J. Mol. Struct. 2017, 1140, 67–70. [Google Scholar] [CrossRef]
- Yang, S.M.; Hong, S.; Kim, S.Y. Wavelength dependent in-plane birefringence of transparent flexible films determined by using transmission ellipsometry. Jpn. J. Appl. Phys. 2018, 57, 05GB03. [Google Scholar] [CrossRef]
- Stchakovsky, M.; Caillaud, C.; Foldyna, M.; Ossikovski, R.; Garcia-Caurel, E. Polarimetric characterization of optically anisotropic flexible substrates. Thin Solid Films 2008, 516, 1414–1418. [Google Scholar] [CrossRef]
- Makhlouka, Y.; Sanaâ, F.; Gharbia, M. Ordinary and extraordinary complex refractive indices extraction of a Mylar films by transmission spectrophotometry. Polymers 2022, 14, 1805. [Google Scholar] [CrossRef] [PubMed]
- Postolache, M.; Dimitriu, D.G.; Nechifor, C.D.; Condurache Bota, S.; Closca, V.; Dorohoi, D.O. Birefringence of thin uniaxial polymer films estimated using the light polarization ellipse. Polymers 2022, 14, 1063. [Google Scholar] [CrossRef] [PubMed]
- Cosutchi, A.I.; Dimitriu, D.G.; Zelinschi, C.B.; Breaban, I.; Dorohoi, D.O. Optical activity of transparent polymer layers characterized by spectral means. J. Mol. Struct. 2015, 1090, 39–43. [Google Scholar] [CrossRef]
- Cole, K.C.; Ajji, A.; Pellerin, E. New insights into the development of ordered structure in poly(ethylene terephthalate). 1. Results from external reflection infrared spectroscopy. Macromolecules 2002, 35, 770–784. [Google Scholar] [CrossRef]
- Cole, K.C.; Guevremont, J.; Ajji, A.; Dumoulin, M.M. Characterization of surface orientation in poly(ethylene terephthalate) by front-surface reflection infrared spectroscopy. Appl. Spectrosc. 1994, 48, 1513–1521. [Google Scholar] [CrossRef]
- Fina, L.J.; Koenig, J.L. Studies of chain folding in solution-crystallized poly(ethylene terephthalate). Macromolecules 1984, 17, 2572–2579. [Google Scholar] [CrossRef]
- Santoro, G.; Ochando, I.M.; Ellis, G. Advanced vibrational microspectroscopic study of conformational changes within a craze in poly(ethylene terephthalate). Macromolecules 2015, 48, 1162–1168. [Google Scholar] [CrossRef]
- D’Esposito, L.; Koenig, J.L. Application of Fourier transform infrared spectroscopy to the study of semicrystalline polymers: Poly(ethylene terephthalate). J. Polym. Sci. Polym. Phys. Ed. 1976, 14, 1731–1741. [Google Scholar] [CrossRef]
- Štokr, J.; Schneider, B.; Doskočilová, D.; Lövy, J.; Sedláček, P. Conformational structure of poly(ethylene terephthalate). Infra-red, Raman and n.m.r. spectra. Polymer 1982, 23, 714–721. [Google Scholar] [CrossRef]
- Forestier, E.; Guigo, N.; Combeaud, C.; Billon, N.; Sbirrazzuoli, N. Conformational change analysis of poly(ethylene 2,5-furandicarboxylate) and poly(ethylene terephthalate) under uniaxial stretching. Macromolecules 2020, 53, 8693–8703. [Google Scholar] [CrossRef]
- Melveger, A.J. Laser-Raman study of crystallinity changes in poly(ethylene terephthalate). J. Polym. Sci. A-2 Polym. Phys. 1972, 10, 317–322. [Google Scholar] [CrossRef]
- Bahl, S.K.; Cornell, D.D.; Boerio, F.J.; McGraw, G.E. Interpretation of the vibrational spectra of poly(ethylene terephthalate). J. Polym. Sci. Polym. Lett. Ed. 1974, 12, 13–19. [Google Scholar] [CrossRef]
- Mecozzi, M.; Nisini, L. The differentiation of biodegradable and non-biodegradable polyethylene terephthalate (PET) samples by FTIR spectroscopy: A potential support for the structural differentiation of PET in environmental analysis. Infrared Phys. Technol. 2019, 101, 119–126. [Google Scholar] [CrossRef]
- Cunningham, A.; Ward, I.M.; Willis, H.A.; Zichy, V. An infra-red spectroscopic study of molecular orientation and conformational changes in poly(ethylene terephthalate). Polymer 1974, 15, 749–756. [Google Scholar] [CrossRef]
- Guévremont, J.; Ajji, A.; Cole, K.C.; Dumoulin, M.M. Orientation and conformation in poly(ethylene terephthalate) with low draw ratios as characterized by specular reflection infra-red spectroscopy. Polymer 1995, 36, 3385–3392. [Google Scholar] [CrossRef]
- Spiby, P.; O’Neill, M.A.; Duckett, R.A.; Ward, I.M. An infra-red study of conformational changes occurring during the drawing of PEMT, PET and PEMT/PET copolymer. Polymer 1992, 33, 4479–4485. [Google Scholar] [CrossRef]
- Donelli, I.; Freddi, G.; Nierstrasz, V.A.; Taddei, P. Surface structure and properties of poly-(ethylene terephthalate) hydrolyzed by alkali and cutinase. Polym. Degrad. Stab. 2010, 95, 1542–1550. [Google Scholar] [CrossRef]
- Lofgren, E.A.; Jabarin, S.A. Polarized internal reflectance spectroscopic studies of oriented poly(ethylene terephthalate). J. Appl. Polym. Sci. 1994, 51, 1251–1267. [Google Scholar] [CrossRef]
- González-Córdova, J.A.; Ariza-Flores, D.; Pérez-Huerta, J.S.; Madrigal-Melchor, J.; López-Miranda, A.; Ortega-Gallegos, J. Optical anisotropy Raman response of polyethylene terephthalate strained thin films. Physica B 2023, 654, 414693. [Google Scholar] [CrossRef]
- Zhang, Y.; Lu, Y.; Duan, Y.; Zhang, J.; Yan, S.; Shen, D. Reflection–absorption infrared spectroscopy investigation of the crystallization kinetics of poly(ethylene terephthalate) ultrathin films. J. Polym. Sci. B 2004, 42, 4440–4447. [Google Scholar] [CrossRef]
Figure 1.
Schematic representation of the device used to establish the birefringence of the anisotropic later (stretched PET films). S—light source, CL1, and CL2—converging lens, P and A—polarizing filters with the role of polarizer and analyzer, respectively, AL—anisotropic layer, D—detector, α—azimuth angle between the transmission direction of the polarizing filter P and the principal axis Oa of the anisotropic layer, θ—azimuth angle between the transmission direction of the polarizing filter A and the principal axis Oa, for which the signal in the detector D has a maximum value.

Figure 2.
Relative positions of the transmission directions of the polarizing filters P and A in the principal plane Oac of the anisotropic layer.
Figure 2.
Relative positions of the transmission directions of the polarizing filters P and A in the principal plane Oac of the anisotropic layer.

Figure 3.
Variation in the linear birefringence with the wavelength (a), as well as two successive channels and the maximum between them in a channeled spectrum (b).
Figure 3.
Variation in the linear birefringence with the wavelength (a), as well as two successive channels and the maximum between them in a channeled spectrum (b).

Figure 4.
Variation in tan 2θ versus tan 2α for the PET films with the stretching degrees γ = 3.1 (a), γ = 2.4 (b), and γ = 1.66 (c).
Figure 4.
Variation in tan 2θ versus tan 2α for the PET films with the stretching degrees γ = 3.1 (a), γ = 2.4 (b), and γ = 1.66 (c).

Figure 5.
Channeled spectra recorded for two stretched PET films with stretched degree γ = 2.4 and the thickness L1 = 42 μm (a) and L2 = 20.5 μm (b).
Figure 5.
Channeled spectra recorded for two stretched PET films with stretched degree γ = 2.4 and the thickness L1 = 42 μm (a) and L2 = 20.5 μm (b).

Figure 6.
Birefringence calculated from the channeled spectra for two stretched PET films with stretched degree γ = 2.4 and the thickness L1 = 42 μm (a) and L2 = 20.5 μm (b).
Figure 6.
Birefringence calculated from the channeled spectra for two stretched PET films with stretched degree γ = 2.4 and the thickness L1 = 42 μm (a) and L2 = 20.5 μm (b).

Figure 7.
Dispersion of birefringence calculated from channeled spectra for two stretched PET films with stretched degree γ = 2.4 and the thickness L1 = 42 μm (a) and L2 = 20.5 μm (b).
Figure 7.
Dispersion of birefringence calculated from channeled spectra for two stretched PET films with stretched degree γ = 2.4 and the thickness L1 = 42 μm (a) and L2 = 20.5 μm (b).

Figure 8.
Polarized ATR-FTIR spectra in the fingerprint region of a commercial PET film, before and after stretching: (A) angle-resolved polarized ATR spectra of unstretched PET film for polarization angles between 0 and 90°; (B,C) parallel and perpendicularly ATR polarized spectra of the uniaxially stretched PET (ε = 0.4), recorded in the machine direction (MD) and transverse direction (TD), respectively. The arrows indicate ATR modes whose transition dipole moments are oriented parallel (red) and perpendicular (dark blue) to the ATR crystal and chain axis.


Figure 9.
Advanced infrared spectral analysis of uniaxially stretched PET in comparison to native PET: (A) dichroism spectra (SII − S⊥); (B) structural factor spectra; (C) polarized ATR spectra presented as color contour maps for the complete rotation of the polarizer, in three regions that correspond to vibrations of the ethylene glycol segment: ethylene wagging, ether stretching and ethylene rocking. The red arrows mark the vibrations with significant change after uniaxial elongation.


Figure 10.
Polar representations of ATR-FTIR absorbance for the first group that defines the spectral changes (see text) as a function of polarization angle θ: (a) ester stretching at 1234 cm−1, (b) ether stretching at 1100 cm−1; (c) ring deformation at 1020 cm−1. The dots are the experimental data points that have been fitted with a cosine function. Experimental configurations: MD—green dots, TD—red dots, unstretched PET—dark blue dots.

Figure 11.
Polar representations of ATR-FTIR absorbance for the second group, which is characteristic mainly to trans sequences: (a,b) crystalline trans; (c) amorphous trans. The experimental and data analysis aspects are the same as those in Figure 10.
Figure 11.
Polar representations of ATR-FTIR absorbance for the second group, which is characteristic mainly to trans sequences: (a,b) crystalline trans; (c) amorphous trans. The experimental and data analysis aspects are the same as those in Figure 10.

Figure 12.
Polar representations of ATR-FTIR absorbance for the third group, whose spectral changes withdrawing are minimal: (a,b) the two components of the carbonyl stretching vibration; (c,d) methylene rocking vibrations in crystalline and amorphous domains, respectively. The experimental and data analysis aspects are the same as those in Figure 10.

Figure 13.
Anisotropy of the relative populations of trans (a) and gauche (b) conformers. The solid lines are fitted curves by a cosine function of the experimental data points.
Figure 13.
Anisotropy of the relative populations of trans (a) and gauche (b) conformers. The solid lines are fitted curves by a cosine function of the experimental data points.


Table 1.
Results of the ellipsometric measurements for PET films with γ = 3.1.
| ΔL (μm) | α (°) | θ (°) | tan 2α | tan 2θ |
|---|---|---|---|---|
| 1.0 | 10 | 4.80 | 0.36397 | 0.16914 |
| 20 | 10.90 | 0.83910 | 0.39997 | |
| 30 | 20.00 | 1.73205 | 0.83910 | |
| 40 | 34.90 | 5.67128 | 2.71792 | |
| 44 | 42.90 | 28.63625 | 13.61741 | |
| 1.2 | 10 | 2.62 | 0.36397 | 0.09171 |
| 20 | 5.84 | 0.83910 | 0.20673 | |
| 30 | 11.52 | 1.73205 | 0.42530 | |
| 40 | 27.80 | 5.67128 | 1.46046 | |
| 44 | 40.09 | 28.63625 | 5.77736 | |
| 2.0 | 10 | 84.50 | 0.36397 | −0.19438 |
| 20 | 76.91 | 0.83910 | −0.49163 | |
| 30 | 67.30 | 1.73205 | −1.01406 | |
| 40 | 52.98 | 5.67128 | −3.49663 | |
| 44 | 46.74 | 28.63625 | −16.44405 |
Table 2.
Results of the ellipsometric measurements for PET films with γ = 2.4.
| ΔL (μm) | α (°) | θ (°) | tan 2α | tan 2θ |
|---|---|---|---|---|
| 1.0 | 10 | 5.20 | 0.36397 | 0.18353 |
| 20 | 11.45 | 0.83910 | 0.42242 | |
| 30 | 21.10 | 1.73205 | 0.90674 | |
| 40 | 35.40 | 5.67128 | 2.87161 | |
| 44 | 43.10 | 28.63625 | 15.05572 | |
| 1.3 | 10 | 2.55 | 0.36397 | 0.08925 |
| 20 | 5.65 | 0.83910 | 0.19982 | |
| 30 | 11.20 | 1.73205 | 0.41217 | |
| 40 | 26.69 | 5.67128 | 1.34552 | |
| 44 | 40.80 | 28.63625 | 6.77199 |
Table 3.
Results of the ellipsometric measurements for PET films with γ = 1.66.
| ΔL (μm) | α(°) | θ(°) | tan 2α | tan 2θ |
|---|---|---|---|---|
| 1.25 | 10 | 8.05 | 0.36397 | 0.28864 |
| 20 | 16.80 | 0.83910 | 0.66440 | |
| 30 | 26.95 | 1.73205 | 1.37134 | |
| 40 | 38.65 | 5.67128 | 4.43735 | |
| 44 | 43.72 | 28.63625 | 22.36627 | |
| 2.25 | 10 | 3.80 | 0.36397 | 0.13343 |
| 20 | 8.51 | 0.83910 | 0.30611 | |
| 30 | 16.10 | 1.73205 | 0.62973 | |
| 40 | 31.90 | 5.67128 | 2.03227 | |
| 44 | 42.30 | 28.63625 | 10.57889 |
Table 4.
Phase difference between the ordinary and extraordinary rays Δψ and the birefringence of PET films with different stretching degrees.
Table 4.
Phase difference between the ordinary and extraordinary rays Δψ and the birefringence of PET films with different stretching degrees.
| γ | ΔL (μm) | Δψ (°) | Δn | |
|---|---|---|---|---|
| 3.1 | 1.0 | 61.61786 | 0.10087 | 0.10342 |
| 1.2 | 78.49929 | 0.10708 | ||
| 2.0 | 124.98626 | 0.10230 | ||
| 2.4 | 1.0 | 58.23477 | 0.09533 | 0.09572 |
| 1.3 | 76.32643 | 0.09611 | ||
| 1.66 | 1.25 | 38.67712 | 0.05065 | 0.05017 |
| 2.25 | 68.29857 | 0.04969 |
Table 5.
Peak positions, tilt angle α, dichroic ratios Du, Ds, and Herman’s orientation functions fu, fs, for unstretched and stretched PET film (ε = 0.4).
Table 5.
Peak positions, tilt angle α, dichroic ratios Du, Ds, and Herman’s orientation functions fu, fs, for unstretched and stretched PET film (ε = 0.4).
| Peak (cm−1) | Du | α (°) | fu | Ds | fs | Conformation | Dichroism |
|---|---|---|---|---|---|---|---|
| 845 | 3.79 | -- | 1.28 | -- | γrock(CH2), trans crystalline | π | |
| 872 | 0.28 | 85 1 | -- | 1.05 | 0.02 | out-of-plane δ(C-C-H)ring gauche | σ |
| 898 | 2.33 | -- | 2.16 | -- | trans | π | |
| 969 | 3.33 | 34 2 | 0.47 | 1.14 | 0.05 | ν(O-CH2), trans | π |
| 975 | 4.42 | 34 | 0.58 | 0.61 | 0.16 | ν(O-CH2), trans amorphous | π |
| 1020 | 1.41 | 20 3 | 0.14 | 1.13 | 0.05 | in-plane δ(C-H)ring, trans amorphous | π |
| 1100 | 1.27 | -0.32 | 0.73 | 0.19 | ν(C-O), gauche | π | |
| 1120 | 1.30 | 1.02 | -- | ν(C-C)ring + ν(C-O-C), crystalline | π | ||
| 1126 | 1.02 | 0.01 | 1.12 | 0.04 | ν(C-C)ring + ν(C-O-C), crystalline | π | |
| 1259 | 0.54 | 90 4 | 1.07 | 0.02 | ν(O=C-O-C) | σ | |
| 1234 | 1.64 | 1.41 | -- | ν(O=C-O-C) | π | ||
| 1339 | 0.98 | 21.3 5 | −0.005 | 1.32 | 0.06 | δwagg(CH2), trans amorphous | π |
| 1341 | 0.85 | 21.3 5 | −0.06 | 1.36 | 0.11 | δwagg(CH2), trans crystalline | π |
| 1710 | 1.37 | 0.86 | ν(C=O), crystalline | π | |||
| 1717 | 0.63 | 0.87 | ν(C=O), trans isolated | σ |
Disclaimer/Publisher’s Note: The statements, opinions and data contained in all publications are solely those of the individual author(s) and contributor(s) and not of MDPI and/or the editor(s). MDPI and/or the editor(s) disclaim responsibility for any injury to people or property resulting from any ideas, methods, instructions or products referred to in the content. |
© 2024 by the authors. Licensee MDPI, Basel, Switzerland. This article is an open access article distributed under the terms and conditions of the Creative Commons Attribution (CC BY) license (https://creativecommons.org/licenses/by/4.0/).
Share and Cite
MDPI and ACS Style
Avadanei, M.I.; Dimitriu, D.G.; Dorohoi, D.O. Optical Anisotropy of Polyethylene Terephthalate Films Characterized by Spectral Means. Polymers 2024, 16, 850. https://doi.org/10.3390/polym16060850
AMA Style
Avadanei MI, Dimitriu DG, Dorohoi DO. Optical Anisotropy of Polyethylene Terephthalate Films Characterized by Spectral Means. Polymers. 2024; 16(6):850. https://doi.org/10.3390/polym16060850
Chicago/Turabian StyleAvadanei, Mihaela Iuliana, Dan Gheorghe Dimitriu, and Dana Ortansa Dorohoi. 2024. "Optical Anisotropy of Polyethylene Terephthalate Films Characterized by Spectral Means" Polymers 16, no. 6: 850. https://doi.org/10.3390/polym16060850
Note that from the first issue of 2016, this journal uses article numbers instead of page numbers. See further details here.