
Effect of Very High Charge Density and Monomer Constitution on the Synthesis and Properties of Cationic Polyelectrolytes


Abstract
:
1. Introduction
2. Materials and Methods
2.1. Materials
2.2. Polyelectrolyte Synthesis and Conversion Analysis
2.3. Polyelectrolyte Characterization
2.4. Analysis of Monomer, Monomer Solution, and Polymer Solution Properties
3. Theoretical Background and Basic Equations
3.1. Free-Radical Polymerization Kinetics
3.2. Autoacceleration
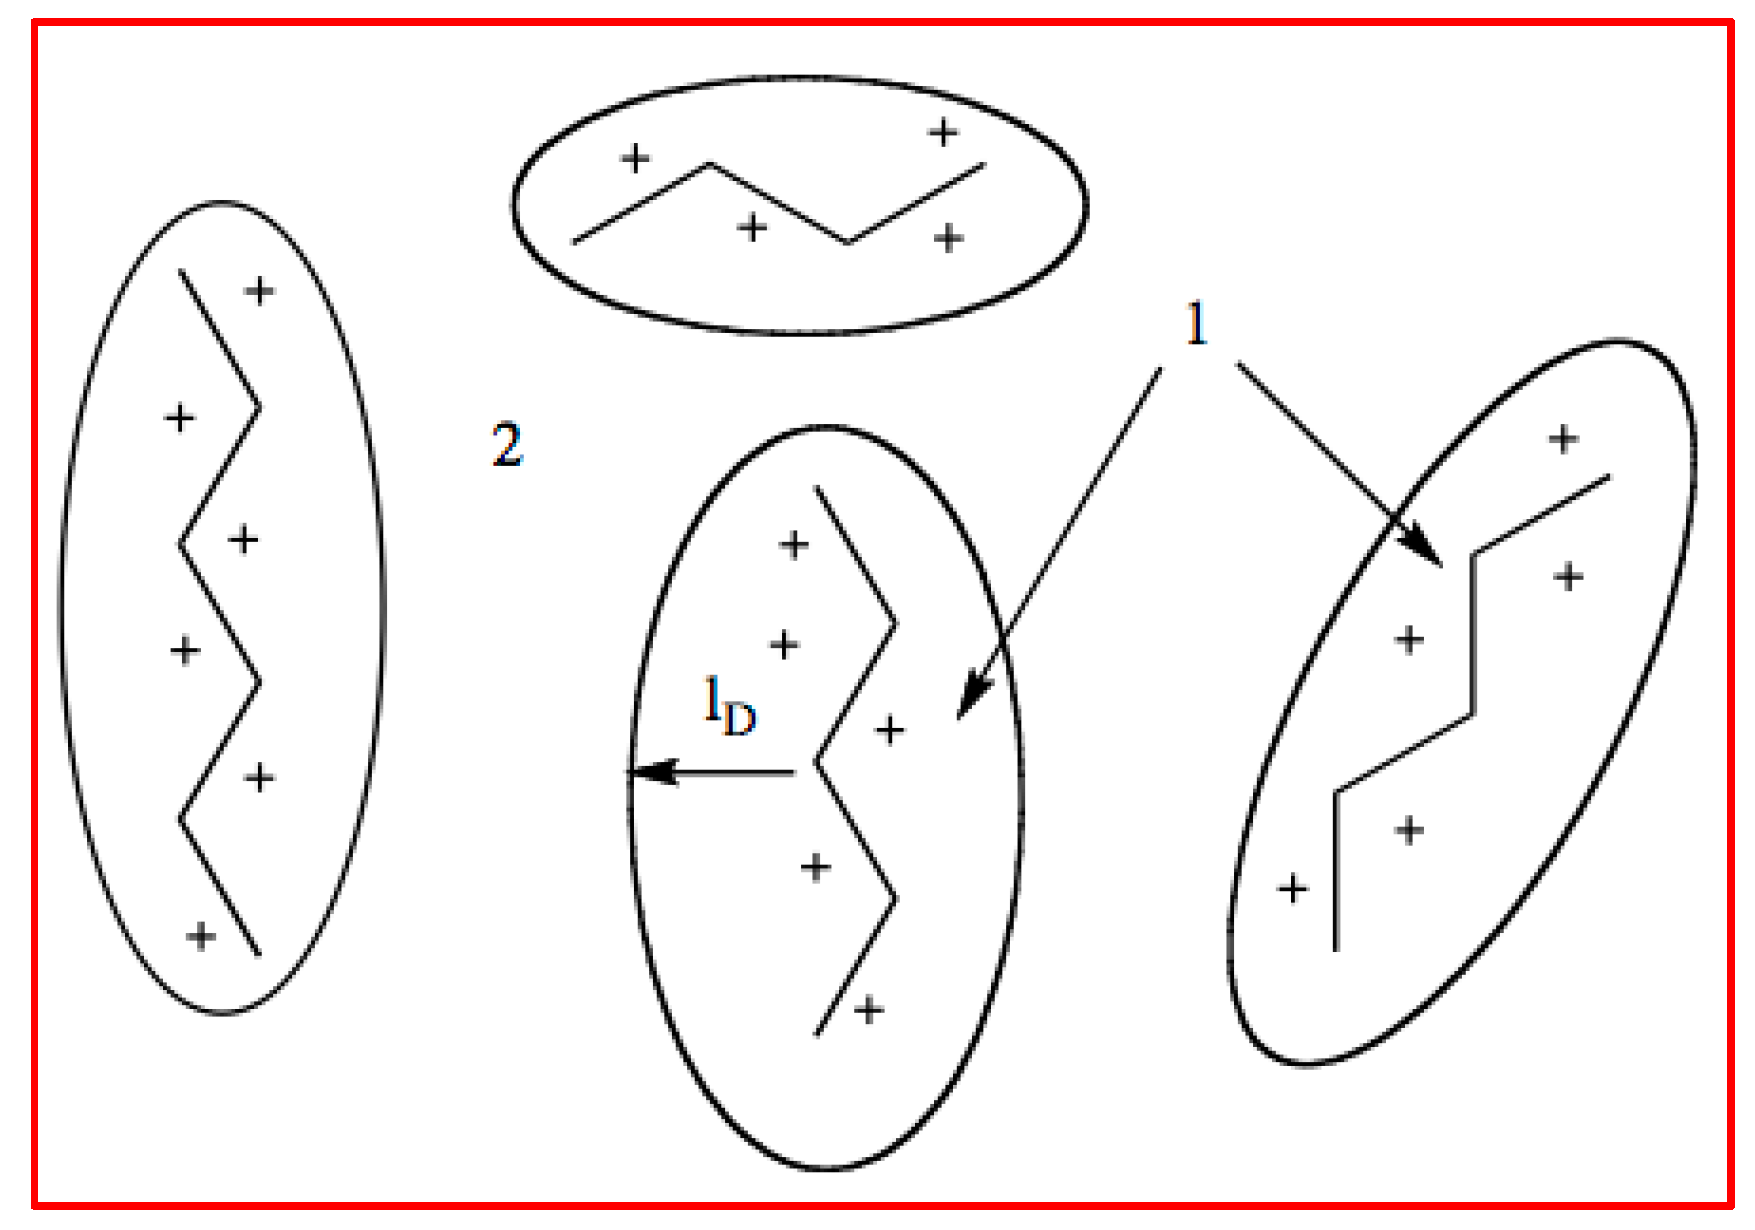
3.3. Permanently Charged Polyelectrolytes in Solution
4. Results
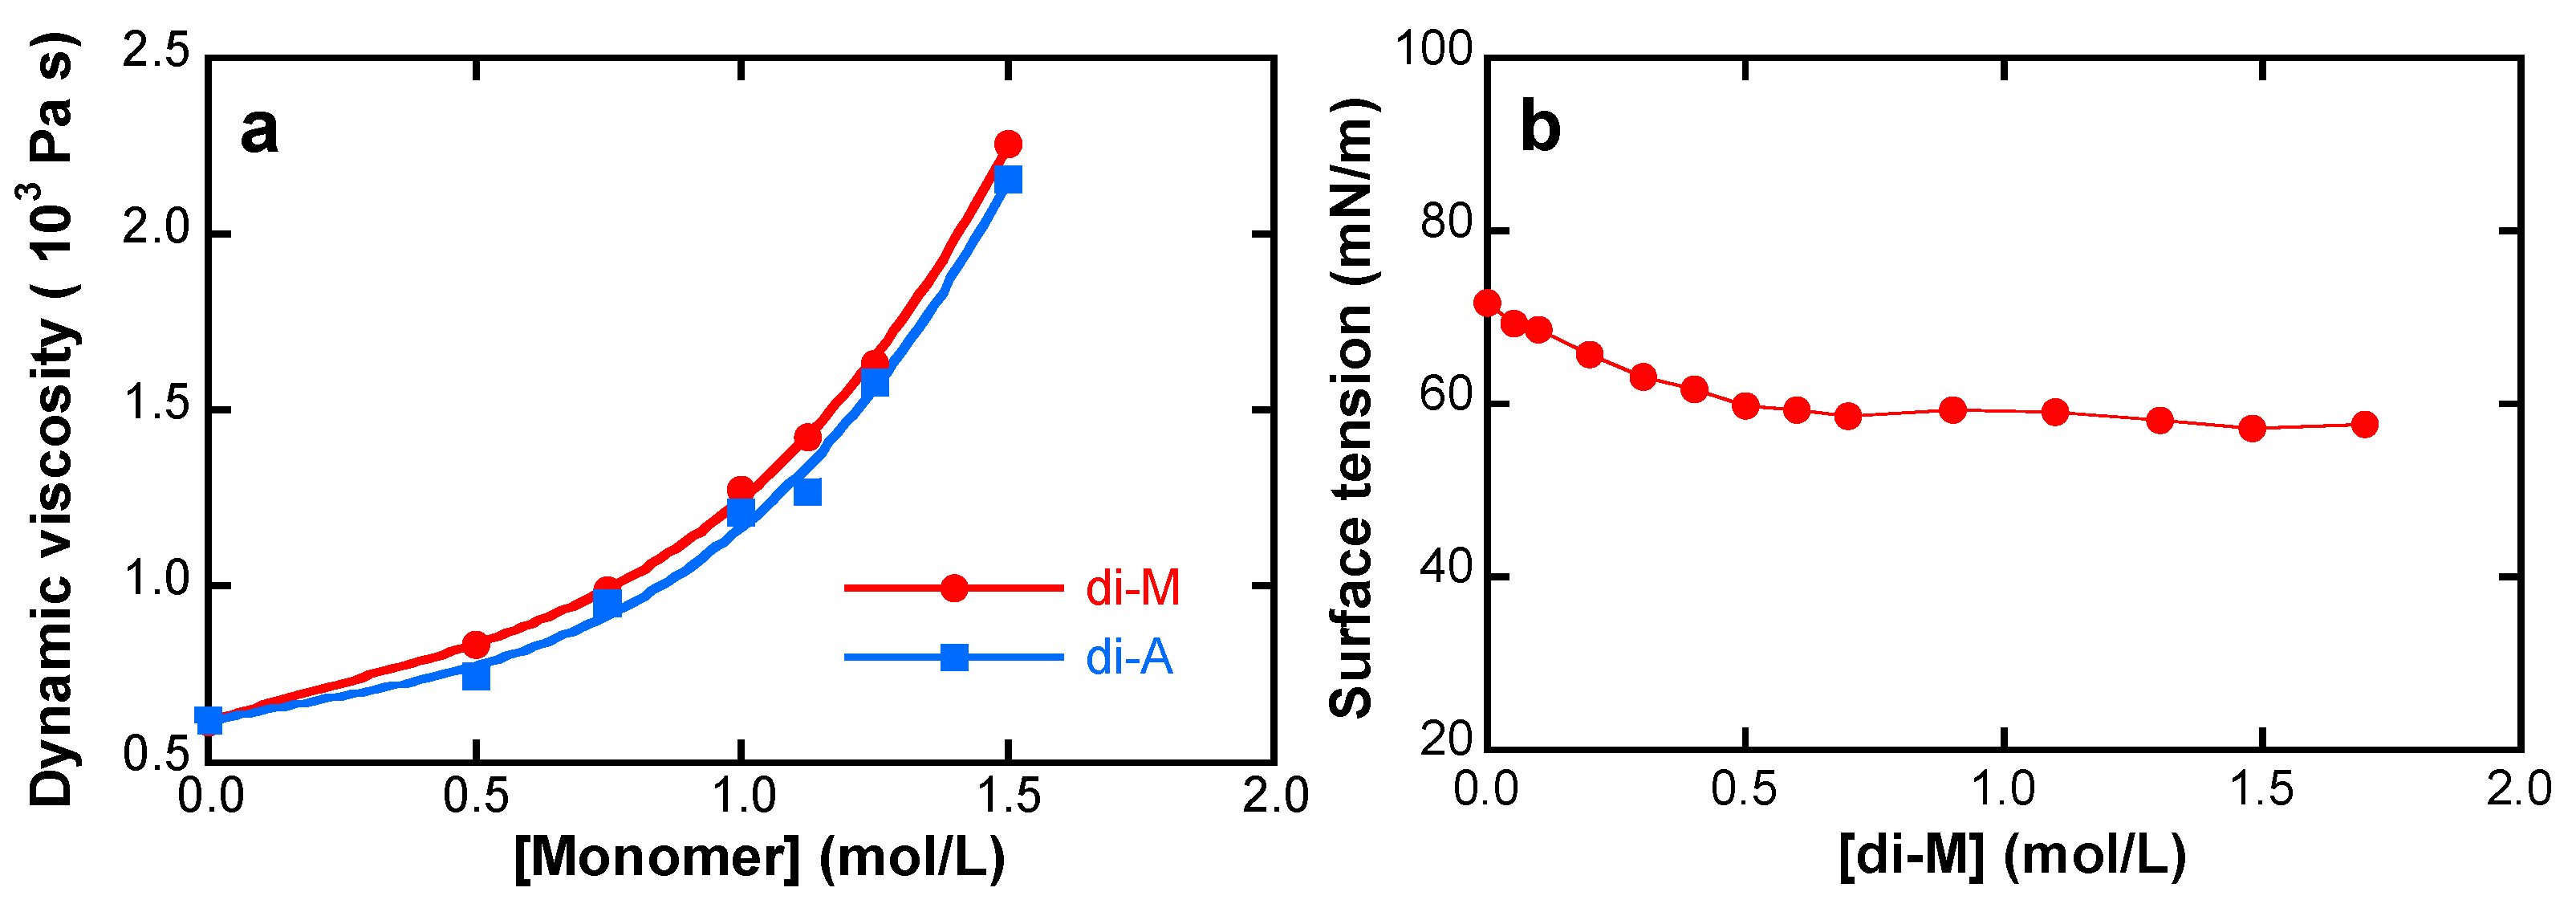
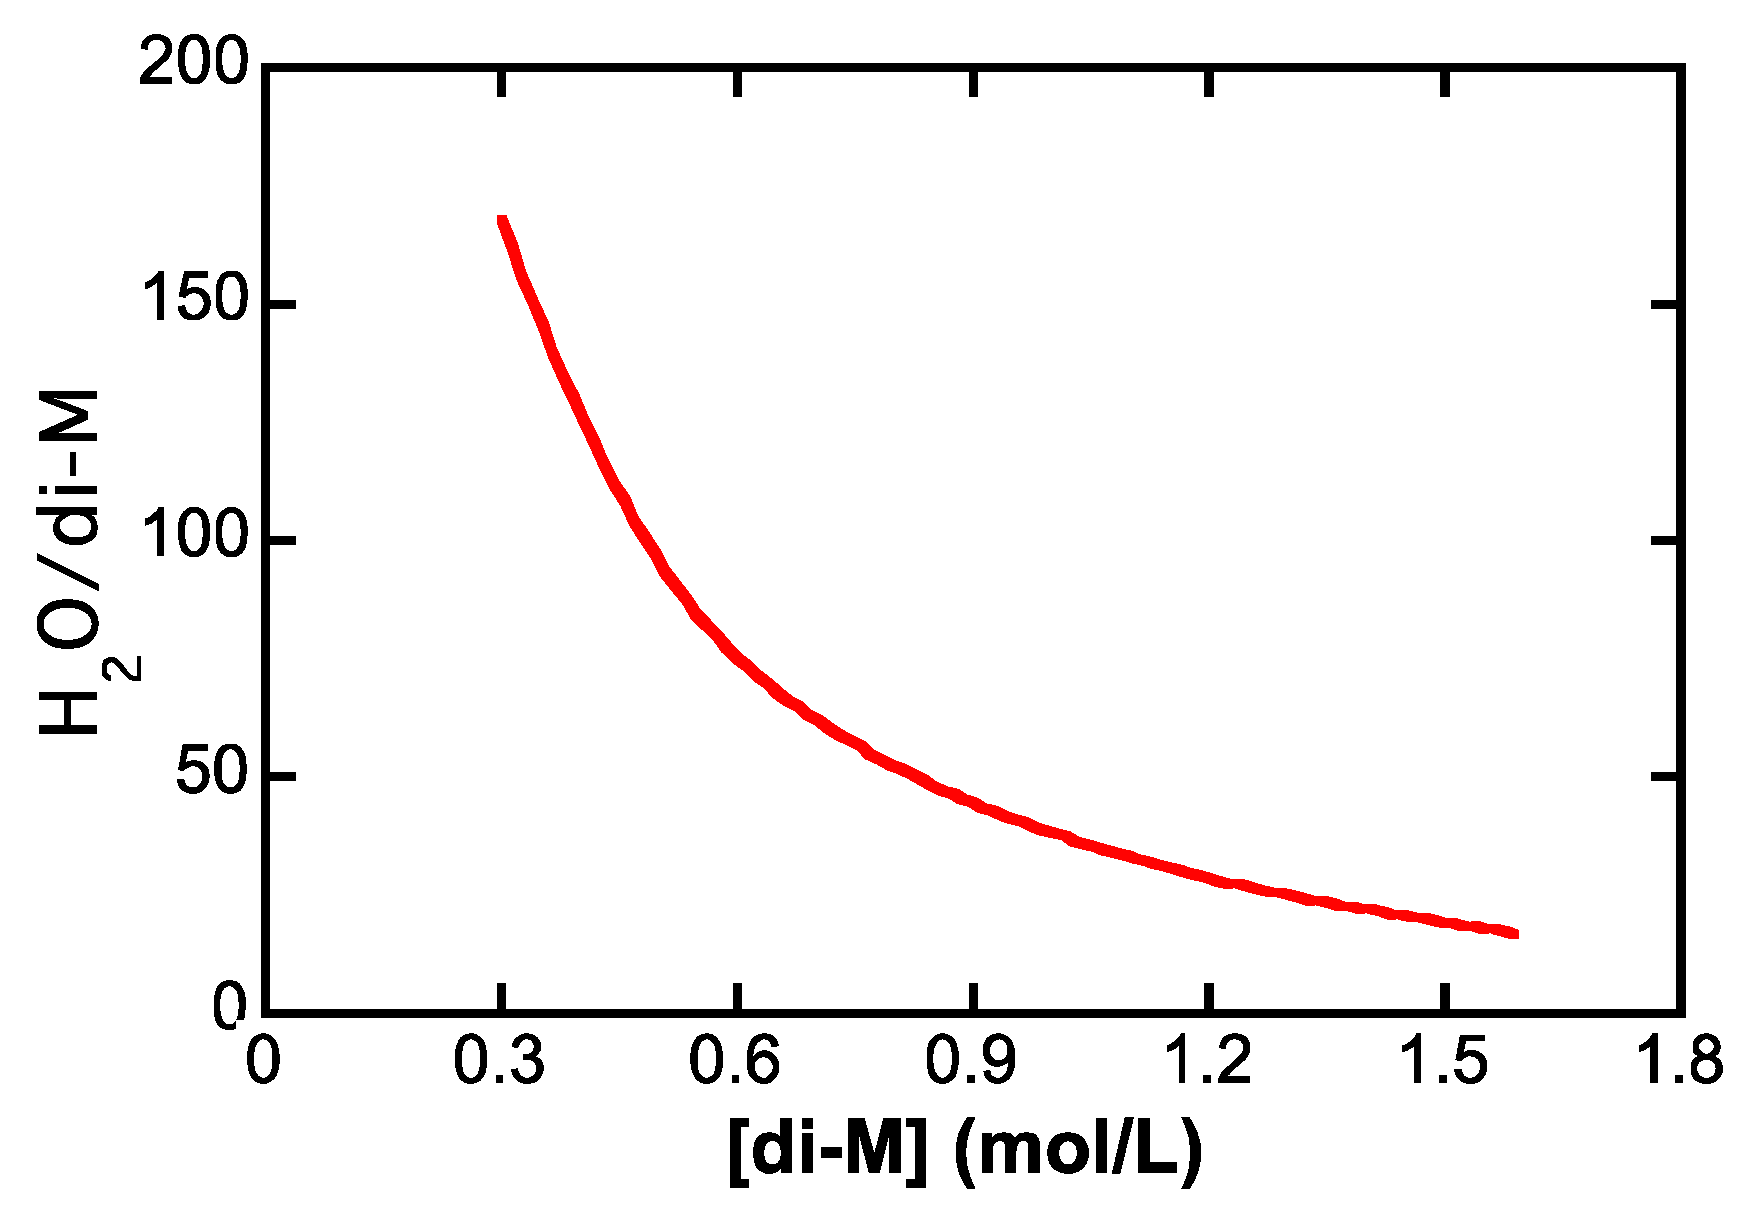
4.1. Monomer and Monomer Solution Properties
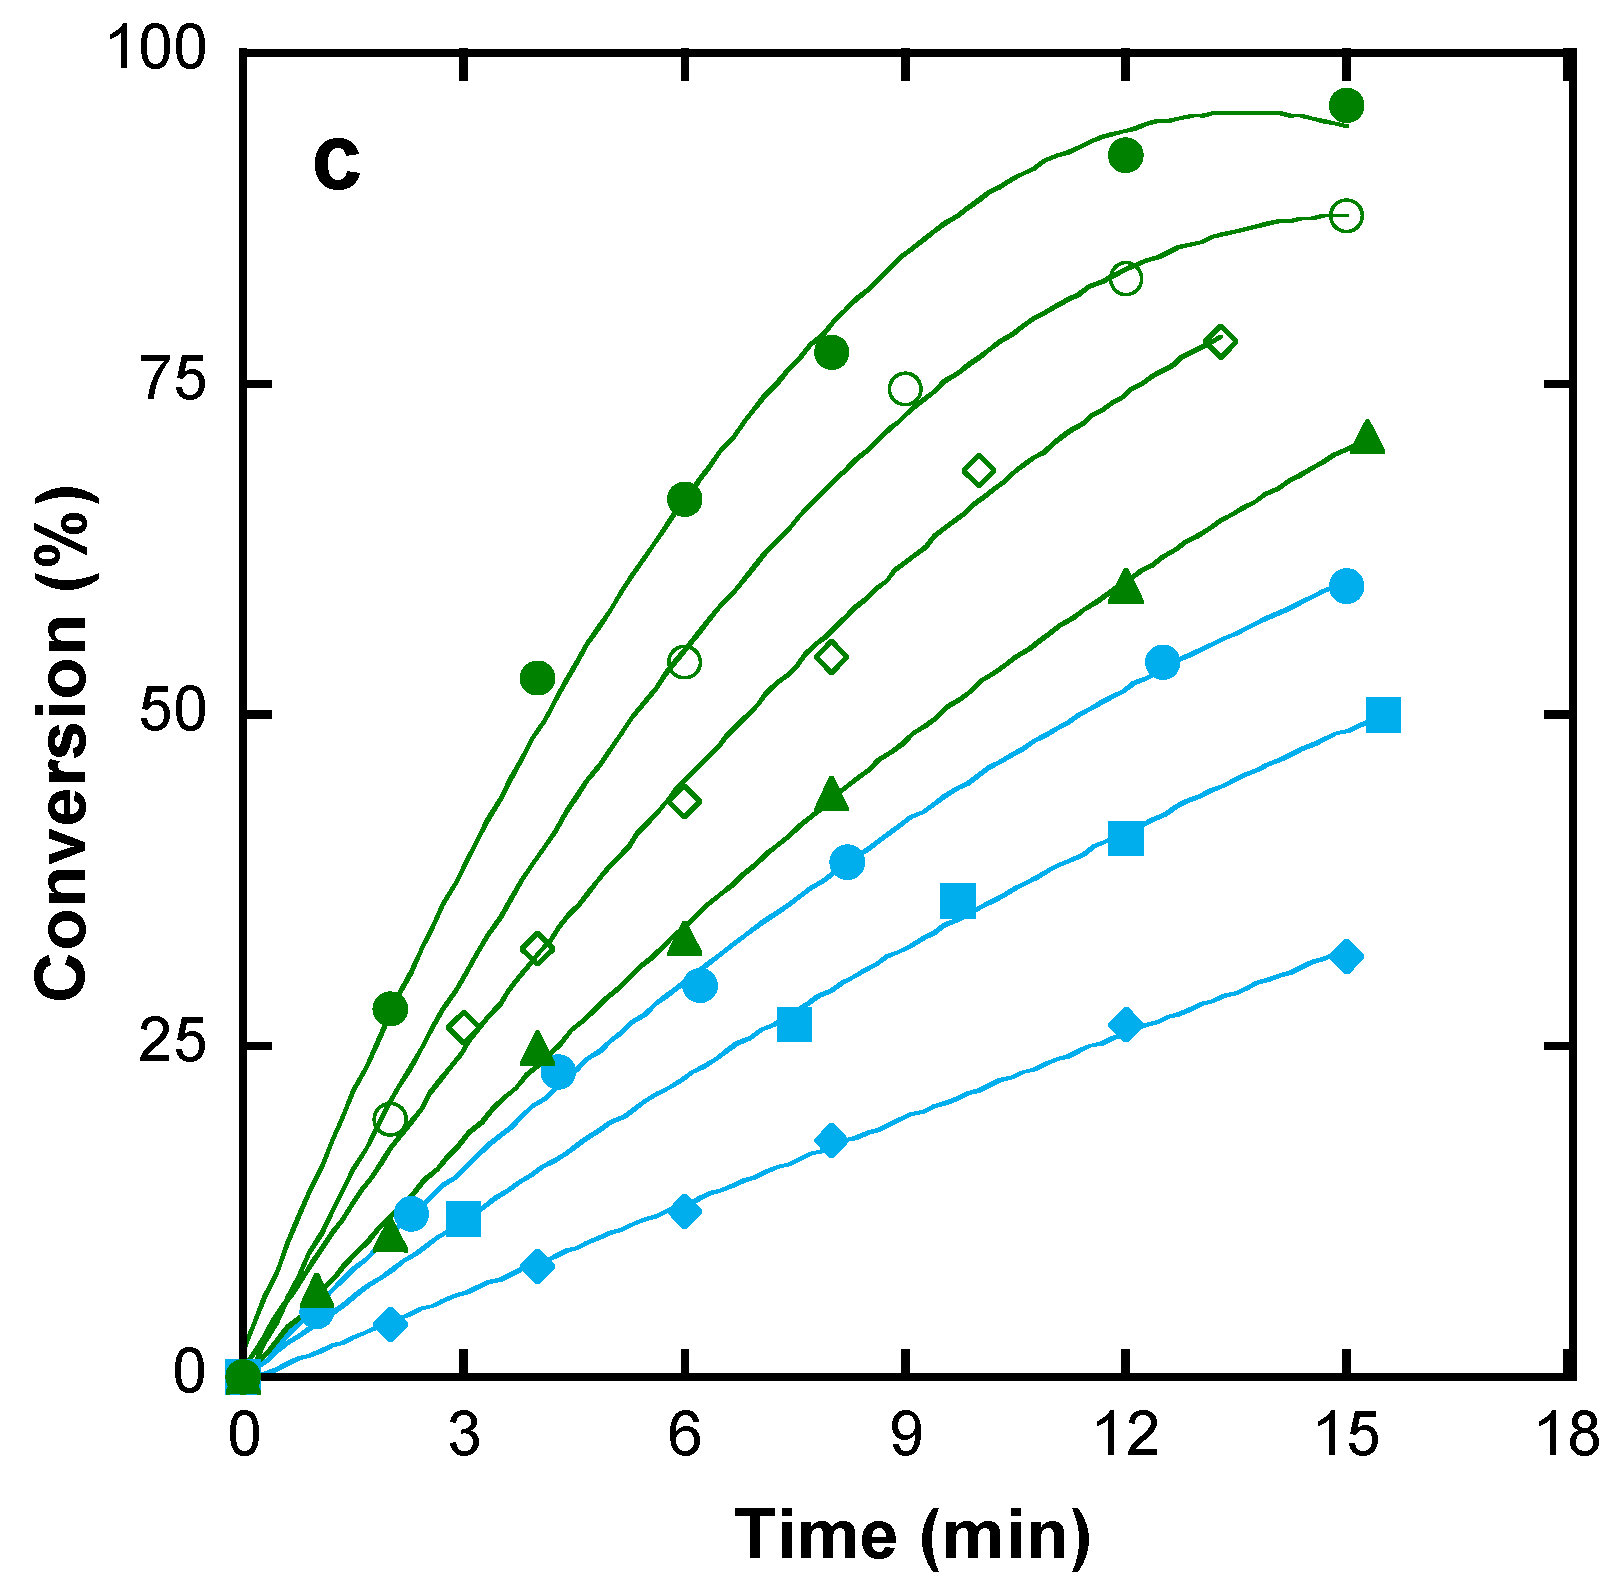
4.2. Polymerization to High Conversion
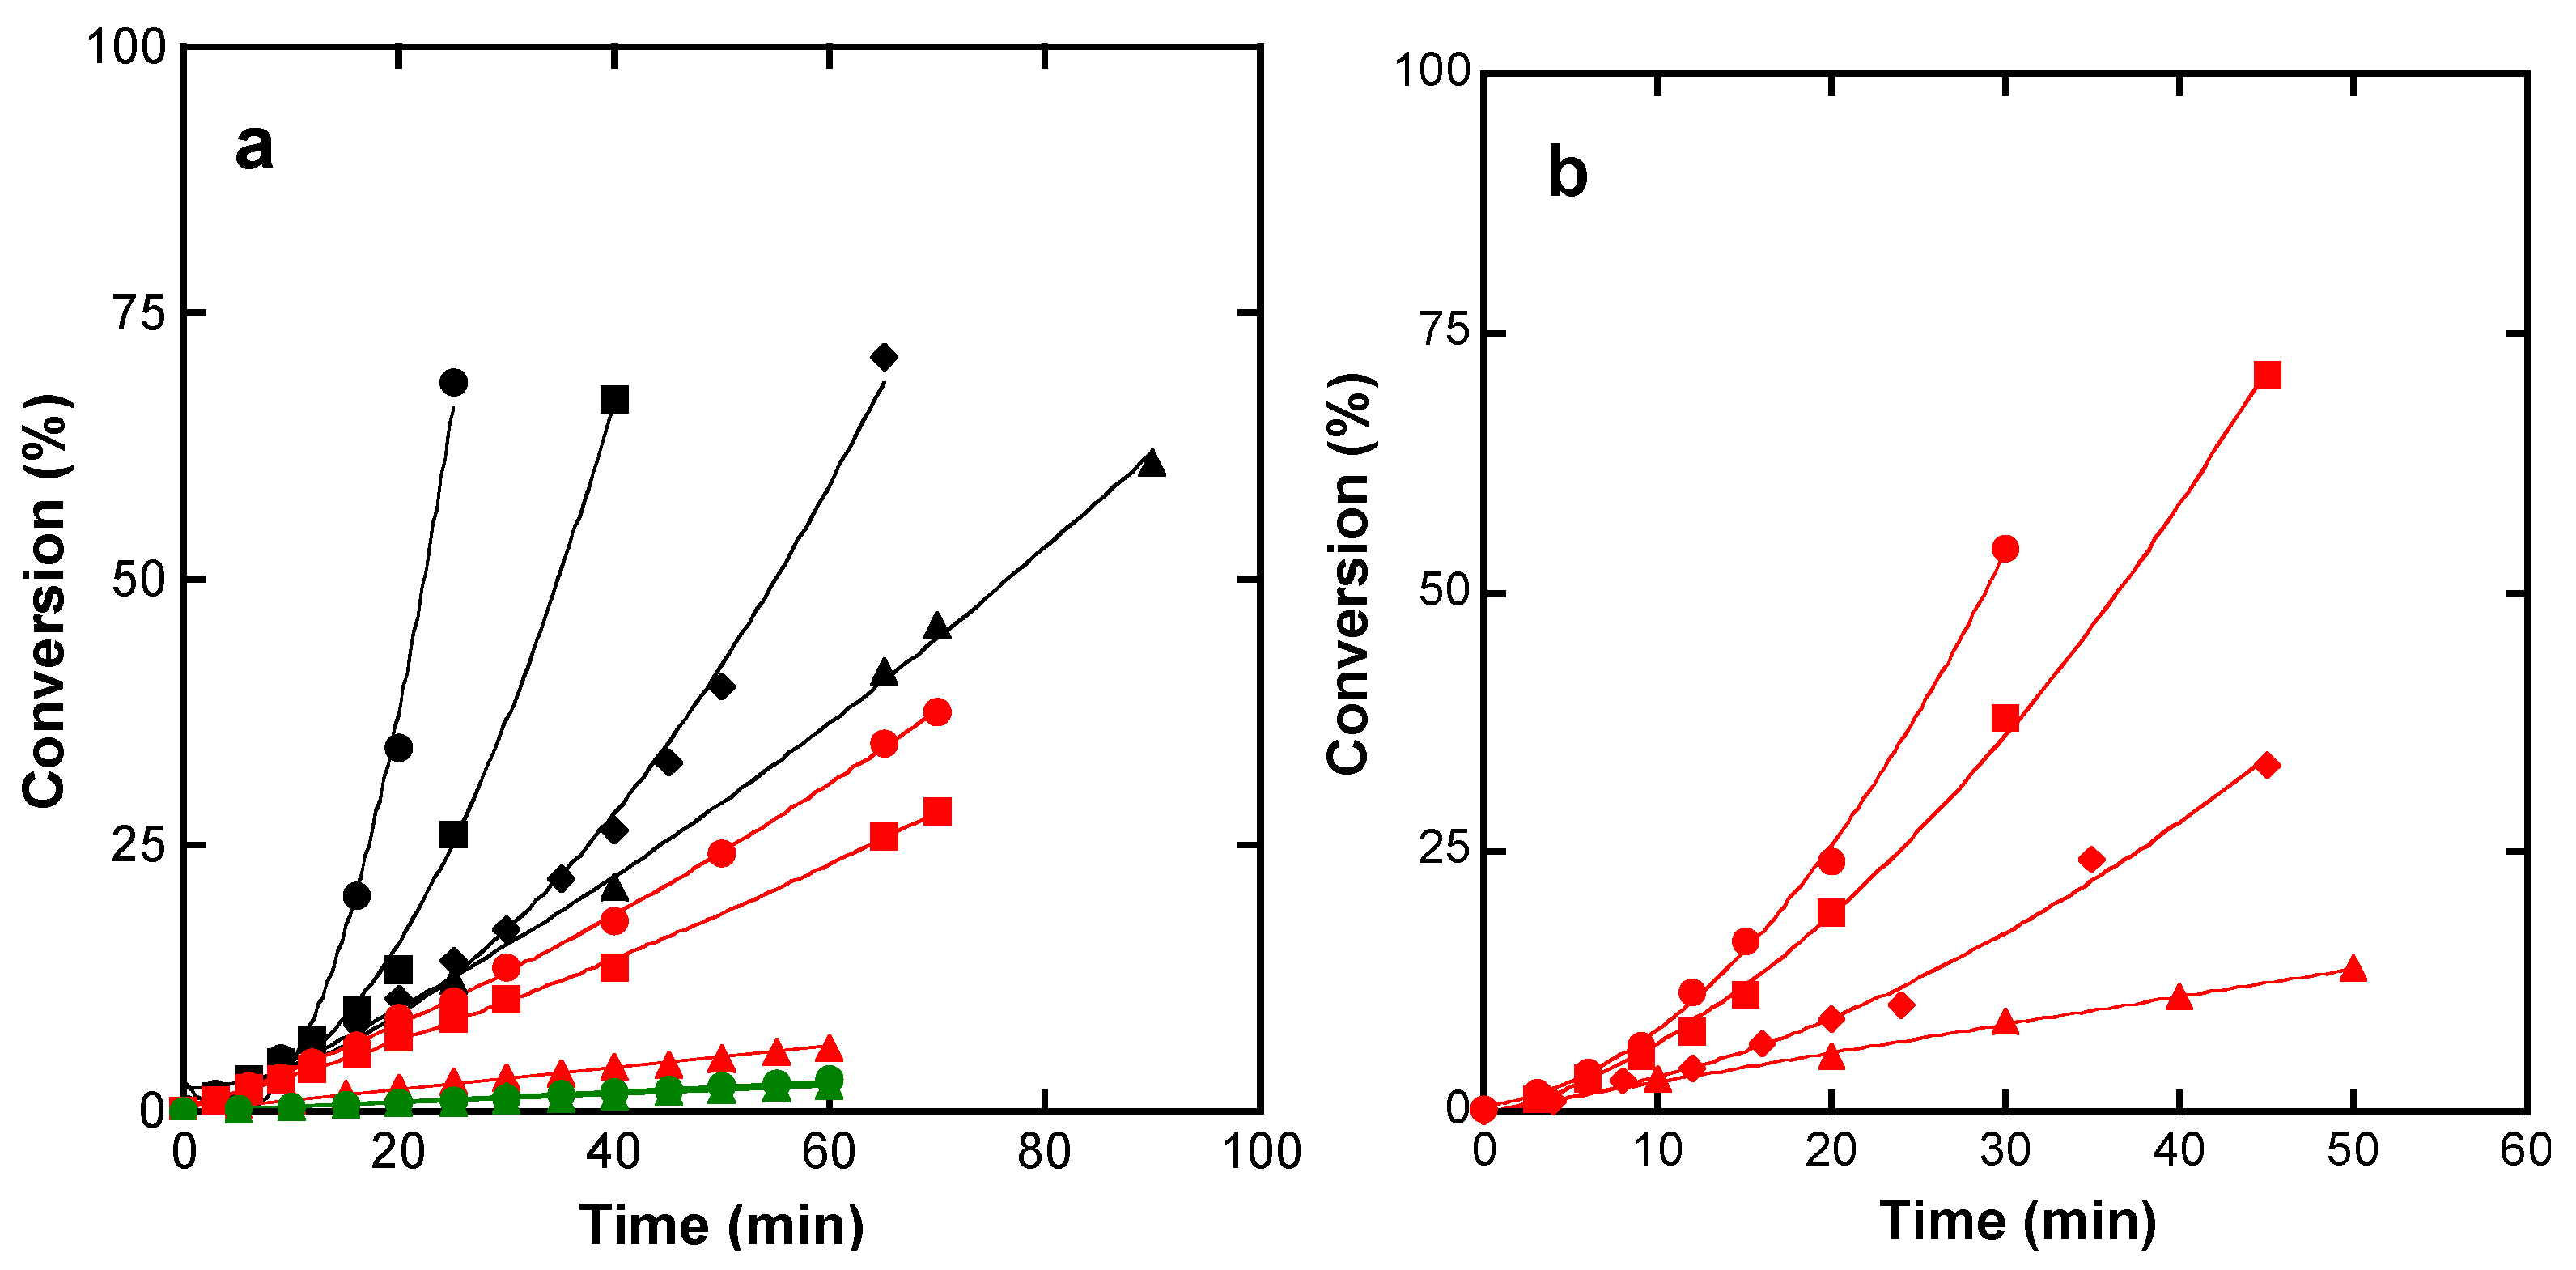
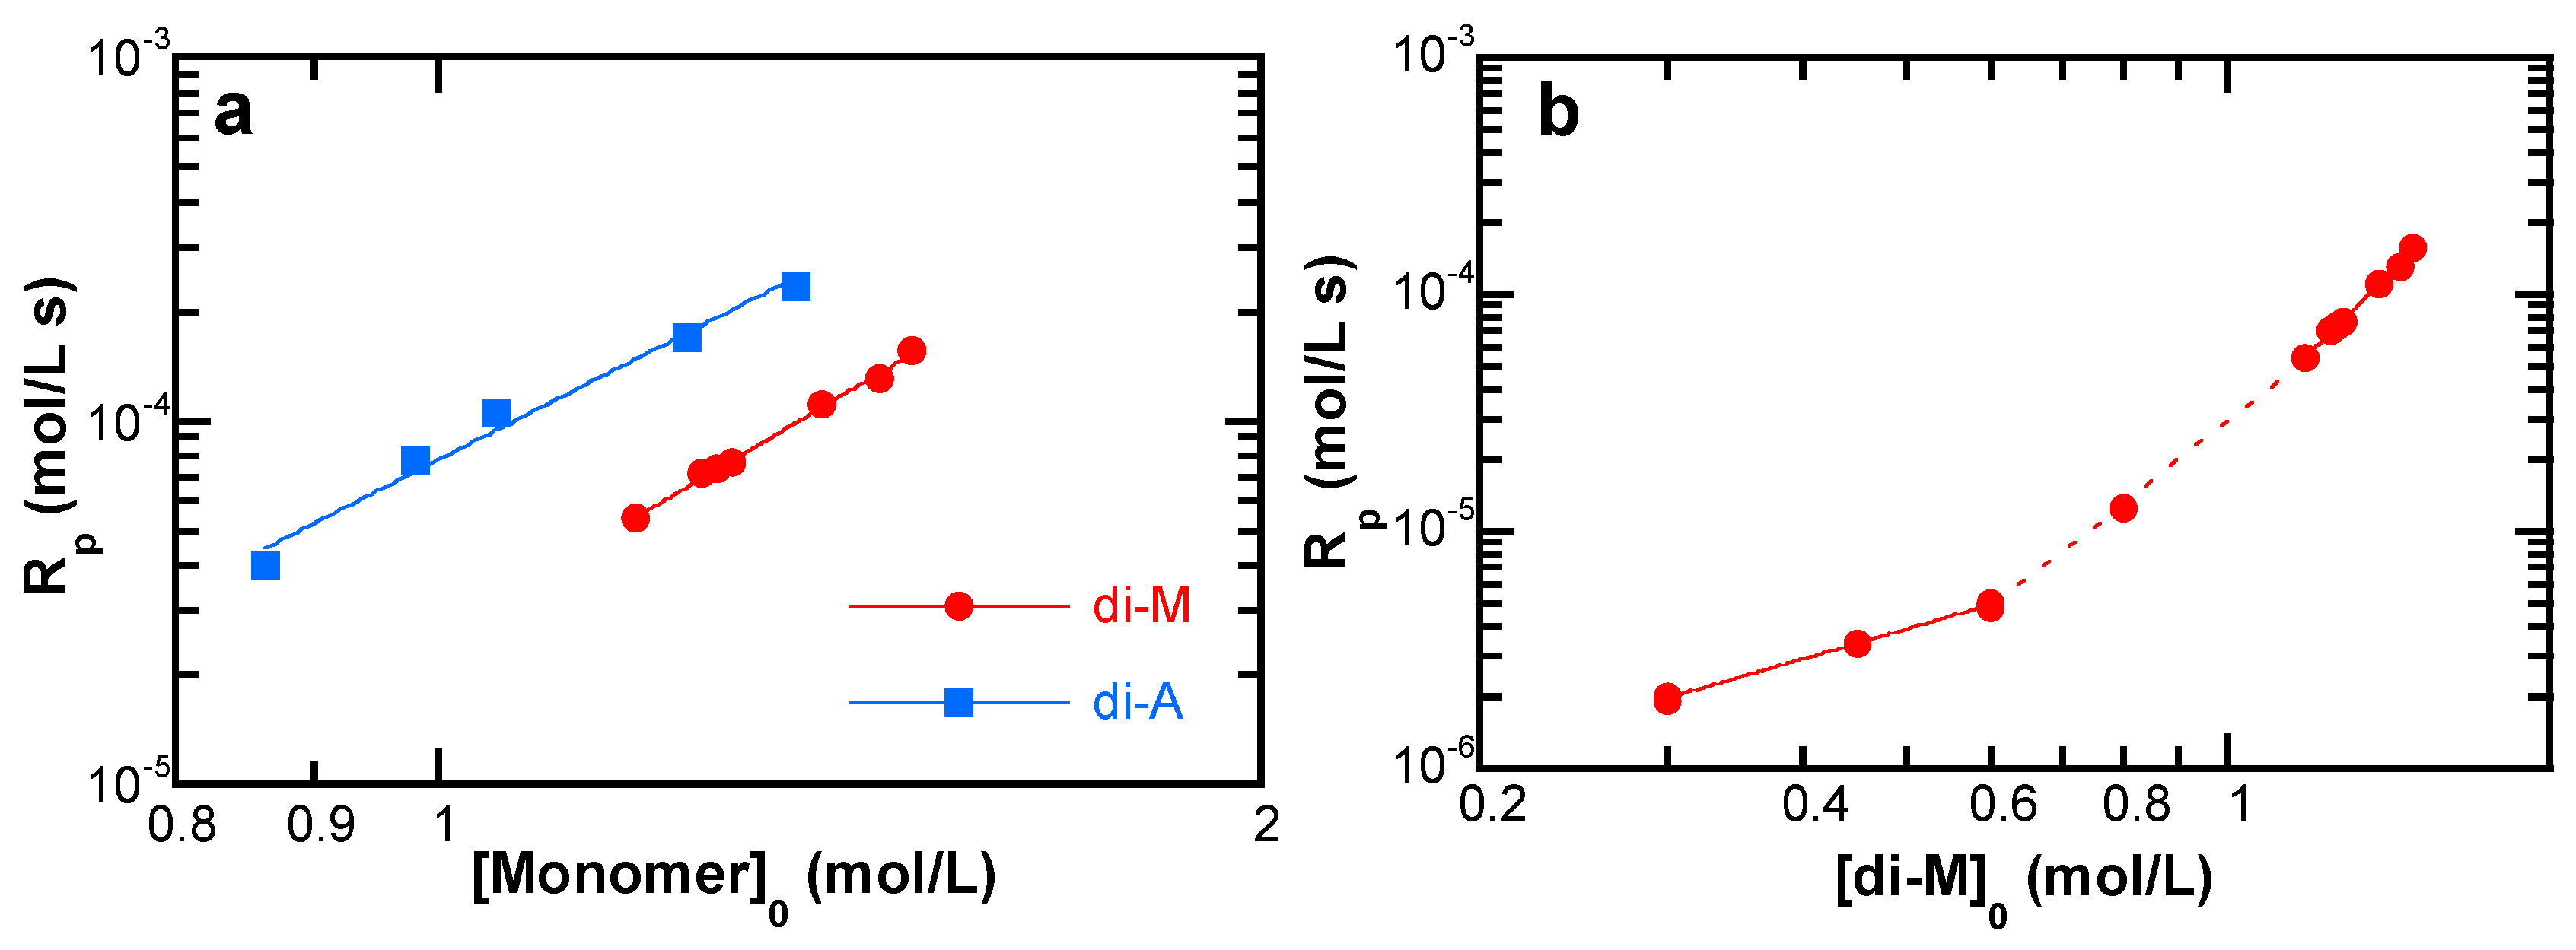
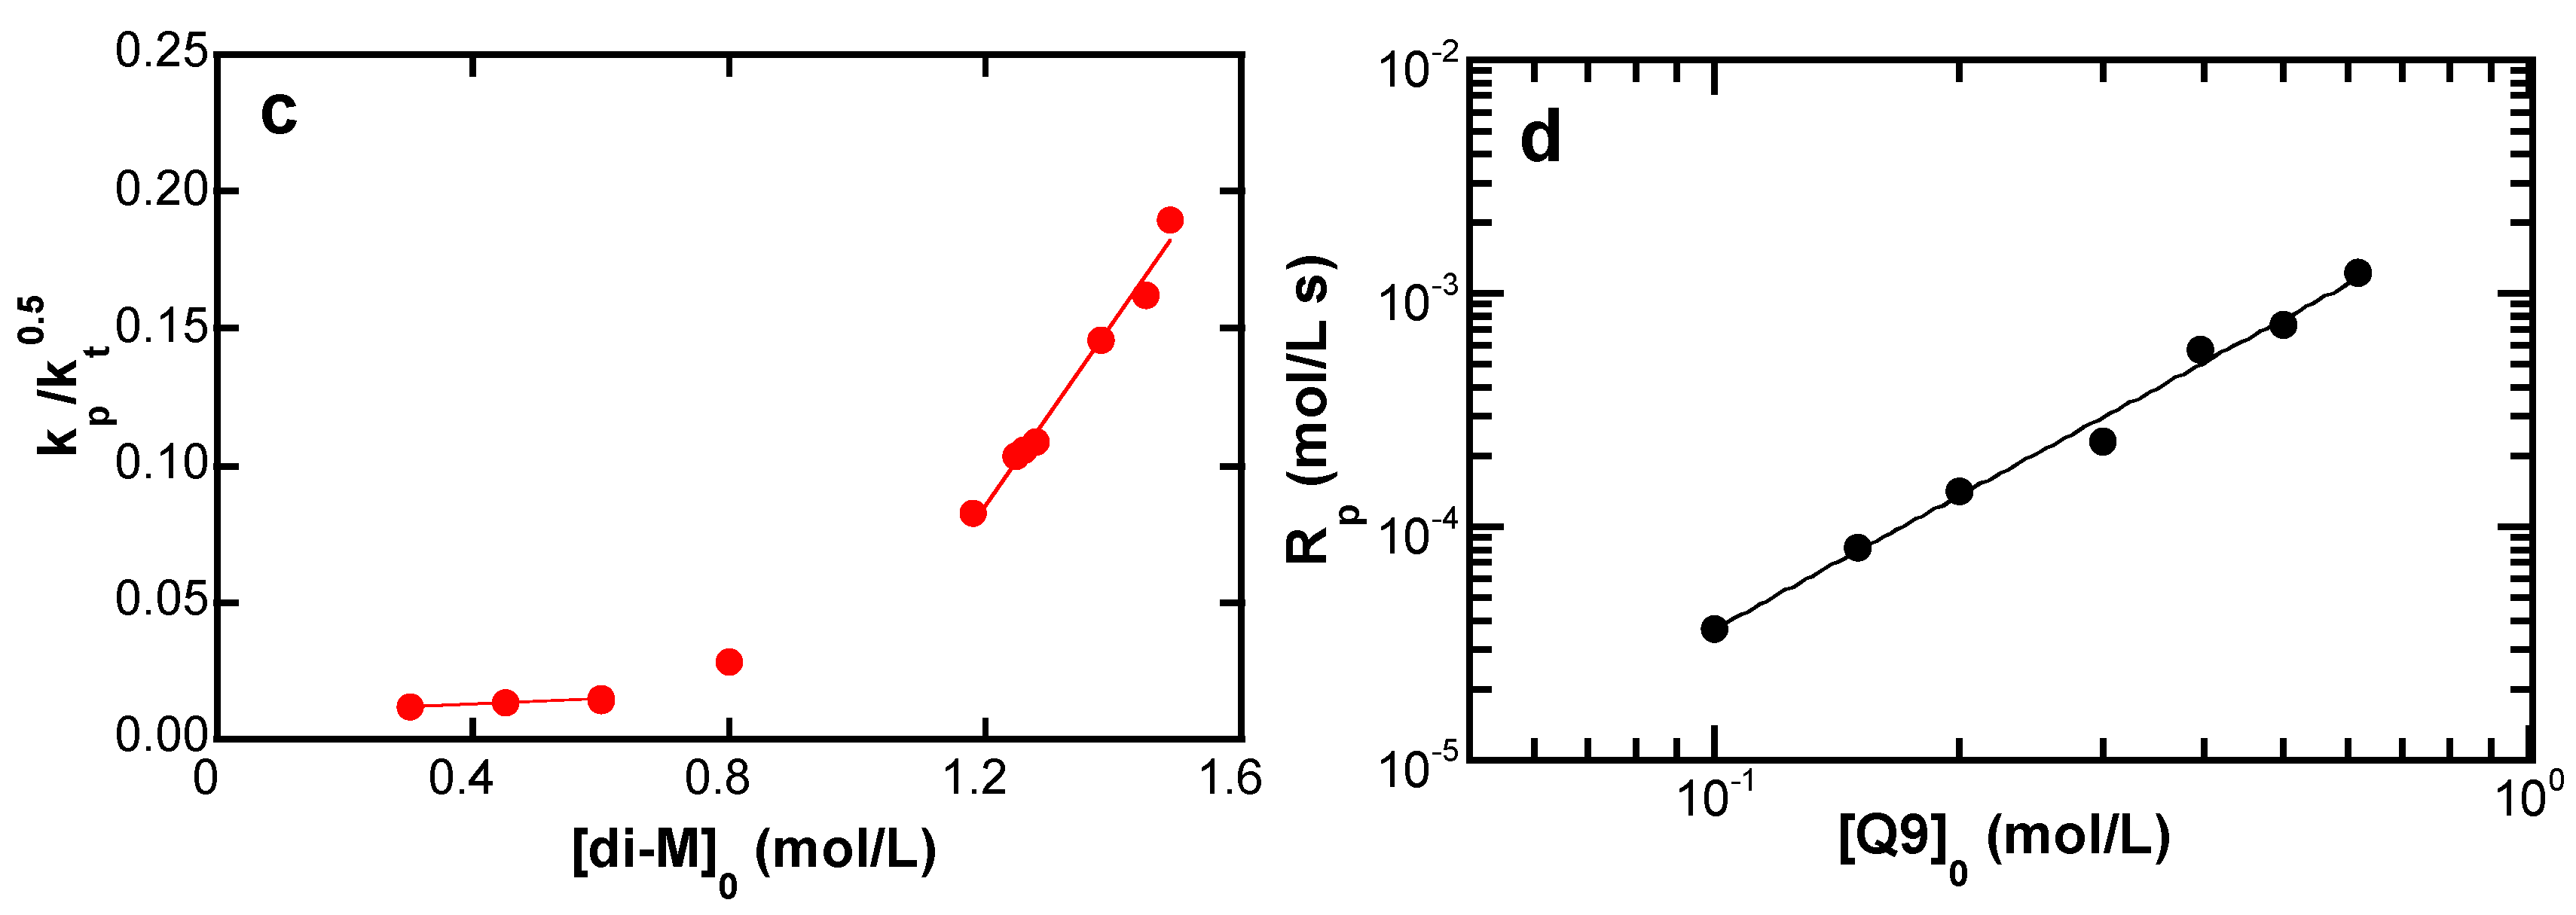
4.3. Polymerization Kinetics
4.3.1. Effect of the Monomer Concentration
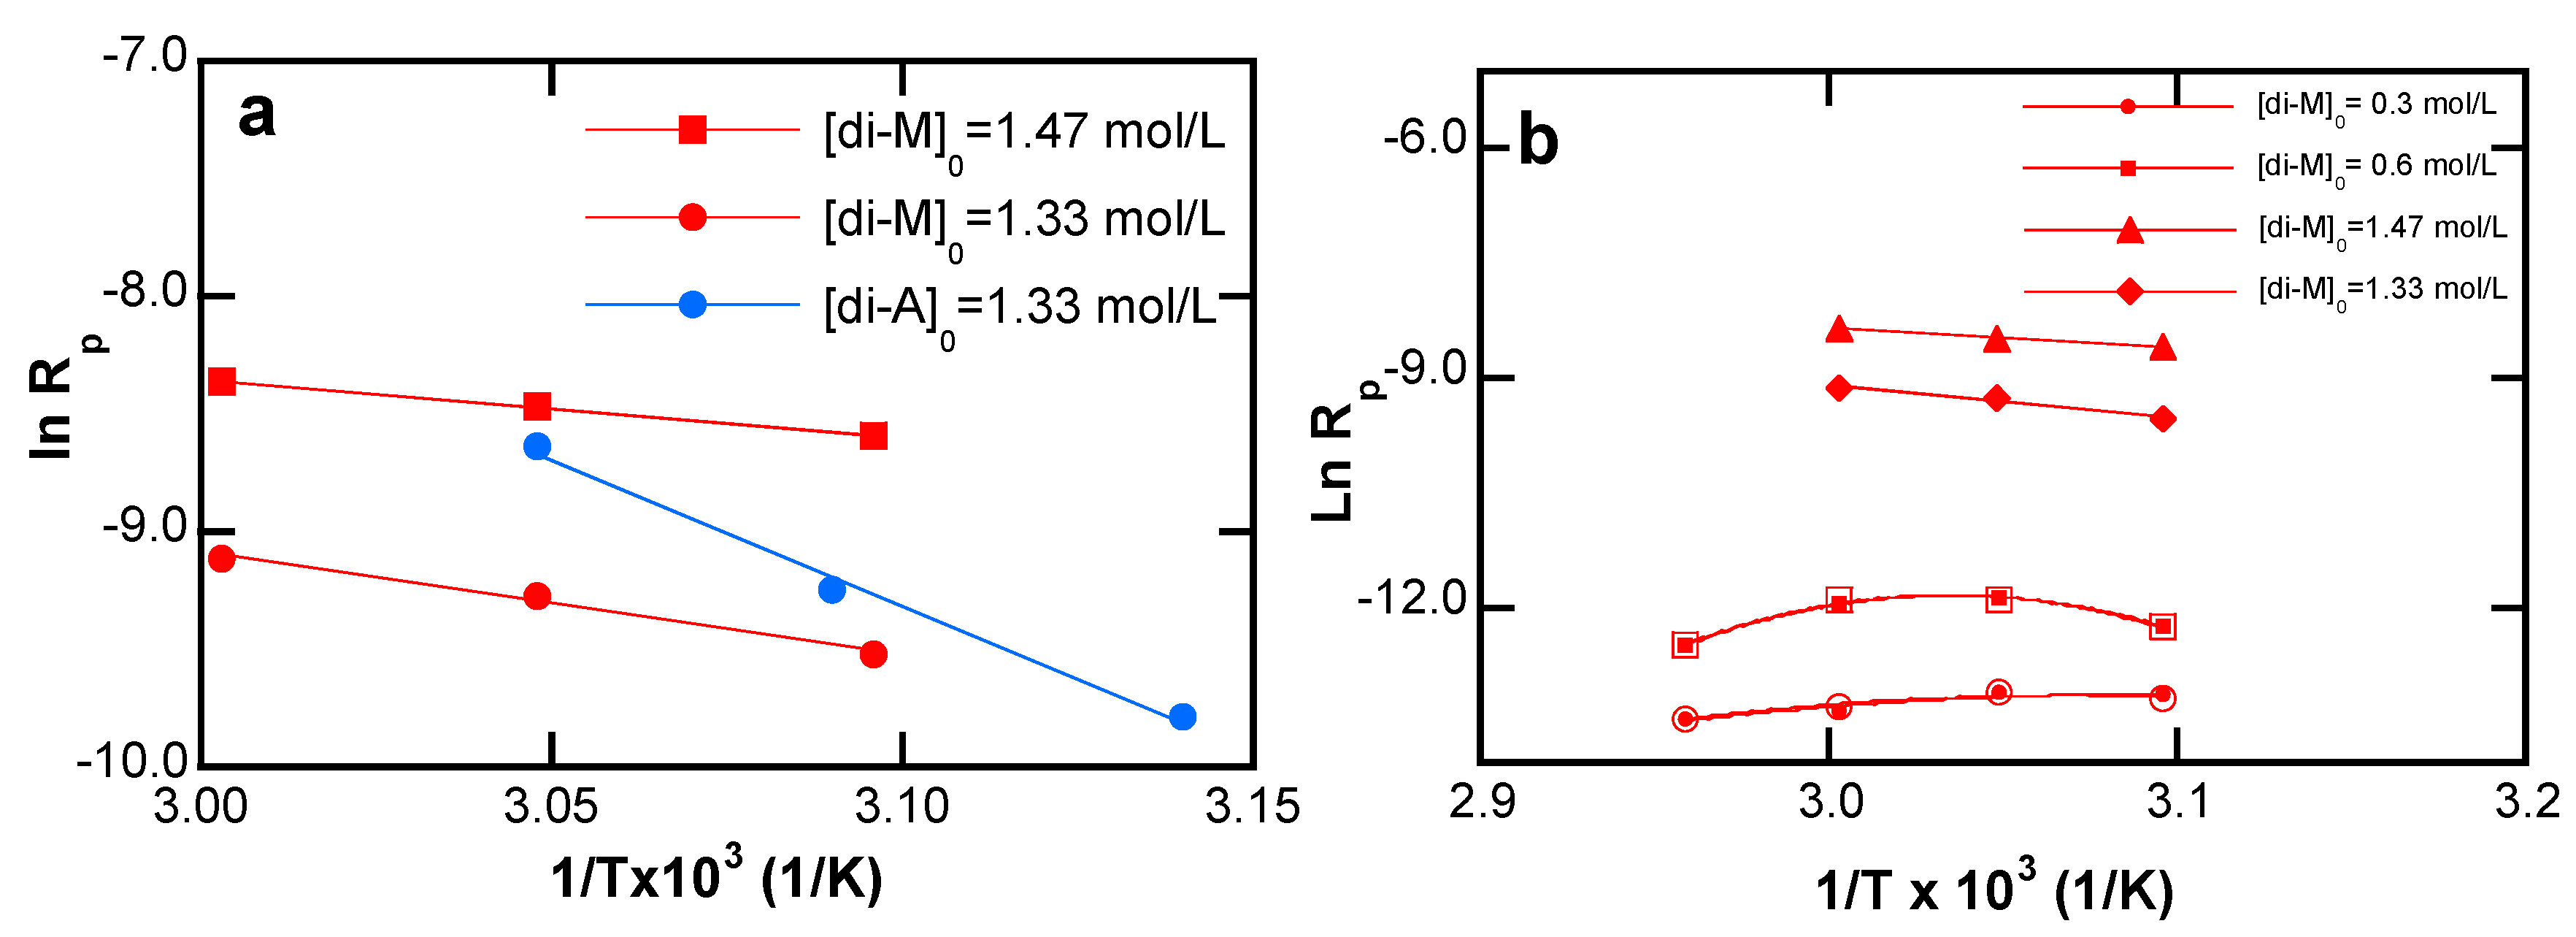
4.3.2. Effect of the Temperature
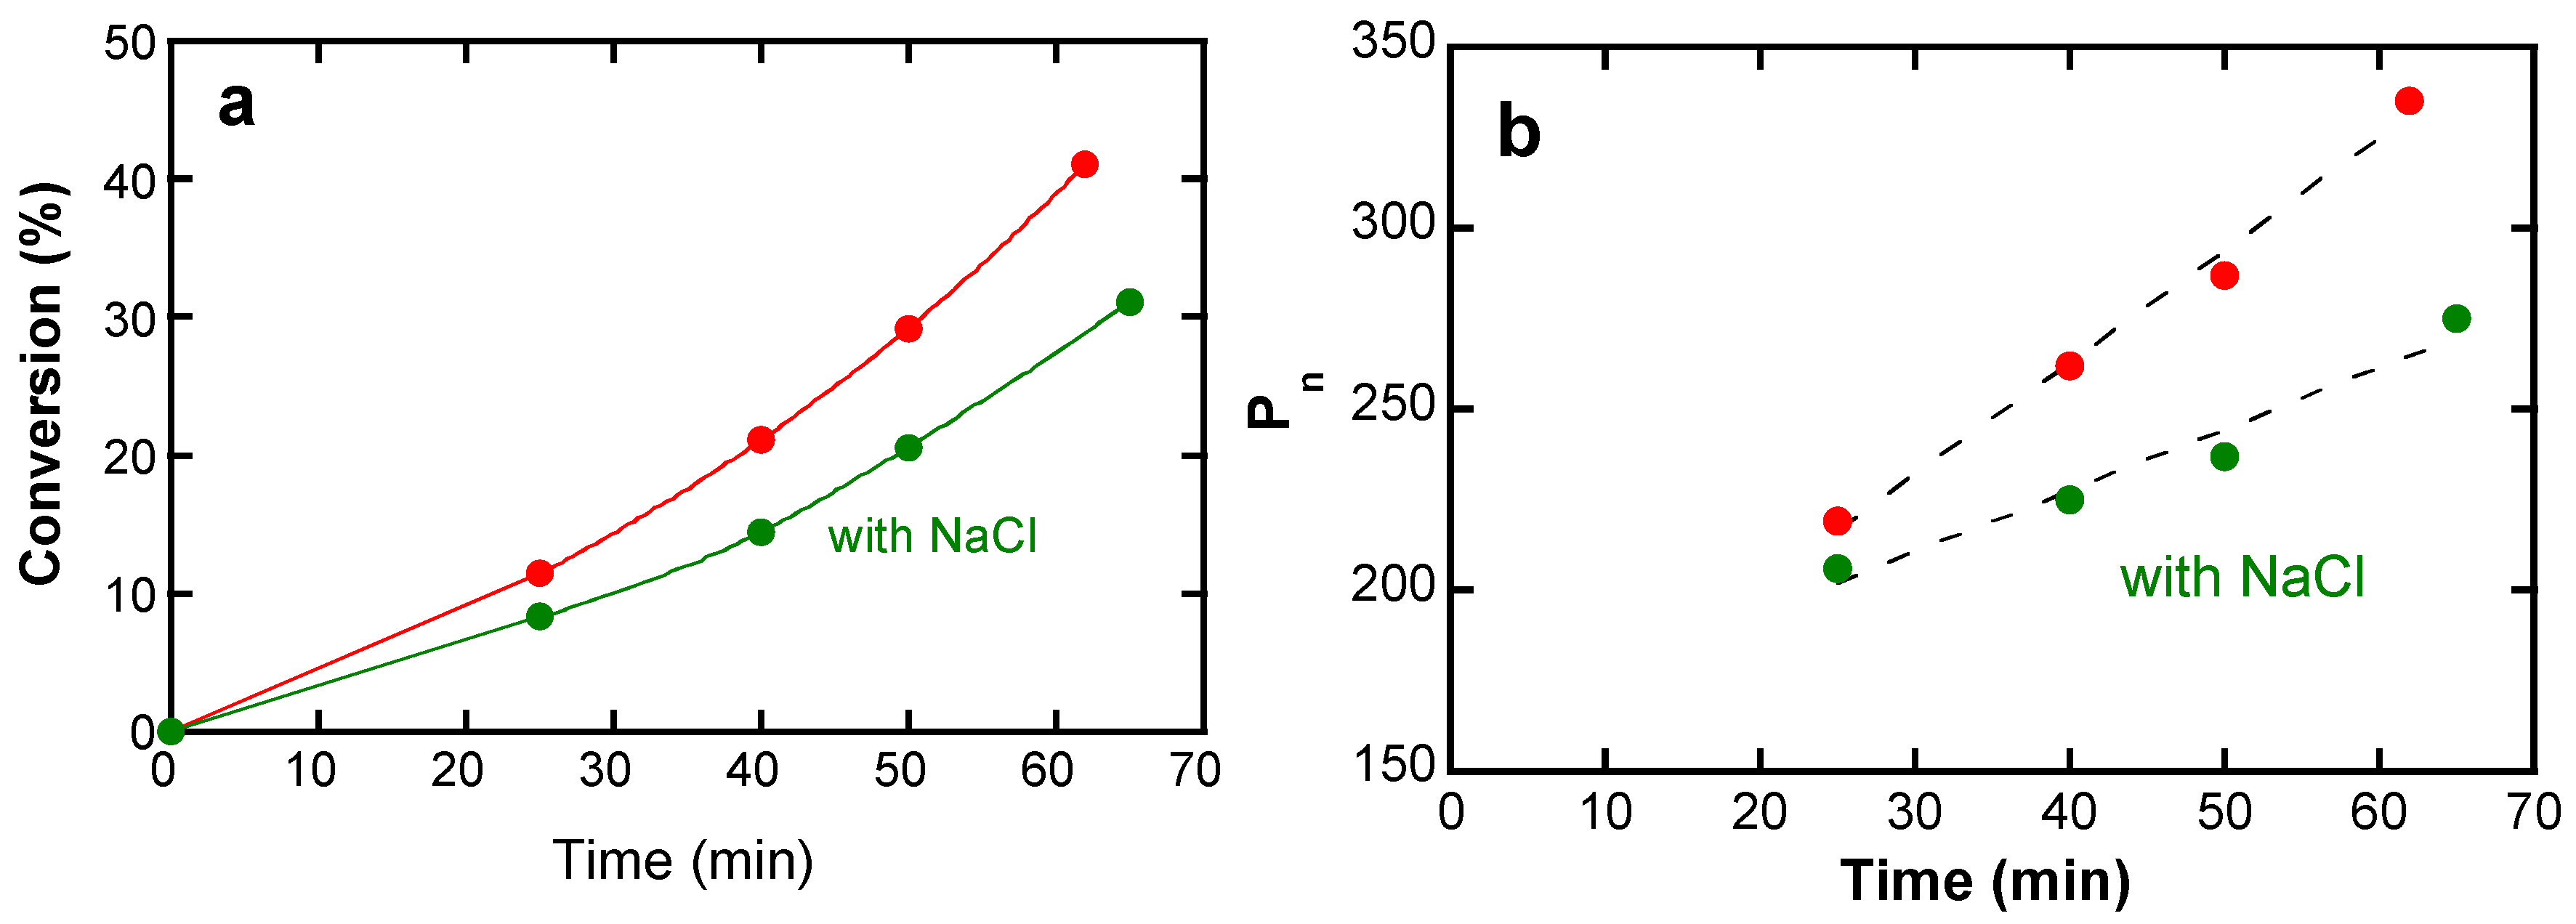
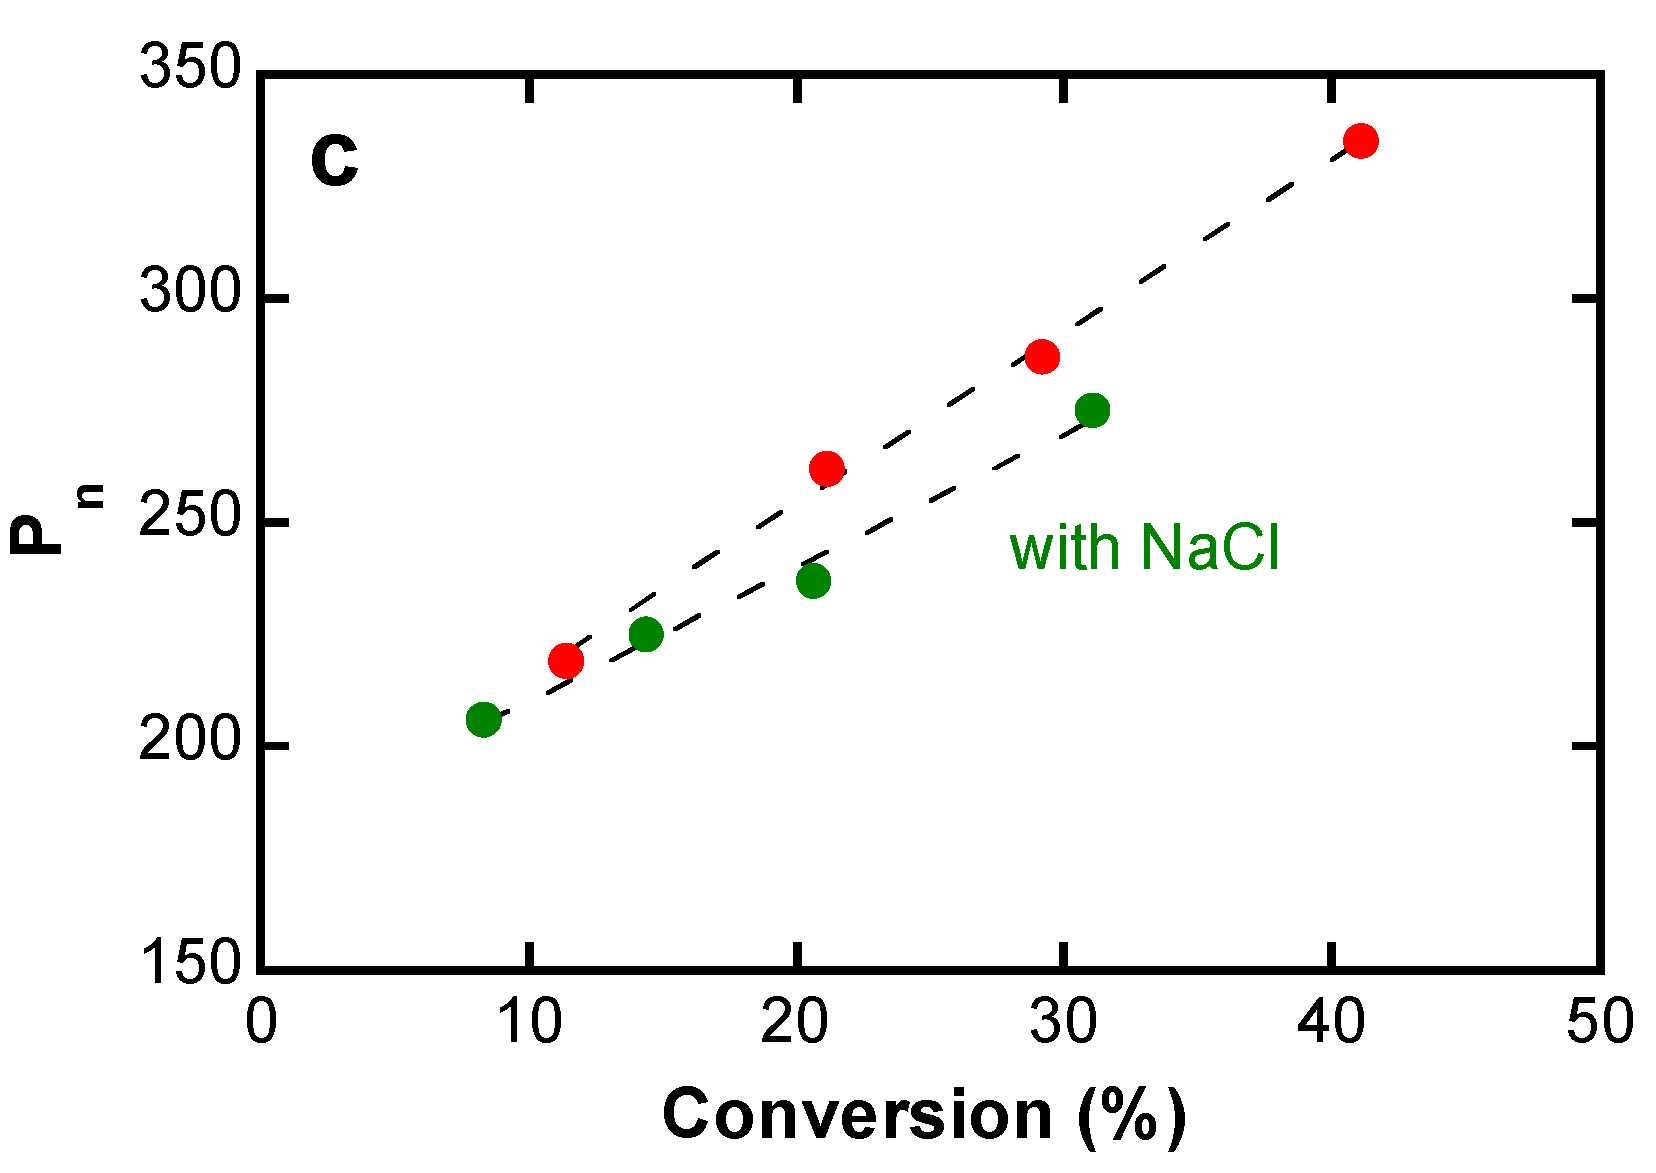
4.3.3. Side Reactions
4.4. Polyelectrolyte and Polyelectrolyte Solution Properties
4.4.1. Intrinsic Viscosity and Molar Mass
4.4.2. Counterion Condensation
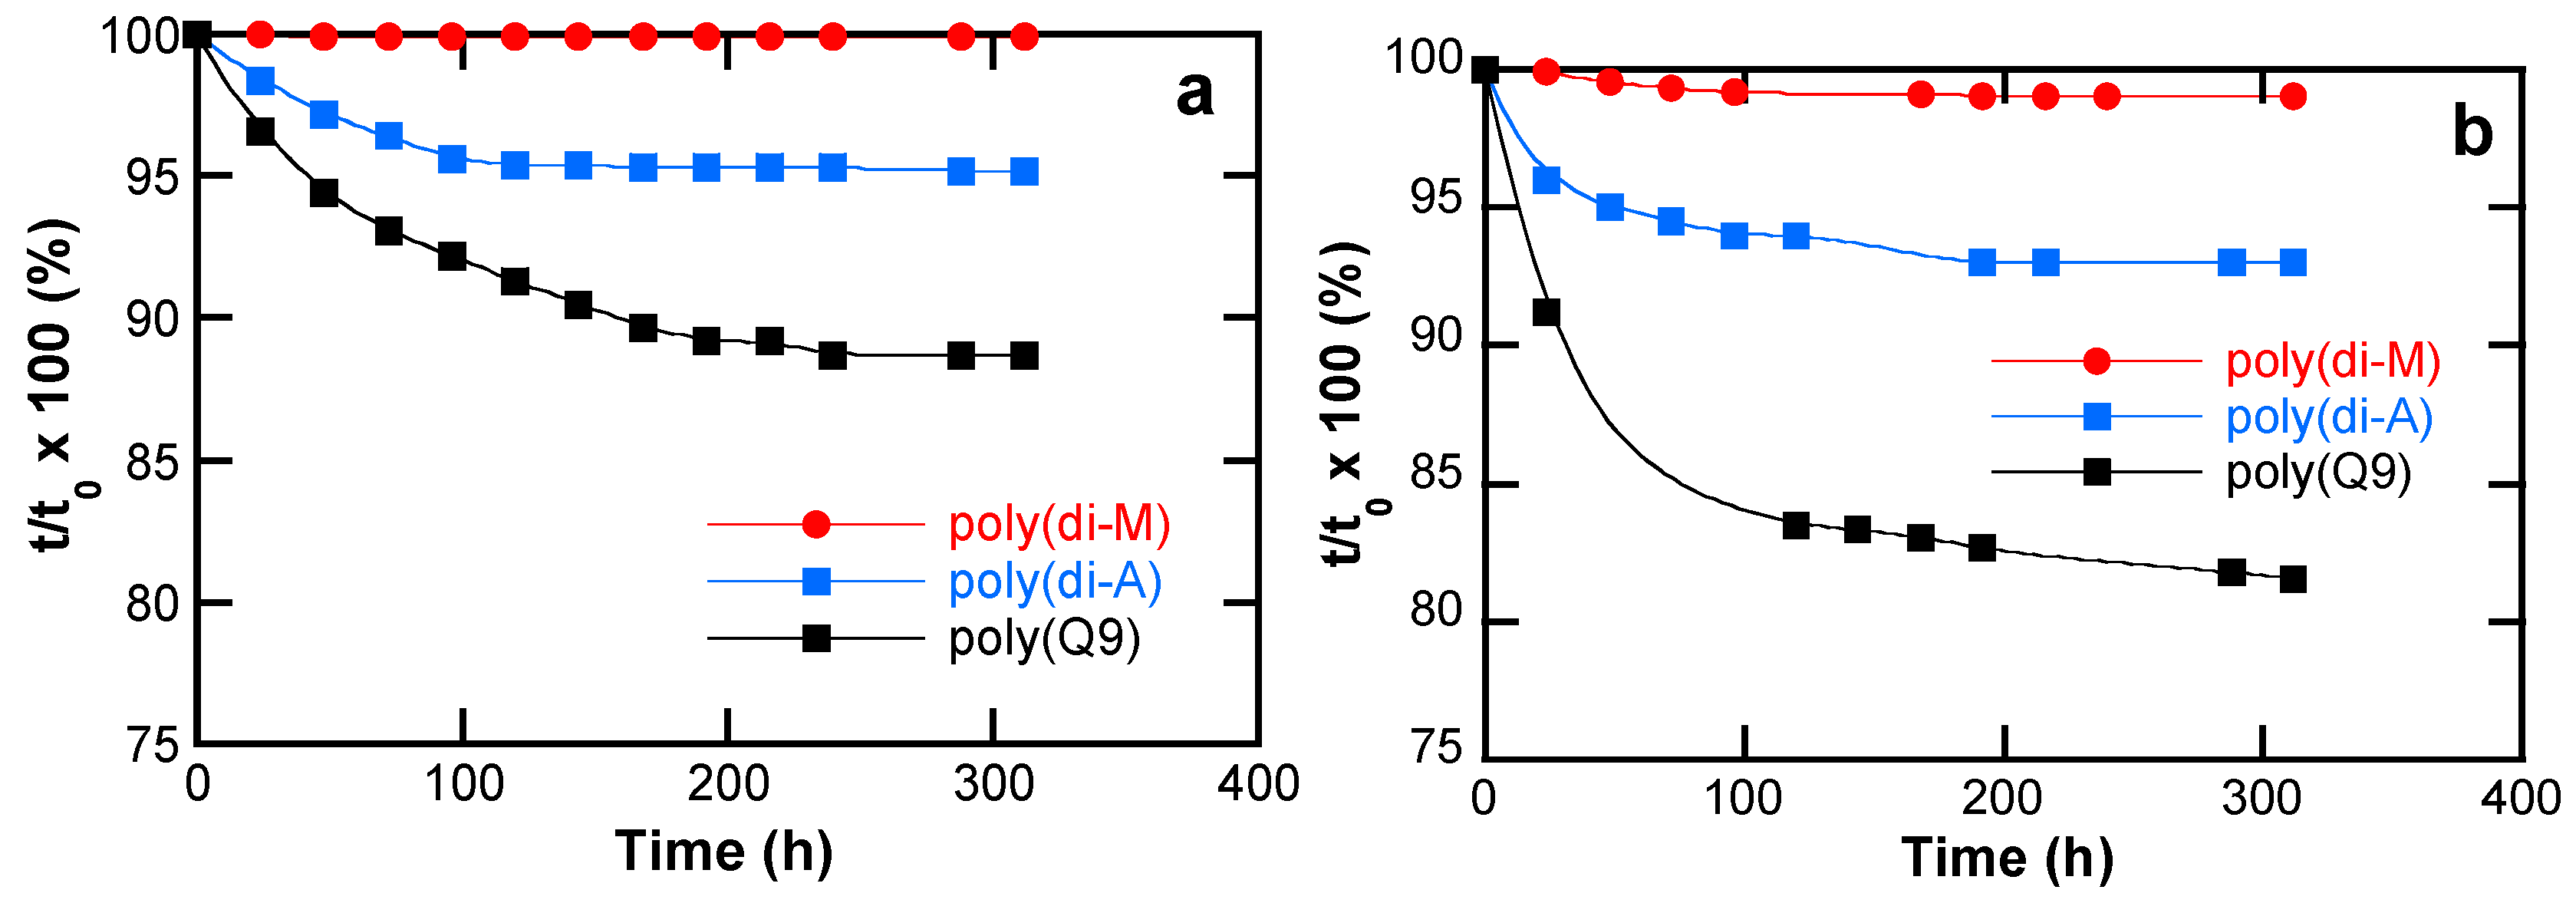
4.4.3. Comparison of Hydrolytic Stability
5. Discussion
5.1. Monomer and Monomer Solution Properties
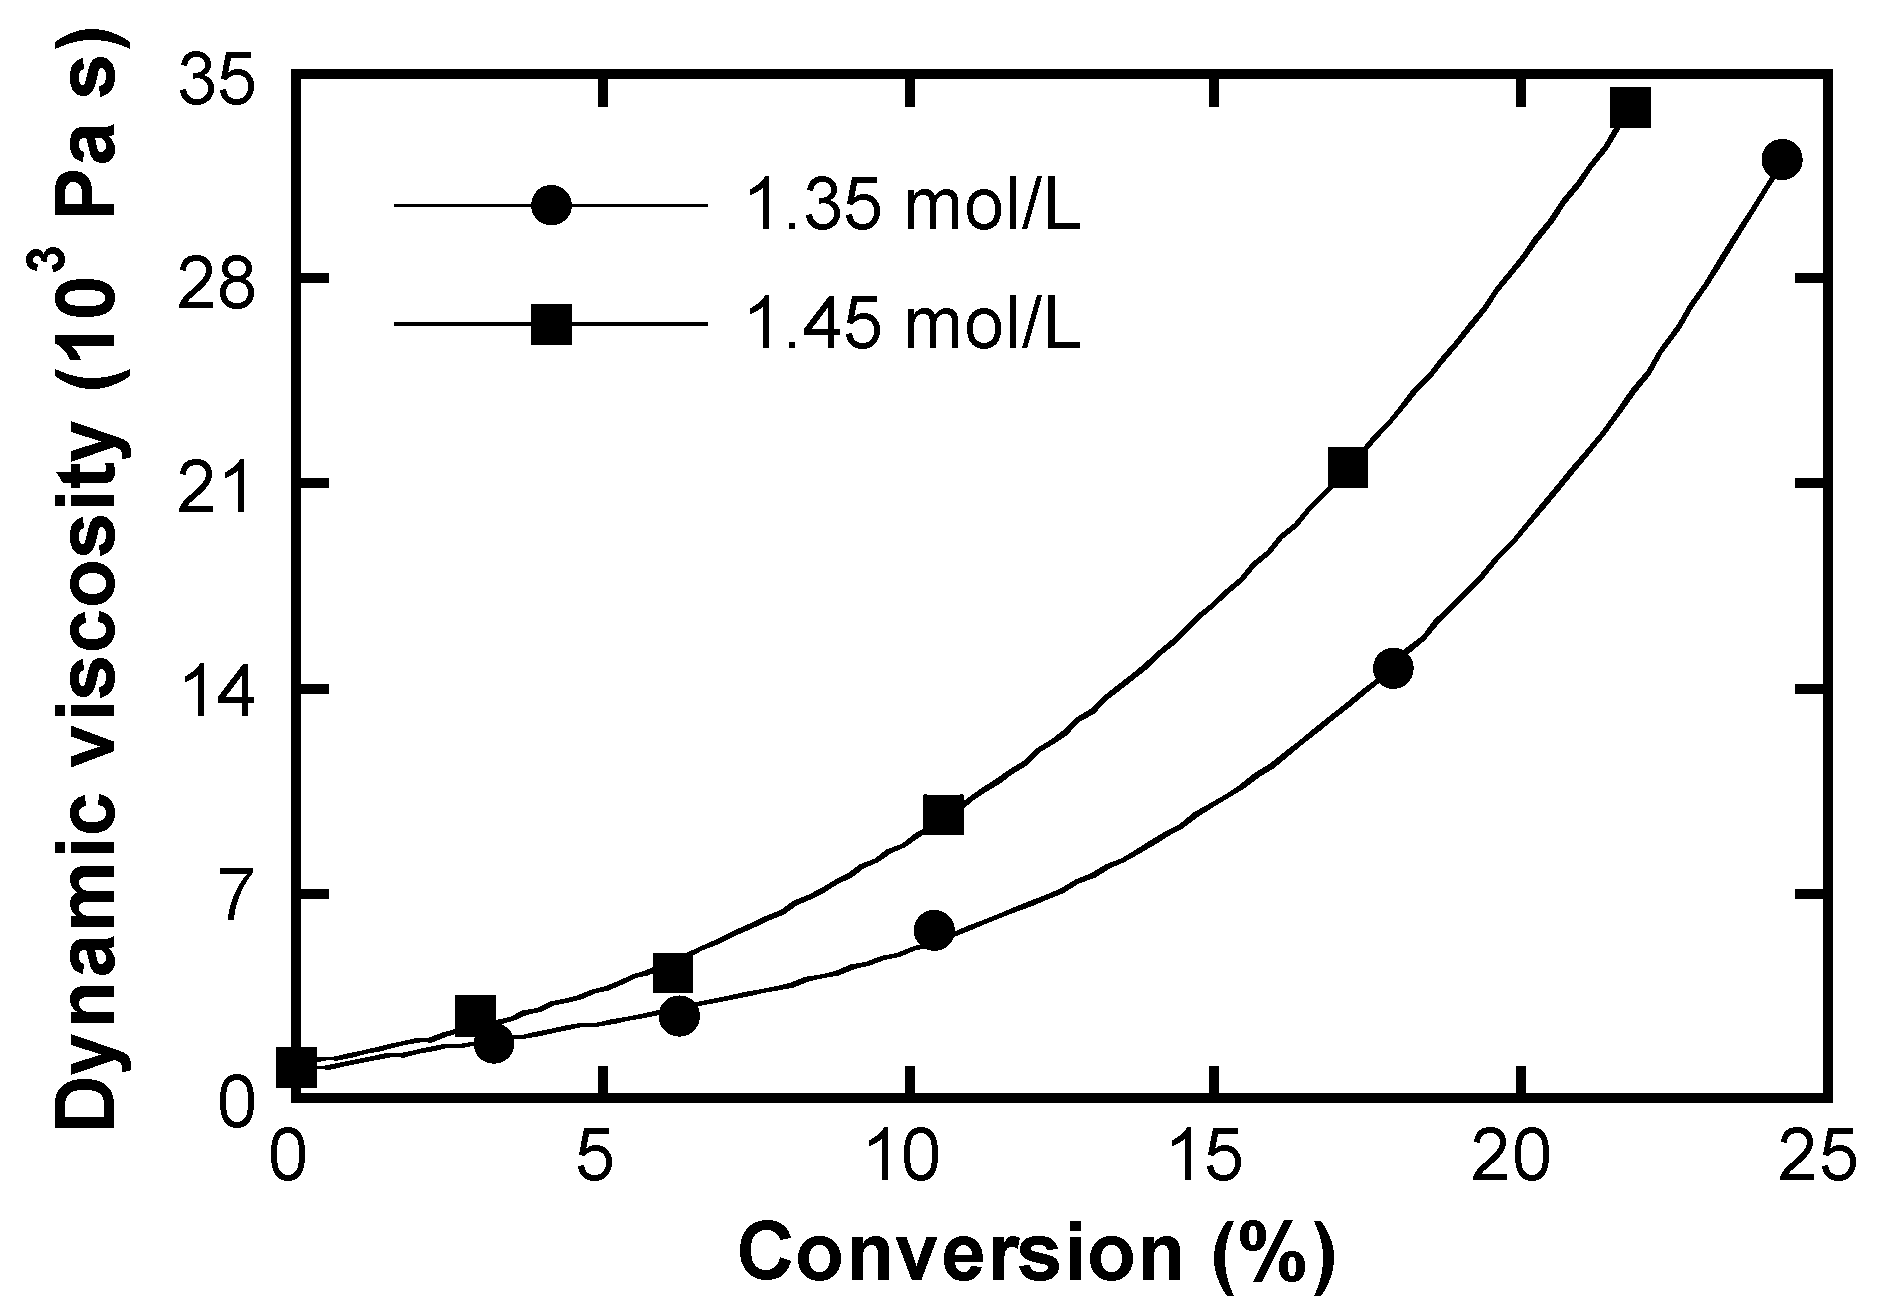
5.2. Autoacceleration
- increase of the viscosity because of polymer chain formation,
- monomer association due to the lack of solvent for mono-molecular dissolution of the monomer molecules,
- enhancement of the viscosity as the consequence of reduced ionic strength due to counterion condensation upon monomer to polymer transformation.
5.3. Polymerization Kinetics
5.3.1. Reaction Order of the Initiator Concentration
5.3.2. Monomer Concentration
5.3.3. Monomer Constitution
5.3.4. Temperature Effects
5.4. Polyelectrolyte and Polyelectrolyte Solution Properties
5.4.1. Intrinsic Viscosity and Molar Mass
5.4.2. Counterion Condensation
5.4.3. Hydrolytic Stability
6. Conclusions
Supplementary Materials
Acknowledgments
Author Contributions
Conflicts of Interest
Abbreviations
| PEL | polyelectrolyte(s) |
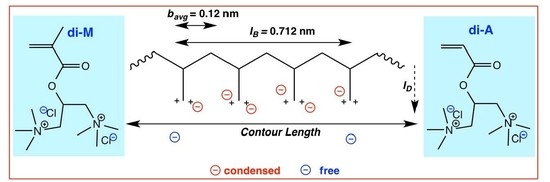
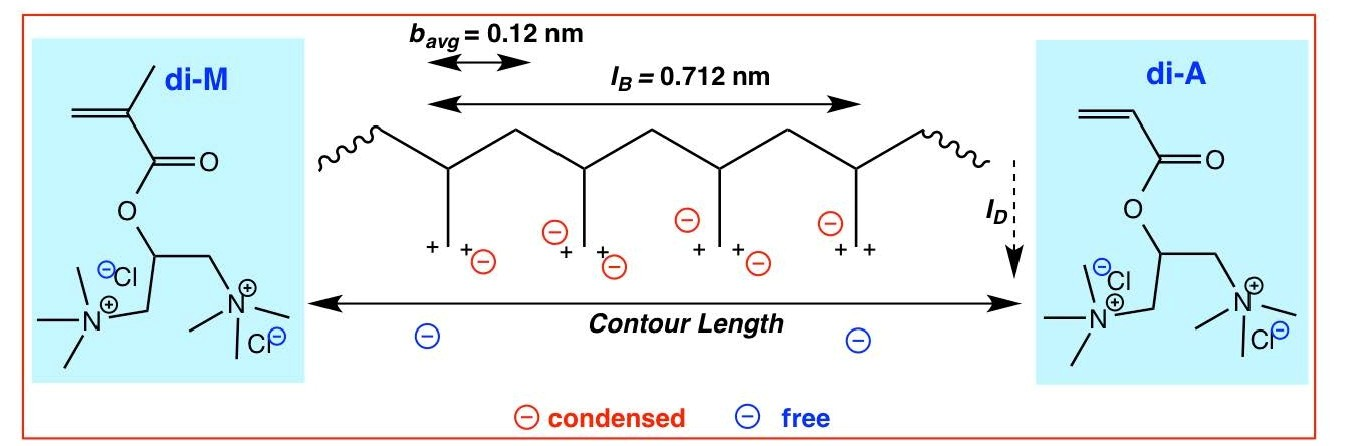
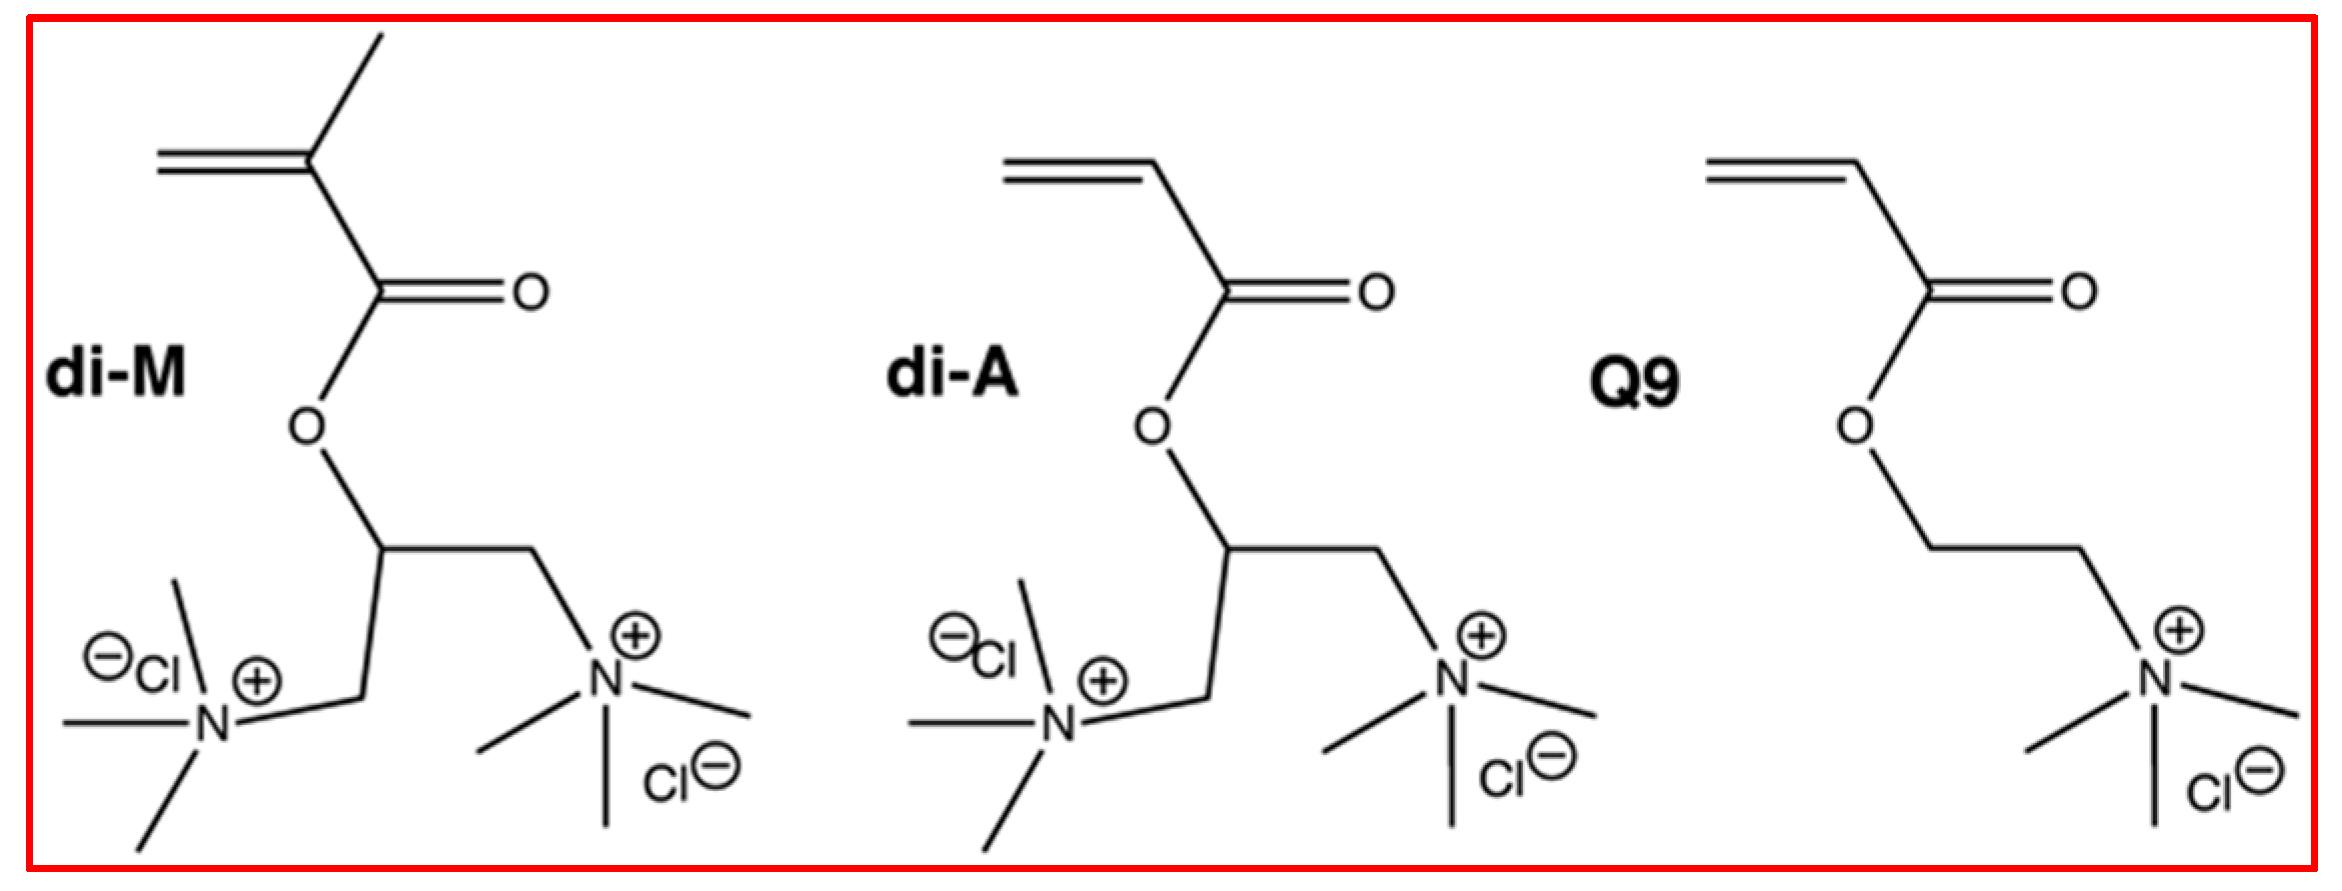
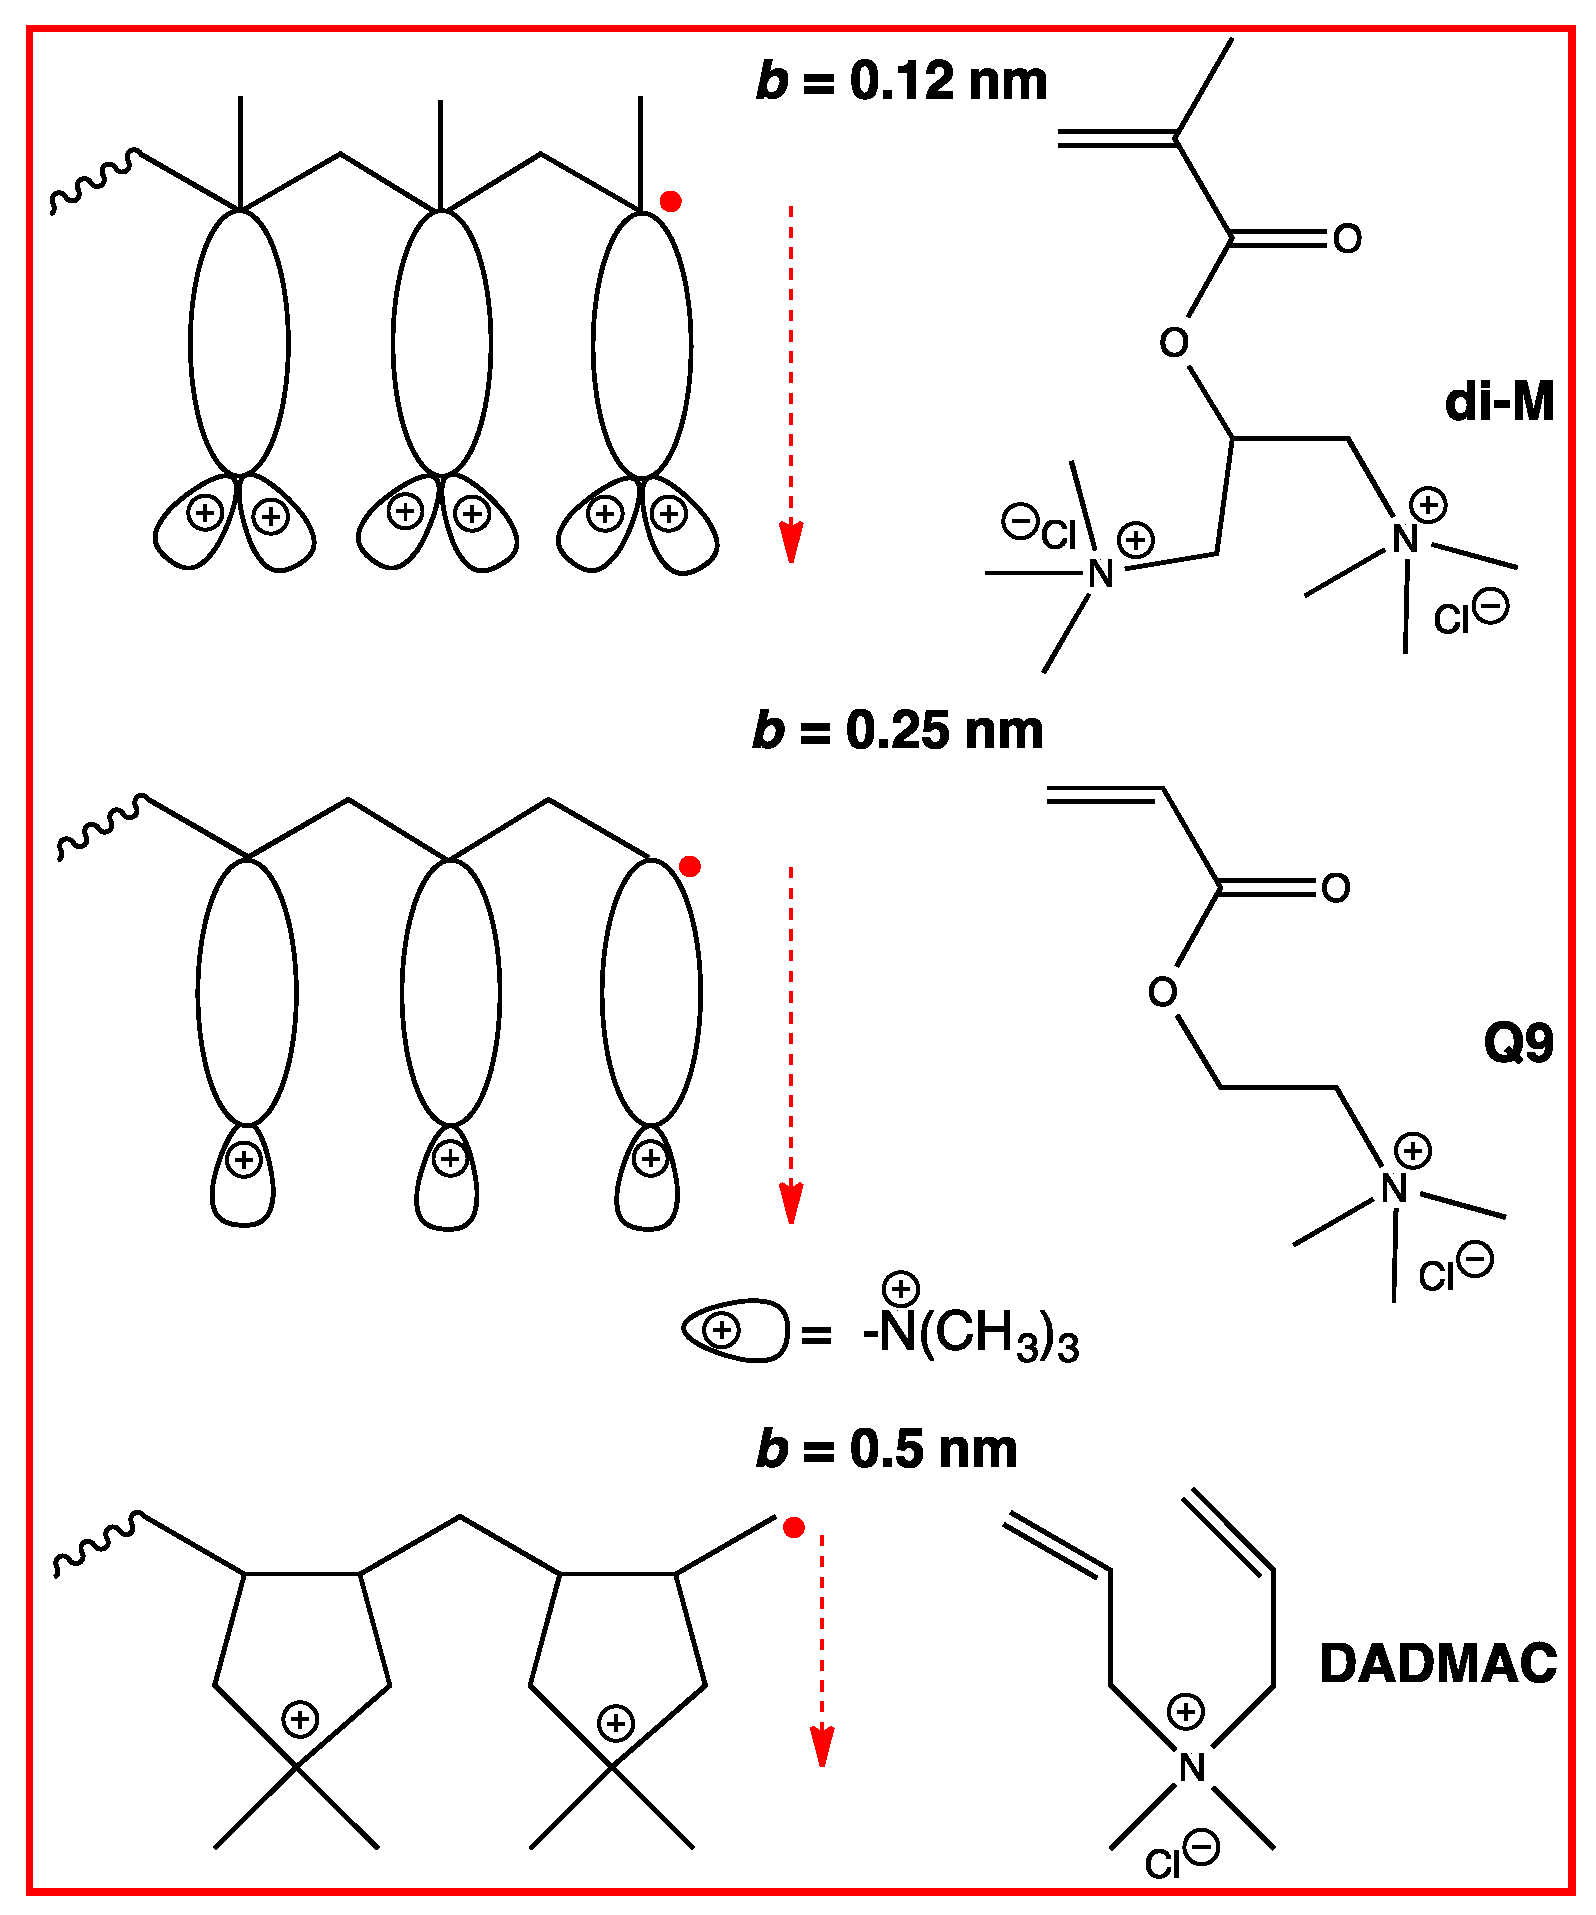
| di-M | 1,3-bis(N,N,N-trimethylammonium)-2-propylmethacrylate dichloride |
| di-A | 1,3-bis(N,N,N-trimethylammonium)-2-propylacrylate dichloride |
| Q9 | acryloyloxyethyltrimethylamonium chloride |
| DADMAC | diallyldimethylammonium chloride |
| AMPHC | 2,2′-azobis(2-methylpropionamidine) dihydrochloride |
| [M] | monomer concentration |
| [I] | initiator concentration |
| H | Huggins |
| SB | Schulz-Blaschke |
| PRT | primary radical termination |
| DCT | degradative chain transfer |
| FRP | free radical polymerization |
| HPLC | high-performance liquid chromatography |
| SEC | size exclusion chromatography |
| EPR | electron paramagnetic resonance |
References
- Jaeger, W.; Bohrisch, J.; Laschewsky, A. Synthetic polymers with quaternary nitrogen atoms-Synthesis and structure of the most used type of cationic polyelectrolytes. Progr. Polym. Sci. 2010, 35, 511–577. [Google Scholar] [CrossRef]
- Wandrey, C.; Hernandez-Barajas, J.; Hunkeler, D. Diallyldimethylammonium chloride and its polymers. Adv. Polym. Sci. 1999, 145, 123–182. [Google Scholar]
- Matsumoto, A.; Mano, H.; Oiwa, M. Polymerization of tetraallyl ammonium chloride. J. Polym. Sci. A 1989, 27, 1811–1816. [Google Scholar] [CrossRef]
- Hunkeler, D.; Hamielec, E. Kinetics and modeling of inverse-microsuspension polymerization: 2. Copolymerization of acrylamide with quaternary ammonium cationic monomers. Polymer 1991, 32, 2626–2640. [Google Scholar] [CrossRef]
- Beuermann, S.; Paquest, D.A., Jr.; McMinn, J.H.; Hutchinson, R.A. Propagation kinetics of methacrylic acid studied by pulsed laser polymerization. Macromolecules 1997, 30, 194–197. [Google Scholar] [CrossRef]
- Beuermann, S.; Buback, M.; Hesse, P.; Lacík, I. Free-radical propagation rate coefficient of nonionized methacrylic acid in aqueous solution from low monomer concentrations to bulk polymerization. Macromolecules 2006, 39, 184–193. [Google Scholar] [CrossRef]
- Beuermann, S.; Buback, M.; Hesse, P.; Kuchta, F.-D.; Lacík, I.; van Herk, A.M. Critically evaluated rate coefficients for free-radical polymerization. 6. Propagation rate coefficient for methacrylic acid. Pure Appl. Chem. 2007, 79, 1463–1469. [Google Scholar] [CrossRef]
- Beuermann, S.; Buback, M.; Hesse, P.; Kukučková, S.; Lacík, I. Propagation rate coefficient of non-ionized methacrylic acid radical polymerization in aqueous solution. The effect of monomer conversion. Macromol. Symp. 2007, 248, 41–49. [Google Scholar] [CrossRef]
- Beuermann, S.; Buback, M.; Hesse, P.; Hutchinson, R.A.; Kukučková, S.; Lacík, I. Termination kinetics of the free-radical polymerization of non-ionized methacrylic acid in aqueous solution. Macromolecules 2008, 41, 3513–3520. [Google Scholar] [CrossRef]
- Buback, M.; Hesse, P.; Hutchinson, R.A.; Kasák, P.; Lacík, I.; Stach, M.; Utz, I. Kinetics and modeling of free-radical batch polymerization of nonionized methacrylic acid in aqueous solution. Ind. Eng. Chem. Res. 2008, 47, 8197–8204. [Google Scholar] [CrossRef]
- Wittenberg, N.F.G.; Buback, M.; Hutchinson, R.A. Kinetics and modeling of methacrylic acid radical polymerization in aqueous solution. Macromol. React. Eng. 2013, 7, 267–276. [Google Scholar] [CrossRef]
- Wittenberg, N.F.G.; Preusser, C.; Kattner, H.; Stach, M.; Lacík, I.; Hutchinson, R.A.; Buback, M. Modeling acrylic acid radical polymerization in aqueous solution. Macromol. React. Eng. 2015. [Google Scholar] [CrossRef]
- Lacík, I.; Beuermann, S.; Buback, M. PLP-SEC study into free-radical propagation rate coefficients of partially and fully ionized acrylic acid in aqueous solution. Macromol. Chem. Phys. 2004, 205, 1080–1087. [Google Scholar] [CrossRef]
- Beuermann, S.; Buback, M.; Hesse, P.; Kukučková, S.; Lacík, I. Propagation kinetics of Free-radical methacrylic acid polymerization in aqueous solution. the effect of concentration and degree of ionization. Macromol. Symp. 2007, 248, 23–32. [Google Scholar] [CrossRef]
- Lacík, I.; Učňová, L.; Kukučková, S.; Buback, M.; Hesse, P.; Beuermann, S. Propagation rate coefficient of free-radical polymerization of partially and fully ionized methacrylic acid in aqueous solution. Macromolecules 2009, 42, 7753–7761. [Google Scholar] [CrossRef]
- Barth, J.; Buback, M. Termination and transfer kinetics of sodium acrylate polymerization in aqueous solution. Macromolecules 2012, 45, 4152–4157. [Google Scholar] [CrossRef]
- Beuermann, S.; Buback, M.; Hesse, P.; Junkers, T.; Lacík, I. Free-radical polymerization kinetics of 2-acrylamido-2-methylpropanesulfonic acid in aqueous solution. Macromolecules 2006, 39, 509–516. [Google Scholar] [CrossRef]
- Okayasu, T.; Hibino, T.; Nishide, H. Free radical polymerization kinetics of vinylsulfonic acid and highly acidic properties of its polymer. Macromol. Chem. Phys. 2011, 212, 1072–1079. [Google Scholar] [CrossRef]
- Buback, M.; Feldermann, A.; Kowollik, C.; Lacík, I. Propagation rate coefficients of Acrylate-Methacrylate free-radical bulk copolymerizations. Macromolecules 2001, 34, 5439–5448. [Google Scholar] [CrossRef]
- Beuermann, S.; Buback, M. Rate coefficients of free-radical polymerization deduced from pulsed laser experiments. Progr. Polym. Sci. 2002, 27, 191–254. [Google Scholar] [CrossRef]
- Losada, R.; Wandrey, C. Non-ideal polymerization kinetics of a cationic double charged acryl monomer and solution behavior of the resulting polyelectrolyte. Macromol. Rapid Commun. 2008, 29, 252–257. [Google Scholar] [CrossRef]
- Losada, R.; Wandrey, C. Copolymerization of a cationic double-charged monomer and electrochemical properties of the copolymers. Macromolecules 2009, 42, 3285–3293. [Google Scholar] [CrossRef]
- Vanneste, P.; Loenders, R.; Vanden Eynde, I.; Eeckhaoudt, S. Preparation of (Meth)Acrylate Diammonium Salts and Their Use as Monomers for The Synthesis of Polymers. Patent EP 1512676 A1, 09 March 2005. [Google Scholar]
- Huggins, M.L. Theory of solution of high polymers. J. Am. Chem. Soc. 1942, 64, 1712–1719. [Google Scholar] [CrossRef]
- Schulz, G.V.; Blaschke, F.J. Molecular-weight determinations on macromolecular materials. IX. An equation for the calculation of the viscosity number at very small concentrations. Prakt. Chem. 1941, 158, 130–135. [Google Scholar] [CrossRef]
- Wandrey, C.; Hunkeler, D. Handbook of Polyelectrolytes and their Applications; Tripathy, S.K., Kumar, J., Nalva, H.S., Eds.; ASP: Stevenson Ranch, CA, USA, 2002; Volume 2, pp. 147–172. [Google Scholar]
- Wandrey, C. Polyelektrolyte-Makromolekulare Parameter und Elektrolytverhalten; Cuvillier Verlag: Göttingen, Germany, 1997. [Google Scholar]
- Odian, G. Principles of Polymerization, 4th ed.; Wiley-Interscience: Hoboken, NJ, USA, 2004; pp. 204–274. [Google Scholar]
- Mayo, F.R. Chain transfer in the polymerization of styrene: The reaction of solvents with free radicals. J. Am. Chem. Soc. 1943, 65, 2324–2329. [Google Scholar] [CrossRef]
- Trommsdorff, V.E.; Köhle, H.; Lagally, P. Zur Polymerisation des methacrylsäuremethylesters. Macromol. Chem. 1948, 1, 169–198. [Google Scholar] [CrossRef]
- Balke, S.T.; Hamielec, A.E. Bulk polymerization of methyl methacrylate. J. Appl. Polym. Sci. 1973, 17, 905–949. [Google Scholar] [CrossRef]
- Turner, D.T. Autoacceleration of free radical polymerization. 1. The critical concentration. Macromolecules 1977, 10, 221–226. [Google Scholar] [CrossRef]
- Small, P.A. Long-chain branching in polymers. Adv. Polym. Sci. 1975, 18, 1–64. [Google Scholar]
- O’Neill, G.A.; Wisnudel, M.B.; Torkelson, J.M. Gel effect in free radical polymerization: Model discrimination of its cause. AIChE J. 1998, 44, 1226–1230. [Google Scholar] [CrossRef]
- Odian, G. Principles of Polymerization, 4th ed.; Wiley-Interscience: Hoboken, NJ, USA, 2004; pp. 282–289. [Google Scholar]
- O’Neill, G.A.; Wisnudel, M.B.; Torkelson, J.M. An evaluation of free volume approaches to describe the gel effect in free radical polymerization. Macromolecules 1998, 31, 4537–4545. [Google Scholar] [CrossRef]
- Kohonen, M.M.; Karaman, M.E.; Pashley, R.M. Debye length in multivalent electrolyte solutions. Langmuir 2000, 16, 5749–5753. [Google Scholar] [CrossRef]
- Tadmor, R.; Hernandez-Zapata, E.; Chen, N.; Pincus, P.; Israelachvili, J.N. Debye length and double-layer forces in polyelectrolyte solutions. Macromolecules 2002, 35, 2380–2388. [Google Scholar] [CrossRef]
- Dobrynin, A.V.; Rubinstein, M. Theory of polyelectrolytes in solution and at surfaces. Prog. Polym. Sci. 2005, 30, 1049–1118. [Google Scholar] [CrossRef]
- Kékicheff, P.; Ninham, B.W. The double-layer interaction in asymmetric electrolytes. Europhys. Lett. 1990, 12, 471–477. [Google Scholar] [CrossRef]
- Manning, G.S. Limiting laws and counterion condensation in polyelectrolyte solutions I. Colligative properties. J. Chem. Phys. 1969, 51, 924–933. [Google Scholar] [CrossRef]
- Durchschlag, H.; Zipper, P. Calculation of the partial volume of organic compounds and polymers. Progr. Colloid Polym. Sci. 1994, 94, 20–39. [Google Scholar]
- Durchschlag, H.; Zipper, P. Calculation of partial specific volumes and other volumetric properties of small molecules and polymers. J. Appl. Crystallogr. 1997, 30, 803–807. [Google Scholar] [CrossRef]
- Brandrup, J.; Immergut, E.H. (Eds.) Polymer Handbook, 4th ed.; Wiley-Interscience: Hoboken, NY, USA, 1999; p. II/10.
- Wako Pure Chemical Ind., Ltd. Wako Chemicals Information Brochure. Available online: http://www.wako-chem.co.jp/english/labchem/index_chemical.htm (accessed on 8 March 2016).
- Manning, G.S. Cluster theory of polyelectrolyte solutions. I. Activity coefficients of the mobile ions. J. Chem. Phys. 1965, 43, 4250–4259. [Google Scholar] [CrossRef]
- Manning, G.S. Limiting laws and counterion condensation in polyelectrolyte solutions II. Self-diffusion of the small ions. J. Chem. Phys. 1969, 51, 934–938. [Google Scholar] [CrossRef]
- Gueron, M.; Weisbuch, G.J. Polyelectrolyte theory. 2. Activity coefficients in Poisson-Boltzmann and in condensation theory of the counterion sheet. J. Chem. Phys. 1979, 83, 1991–1998. [Google Scholar] [CrossRef]
- Zhang, H.-L.; Han, S.-J. Viscosity and density of Water + Sodium Chloride + Potassium chloride solutions at 298.15 K. J. Chem. Eng. Data 1996, 41, 516–520. [Google Scholar] [CrossRef]
- Yu, Y.-X.; Gao, G.-H.; Li, Y.-G. Surface tension for aqueous electrolyte solutions by the modified mean spherical approximation. Fluid Ph. Equilib. 2000, 173, 23–38. [Google Scholar] [CrossRef]
- Sato, T.; Hashimoto, M.; Seno, M.; Hirano, T. Elementary reaction analysis of the radical polymerization of -ethyl-N-(-methylbenzyl)itaconamates carrying (RS)- and (S)-methylbenzylaminocarbonyl groups. J. Polym. Sci. Part A Polym. Chem. 2003, 41, 1819–1830. [Google Scholar] [CrossRef]
- Seno, M.; Fukui, T.; Hirano, T.; Sato, T. Kinetic and ESR studies on radical polymerization behavior of N-(2-phenylethoxycarbonyl)methacrylamide. J. Polym. Sci. Part A 2000, 38, 4264–4271. [Google Scholar] [CrossRef]
- Gromov, V.F.; Galperina, N.I.; Osmanov, T.O.; Khomikovskii, P.M.; Abkin, A.D. Effect of solvent on chain propagation and termination reaction rates in radical polymerisation. Eur. Polym. J. 1980, 16, 529–535. [Google Scholar]
- Wang, H.; Miyamoto, A.; Hirano, T.; Seno, M.; Sato, T. Radical polymerization of 2-methacryloyloxyethyl phosphorylcholine in water: Kinetics and salt effects. Eur. Polym. J. 2004, 40, 2287–2290. [Google Scholar] [CrossRef]
- Gromov, V.F.; Bogachev, Yu. S.; Bune, Y.V.; Zhuravleka, I.L.; Teleshov, E.N. Radical polymerization of water-soluble monomers in various solvents. Eur. Polym. J. 1991, 27, 505–508. [Google Scholar] [CrossRef]
- Heuts, J.P.A.; Gilbert, R.G.; Radom, L.A. Priori prediction of propagation rate coefficients in free-radical polymerizations: Propagation of ethylene. Macromolecules 1995, 28, 8771–8781. [Google Scholar] [CrossRef]
- Suleimenov, I.E.; Rustemova, E.M.; Bekturov, E.A. Mechanisms of viscosity of polyacids and polybases in the region of pronounced polyelectrolyte effect. J. Polym. Sci. A 2007, 49, 489–498. [Google Scholar] [CrossRef]
- De Kock, J.B.L.; van Herk, A.M.; German, A.L. Bimolecular free-radical termination at low conversion. J. Macromol. Sci. Polym. Rev. 2001, C41, 199–252. [Google Scholar] [CrossRef]
- Wandrey, C. Zur Bruttokinetik der Cyclopolymerisation von Dimethyl-diallyl-ammoniumchlorid. Ph.D. Thesis, FB Chemie AdW, Berlin, Germany, 1980. [Google Scholar]
- Deb, P.C.; Meyerhoff, G. Primary radical termination in polymerization: Evaluation of the characteristic constant. Eur. Polym. J. 1974, 10, 709–715. [Google Scholar] [CrossRef]
- Deb, P.C. Nonideal polymerization. Treatment of nonideality due to primary radical termination and degradative chain transfer. Eur. Polym. J. 1975, 11, 31–36. [Google Scholar] [CrossRef]
- Ghosh, P.; Banerjee, A.N.; Mitra, P.S.; Chakraborty, S. Chain transfer in presence of halogens in polymerization of methylmethacrylate. J. Polym. Sci. Part C 1975, 13, 35–38. [Google Scholar] [CrossRef]
- Shukla, P.; Srivastava, A.K. Radical polymerization of methyl methacrylate initiated by pyridine dicyanomethylide. Eur. Polym. J. 1988, 24, 1115–1117. [Google Scholar] [CrossRef]
- Brandrup, J.; Immergut, E.H. (Eds.) Polymer Handbook, 4th ed.; Wiley-Interscience: Hoboken, NY, USA, 1999; p. II/101.
- Topchiev, D.A.; Nashmetdinova, G.T. Kinetics of radical polymerization of N,N-dialkyl-N,N-diallylammonium chlorides. Vysokomol. Soed. A 1983, 25, 636–641. [Google Scholar]
- Wandrey, C.; Jaeger, W.; Reinisch, G. Zur Kinetik der radikalischen Polymerisation von Dimethyl-dially-lammoniumchlorid. I. Bruttokinetik bei niedrigen Umsätzen und Versuche zu ihrer Deutung. Acta Polym. 1981, 32, 197–202. [Google Scholar] [CrossRef]
- Hahn, M.; Jaeger, W.; Wandrey, C.; Seehaus, F.; Reinisch, G. Cyclopolymerization kinetics of dimethyldiallylammonium chloride. J. Macromol. Sci. Chem. A 1984, A21, 593–614. [Google Scholar]
- Pascal, P.; Napper, D.H.; Gilbert, R.G.; Piton, M.C.; Winnik, M.A. Pulsed laser study of the propagation kinetics of acrylamide and methacrylamide in water. Macromolecules 1990, 23, 5161–5163. [Google Scholar] [CrossRef]
- Kukulj, D.; Davis, T.P. Average propagation rate coefficients in the free-radical copolymerization of styrene and α-methylstyrene measured by pulsed-laser polymerization. Macromolecules 1998, 31, 5668–5680. [Google Scholar] [CrossRef]
- Morris, L.M.; Davis, T.P.; Chaplin, R.P. Radical copolymerization propagation kinetics of methyl ethylacrylate and styrene. Polymer 2001, 42, 941–952. [Google Scholar] [CrossRef]
- Gilbert, B.C.; Smith, J.R.L.; Milne, E.C.; Whitwood, A.C.; Taylor, P. Kinetic and structural EPR studies of radical polymerization. Monomer, dimer, trimer and mid-chain radicals formed via the initiation of polymerization of acrylic acid and related compounds with electrophilic radicals (·OH, SO4−· and Cl2−·). J. Chem. Soc. Perkin Trans. 1994, 2, 1759–1769. [Google Scholar] [CrossRef]
- Buback, M.; Hesse, P.; Lacík, I. Propagation rate coefficient and fraction of mid-chain radicals for acrylic acid polymerization in aqueous solution. Macromol. Rapid Commun. 2007, 28, 2049–2054. [Google Scholar] [CrossRef]
- Manning, G.S.; Mohanty, U. Counterion condensation on ionic oligomers. Phys. A 1997, 247, 196–204. [Google Scholar] [CrossRef]
- Lacík, I.; Beuermann, S.; Buback, M. Aqueous phase size-exclusion-chromatography used for PLP-SEC studies into free-radical propagation rate of acrylic acid in aqueous solution. Macromolecules 2001, 34, 6224–6228. [Google Scholar] [CrossRef]
- Lacík, I.; Beuermann, S.; Buback, M. PLP-SEC study into free-radical propagation rate of non-ionized acrylic acid in aqueous solution. Macromolecules 2003, 36, 9355–9363. [Google Scholar] [CrossRef]
- Buback, M.; Egorov, M.; Junkers, T.; Panchenko, E. Free-radical termination kinetics studied using a novel SP–PLP–ESR technique. Macromol. Rapid Commun. 2004, 25, 1004–1009. [Google Scholar] [CrossRef]
- Barth, J.; Buback, M. SP-PLP-EPR—A novel method for detailed studies into the termination kinetics of radical polymerization. Macromol. React. Eng. 2010, 4, 288–301. [Google Scholar] [CrossRef]
- Barth, J.; Buback, M. SP-PLP-EPR Study into the termination kinetics of methacrylic acid radical polymerization in aqueous solution. Macromolecules 2011, 44, 1292–1297. [Google Scholar] [CrossRef]
- Barth, J.; Meiser, W.; Buback, M. SP-PLP-EPR study into termination and transfer kinetics of non-ionized acrylic acid polymerized in aqueous solution. Macromolecules 2012, 45, 1339–1345. [Google Scholar] [CrossRef]
- Owenius, R.; Trry, G.E.; Williams, M.J.; Eaton, S.S.; Eaton, G.R. Frequency dependence of electron spin relaxation of Nitroxyl radicals in fluid solution. J. Phys. Chem. B 2004, 108, 9475–9481. [Google Scholar] [CrossRef]
- Yamada, B.; Sugiyama, S.; Mori, S.; Otsu, T. Low ceiling temperature in radical polymerization of 2,6-dimethylphenyl methacrylate. J. Macromol. Sci. Chem. 1981, A14, 339–345. [Google Scholar] [CrossRef]
- Penelle, J.; Xie, T. Synthesis, characterization and thermal properties of poly(trimethylene-1,1-dicarboxylate) polyelectrolyte. Macromolecules 2001, 34, 5083–5089. [Google Scholar] [CrossRef]


| Series | [M] (mol/L) | [I] × 102 (mol/L) | T (K) | Monomer type |
|---|---|---|---|---|
| Polymerizations to high conversion | ||||
| 1 | 0.3–1.6 | 1.6 | 323 | di-M |
| 2 | 0.86–1.35 | 1.6 | 323 | di-A |
| 3 | 0.1–0.6 | 0.49 | 323 | Q9 |
| Effect of the ionic strength, addition of 1 mol/L NaCl | ||||
| 4 | 1.35 | 1.6 | 323 | di-M |
| Polymerizations to low conversion | ||||
| 5 | 0.3–1.6 | 1.6 | 323 | di-M |
| 6 | 0.85–1.23 | 1.6 | 323 | di-A |
| 7 | 0.1–0.7 | 0.49 | 323 | Q9 |
| Effect of the reaction temperature | ||||
| 8 | 0.3–1.47 | 1.6 | 323–338 | di-M |
| 9 | 1.33 | 1.6 | 318–328 | di-A |
| Evaluation of side reactions | ||||
| 10 | 1.2–1.5 | 1.65 | 323 | di-M |
| Monomer | Molar mass | Δ | ||||
|---|---|---|---|---|---|---|
| (g/mol) | (mL/g) | (mL/g) | (mL/mol) | (mL/mol) | (%) | |
| di-M | 315.28 | 0.826 | 0.785 | 260.4 | 247.5 | 5.0 |
| di-A | 301.26 | 0.807 | 0.768 | 243.1 | 231.6 | 4.7 |
| Q9 | 193.67 | 0.843 | 0.805 | 163.3 | 156.0 | 4.5 |
| Reaction time (min) | Conversion (%) | [η] (mL/g) | Mn (kg/mol) | Pn |
|---|---|---|---|---|
| [di-M]0 = 1.35 mol/L | ||||
| 25 | 11.4 | 37 | 69.0 | 219 |
| 40 | 21.1 | 44 | 82.6 | 262 |
| 50 | 24.3 | 48 | 90.5 | 287 |
| 62 | 41.1 | 54 | 102.5 | 325 |
| [di-M]0 = 1.45 mol/L | ||||
| 20 | 10.5 | 40 | 74.7 | 237 |
| 35 | 21.8 | 53 | 99.9 | 317 |
| 45 | 32.7 | 64 | 122.0 | 387 |
| 50 | 39.8 | 70 | 134.0 | 425 |
| Reaction time (min) | Conversion (%) | [η] (mL/g) | Mn (kg/mol) | Pn |
|---|---|---|---|---|
| 25 | 8.3 | 35 | 64.9 | 206 |
| 40 | 14.4 | 38 | 70.9 | 225 |
| 50 | 20.6 | 40 | 74.7 | 237 |
| 65 | 31.1 | 46 | 86.7 | 275 |
| Series | [di-M]0 (mol/L) | [di-A]0 (mol/L) | Ea (kJ/mol) | ln A |
|---|---|---|---|---|
| 8 | 1.47 | - | 20.6 | −0.9 |
| 8 | 1.33 | - | 31.5 | 4.0 |
| 9 | - | 1.33 | 103 | 29 |
| [η]SB (mL/g) | kSB | [η]H (mL/g) | kH | Mn × 10−3 (g/mol) a |
|---|---|---|---|---|
| 41 | 0.44 | 41 | 0.49 | 85.6 |
| 59 | 0.46 | 58 | 0.53 | 107 |
| 62 | 0.38 | 61 | 0.44 | 118 |
| 96 | 0.27 | 95 | 0.31 | 200 |
| 239 b | 0.27 | 233 | 0.41 | - |
| 236 c | 0.28 | 229 | 0.42 | - |
© 2016 by the authors. Licensee MDPI, Basel, Switzerland. This article is an open access article distributed under the terms and conditions of the Creative Commons Attribution (CC-BY) license ( http://creativecommons.org/licenses/by/4.0/).
Share and Cite
Ahmadloo, H.; Losada, R.; Wandrey, C. Effect of Very High Charge Density and Monomer Constitution on the Synthesis and Properties of Cationic Polyelectrolytes. Polymers 2016, 8, 234. https://doi.org/10.3390/polym8060234
Ahmadloo H, Losada R, Wandrey C. Effect of Very High Charge Density and Monomer Constitution on the Synthesis and Properties of Cationic Polyelectrolytes. Polymers. 2016; 8(6):234. https://doi.org/10.3390/polym8060234
Chicago/Turabian StyleAhmadloo, Hamideh, Ricardo Losada, and Christine Wandrey. 2016. "Effect of Very High Charge Density and Monomer Constitution on the Synthesis and Properties of Cationic Polyelectrolytes" Polymers 8, no. 6: 234. https://doi.org/10.3390/polym8060234
APA StyleAhmadloo, H., Losada, R., & Wandrey, C. (2016). Effect of Very High Charge Density and Monomer Constitution on the Synthesis and Properties of Cationic Polyelectrolytes. Polymers, 8(6), 234. https://doi.org/10.3390/polym8060234