
Optical Characterization of Doped Thermoplastic and Thermosetting Polymer-Optical-Fibers

 , , ,
, , ,  ,
,
Abstract
:
1. Introduction
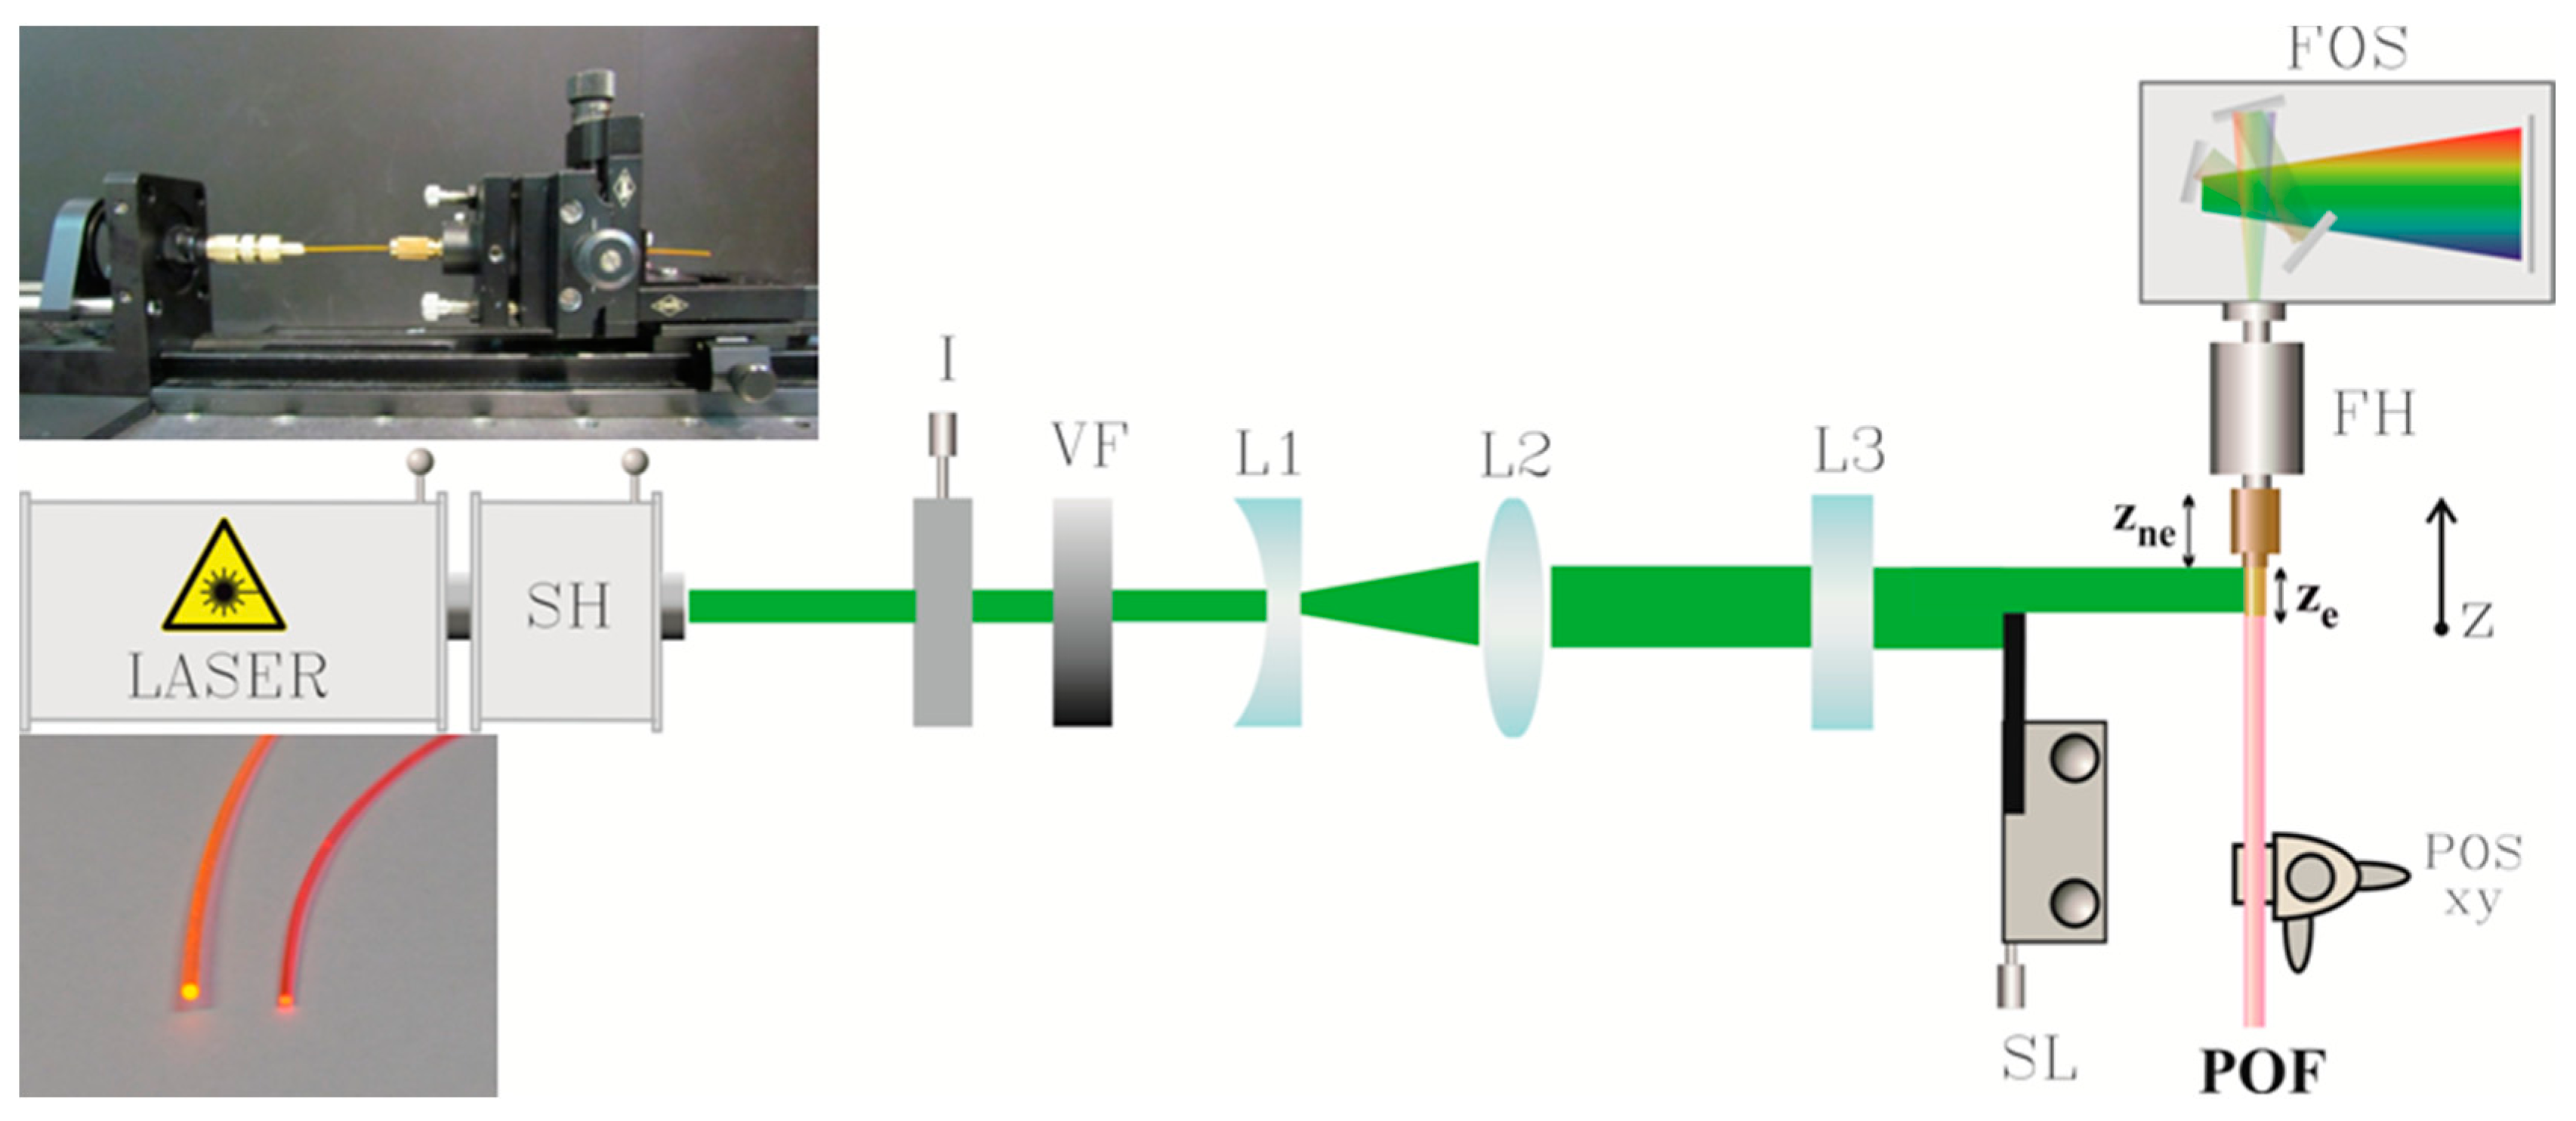
2. Experiment
3. Results and Discussion
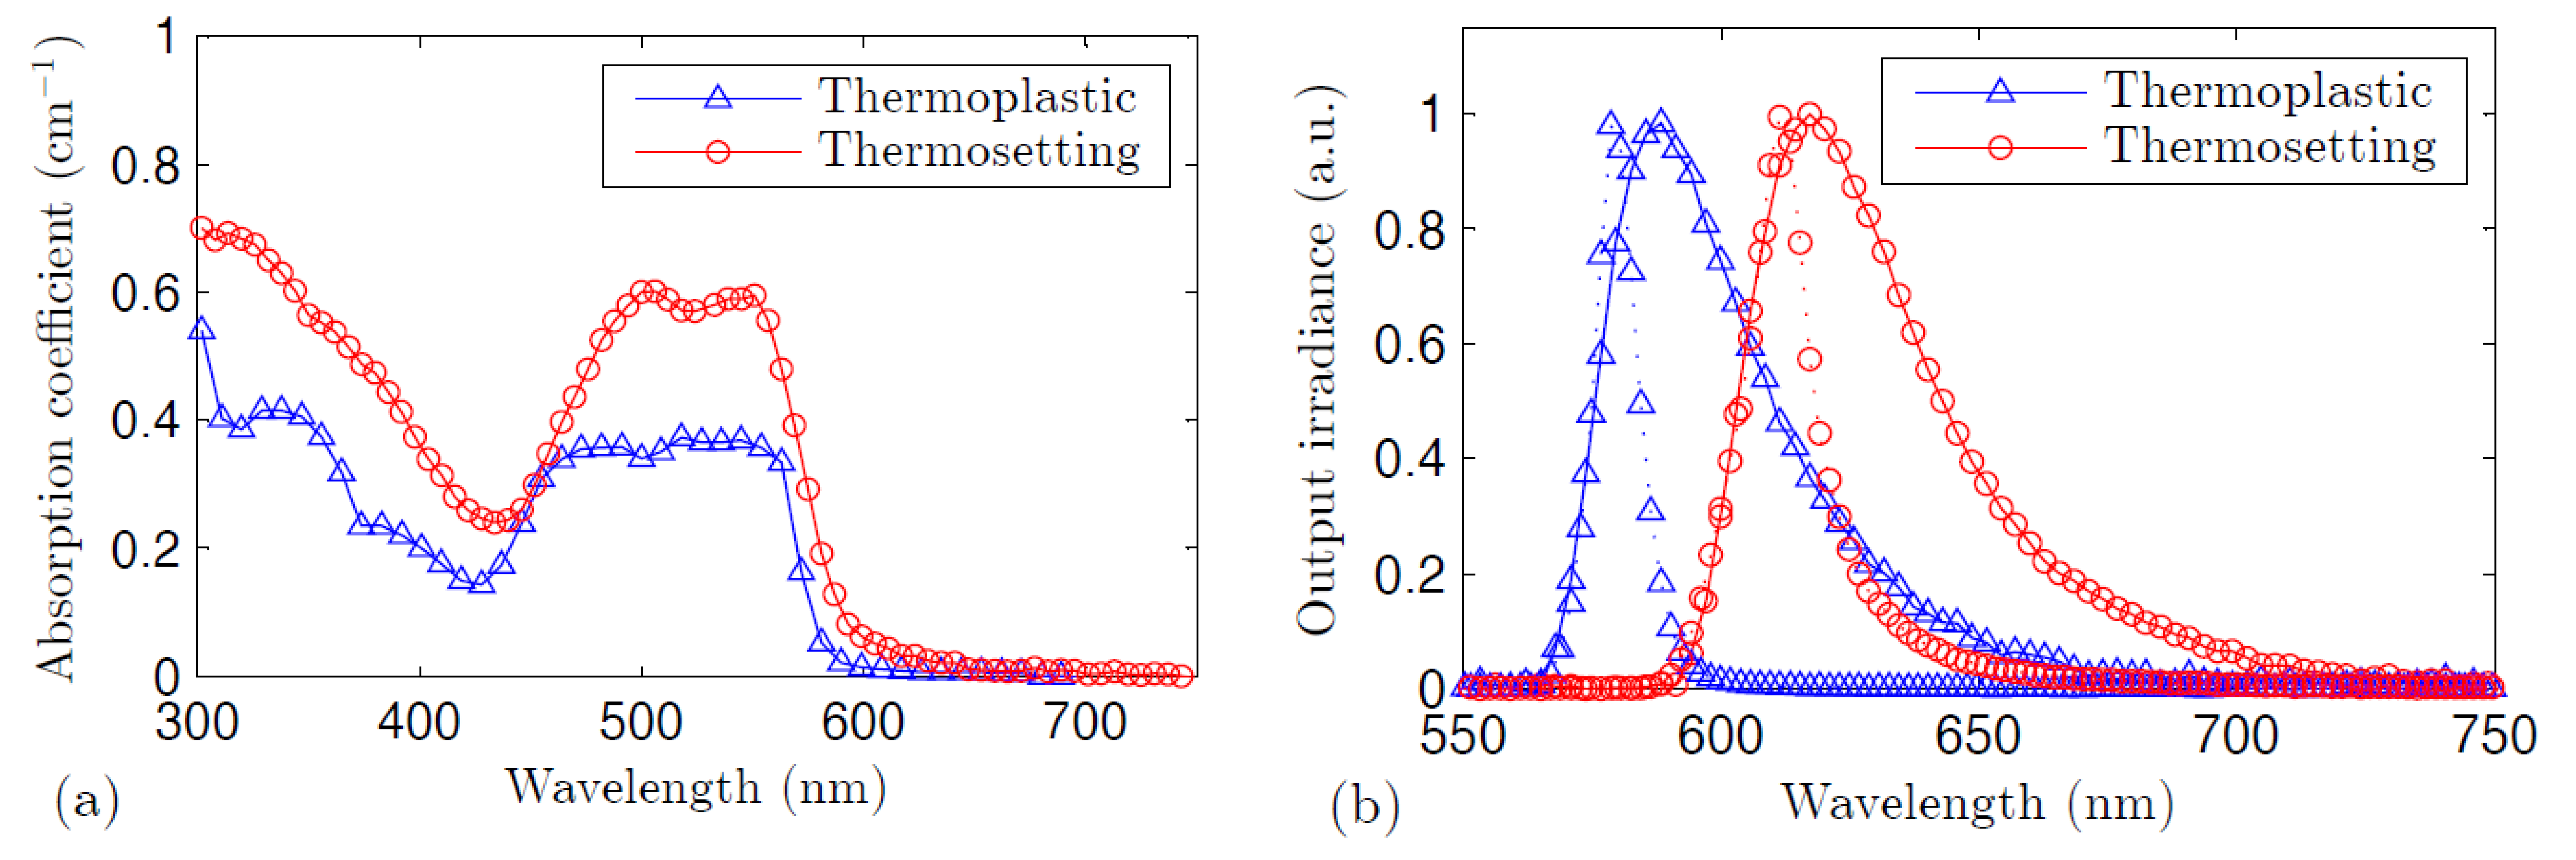
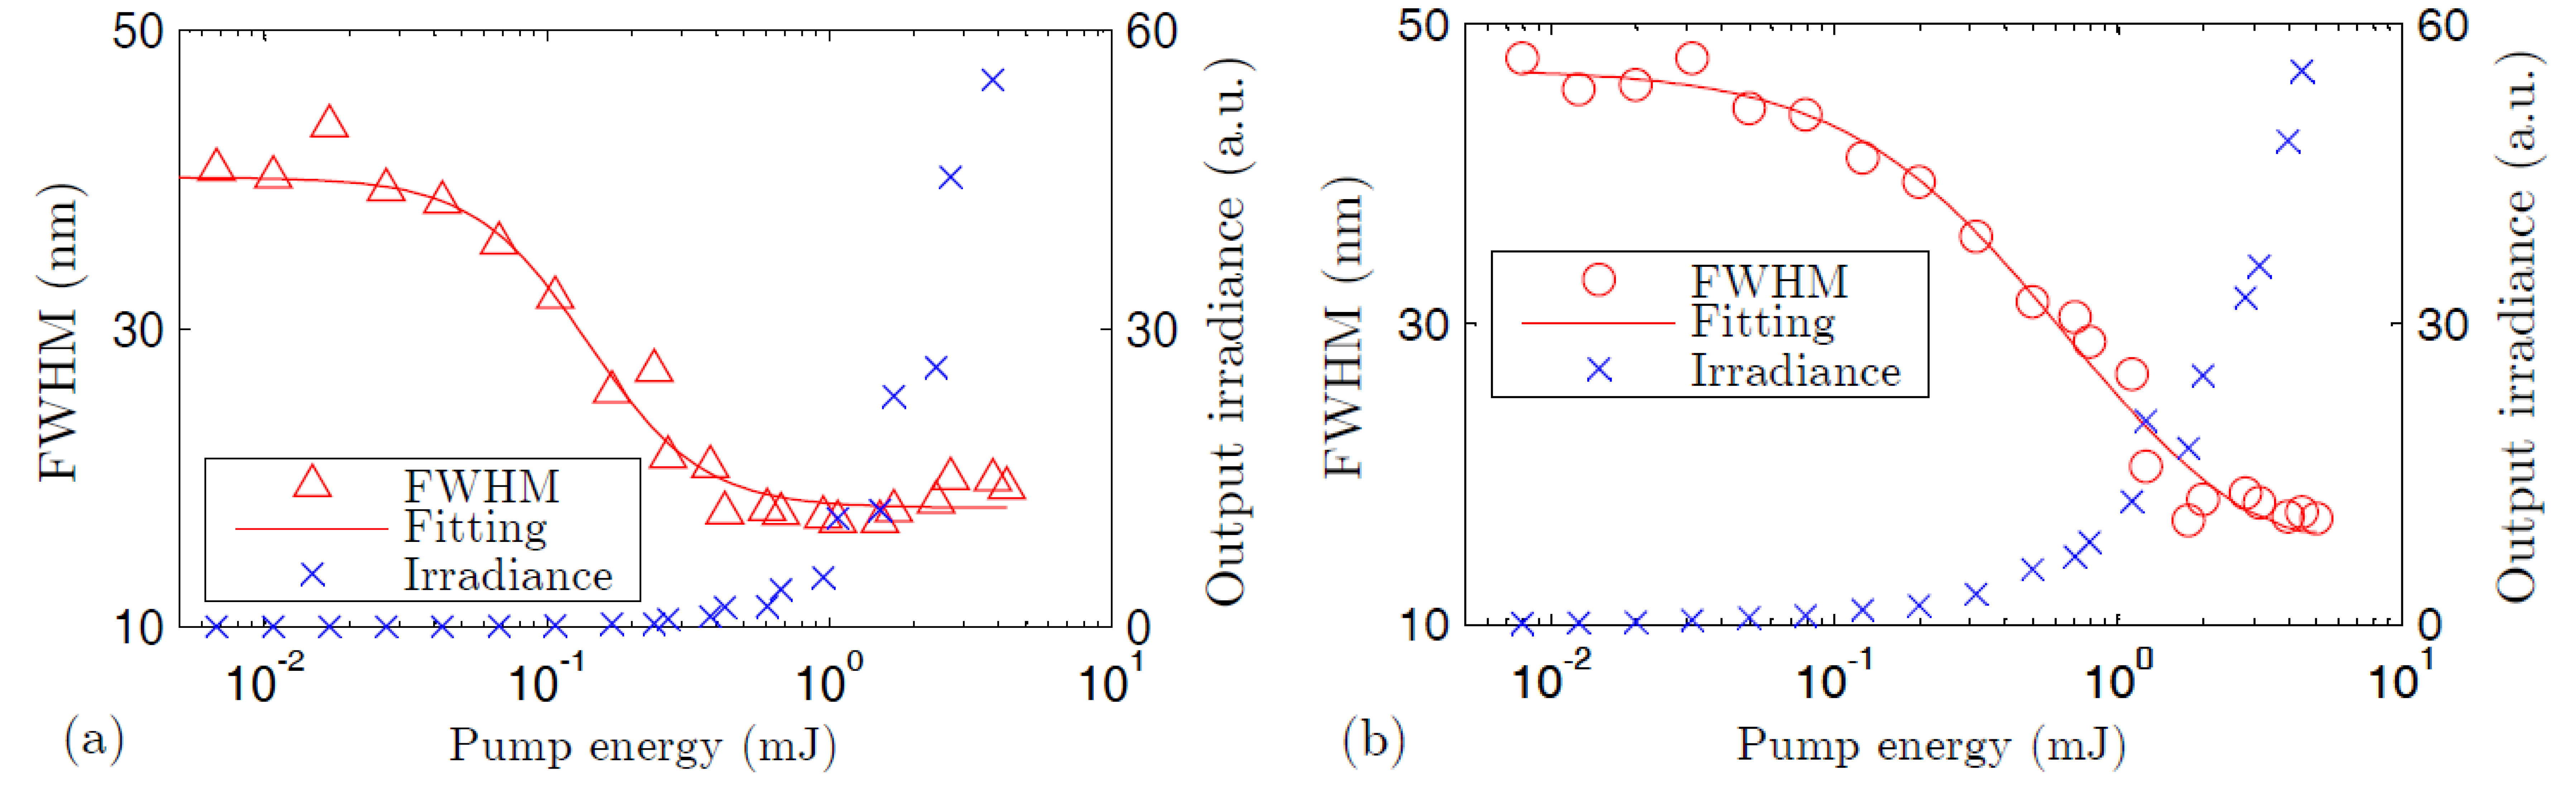
3.1. Absorption, Fluorescence, and ASE Spectra
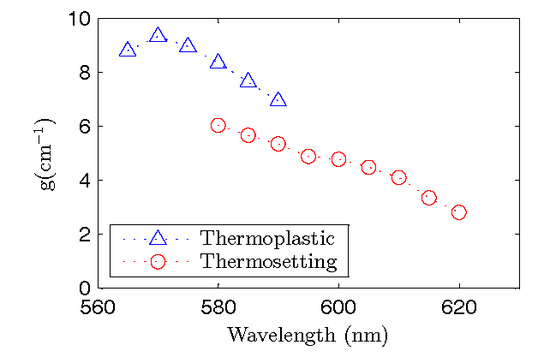
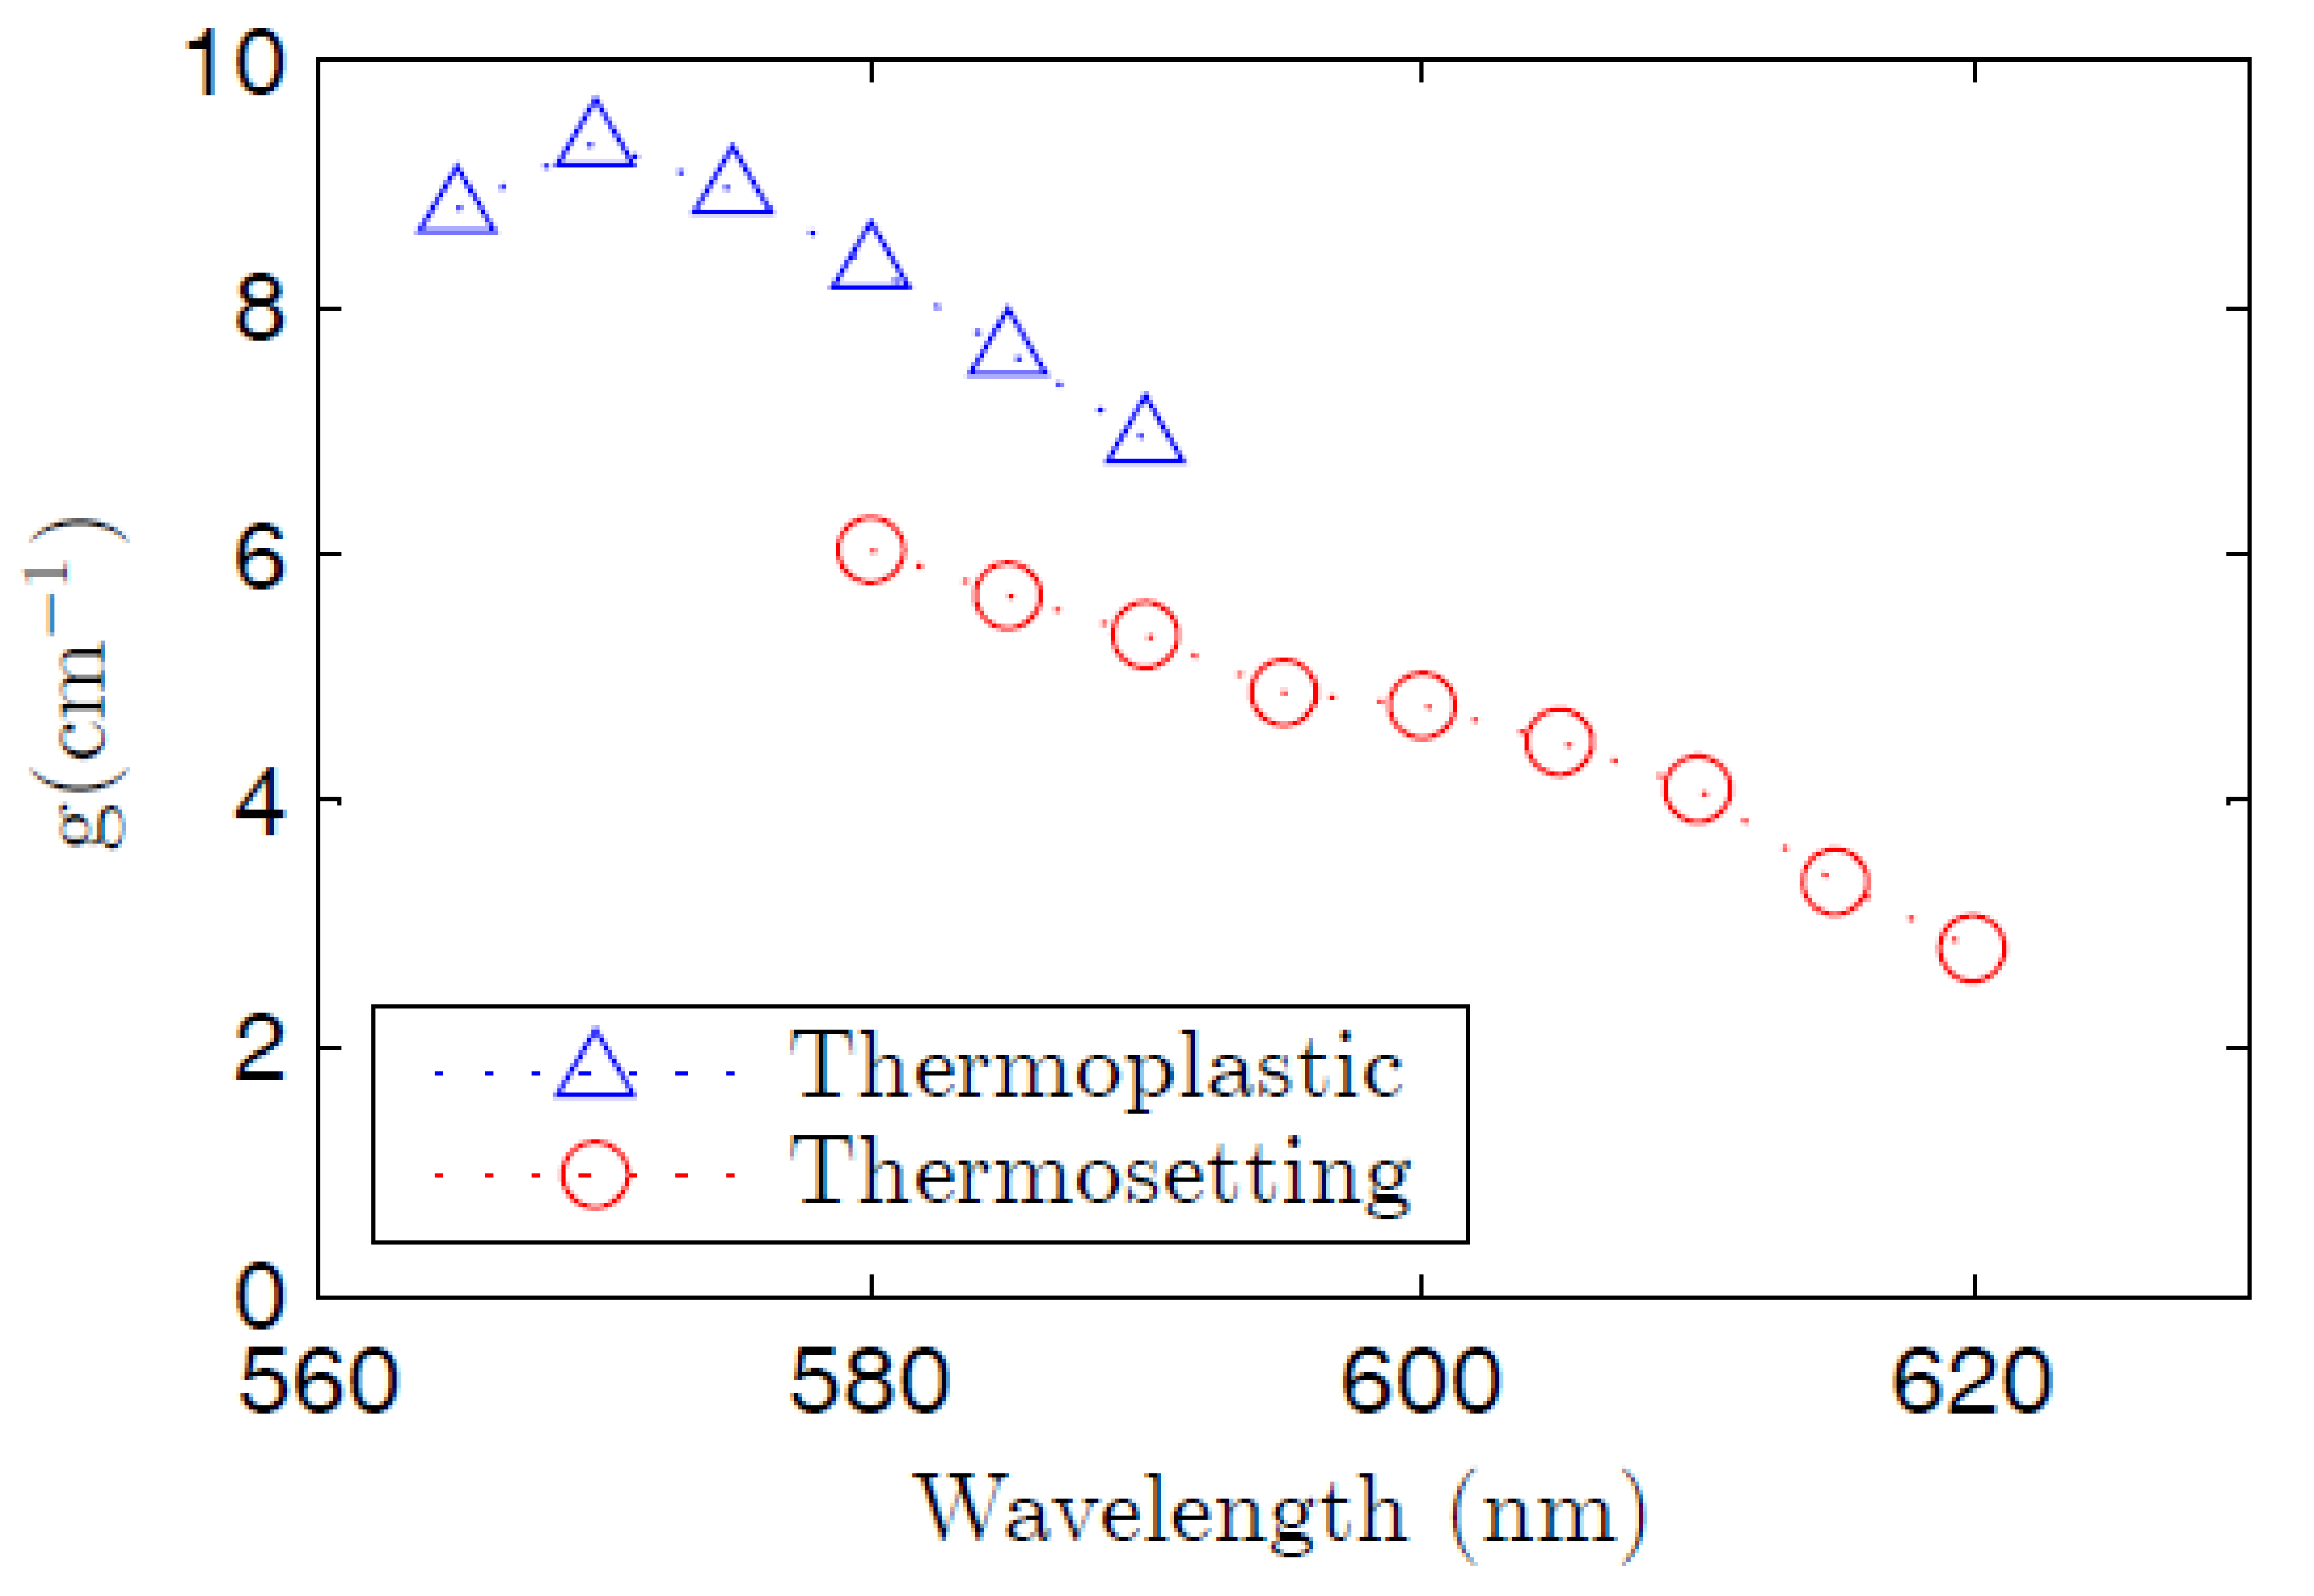
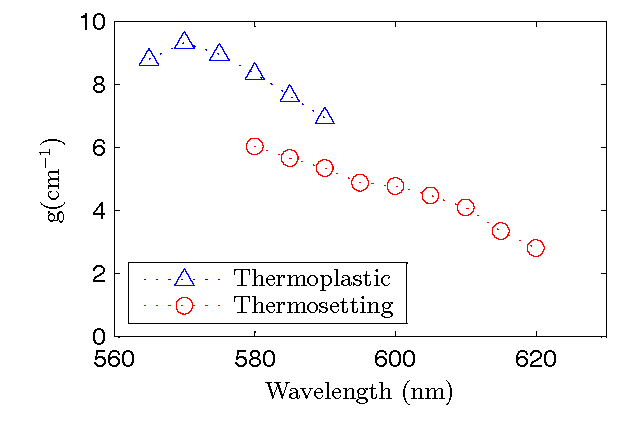
3.2. Optical Gain
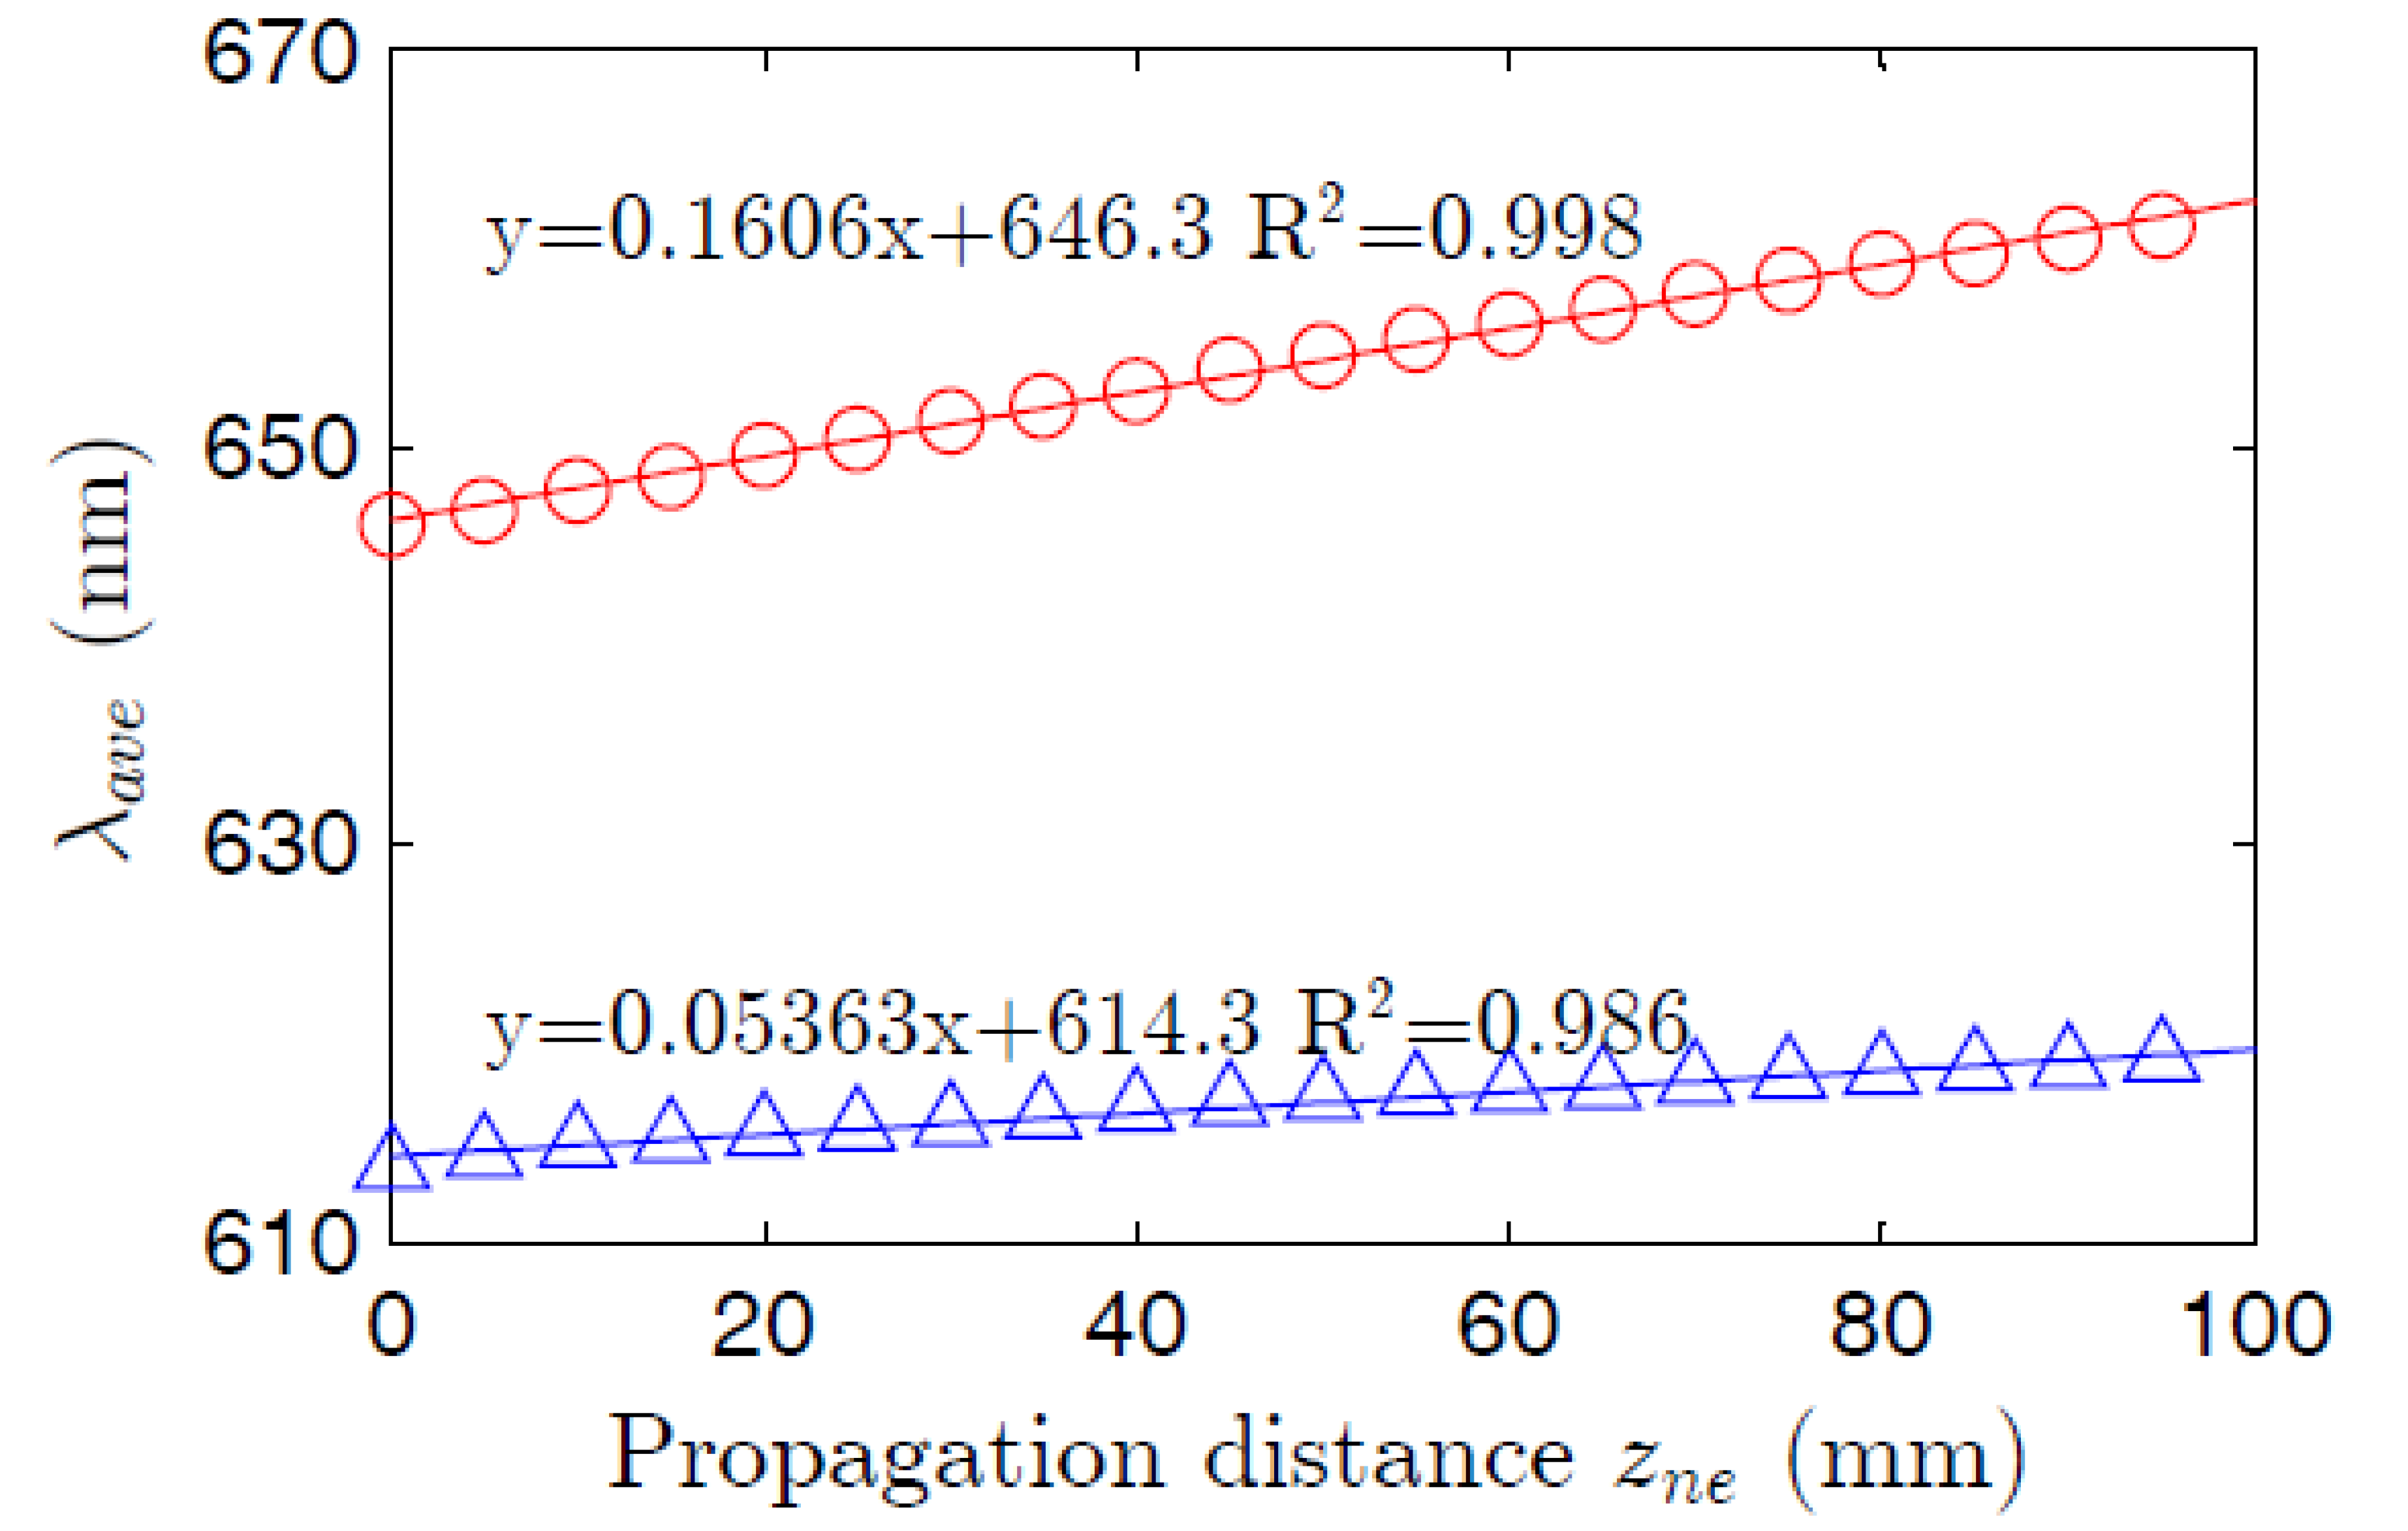
3.3. Optical Loss
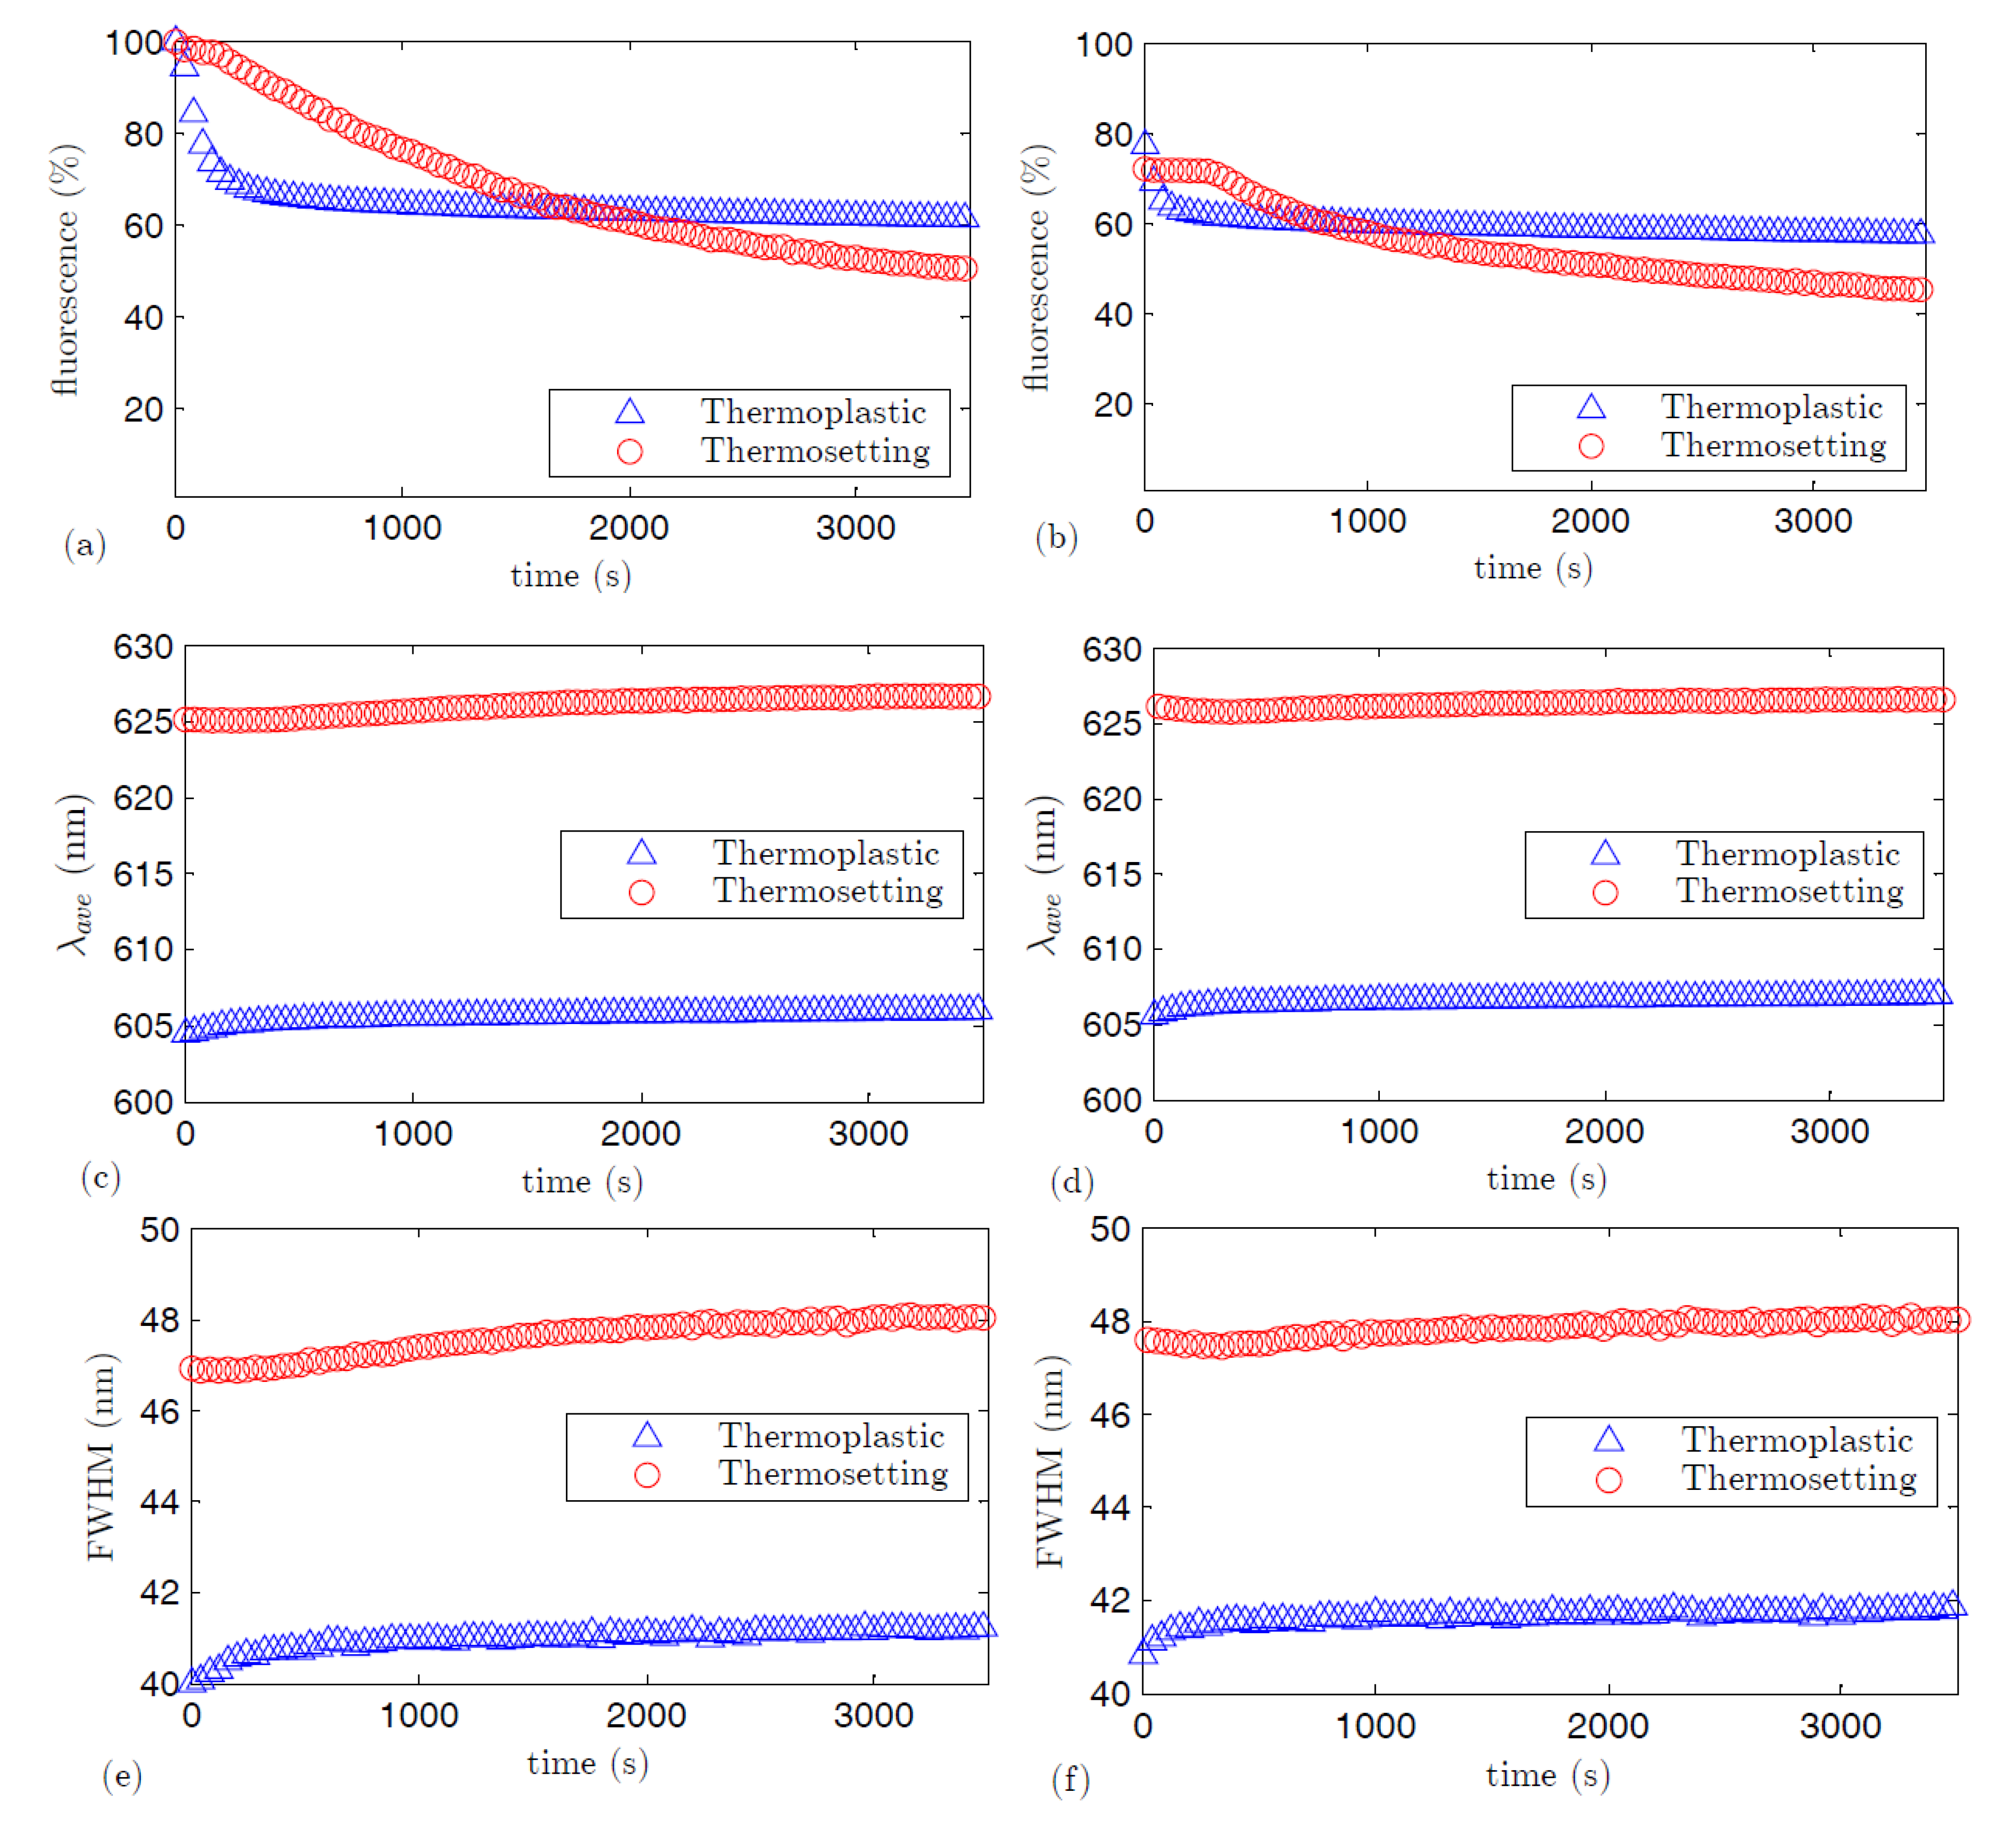
3.4. Photostability
4. Conclusions
Acknowledgments
Author Contributions
Conflicts of Interest
References
- Clark, J.; Lanzani, G. Organic photonics for communications. Nat. Photonics 2010, 7, 438–446. [Google Scholar] [CrossRef]
- Zubia, J.; Arrue, J. Plastic optical fibers: An introduction to their technological processes and applications. Opt. Fiber Technol. 2001, 7, 101–140. [Google Scholar] [CrossRef]
- Liang, H.; Zheng, Z.; Li, Z.; Xu, J.; Chen, B.; Zhao, H.; Zhang, Q.; Ming, H. Fabrication and amplified spontaneous emission of Eu(DBM)3Phen doped step-index polymer optical fiber. Opt. Quant. Electron. 2004, 36, 1313–1322. [Google Scholar] [CrossRef]
- Yu, H.C.Y.; Argyros, A.; Barton, G.; Van Eijkelenborg, M.A.; Barbe, C.; Finnie, K.; Kong, L.; Ladouceur, F.; McNiven, S. Quantum dot and silica nanoparticle doped polymer optical fibers. Opt. Express 2007, 15, 9989–9994. [Google Scholar] [CrossRef] [PubMed]
- Sebastian, S.; Ajina, C.; Vallabhan, C.P.G.; Nampoori, V.P.N.; Radhakrishnan, P.; Kailasnath, M. Fabrication and photostability of rhodamine-6G gold nanoparticle doped polymer optical fiber. Chin. Phys. Lett. 2013, 30, 118101. [Google Scholar] [CrossRef]
- Muto, S.; Ando, A.; Yoda, O.; Hanawa, T.; Ito, H. Dye laser by sheet of plastic fibers with wide tunning range. Trans. IEICE Jpn. 1987, E70, 317–318. [Google Scholar]
- Tagaya, A.; Koike, Y.; Kinoshita, T.; Nihei, E.; Yamamoto, T.; Sasaki, K. Polymer optical-fiber amplifier. Appl. Phys. Lett. 1993, 63, 883–884. [Google Scholar] [CrossRef]
- Arrue, J.; Jiménez, F.; Ayesta, I.; Illarramendi, M.A.; Zubia, J. Polymer-optical-fiber lasers and amplifiers doped with organic dyes. Polymers 2011, 3, 1162–1180. [Google Scholar] [CrossRef]
- Aiestaran, P.; Dominguez, V.; Arrue, J.; Zubia, J. A fluorescent linear optical fiber position sensor. Opt. Mat. 2009, 31, 1101–1104. [Google Scholar] [CrossRef]
- Peng, G.D.; Xiong, Z.; Chu, P.L. Fluorescence decay and recovery in organic dye-doped polymer optical fibers. J. Lightwave Technol. 1998, 16, 2365–2369. [Google Scholar] [CrossRef]
- Maier, G.V.; Kopylova, T.N.; Svetlichnyi, V.A.; Podgaetskii, V.M.; Dolotov, S.M.; Ponomareva, O.V.; Monich, A.E.; Monich, E.A. Active polymer fibres doped with organic dyes: Generation and amplification of coherent radiation. Quantum Electron. 2007, 37, 53–59. [Google Scholar] [CrossRef]
- Redding, B.; Ahmadi, P.; Mokan, V.; Seifert, M.; Choma, M.A.; Cao, H. Low-spatial-coherence high-radiance broadband fiber source for speckle free imaging. Opt. Lett. 2015, 40, 4607–4610. [Google Scholar] [CrossRef] [PubMed]
- Digonnet, M.J.F. Rare Earth Doped Fiber Lasers and Amplifiers; Marcel Dekker, Inc.: New York, NY, USA, 1993. [Google Scholar]
- Calzado, E.M.; Boj, P.G.; Díaz-García, M.A. Amplified spontaneous emission properties of semiconducting organic materials. Int. J. Mol. Sci. 2010, 11, 2546–2565. [Google Scholar] [CrossRef] [PubMed]
- Tam, H.Y.; Pun, C.-F.J.; Zhou, G.; Cheng, X.; Tse, M.L.V. Special structured polymer fibers for sensing applications. Opt. Fiber Technol. 2010, 16, 357–366. [Google Scholar] [CrossRef]
- Bonefacino, J.; Cheng, X.; Vincent Tse, M.-L.; Tam, H.-Y. Recent progress in polymer optical fiber light sources and fiber bragg gratings. IEEE J. Sel. Top. Quantum Electron. 2017, 23, 5600911. [Google Scholar] [CrossRef]
- Cowie, J.M.G. Polymers: Chemistry and Physics of Modern Materials; Intertext Books: Aylesbury, UK, 1973. [Google Scholar]
- Illarramendi, M.A.; Arrue, J.; Ayesta, I.; Jiménez, F.; Zubia, J.; Bikandi, I.; Tagaya, A.; Koike, Y. Amplified spontaneous emission in graded-index polymer optical fibers: Theory and experiment. Opt. Express 2013, 21, 24254–24266. [Google Scholar] [CrossRef] [PubMed]
- Shaklee, K.L.; Leheny, R.F. Direct determination of optical gain in semiconductor crystals. Appl. Phys. Lett. 1971, 18, 475–477. [Google Scholar] [CrossRef]
- Kruhlak, R.; Kuzyk, M. Side-illumination fluorescence spectroscopy. I. Principles. J. Opt. Soc. Am. B 1999, 16, 1749–1755. [Google Scholar] [CrossRef]
- Kruhlak, R.; Kuzyk, M. Side-illumination fluorescence spectroscopy. II. Applications to squaraine-dye-doped polymer optical fibers. J. Opt. Soc. Am. B 1999, 16, 1756–1767. [Google Scholar] [CrossRef]
- Kuriki, K.; Kobayashi, T.; Imai, N.; Tamura, T.; Nishihara, S.; Nishizawa, Y.; Tagaya, A.; Koike, Y. High-efficiency organic dye-doped polymer optical fiber lasers. Appl. Phys. Lett. 2000, 77, 331–333. [Google Scholar] [CrossRef]
- Koike, Y.; Ishigure, I.; Nihei, E. High-bandwidth graded-index polymer optical fiber. IEEE J. Lightwave Technol. 1995, 13, 1475–1489. [Google Scholar] [CrossRef]
- Tagaya, A.; Kobayashi, T.; Nakatsuka, S.; Nihei, E.; Sasaki, K.; Koike, Y. High Gain and high power organic dye-doped polymer optical fiber amplifiers: Absorption and Emission Cross Sections and Gain Characteristics. Jpn. J. Appl. Phys. 1997, 36, 204–207. [Google Scholar] [CrossRef]
- Yamamoto, T.; Fujii, K.; Tagaya, A.; Nihei, E.; Koike, Y.; Sasaki, K. High-power optical source using dye-doped polymer optical fiber. J. Nonlinear Opt. Phys. Mater. 1996, 5, 73–88. [Google Scholar] [CrossRef]
- Palchik, O.; Jaber, N.; Amram, I.; Roitfeld, A.; Vaistikh, L. UV Curing process applied for POFs and their doping using fluorescent materials. In Proceedings of the 24th International Conference on Plastic Optical Fibers, Nuremberg, Germany, 22–24 September 2015; pp. 26–29.
- Palchik, O.; Palchik, V. Thermoset and Thermoplastic Fibers and Preparation Thereof by UV Curing. Patent WO 2012156896A1, 22 November 2012. [Google Scholar]
- De la Rosa-Cruz, E.; Dirk, C.W.; Rodríguez, A.; Castaño, V.M. Characterization of fluorescence induced by side illumination of rhodamine B doped plastic optical fibers. Fiber Integr. Opt. 2001, 20, 457–464. [Google Scholar] [CrossRef]
- Arrue, J.; Illarramendi, M.A.; Ayesta, I.; Jiménez, F.; Zubia, J.; Tagaya, A.; Koike, Y. Laser-like performance of side-pumped dye-doped polymer optical fibers. IEEE Photonics J. 2015, 7, 1–11. [Google Scholar] [CrossRef]
- Parola, I.; Illarramendi, M.A.; Arrue, J.; Ayesta, I.; Jiménez, F.; Zubia, J.; Tagaya, A.; Koike, Y. Characterization of the optical gain in doped polymer optical fibers. J. Lumin. 2016, 177, 1–8. [Google Scholar] [CrossRef]
- Cyprych, K.; Kopczynska, Z.; Kajzar, F.; Rau, I.; Mysliewic, J. Tunable wavelength light emission and amplification in rhodamine 6G aggregates. Adv. Device Mater. 2015, 1, 69–73. [Google Scholar] [CrossRef]
- Costela, A.; García-Moreno, I.; Sastre, R. Polymeric solid-state dye lasers: Recent developments. Phys. Chem. Chem. Phys. 2003, 5, 4745–4763. [Google Scholar] [CrossRef] [Green Version]
- Xia, R.; Heliotis, G.; Hou, Y.; Bradley, D.D.C. Fluorene-based conjugated polymer optical gain media. Org. Electron. 2003, 4, 165–177. [Google Scholar] [CrossRef]
- Lu, Y.; Penzkofer, A. Absorption behaviour of methanolic rhodamine 6G solutions at high concentration. Chem. Phys. 1986, 107, 175–184. [Google Scholar] [CrossRef]
- Penzkofer, A.; Leupacher, W. Fluorescence behaviour of highly concentrated rhodamine 6G solutions. J. Lumin. 1987, 37, 61–71. [Google Scholar] [CrossRef] [Green Version]
- Persano, L.; Camposeo, A.; Del Carro, P.; Fasano, V.; Moffa, M.; Manco, R.; D’Agostino, S.; Pisignano, D. Distrubuted feedback inprinted electrospun fiber lasers. Adv. Mater. 2014, 26, 6542–6547. [Google Scholar] [CrossRef] [PubMed]
- Illarramendi, M.A.; Zubia, J.; Bazzana, L.; Durana, G.; Aldabaldetreku, G.; Sarasua, J.-R. Spectroscopic characterization of plastic optical fibers doped with fluorine oligomers. J. Lightwave Technol. 2009, 27, 3220–3226. [Google Scholar] [CrossRef]
- Goudket, H.; Nhung, T.H.; Ea-Kim, B.; Roger, G.; Canva, M. Importance of dye host on absorption, propagation losses, and amplified spontaneous emission for dye-doped polymer thin films. Appl. Opt. 2006, 10, 7736–7741. [Google Scholar] [CrossRef]
- Flipsen, T.A.C.; Steendam, R.; Pennings, A.J.; Hadziioannou, G. A novel thermoset polymer optical fiber. Adv. Mater. 1996, 8, 45–48. [Google Scholar] [CrossRef]
- Faloss, M.; Canva, M.; Georges, P.; Brun, A.; Chaput, F.; Boilot, J.P. Toward millions of laser pulses with pyrromethene-and perylene-doped xerogels. Appl. Opt. 1997, 36, 6760–6763. [Google Scholar] [CrossRef] [PubMed]
- Jaison, P.; Vallabhan, C.P.G.; Radhakrishnan, P.; Nampoori, V.P.N. ASE and photostability measurements in dye doped step index, graded index and hollow polymer optical fiber. Opt. Laser Technol. 2014, 63, 34–38. [Google Scholar]
- Ayesta, I.; Illarramendi, M.A.; Arrue, J.; Jiménez, F.; Zubia, J.; Bikandi, I.; Ugartemendia, J.M.; Sarasua, J.-R. Luminescence study of polymer optical fibers doped with conjugated polymers. J. Lightwave Technol. 2012, 30, 3367–3375. [Google Scholar] [CrossRef]
- Hung, S.-T.; Bhuyan, A.; Schademan, K.; Steverlynck, J.; McCluskey, M.D.; Koeckelberghs, G.; Clays, K.; Kuzyk, M.G. Spectroscopic studies of the mechanism of reversible photodegradation of 1-substituted aminoanthraquinone-doped polymers. J. Chem. Phys. 2016, 144, 1–19. [Google Scholar] [CrossRef] [PubMed]


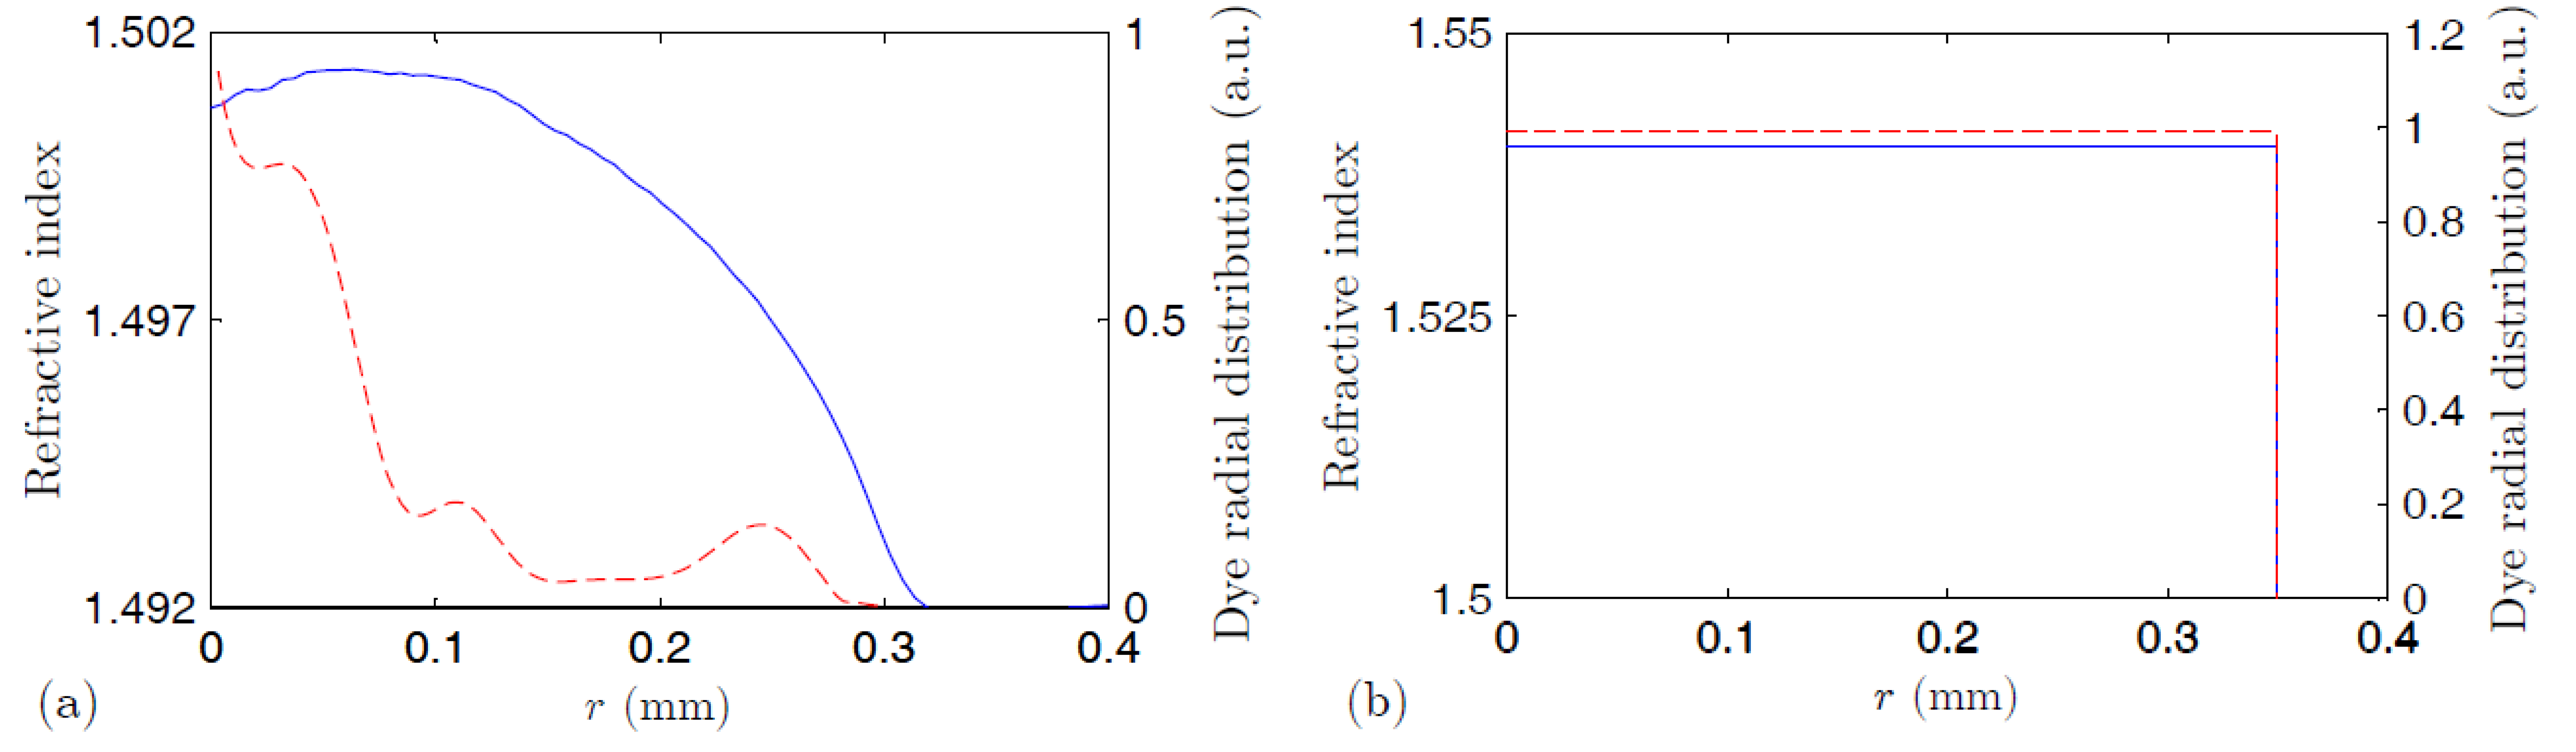
| POF | Type of fiber | Refractive index | Core diameter | Cladding thickness | Dopant concentration | Overlapping factor |
|---|---|---|---|---|---|---|
| Thermoplastic | GI | 1.501 * | 0.6 mm | 0.4 mm | 16 ppm ** | 1.4 |
| Thermosetting | SI | 1.54 | 0.7 mm | 0.05 mm | 300 ppm | 1 |
| POF | Fluorescence | ASE | Threshold energy | ||
|---|---|---|---|---|---|
| λpeak | FWHM | λpeak | FWHM | ||
| Thermoplastic | 586 nm | 40 nm | 579 nm | 18 nm | 0.14 ± 0.02 mJ |
| Thermosetting | 616 nm | 47 nm | 612 nm | 18 nm | 0.63 ± 0.02 mJ |
| POF | a | τ1 (s) | b | τ2 (s) | R2 |
|---|---|---|---|---|---|
| Thermoplastic | 37.45 | 113 | 65.81 | 47710 | 0.993 |
| Thermosetting | 61.51 | 1567 | 43.67 | 163400 | 0.999 |
© 2017 by the authors. Licensee MDPI, Basel, Switzerland. This article is an open access article distributed under the terms and conditions of the Creative Commons Attribution (CC BY) license ( http://creativecommons.org/licenses/by/4.0/).
Share and Cite
Ayesta, I.; Illarramendi, M.A.; Arrue, J.; Parola, I.; Jiménez, F.; Zubia, J.; Tagaya, A.; Koike, Y. Optical Characterization of Doped Thermoplastic and Thermosetting Polymer-Optical-Fibers. Polymers 2017, 9, 90. https://doi.org/10.3390/polym9030090
Ayesta I, Illarramendi MA, Arrue J, Parola I, Jiménez F, Zubia J, Tagaya A, Koike Y. Optical Characterization of Doped Thermoplastic and Thermosetting Polymer-Optical-Fibers. Polymers. 2017; 9(3):90. https://doi.org/10.3390/polym9030090
Chicago/Turabian StyleAyesta, Igor, María Asunción Illarramendi, Jon Arrue, Itxaso Parola, Felipe Jiménez, Joseba Zubia, Akihiro Tagaya, and Yasuhiro Koike. 2017. "Optical Characterization of Doped Thermoplastic and Thermosetting Polymer-Optical-Fibers" Polymers 9, no. 3: 90. https://doi.org/10.3390/polym9030090