
Crystal Structure Evolution of UHMWPE/HDPE Blend Fibers Prepared by Melt Spinning


Abstract
:1. Introduction
2. Materials and Methods
2.1. Materials
2.2. Preparation of UHMWPE/HDPE Blend Fibers
2.3. Analytical Methods
3. Results and Discussion
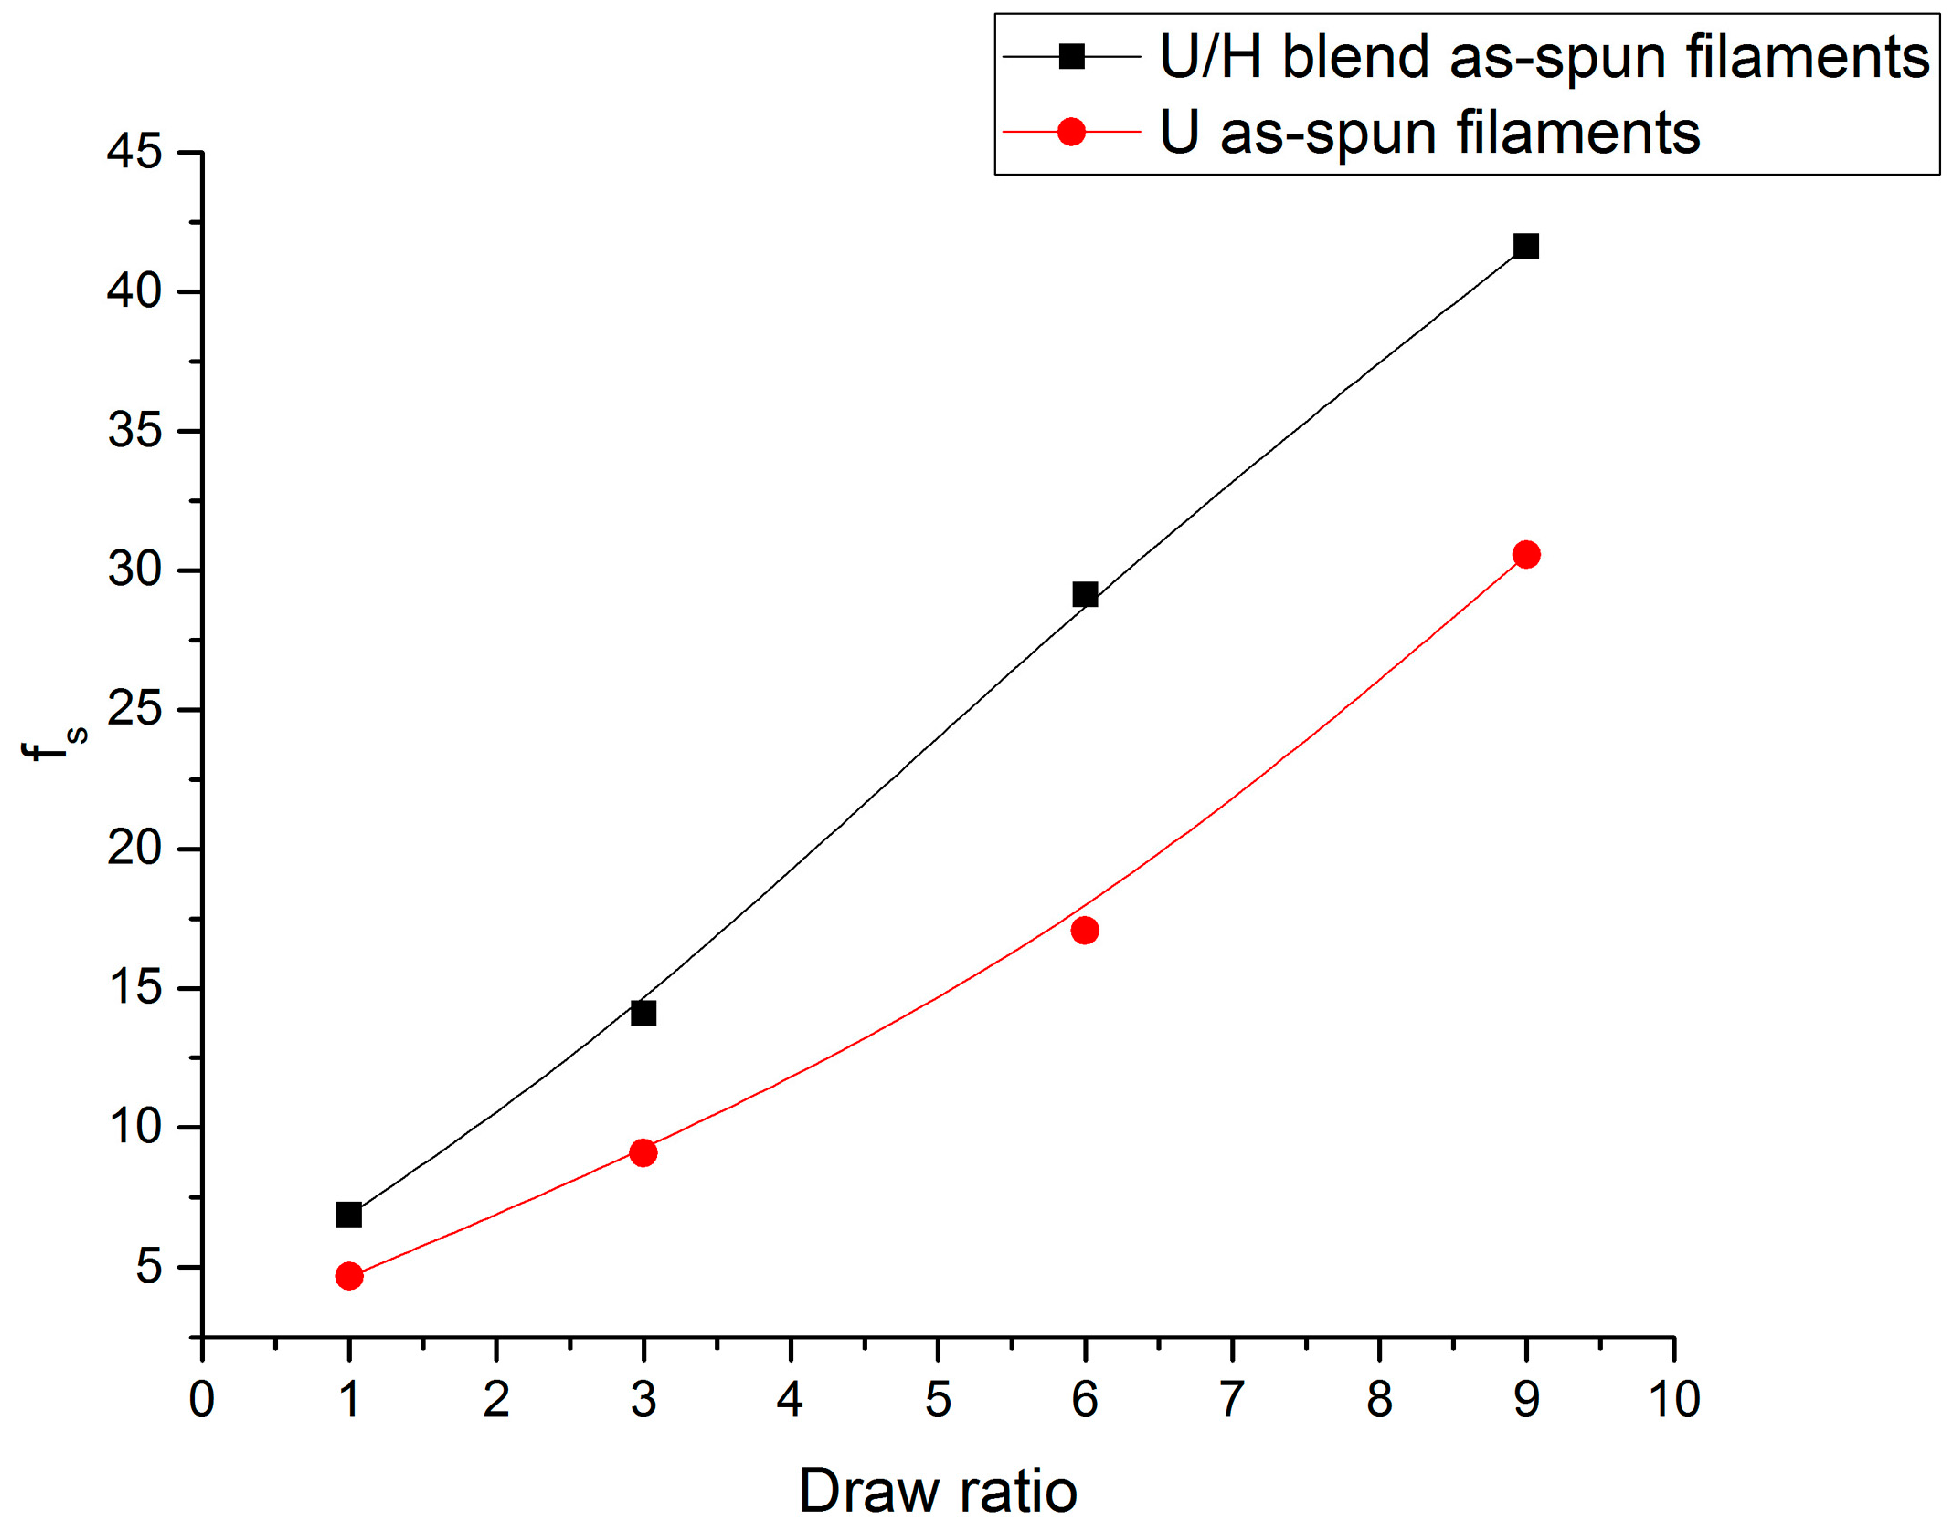
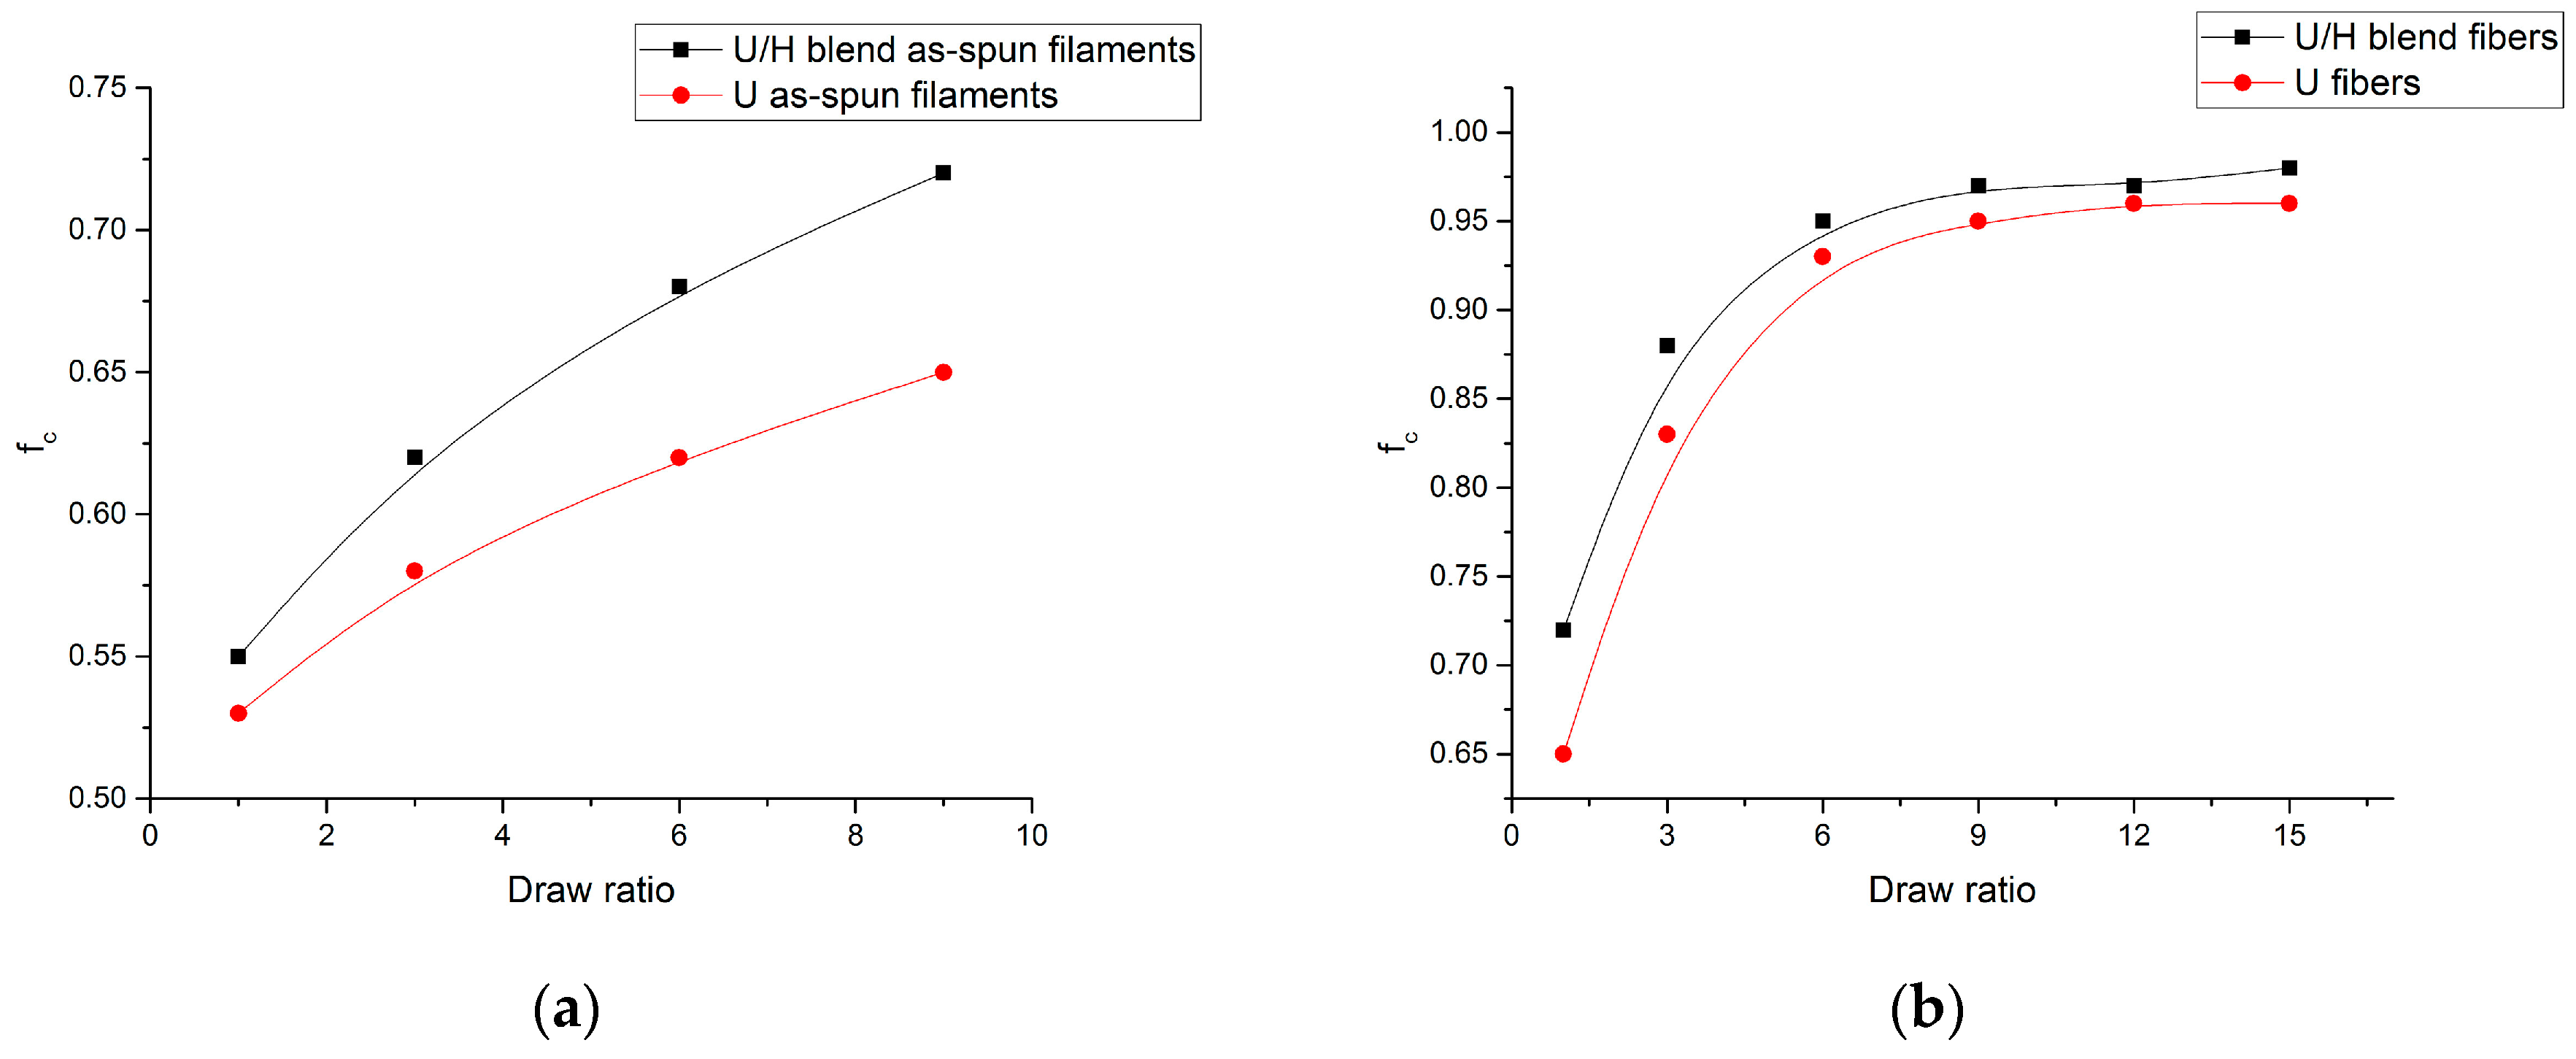
3.1. Sound Velocity Orientation Studies
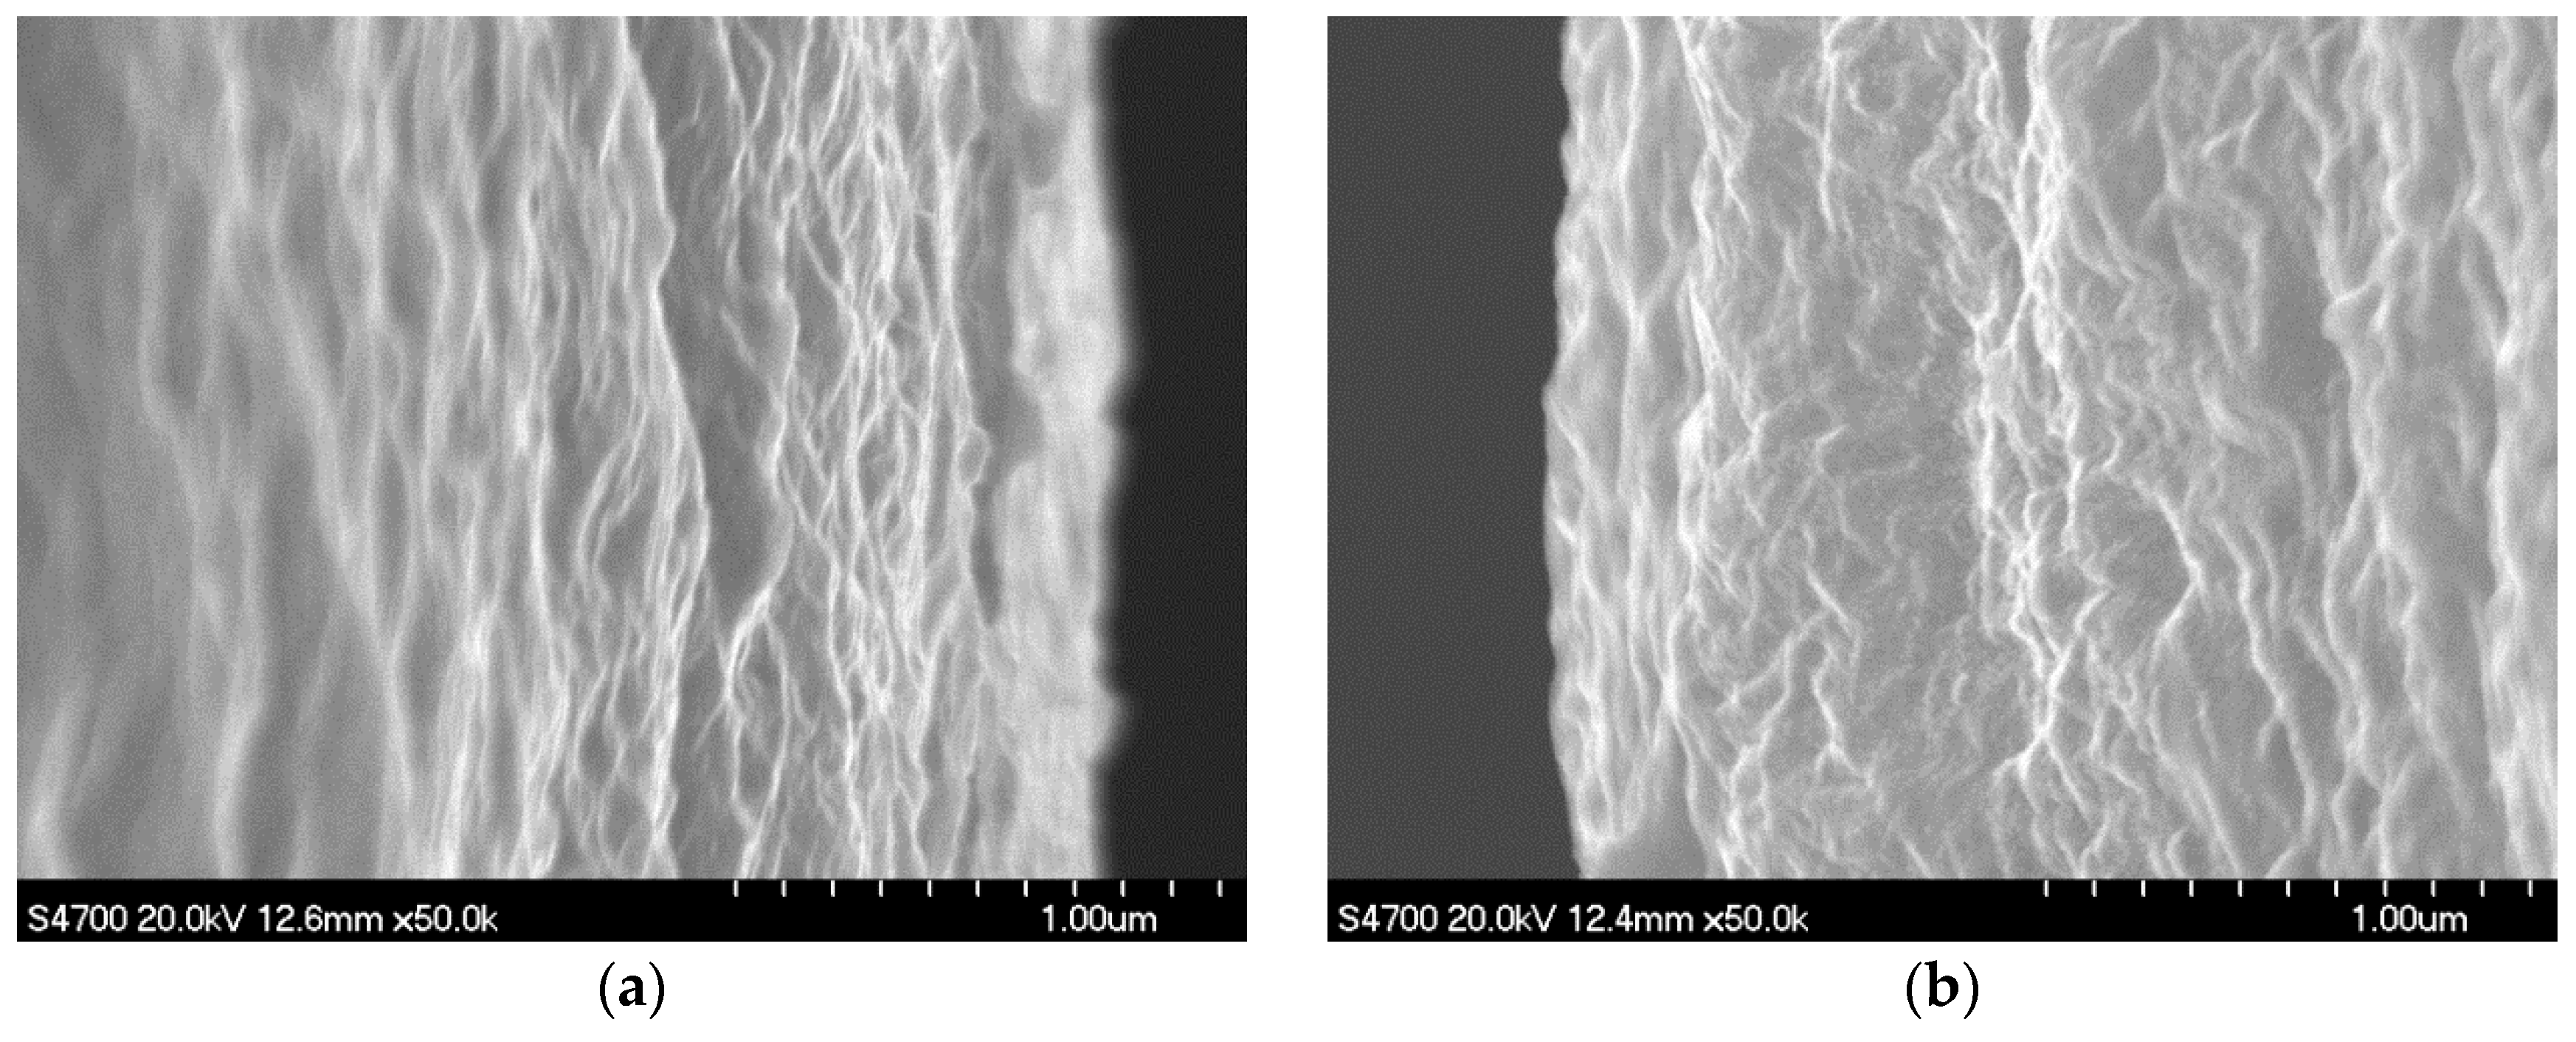
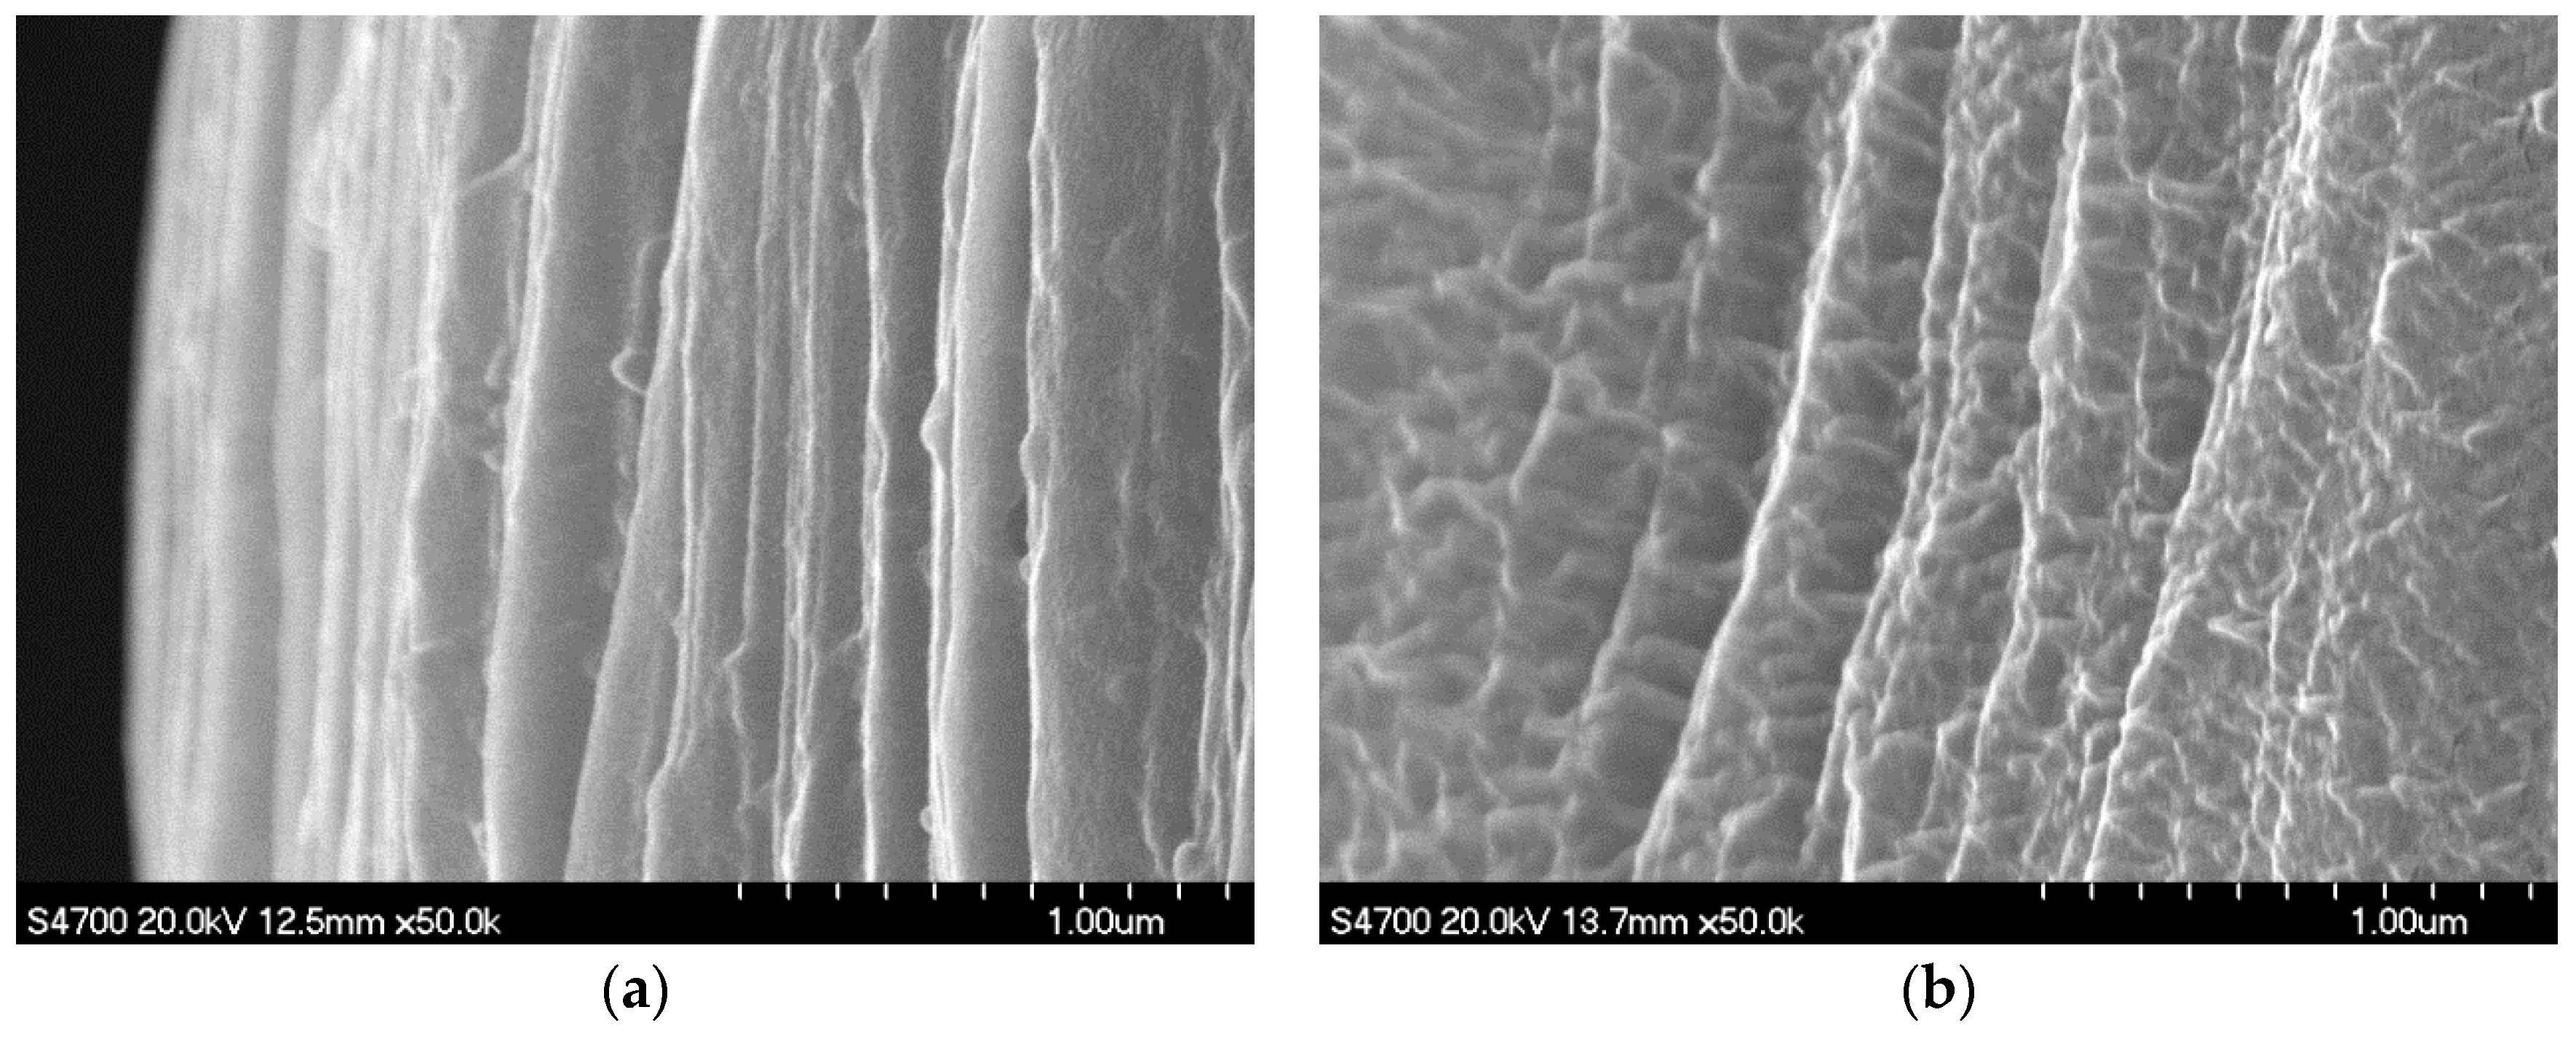
3.2. SEM Studies
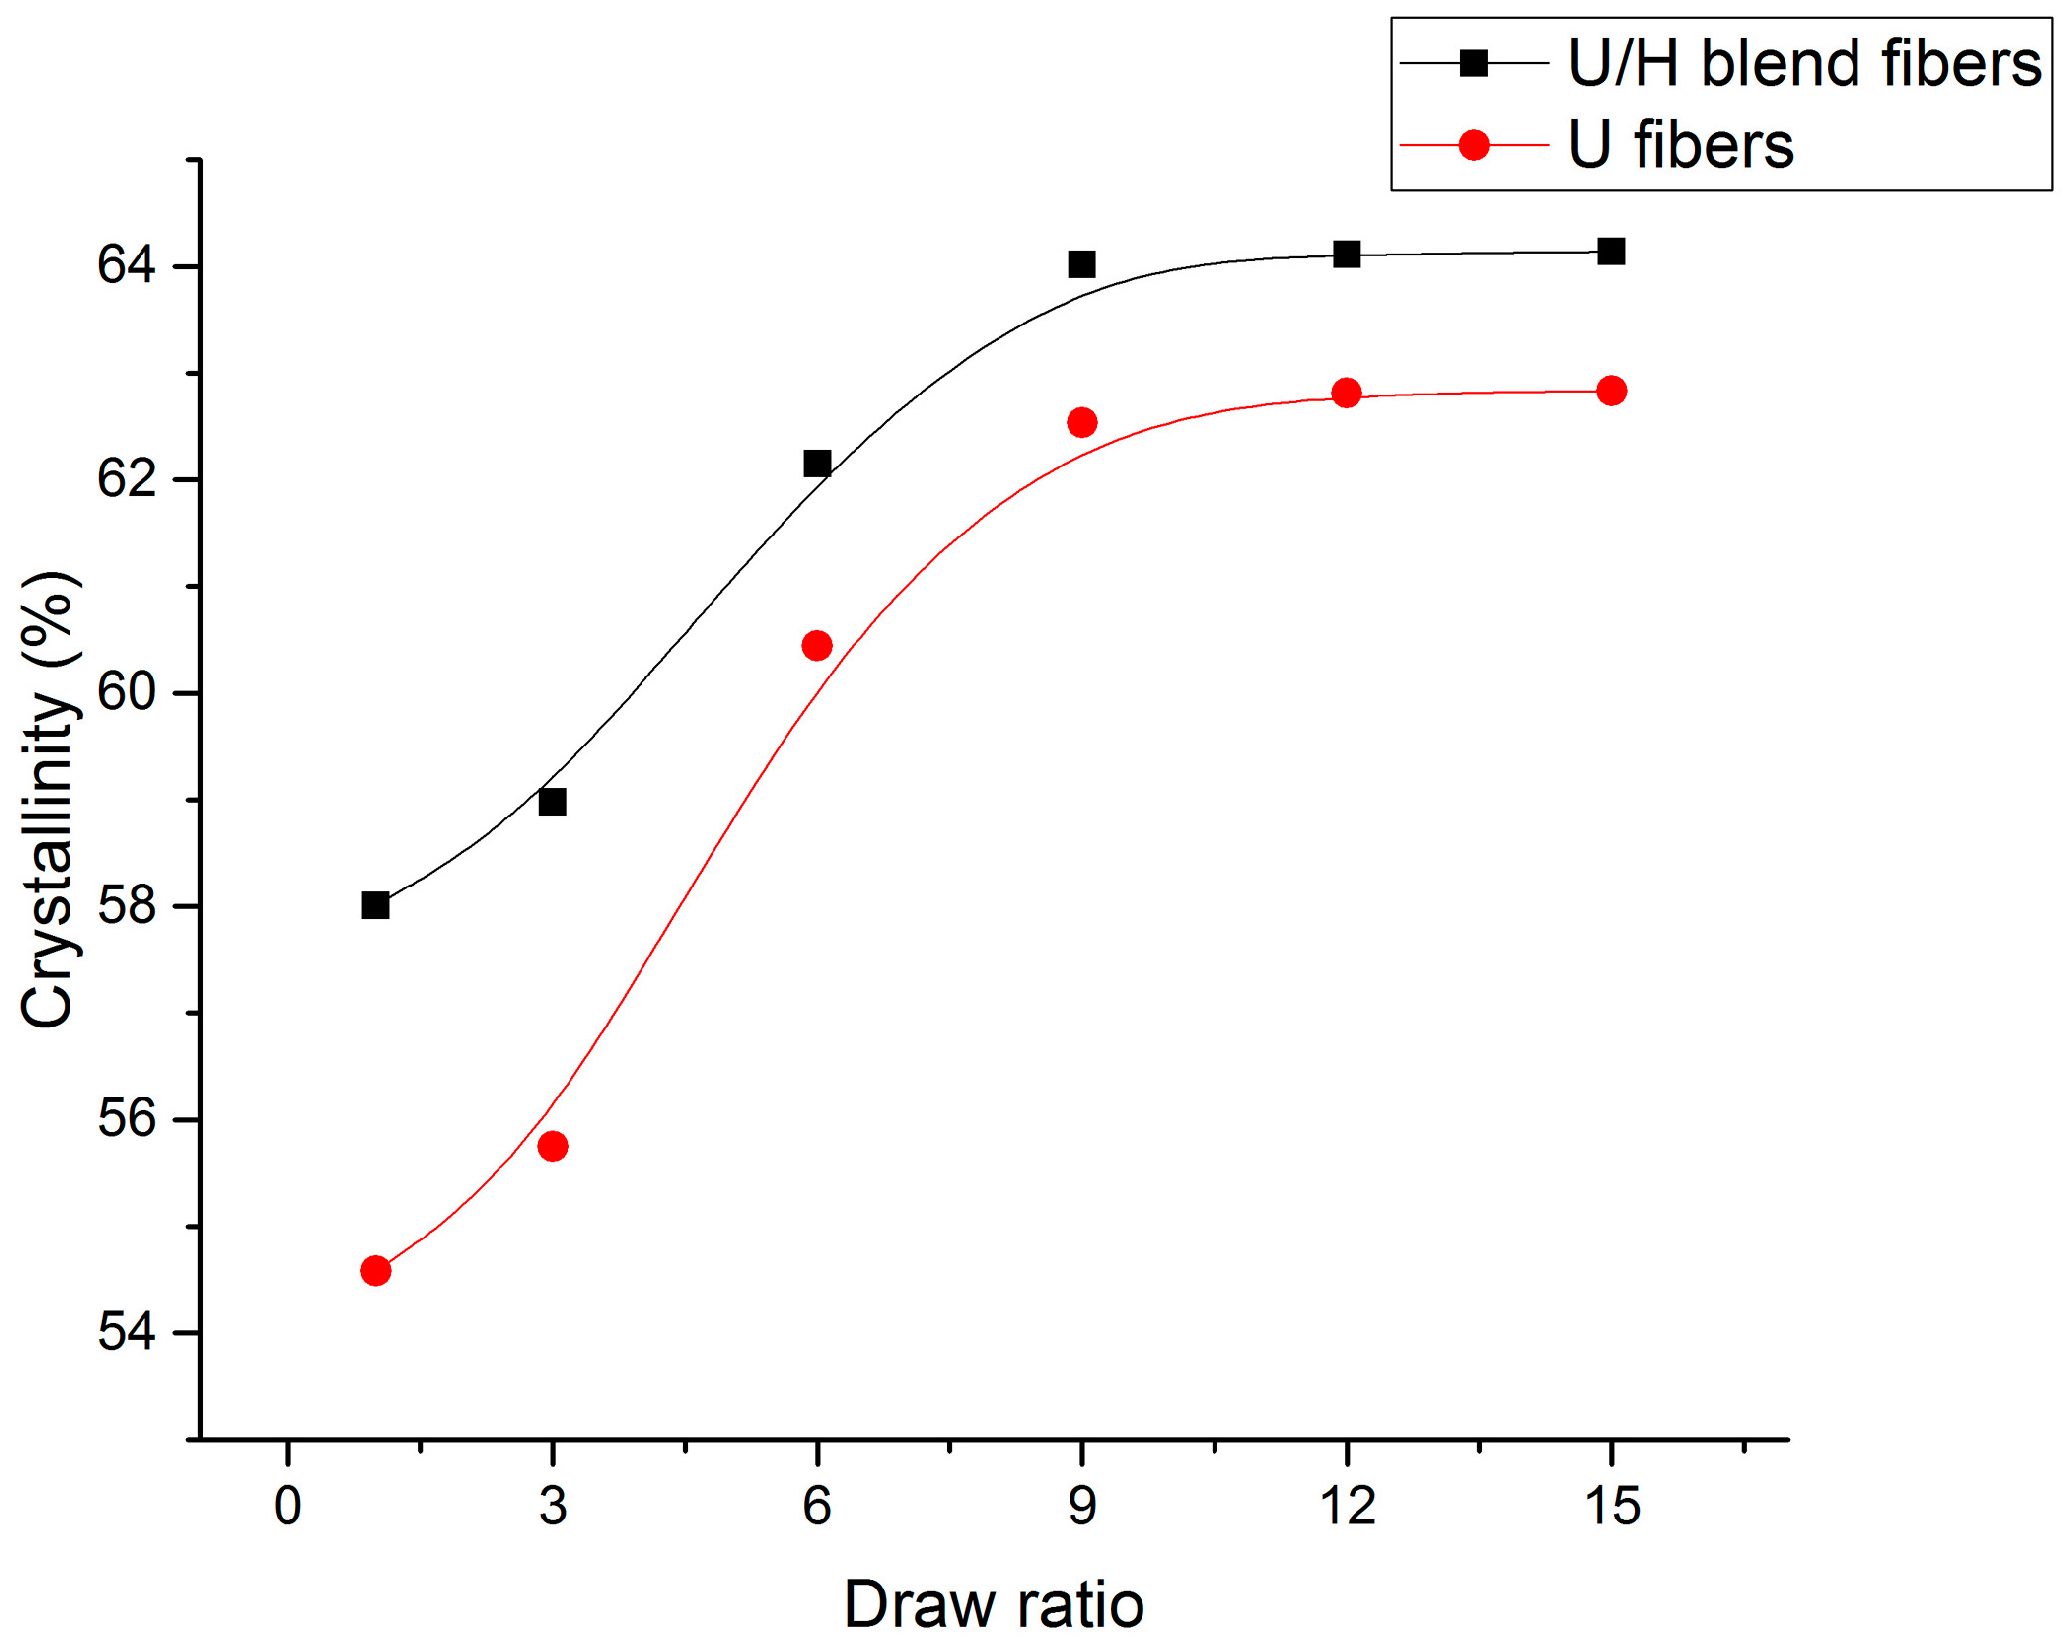
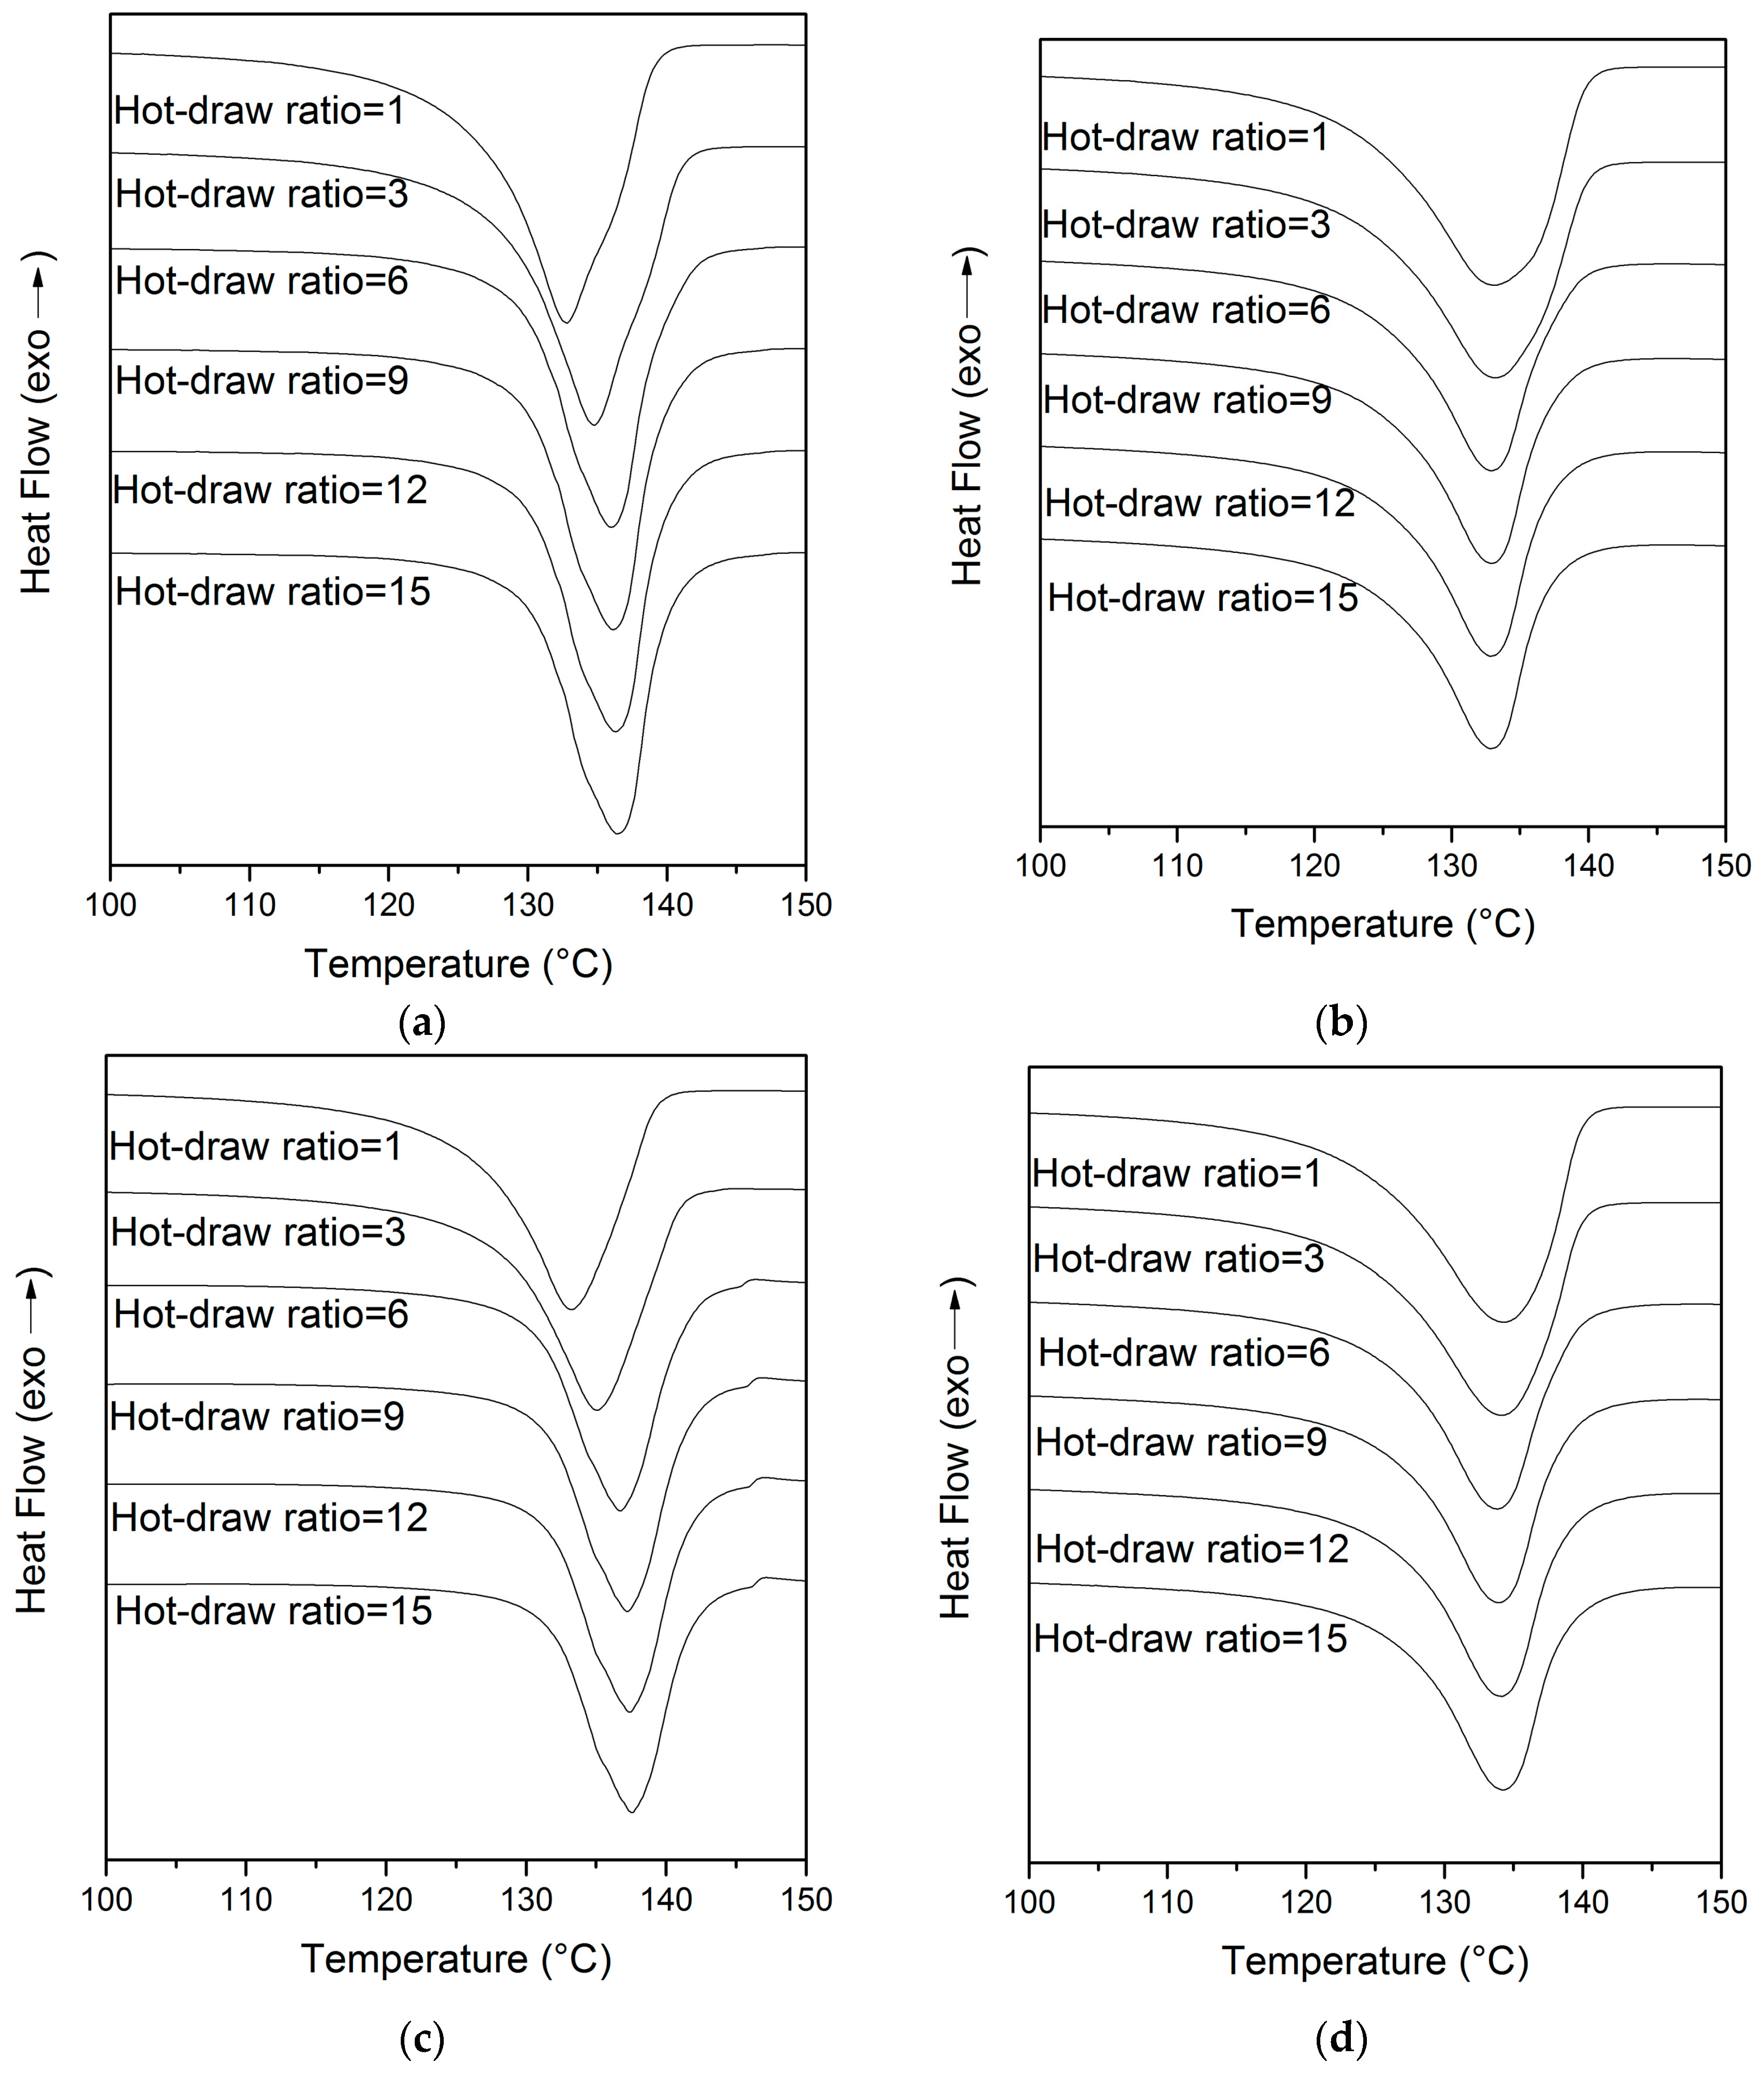
3.3. DSC Analyses
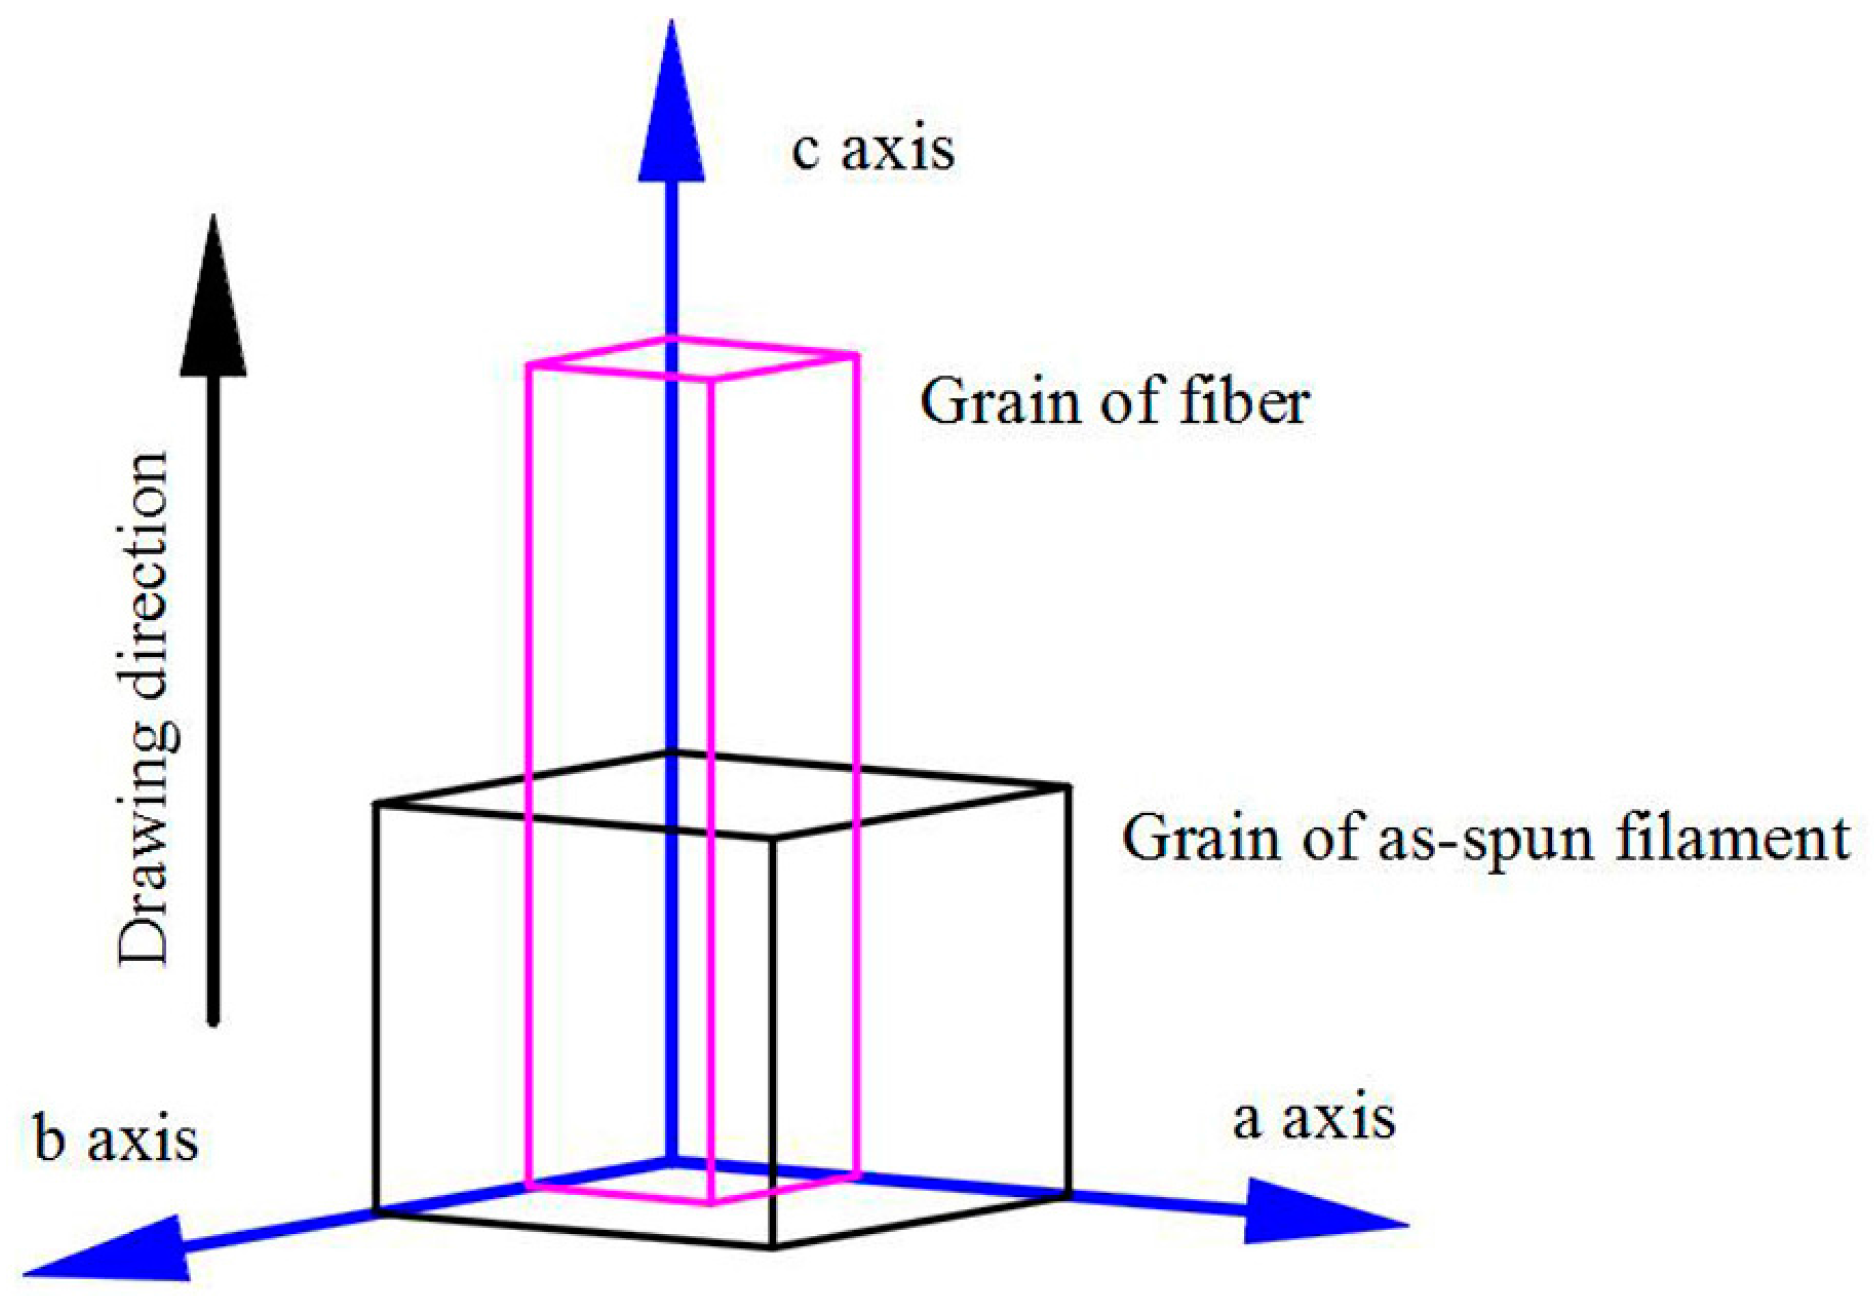
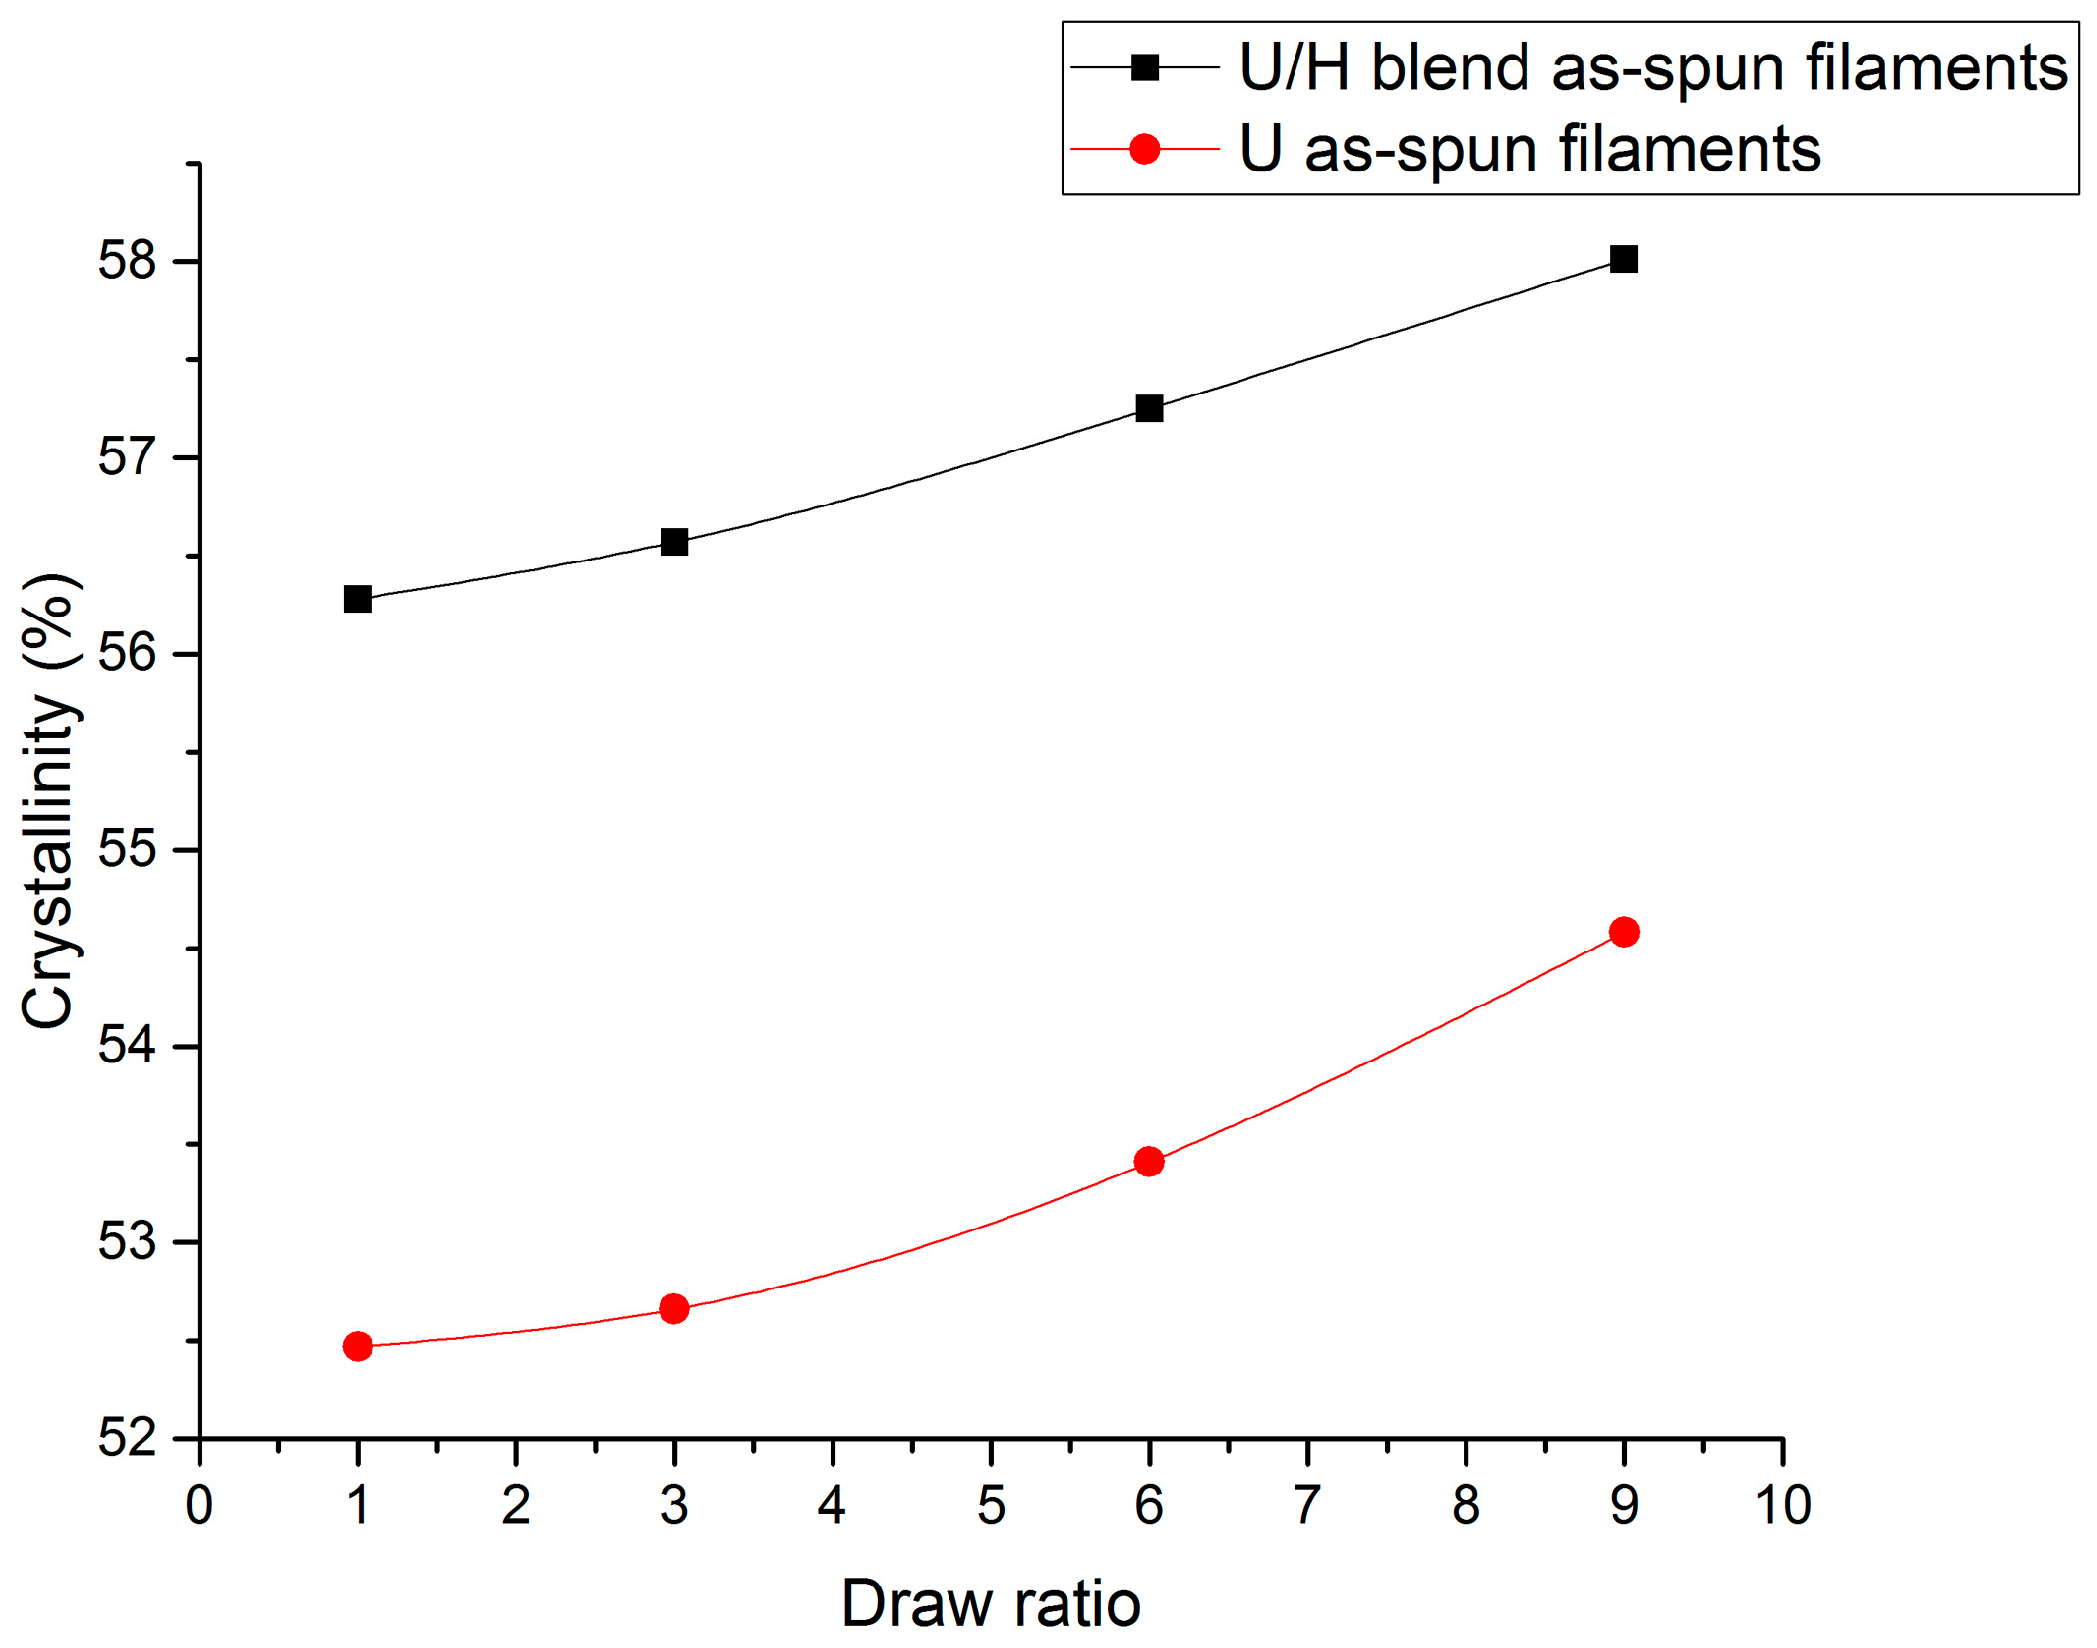
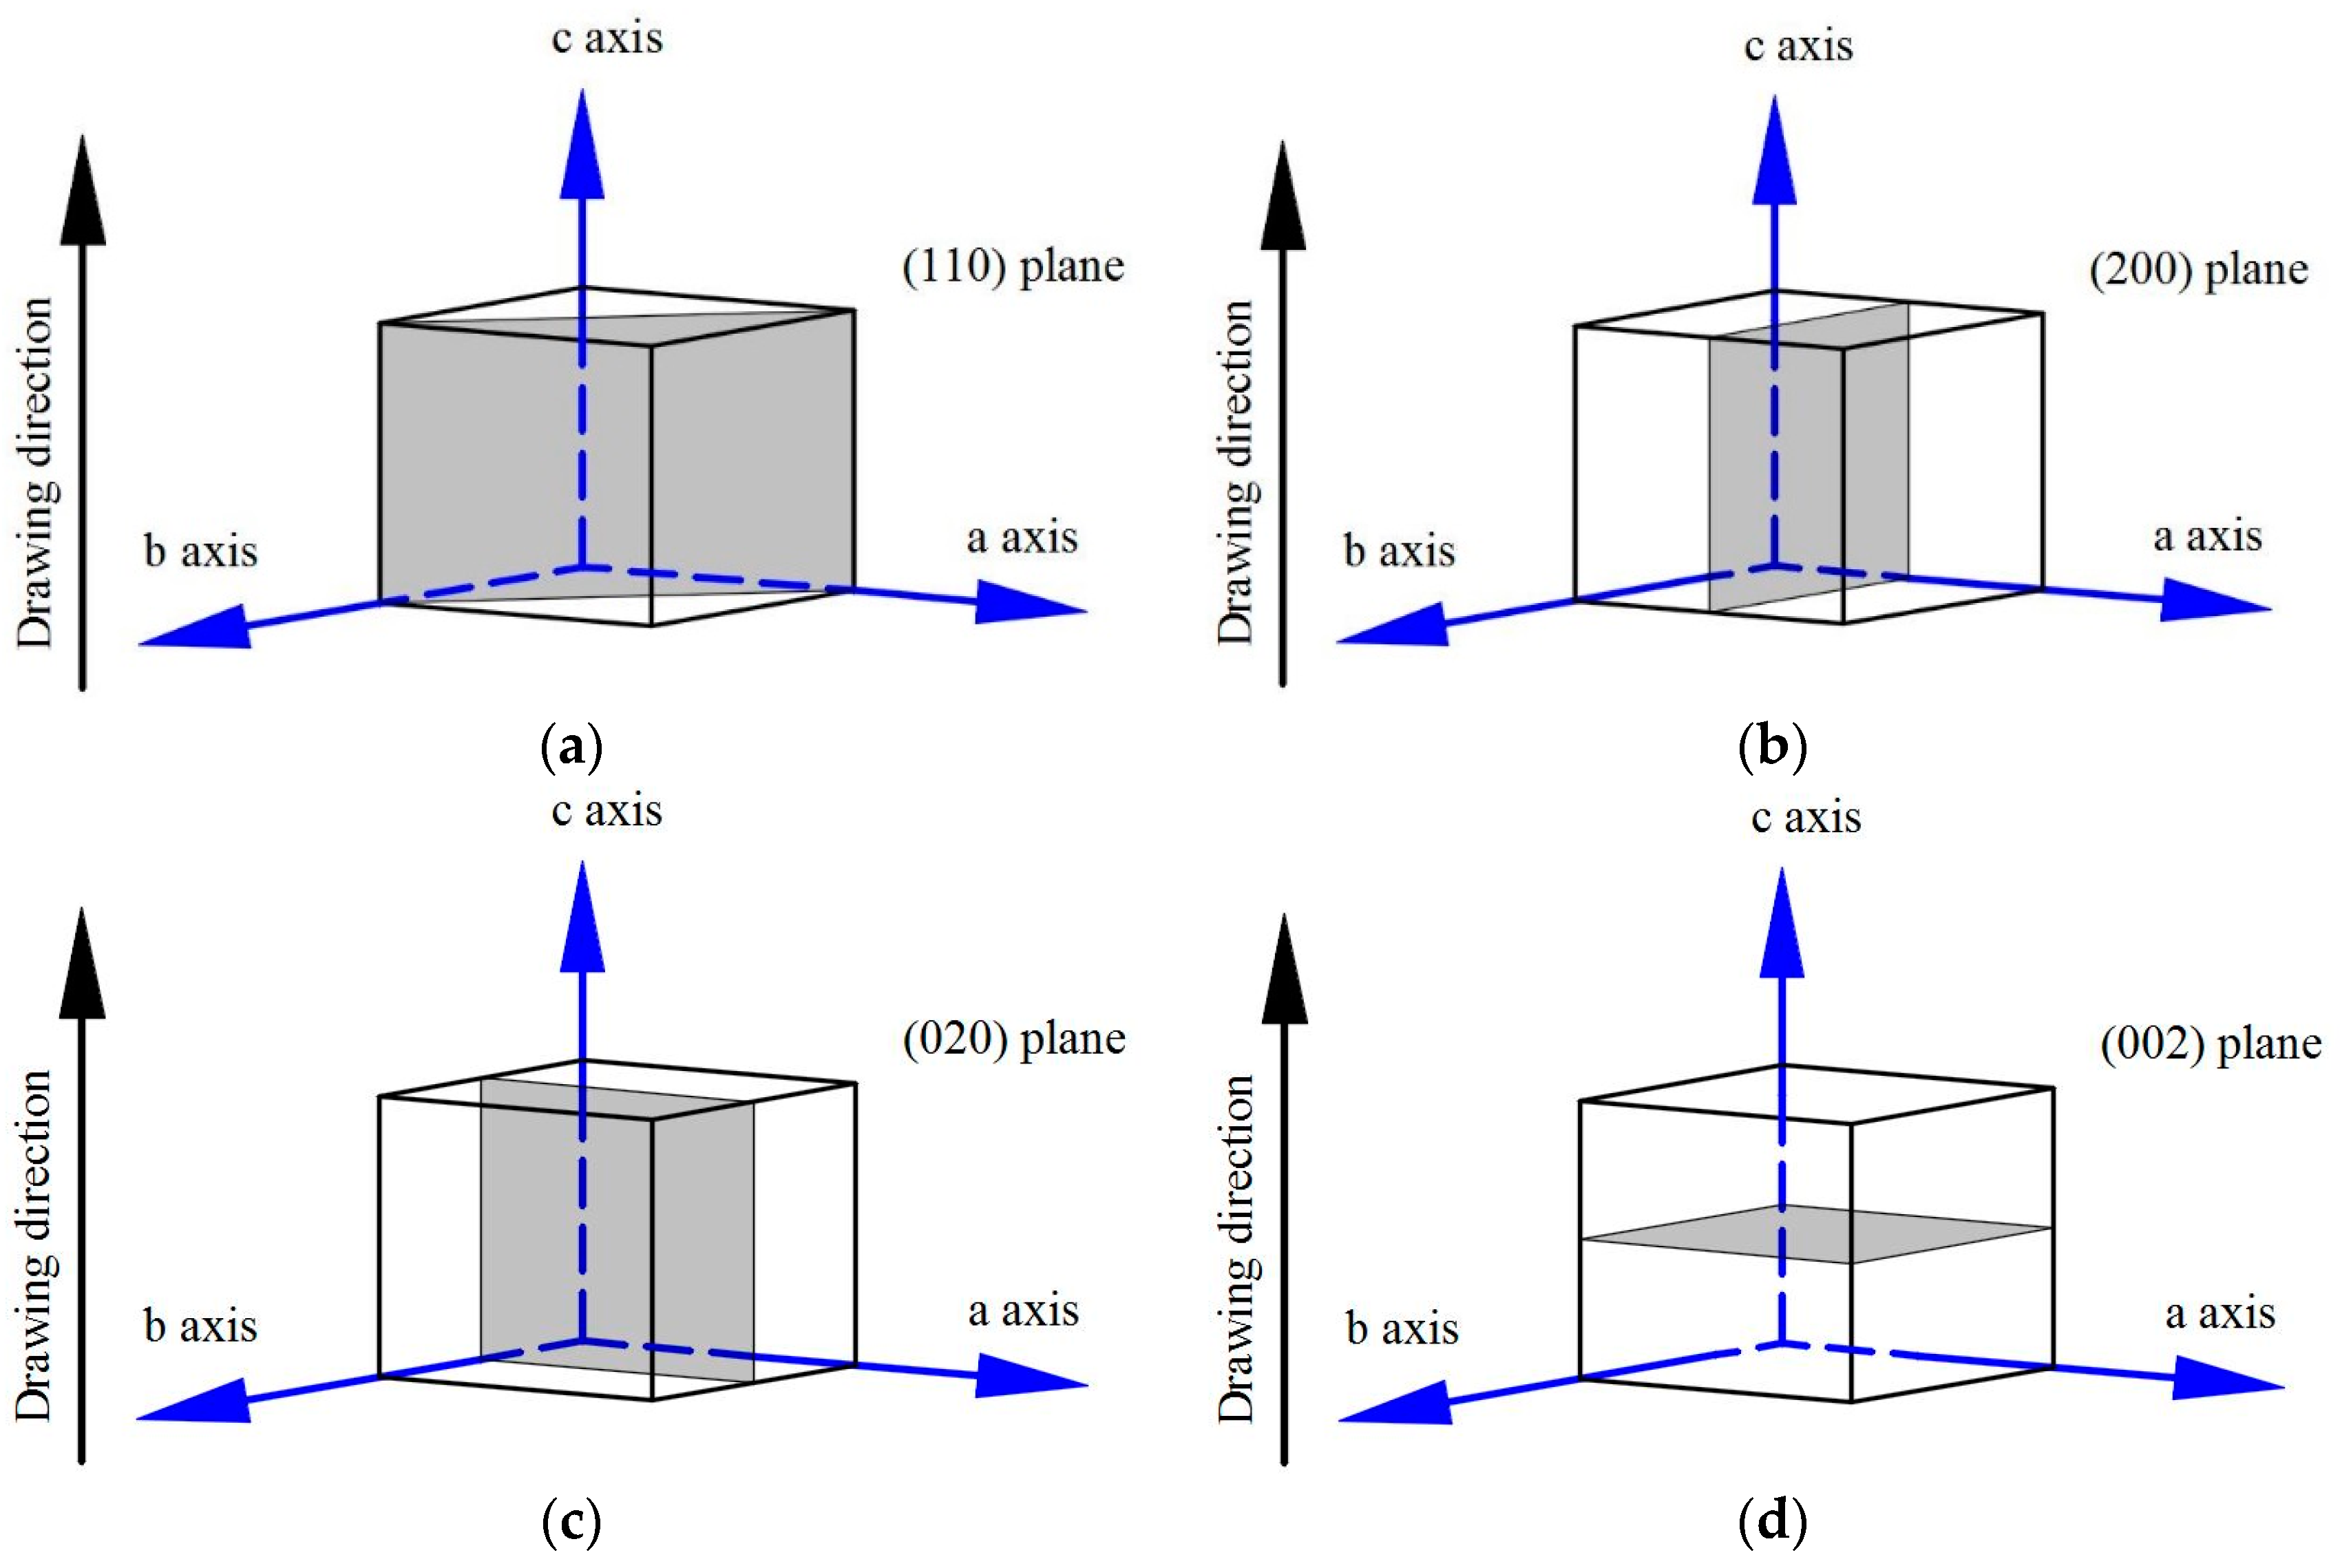
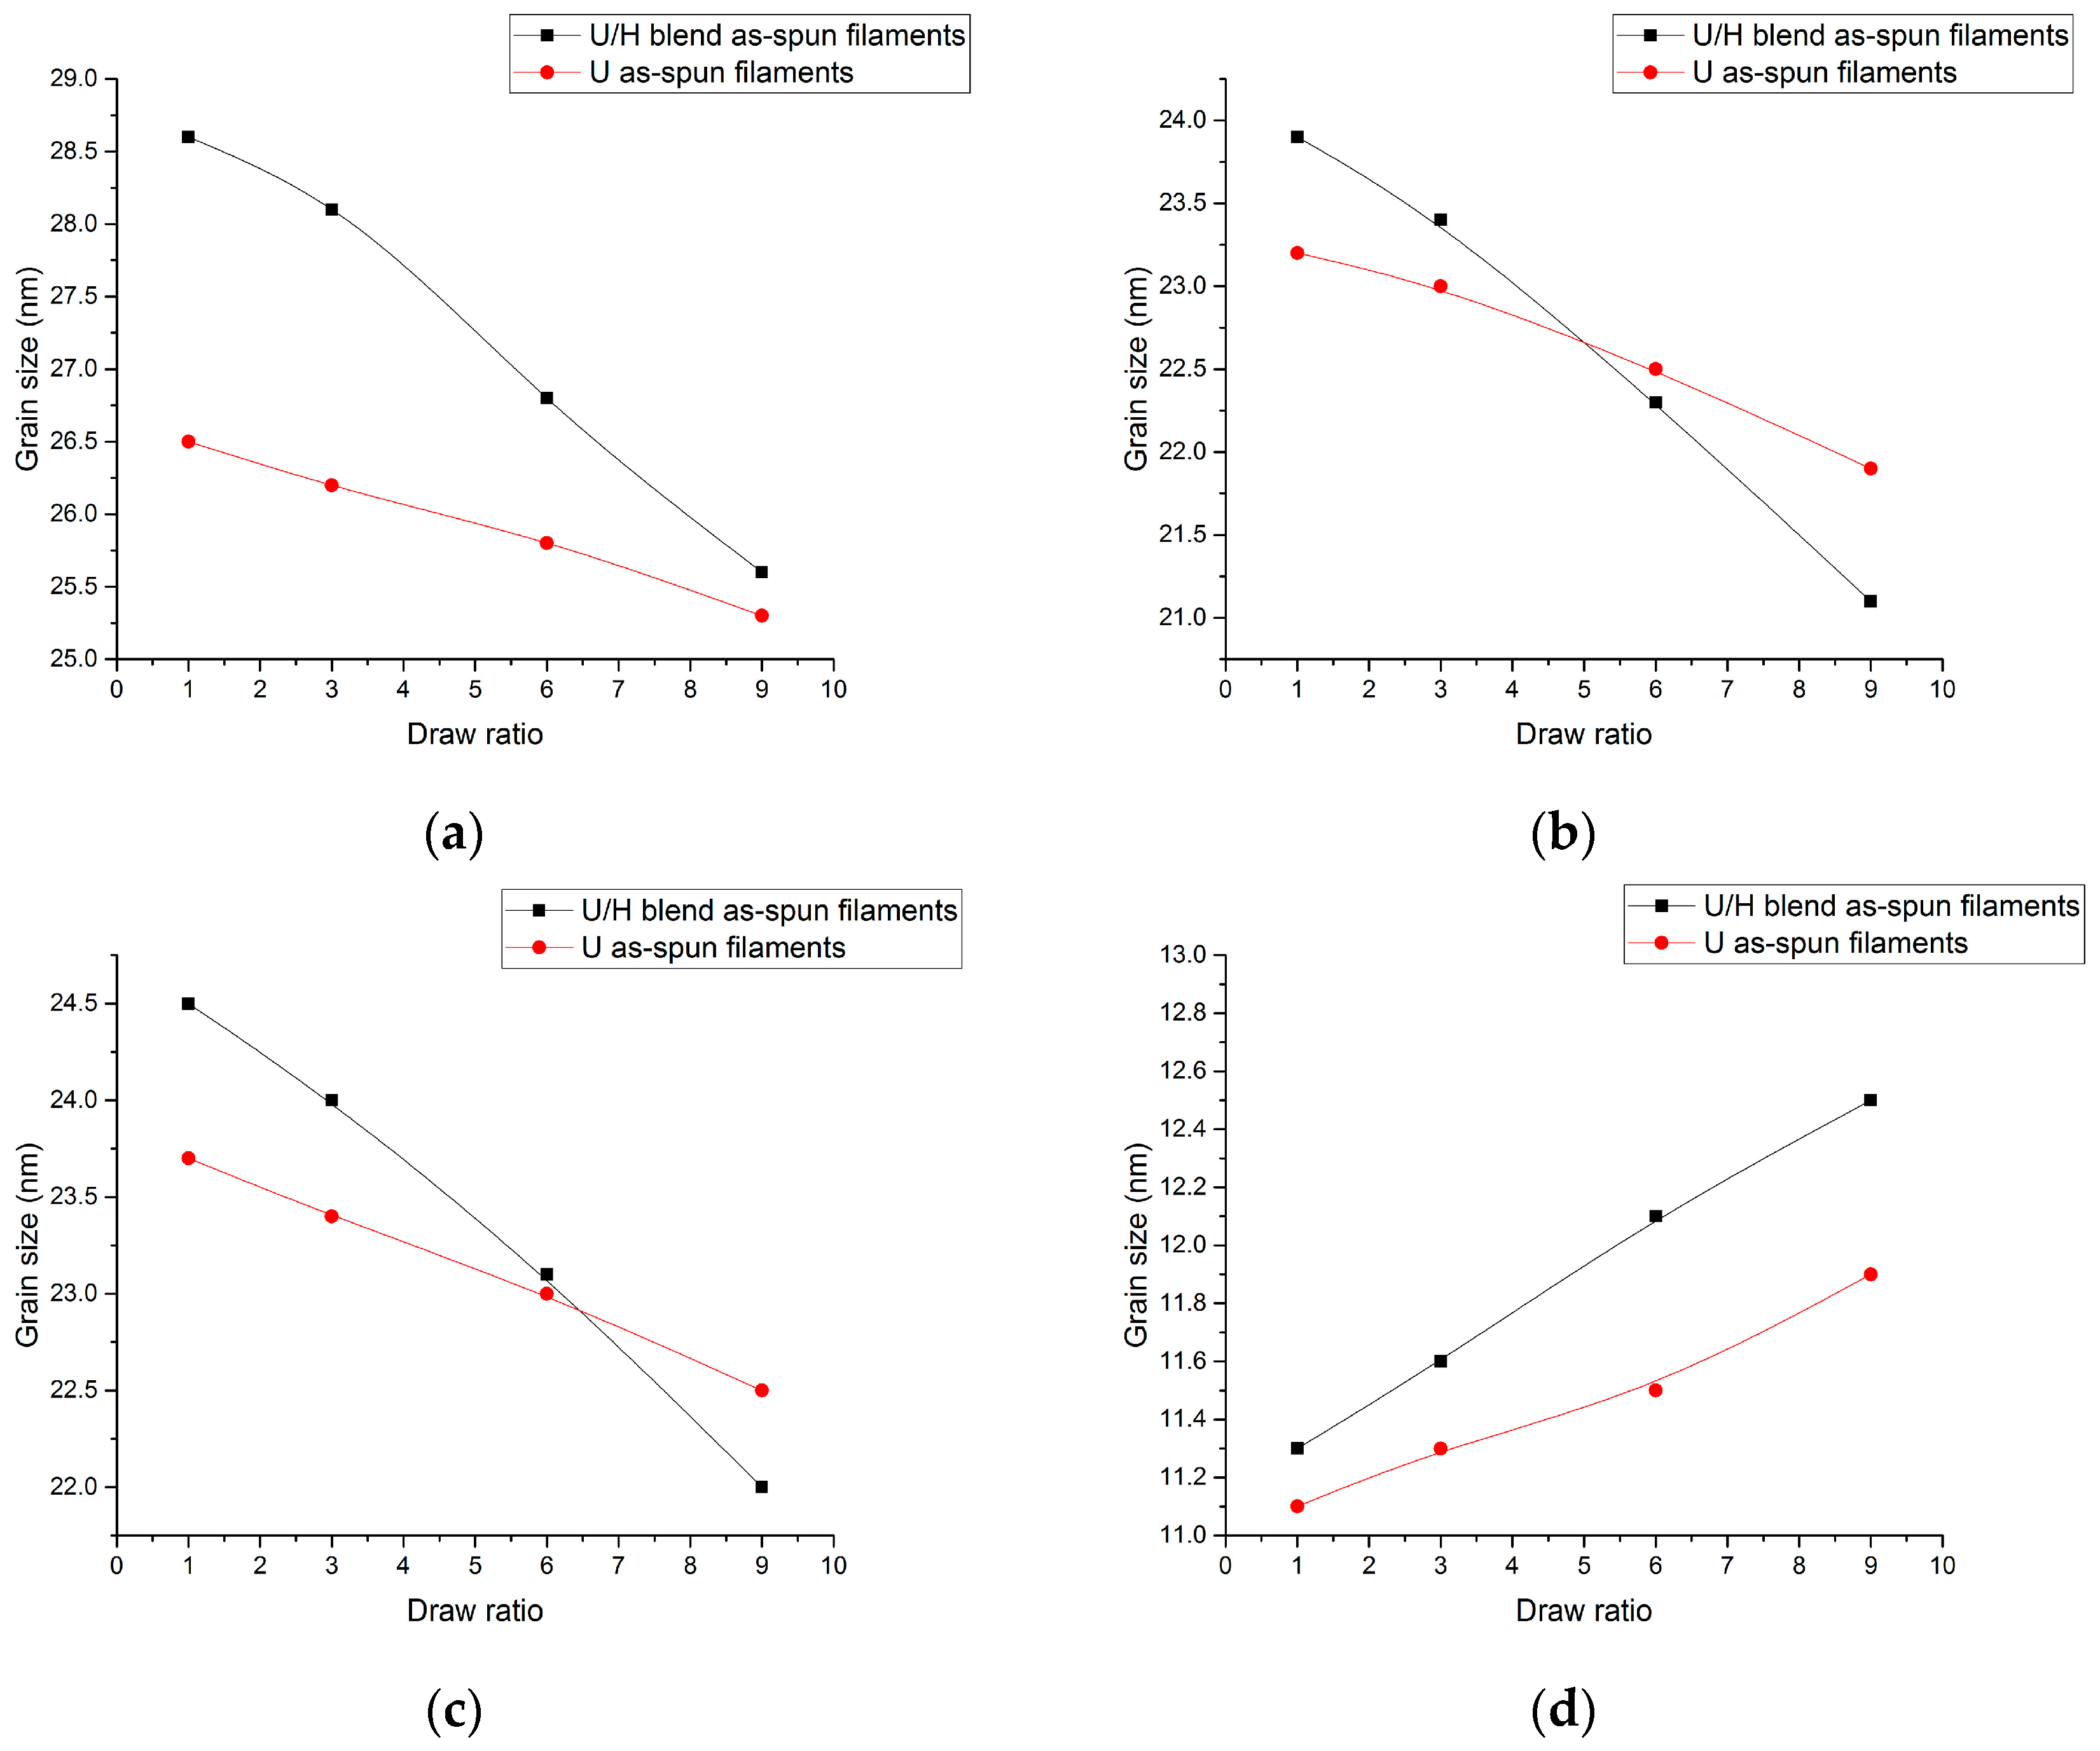
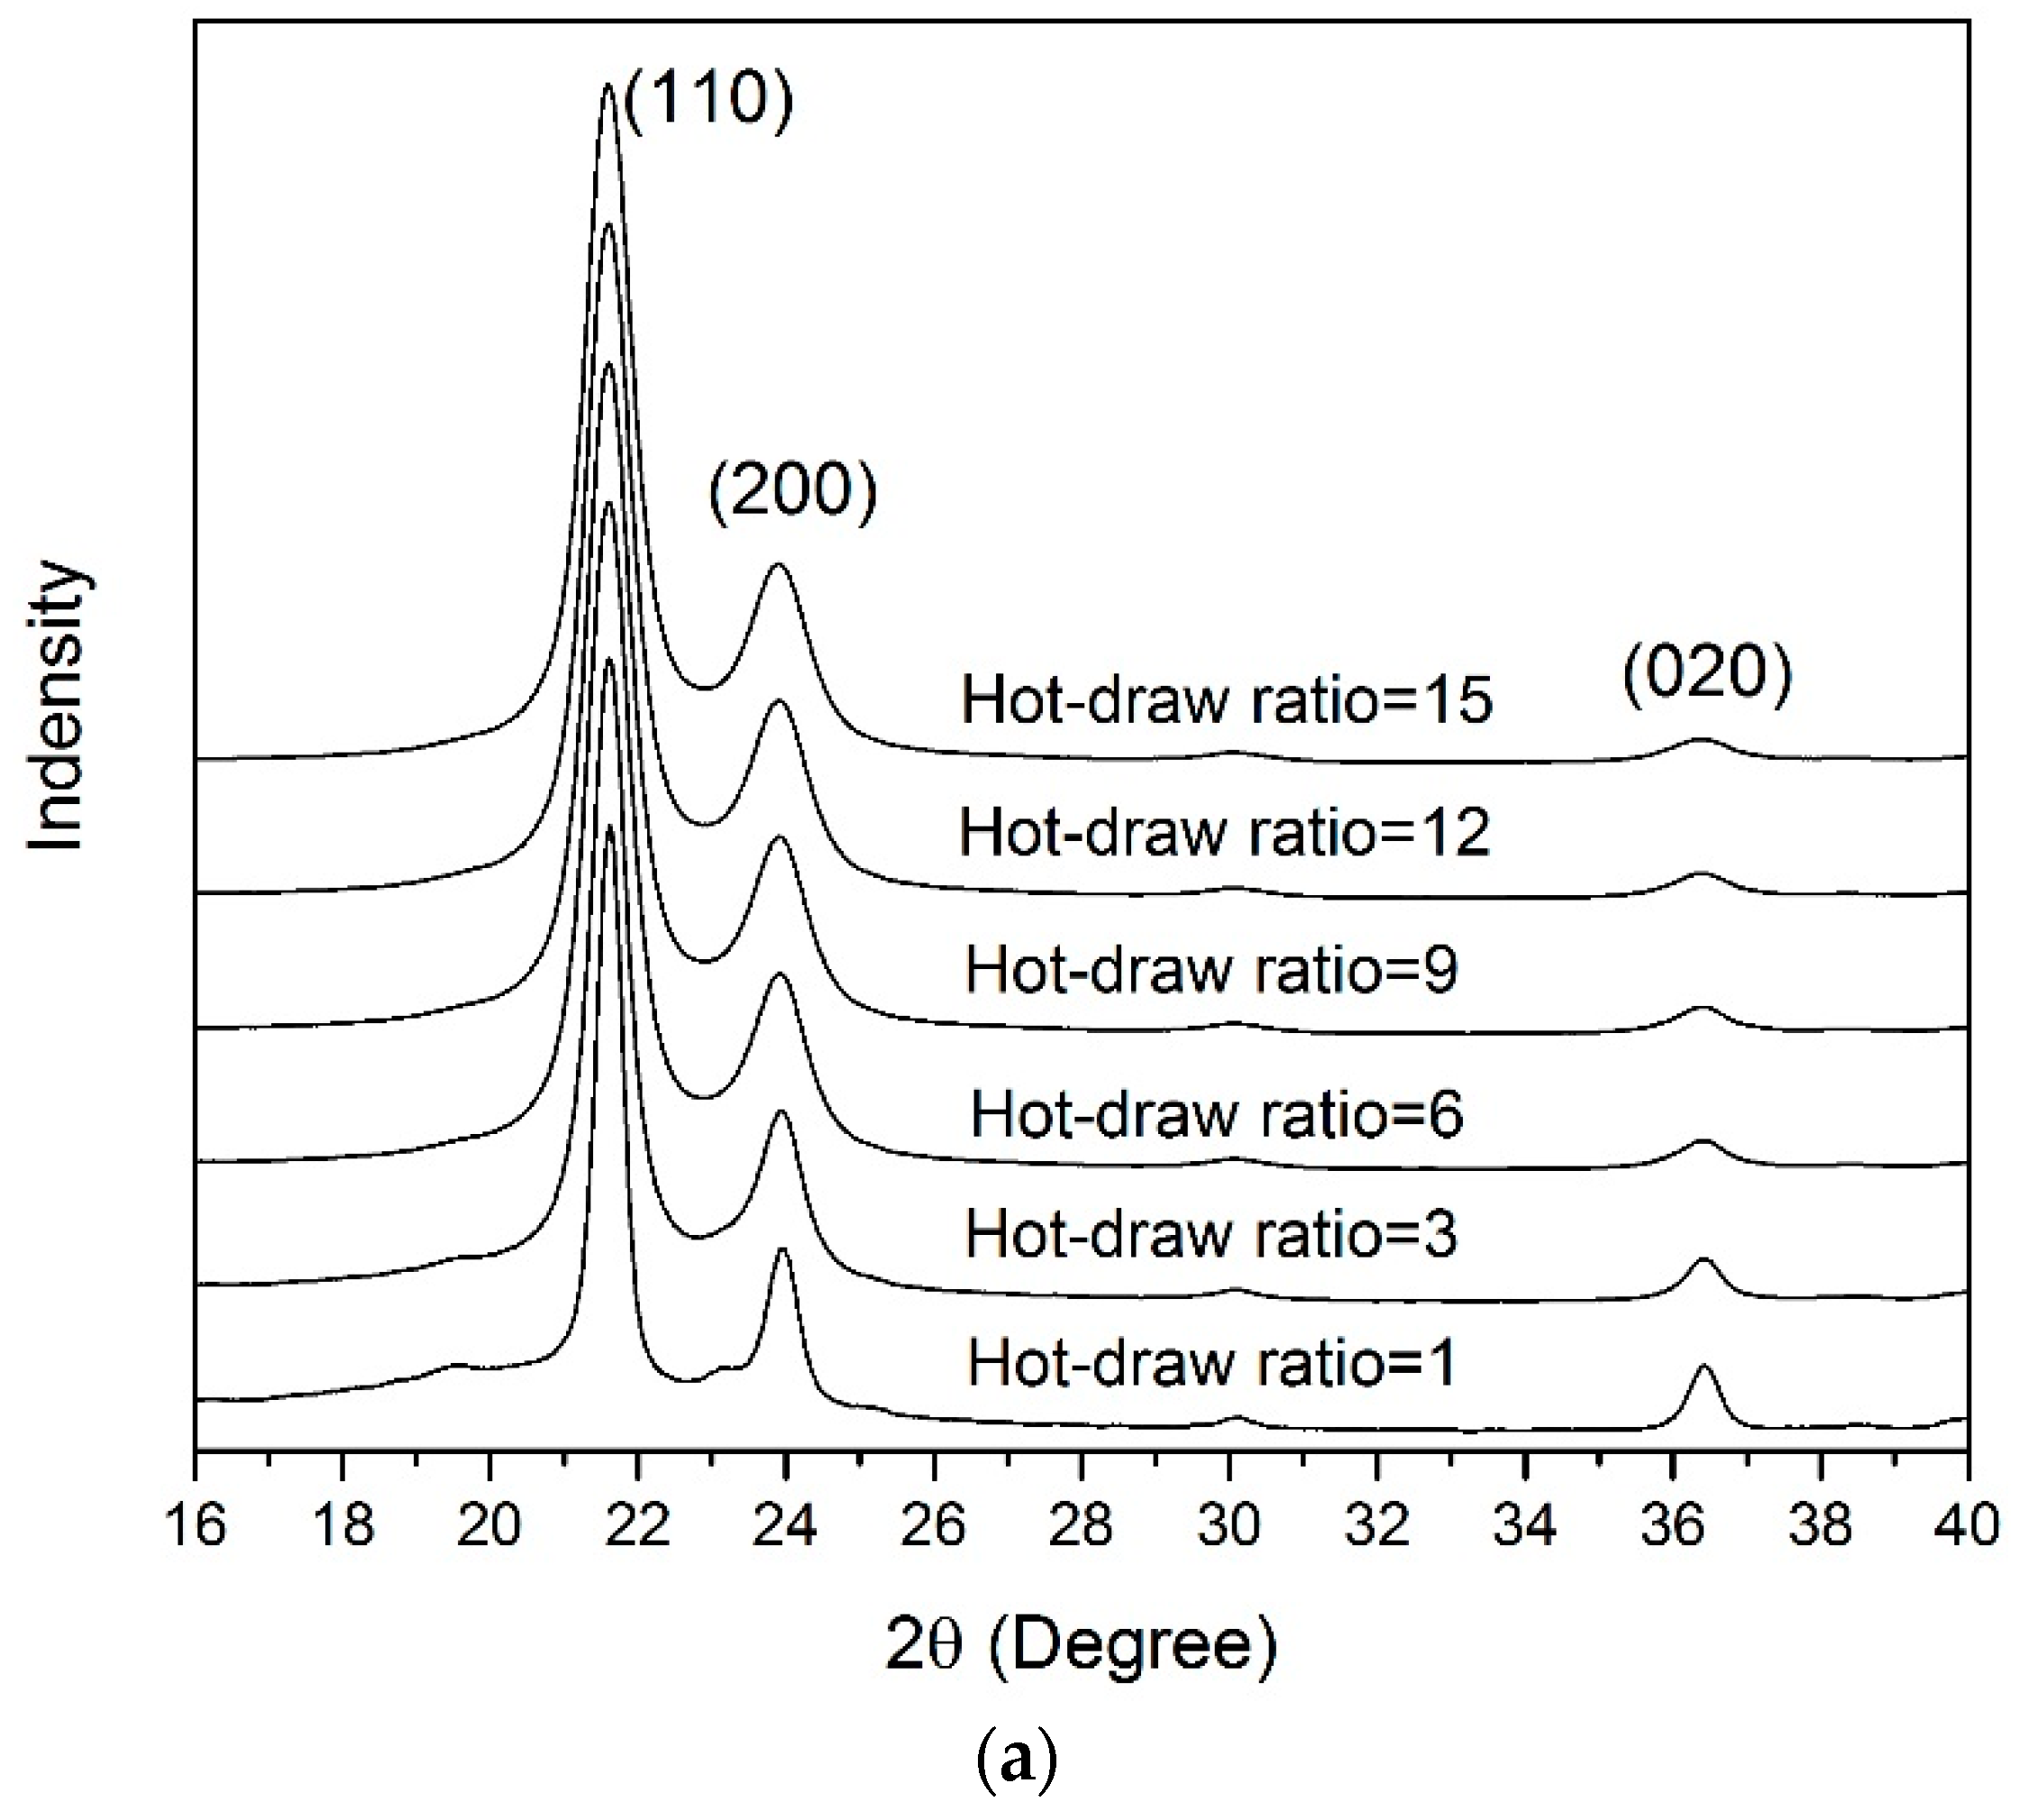
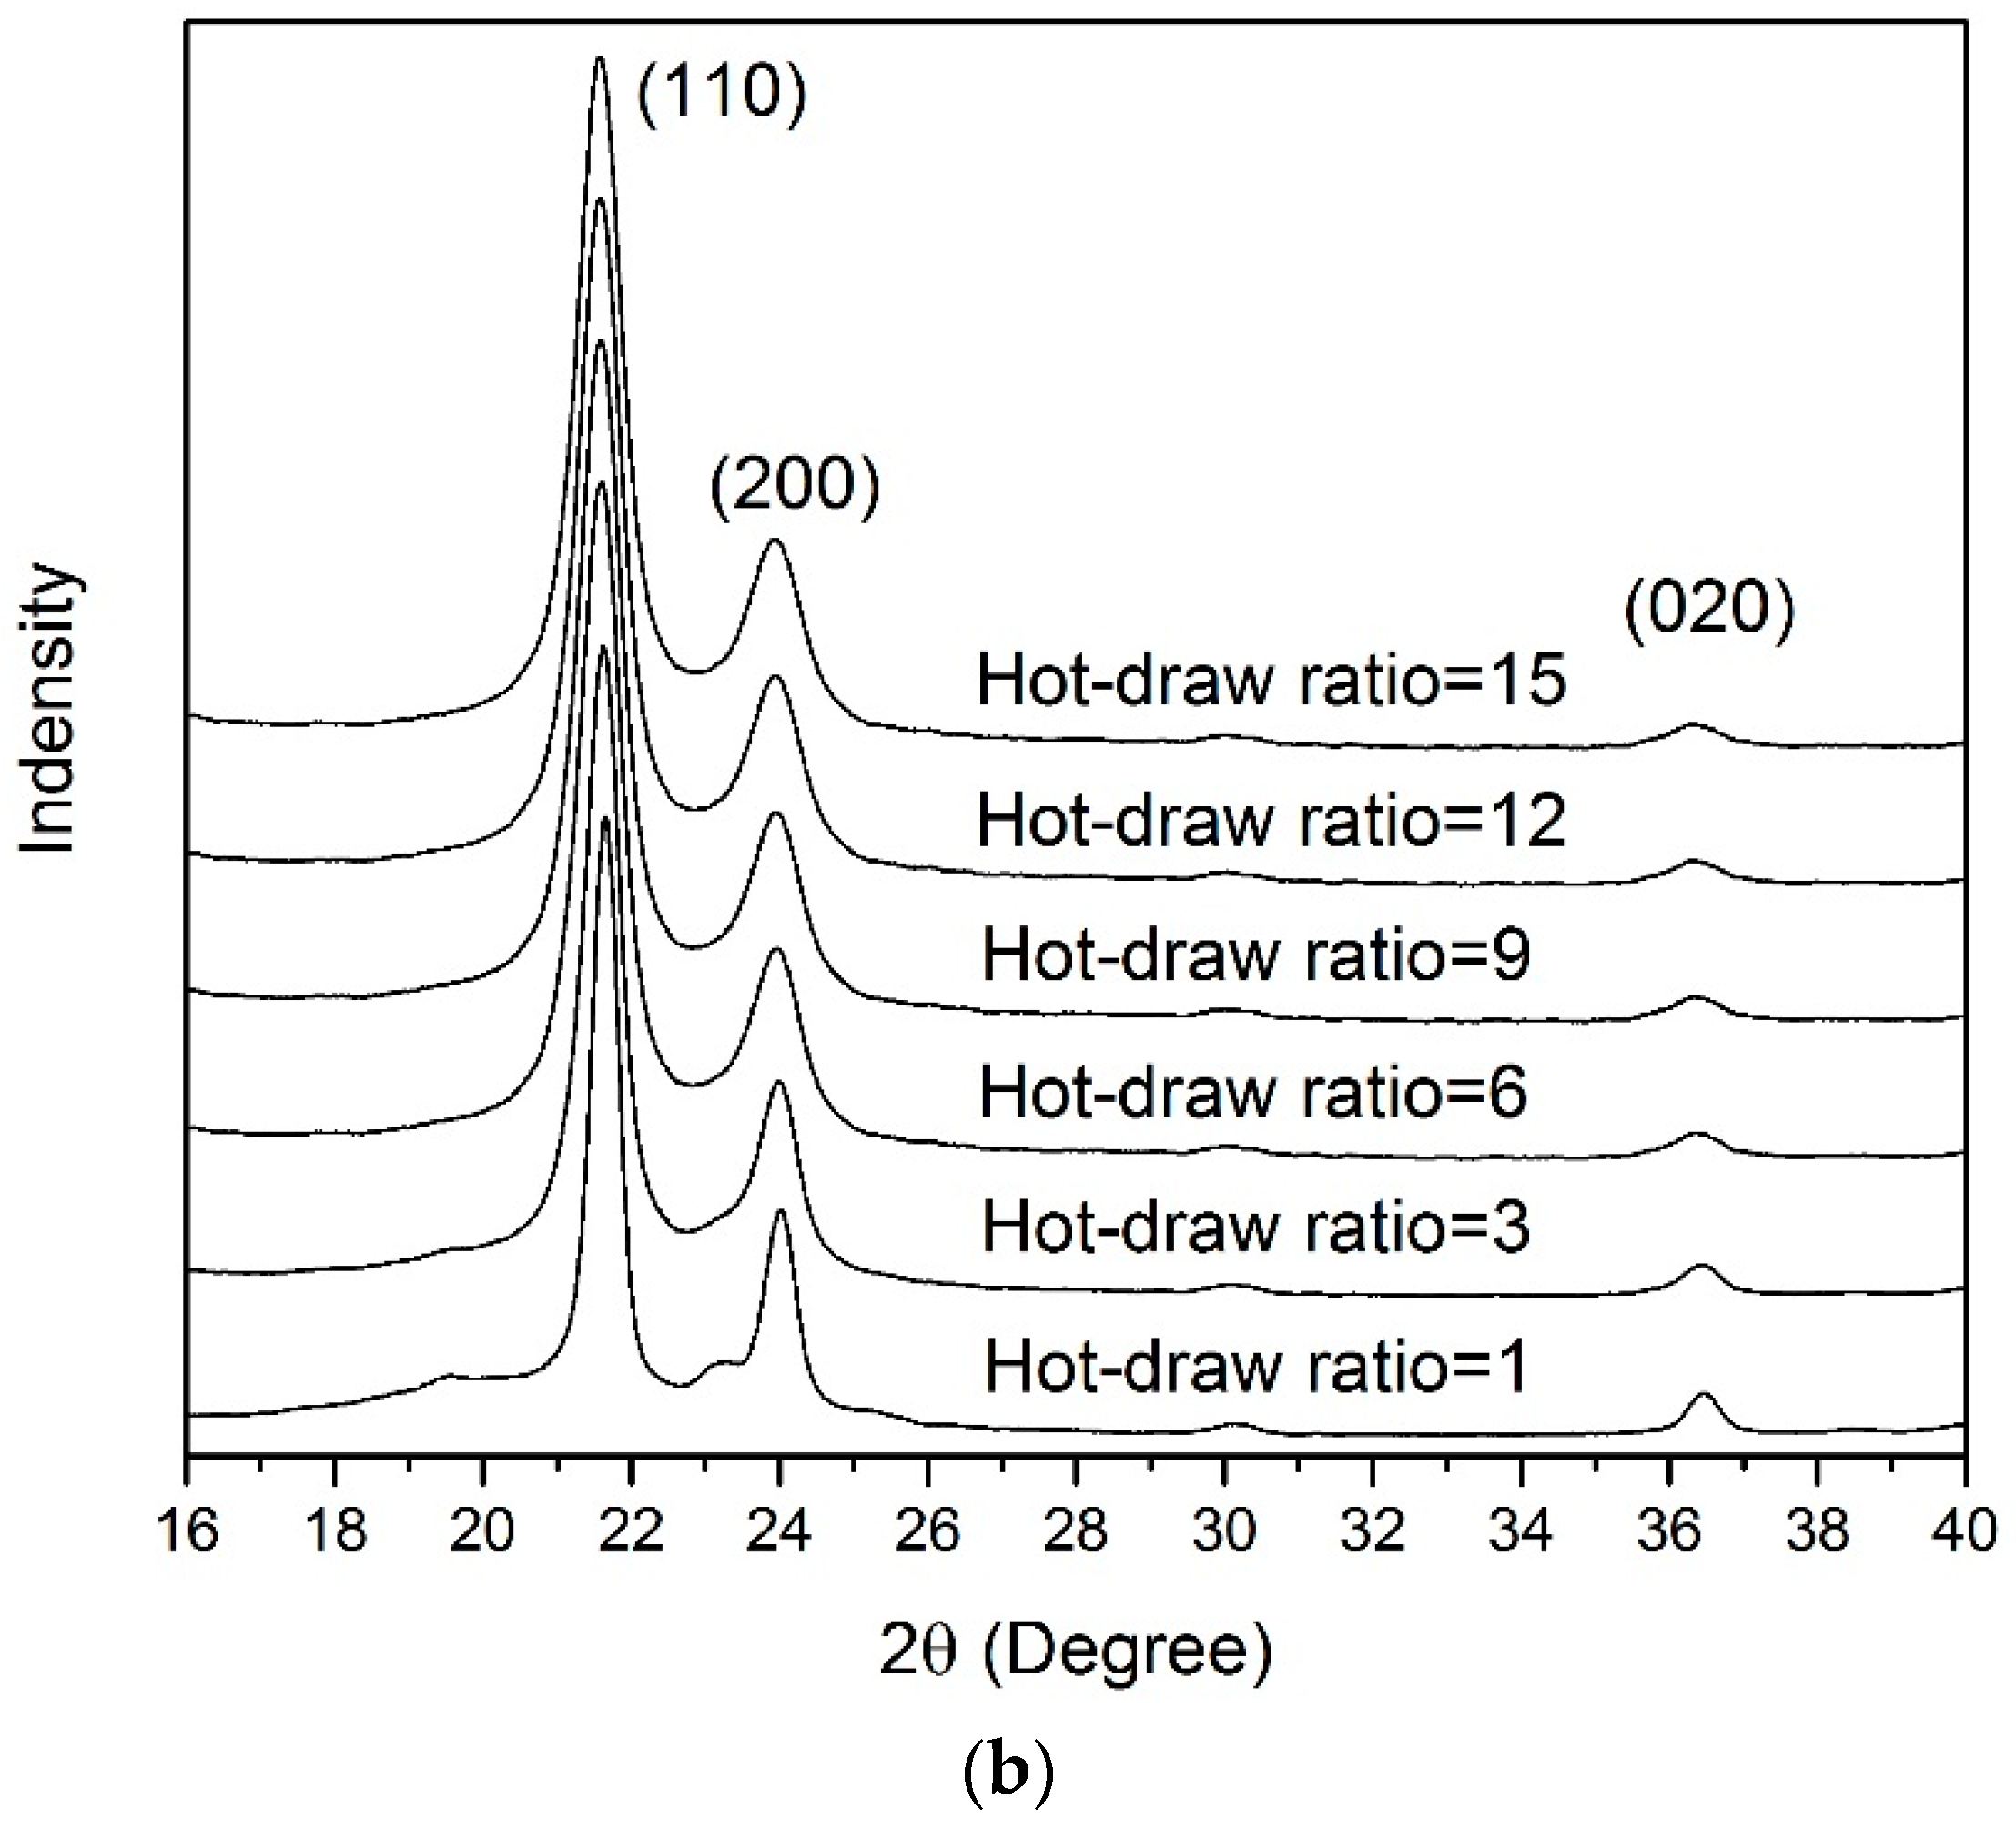
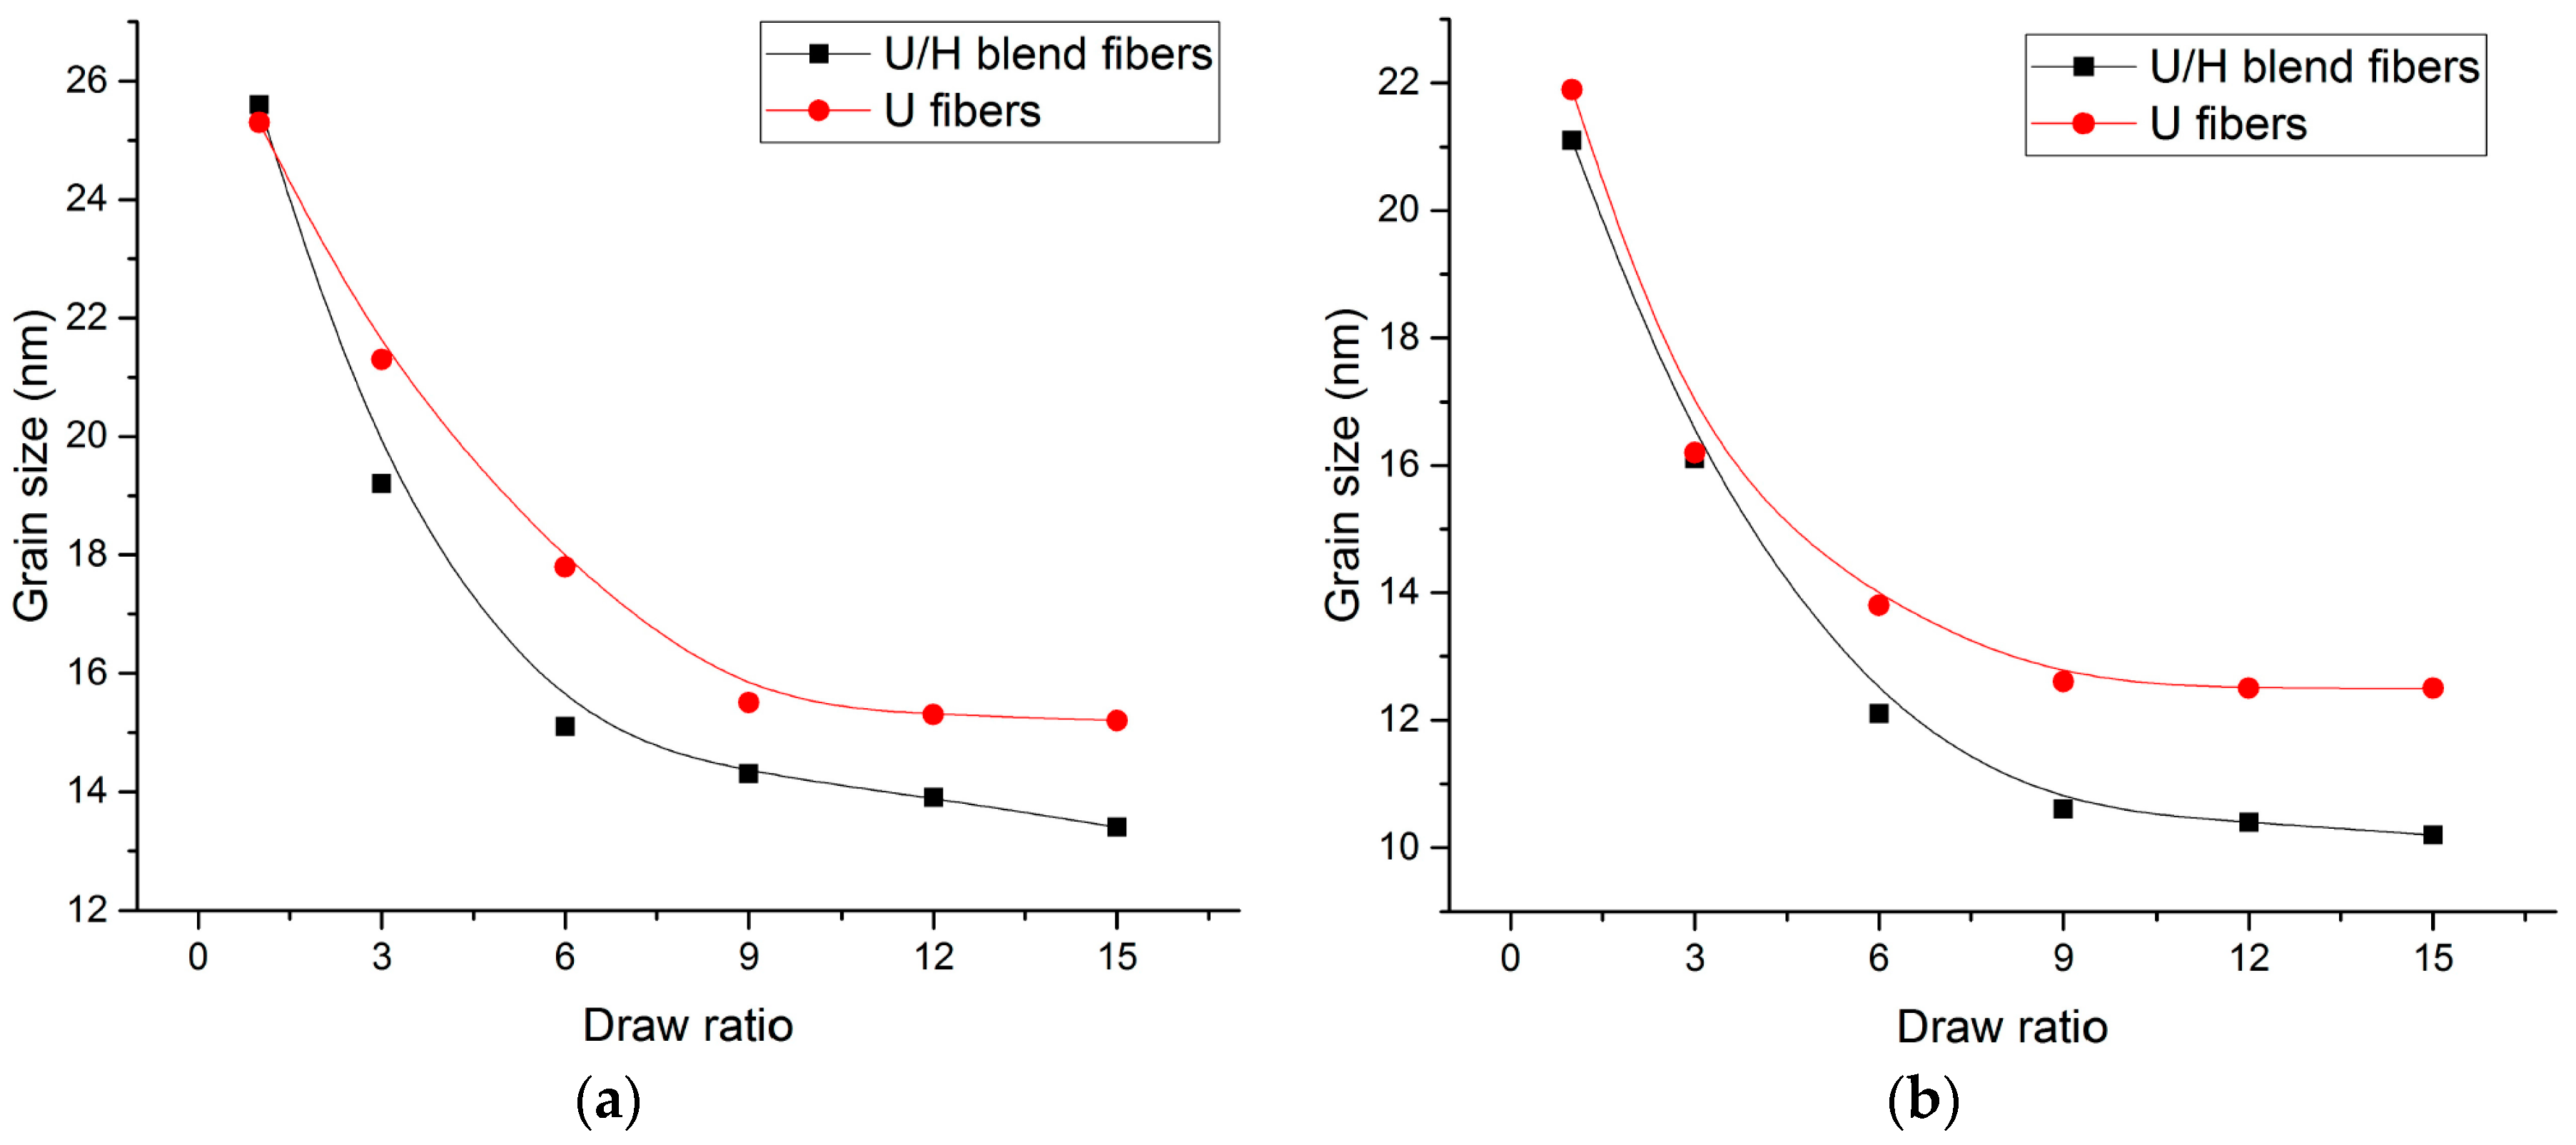
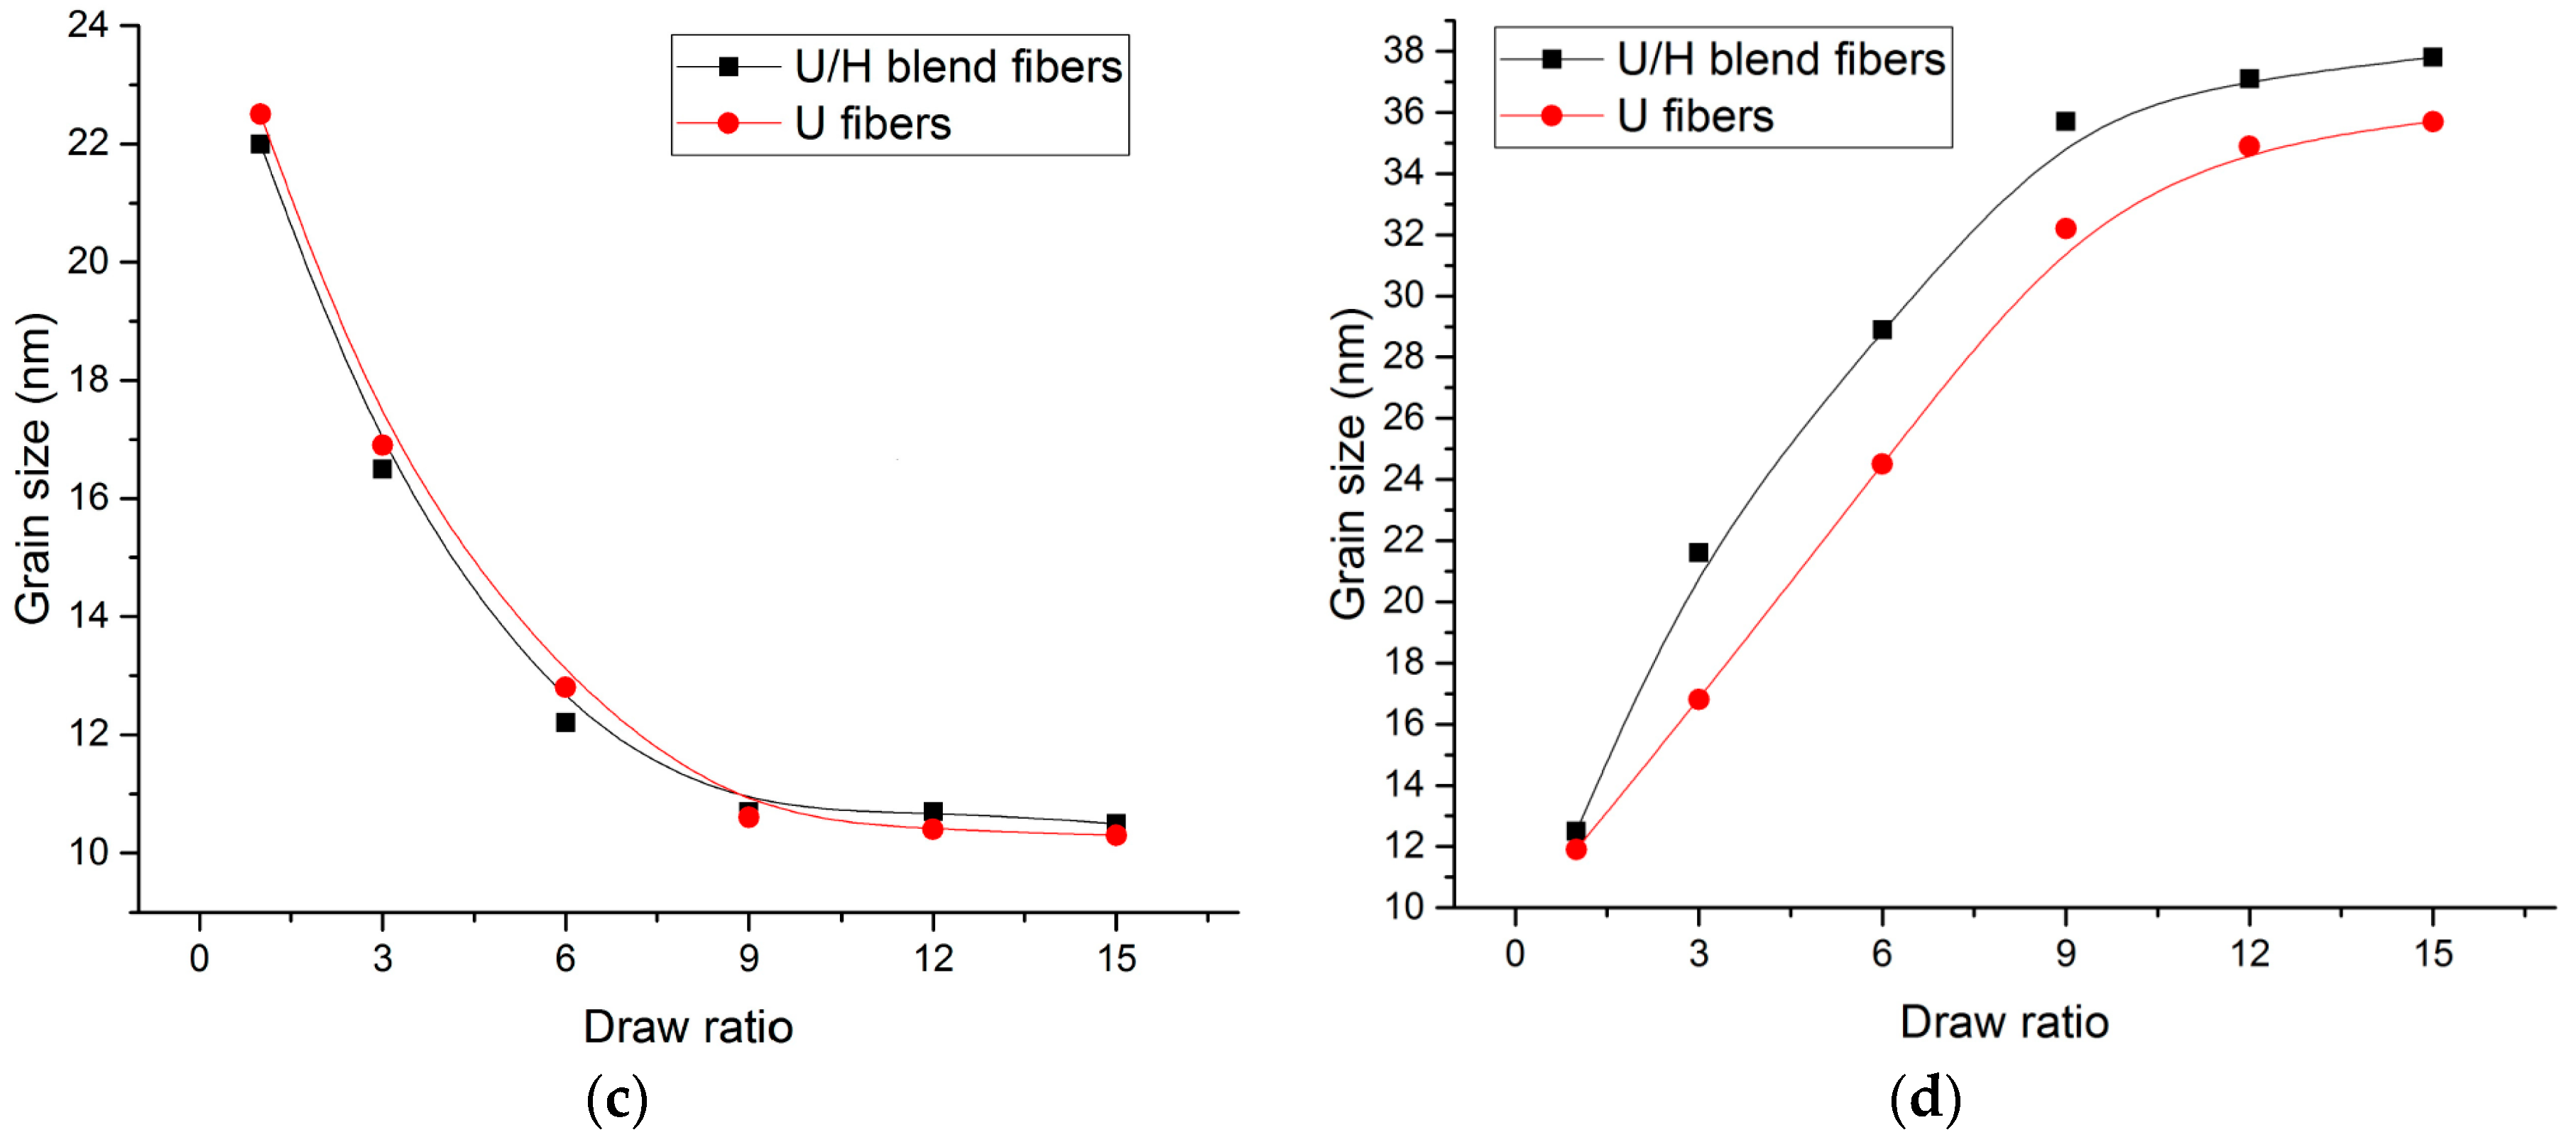
3.4. WAXD Analyses
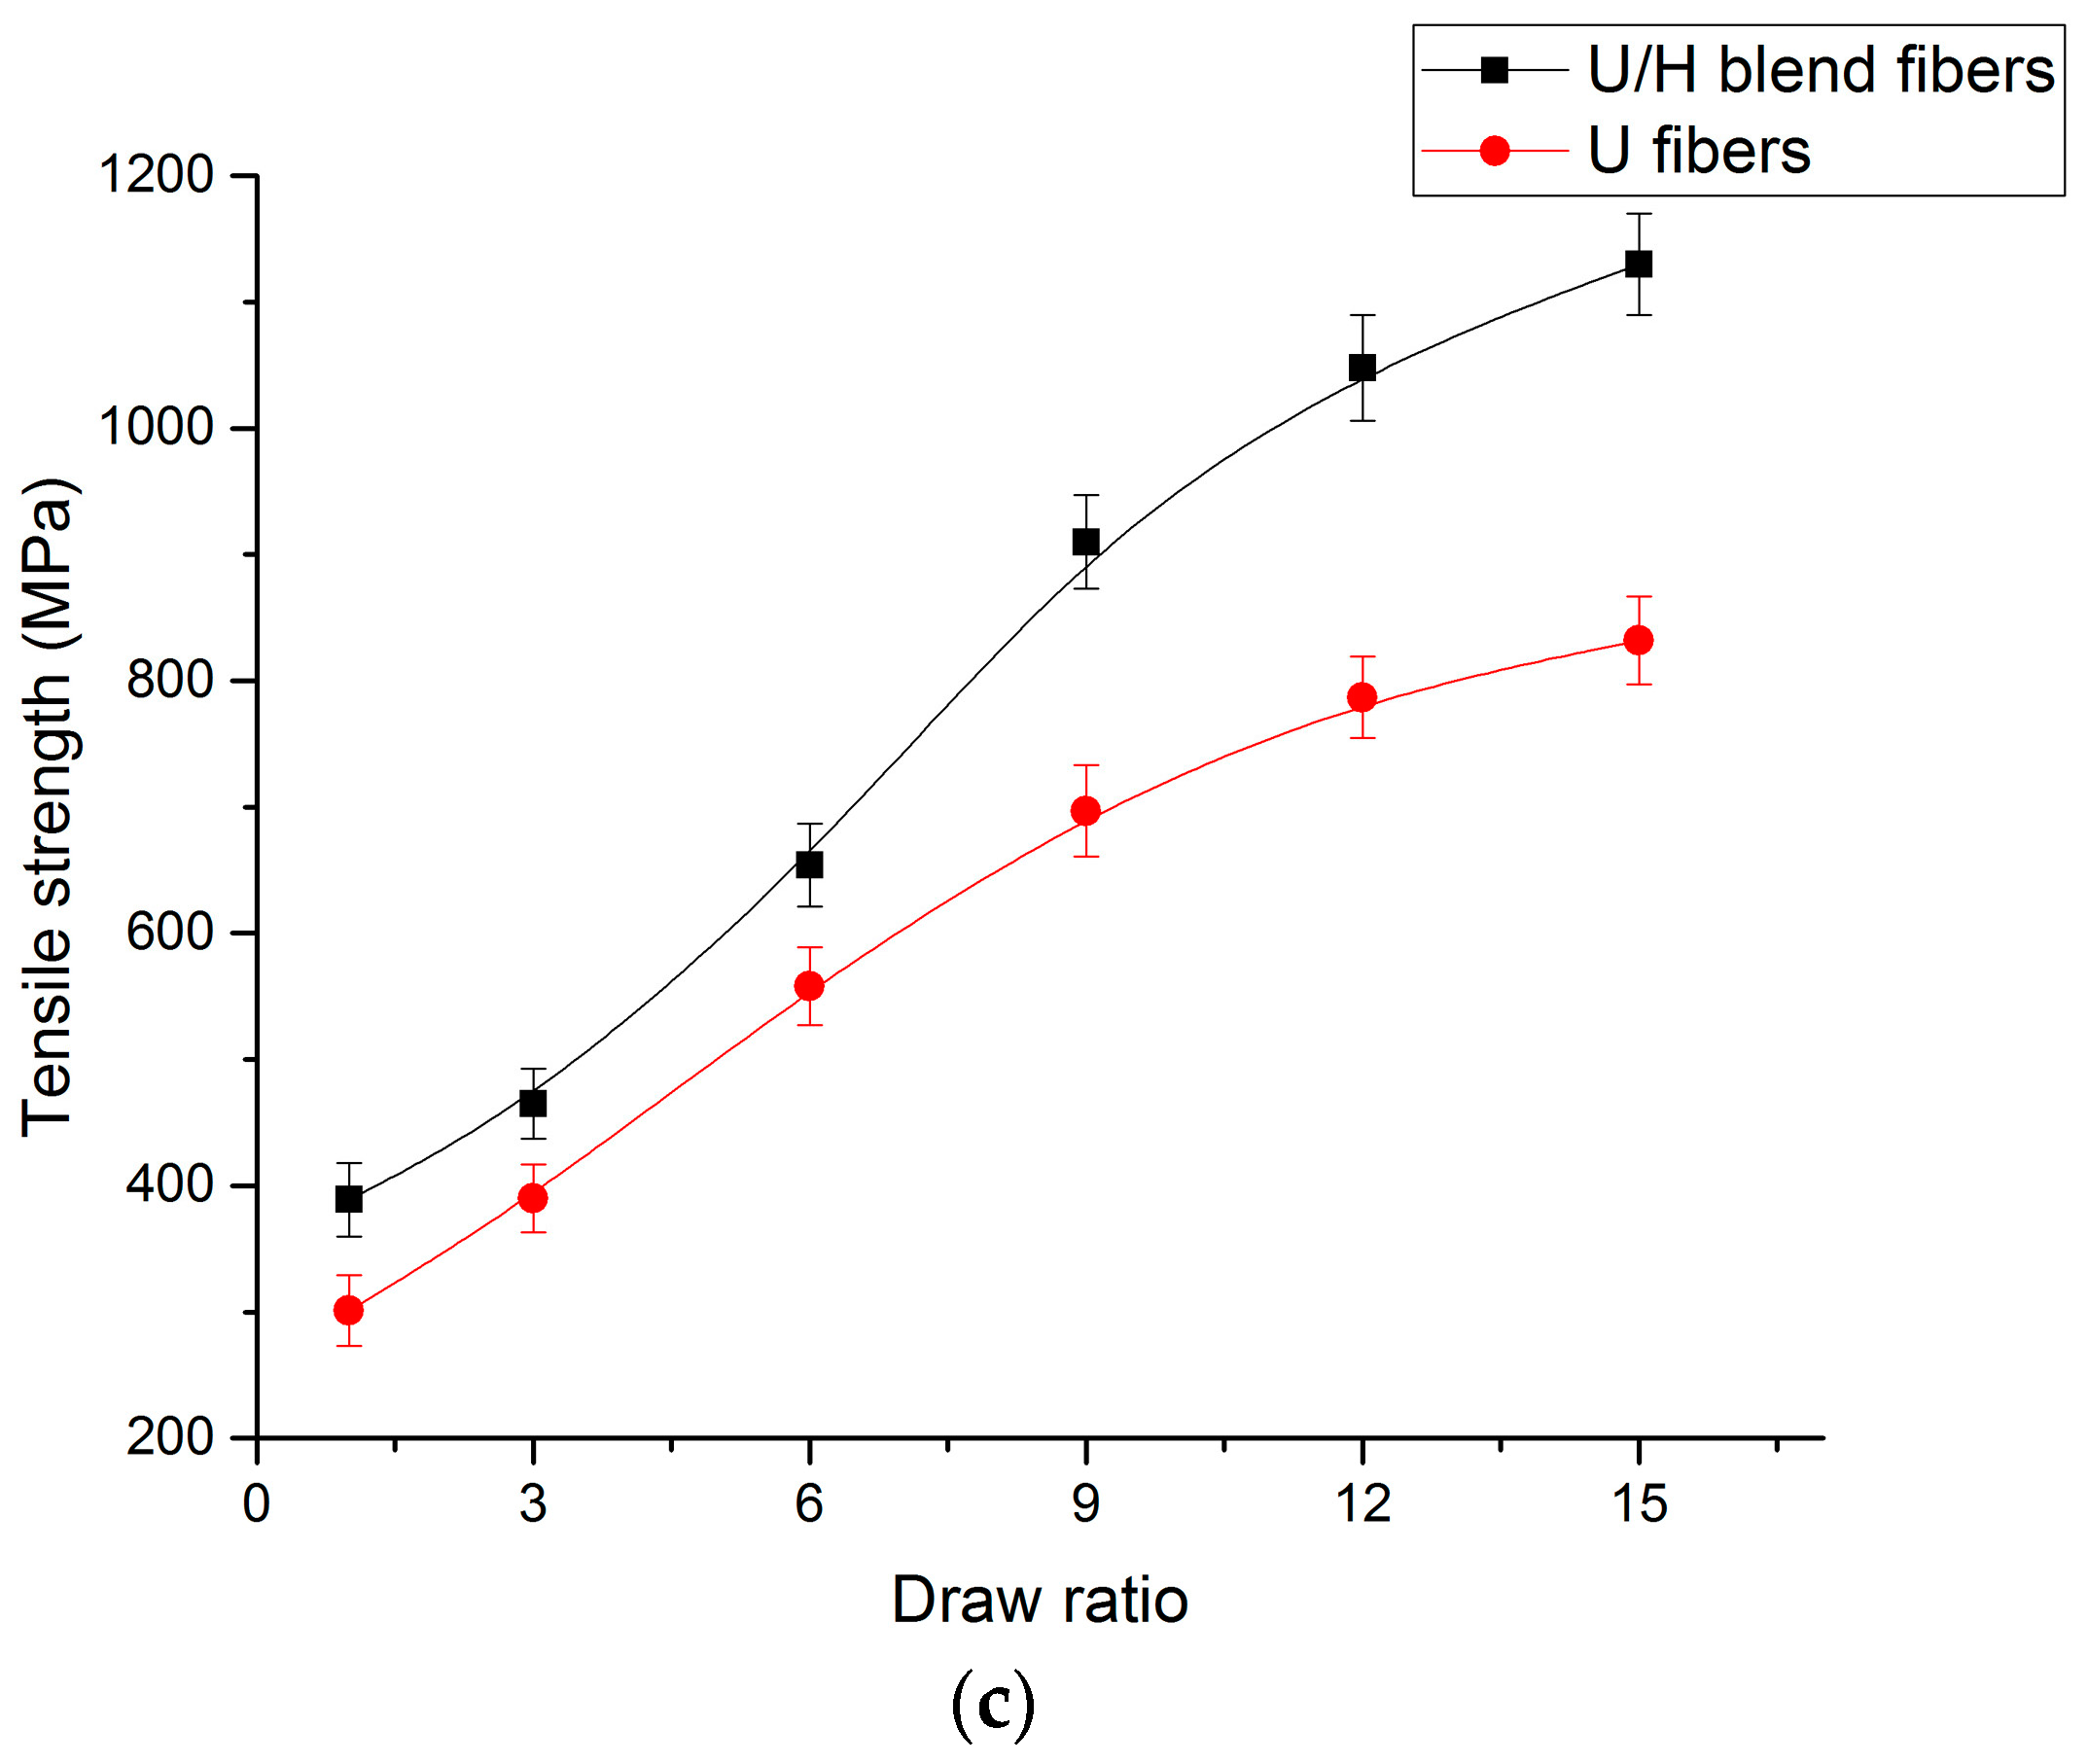
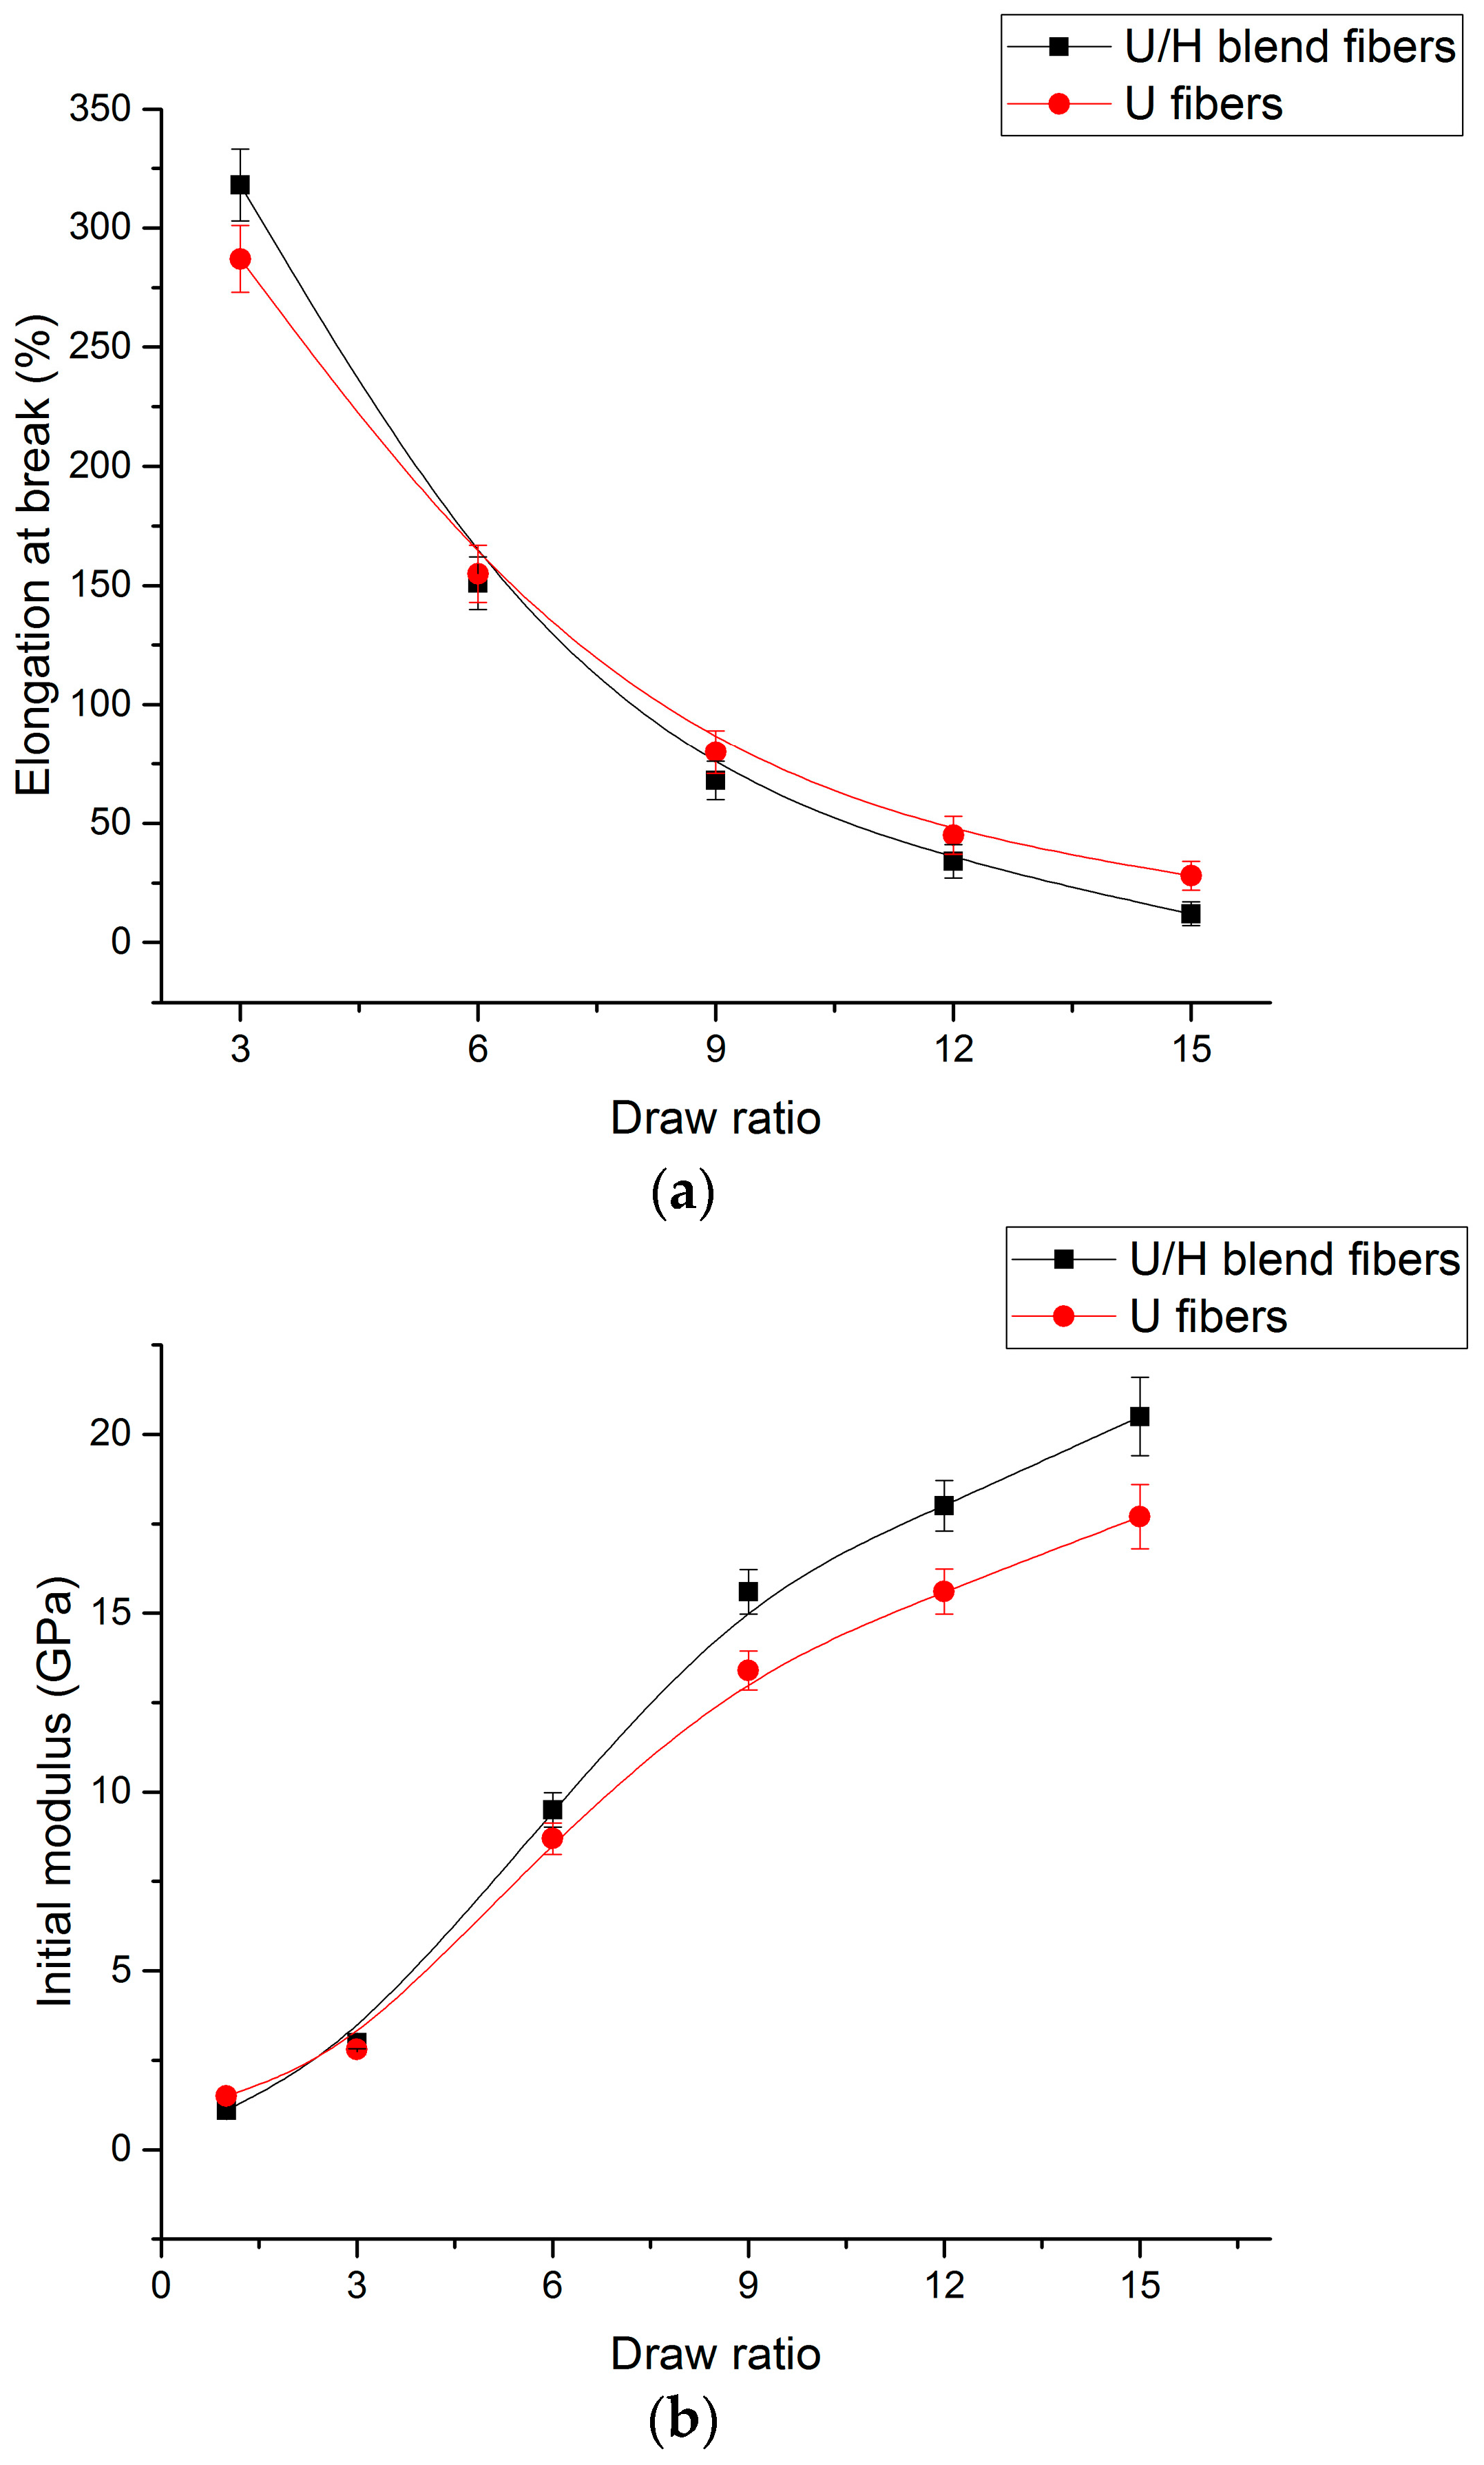
3.5. Tensile Test
4. Conclusions
Acknowledgments
Author Contributions
Conflicts of Interest
References
- Smith, P.; Lemstra, P.J. Ultra-high-strength polyethylene filaments by solution spinning/drawing. J. Mater. Sci. 1980, 15, 505–514. [Google Scholar] [CrossRef]
- Lemstra, P.J.; Kirschbaum, R.; Ohta, T.; Yasuda, H. High-Strength/High-Modulus Structures Based on Flexible Macromolecules: Gel-Spinning and Related Processes; Springer: Dordrecht, The Netherlands, 1987; pp. 39–77. [Google Scholar]
- Zhang, B. Development and application of ultra-high molecular weight polyethylene (UHMWPE) fiber. Guangzhou Huagong 2010, 38, 28–29. [Google Scholar]
- Yuan, W.; Li, W.; Wang, Y.; Luo, L. Structure and mechanical properties of melt-spun UHMWPE fiber. Hecheng Xianwei Gongye 2013, 36, 42–44. [Google Scholar]
- Rwei, S.P.; Jue, Z.F.; Chen, F.L. PBT/PET conjugated fibers: Melt spinning, fiber properties, and thermal bonding. Polym. Eng. Sci. 2004, 44, 331–344. [Google Scholar] [CrossRef]
- Jeon, Y.P.; Cox, C.L. Modeling of multifilament PET fiber melt-spinning. J. Appl. Polym. Sci. 2008, 110, 2153–2163. [Google Scholar] [CrossRef]
- Didane, N.; Giraud, S.; Devaux, E. Fire performances comparison of back coating and melt spinning approaches for PET covering textiles. Polym. Degrad. Stab. 2012, 97, 1083–1089. [Google Scholar] [CrossRef]
- Anand, K.A.; Jose, T.S.; Agarwal, U.S.; Sreekumar, T.V.; Banwari, B.; Joseph, R. PET-SWNT nanocomposite fibers through melt spinning. Int. J. Polym. Mater. 2010, 59, 438–449. [Google Scholar] [CrossRef]
- Rwei, S.P. Modification of PET in high-speed melt spinning by blending with PEN. Polym. Eng. Sci. 2000, 40, 191–200. [Google Scholar] [CrossRef]
- Lee, S.H.; Youn, J.R. Properties of polypropylene/layered-silicate nanocomposites and melt-spun fibers. J. Appl. Polym. Sci. 2008, 109, 1221–1231. [Google Scholar] [CrossRef]
- Rangasamy, L.; Shim, E.; Pourdeyhimi, B. Structure and tensile properties of nanoclay–polypropylene fibers produced by melt spinning. J. Appl. Polym. Sci. 2011, 121, 410–419. [Google Scholar] [CrossRef]
- Zhang, X.; Yang, M.; Ying, Z.; Zhang, S.; Xia, D.; Liu, X.; Wang, D.; Xu, D. Polypropylene/montmorillonite composites and their application in hybrid fiber preparation by melt-spinning. J. Appl. Polym. Sci. 2004, 92, 552–558. [Google Scholar] [CrossRef]
- Hao, C.; Zhao, Y.; He, A.; Zhang, X.; Wang, D.; Ma, Q.; Xu, Y. Investigation on the melt spinning fibers of PP/organoclay nanocomposites prepared by in-situ polymerization. J. Appl. Polym. Sci. 2010, 116, 1384–1391. [Google Scholar]
- Chantrasakul, S.; Amornsakchai, T. High strength polyethylene fibers from high density polyethylene/organoclay composites. Polym. Eng. Sci. 2007, 47, 943–950. [Google Scholar] [CrossRef]
- Zhang, Q.; Wang, Q.; Chen, Y. Structure evolution of ultra high molecular weight polyethylene/montmorillonite nanocomposite fibers prepared by melt spinning. J. Appl. Polym. Sci. 2013, 130, 3930–3936. [Google Scholar] [CrossRef]
- Zhang, Q.; Wang, Q.; Chen, Y. Extended chain crystals of ultra high molecular weight polyethylene fiber prepared by melt spinning. J. Eng. Fibers Fabr. 2015, 10, 103–109. [Google Scholar]
- Zhen, W.Q.; Wang, Q.Z.; Jin-Xi, W.U.; Wang, H.M. The preparation of UHMWPE/MMT composite fiber by melt spinning process. Hecheng Xianwei 2011, 3, 5–9. [Google Scholar]
- Tam, Y.T.; Aminuddin, N.; Young, J.A. Melt Spinning Blends of UHMWPE and HDPE and Fibers Made Therefrom. U.S. Patent 8,057,897, 3 May 2011. [Google Scholar]
- Chen, C.S.; Liu, Q.; Xu, S.A. Preparation of Ultra High Molecular Weight Polyethylene Fibers. CN Patent 201010533593. X, 6 April 2011. [Google Scholar]
- Huang, W.; Wang, X.C.; Yang, Z.K. Properties and melt spinning process of UHMWPE/polyolefin blend. Hecheng Xianwei Gongye 2015, 38, 43–48. [Google Scholar]
- Murase, H.; Ohta, Y.; Hashimoto, T. A new scenario of shish-kebab formation from homogeneous solutions of entangled polymers: Visualization of structure evolution along the fiber spinning line. J. Polym. Sci. Part A Polym. Chem. 2011, 44, 7335–7350. [Google Scholar] [CrossRef]
- Hashimoto, T.; Murase, H.; Ohta, Y. Shear-induced phase separation of entangled polymer solutions: Formation of optically anisotropic strings as precursor structures of shish-kebab. Macromol. Symp. 2009, 279, 88–95. [Google Scholar] [CrossRef]
- Hashimoto, T.; Murase, H.; Ohta, Y. A new scenario of flow-induced shish-kebab formation in entangled polymer solutions. Macromolecules 2010, 43, 87–96. [Google Scholar] [CrossRef]
- Takahashi, T.; Konda, A.; Shimizu, Y. Effect of viscosity ratio on structure of polypropylene/polyamide 6 blend fiber. Sen'i Gakkaishi 1996, 52, 507–515. [Google Scholar] [CrossRef]
- Xiao, W. Polypropylene/poly (vinyl acetate) blend fiber. J. Appl. Polym. Sci. 1994, 52, 1023–1030. [Google Scholar] [CrossRef]
- Kim, J.Y.; Seo, E.S.; Kim, S.H.; Kikutani, T. Effects of annealing on structure and properties of TLCP/PEN/PET ternary blend fibers. Macromol. Res. 2003, 11, 62–68. [Google Scholar] [CrossRef]
- Zuo, J.D.; Zhu, Y.M.; Liu, S.M.; Jiang, Z.J.; Zhao, J.Q. Preparation of HDPE/UHMWPE/MMWPE blends by two-step processing way and properties of blown films. Polym. Bull. 2007, 58, 711–722. [Google Scholar] [CrossRef]
- Zuo, J.; Liu, S.; Zhao, J. Cocrystallization behavior of HDPE/UHMWPE blends prepared by two-step processing way. Polym. Polym. Compos. 2015, 23, 59–63. [Google Scholar]
- Shen, H.; He, L.; Fan, C.; Xie, B.; Yang, W.; Yang, M. Effective dissolution of UHMWPE in HDPE improved by high temperature melting and subsequent shear. Polym. Eng. Sci. 2015, 55, 270–276. [Google Scholar] [CrossRef]
- Salkhi, S.; Rezaei, M. Preparation and Characterization of UHMWPE/HDPE/MWCNT Melt-Blended Nanocomposites; University of Chicago Press: Chicago, IL, USA, 1952; pp. 1–22. [Google Scholar]
- Jaggi, H.S.; Satapathy, B.K.; Ray, A.R. Viscoelastic properties correlations to morphological and mechanical response of HDPE/UHMWPE blends. J. Polym. Res. 2014, 21, 1–13. [Google Scholar] [CrossRef]
- Kumar, A.; Trivedi, P.; Balani, K. Processing and mechanical characterization of compression-molded ultrahigh molecular weight polyethylene biocomposite reinforced with aluminum oxide. J. Nanosci. Nanoeng. Appl. 2014, 4, 1–11. [Google Scholar] [CrossRef]
- Cimmino, S.; Di Pace, E.; Martuscelli, E.; Silvestre, C.; Mendes, L.C.; Bonfanti, G. High density polyethylene/hydrogenated oligo (cyclopentadiene) blends: Tensile stress-strain behavior. J. Polym. Sci. Part B Polym. Phys. 1995, 33, 1723–1730. [Google Scholar] [CrossRef]
- Zhang, Y.; Jia, G.; Wu, S.; An, S. Study on the drawing process of the UHMW-PE gel fiber. Tianjin Gongye Daxue Xuebao 1996, 15, 18–22. [Google Scholar]
- Galeski, A.; Bartczak, Z.; Argon, A.S.; Cohen, R.E. Morphological alterations during texture-producing plastic plane strain compression of high-density polyethylene. Macromolecules 1992, 25, 5705–5718. [Google Scholar] [CrossRef]


| Groups | Mass Ratio of UHMWPE/HDPE | MFI of HDPE (g/10 min) |
|---|---|---|
| U/H | 6:4 | 0.9 |
| U | 10:0 | N/A |
| Initial drawing ratio | Take-up speed (m/min) | As-spun filament | As-spun filament diameter (μm) |
|---|---|---|---|
| 1 | 0 (Free fall) | U/H | 588 ± 10 |
| U | 597 ± 11 | ||
| 3 | 2.5 | U/H | 346 ± 8 |
| U | 353 ± 10 | ||
| 6 | 5 | U/H | 242 ± 7 |
| U | 245 ± 8 | ||
| 9 | 7.5 | U/H | 199 ± 6 |
| U | 202 ± 5 |
| Hot-draw ratio | Fiber | Fiber diameter (μm) |
|---|---|---|
| 1 | U/H | 199 ± 6 |
| U | 202 ± 5 | |
| 3 | U/H | 115 ± 5 |
| U | 116 ± 5 | |
| 6 | U/H | 82 ± 3 |
| U | 83 ± 4 | |
| 9 | U/H | 66 ± 5 |
| U | 67 ± 4 | |
| 12 | U/H | 58 ± 3 |
| U | 58 ± 4 | |
| 15 | U/H | 51 ± 2 |
| U | 52 ± 3 |
© 2017 by the authors. Licensee MDPI, Basel, Switzerland. This article is an open access article distributed under the terms and conditions of the Creative Commons Attribution (CC BY) license ( http://creativecommons.org/licenses/by/4.0/).
Share and Cite
Wang, F.; Liu, L.; Xue, P.; Jia, M. Crystal Structure Evolution of UHMWPE/HDPE Blend Fibers Prepared by Melt Spinning. Polymers 2017, 9, 96. https://doi.org/10.3390/polym9030096
Wang F, Liu L, Xue P, Jia M. Crystal Structure Evolution of UHMWPE/HDPE Blend Fibers Prepared by Melt Spinning. Polymers. 2017; 9(3):96. https://doi.org/10.3390/polym9030096
Chicago/Turabian StyleWang, Fei, Lichao Liu, Ping Xue, and Mingyin Jia. 2017. "Crystal Structure Evolution of UHMWPE/HDPE Blend Fibers Prepared by Melt Spinning" Polymers 9, no. 3: 96. https://doi.org/10.3390/polym9030096