Article

Performance and Stability Analysis of Extra-Early Maturing Orange Maize Hybrids under Drought Stress and Well-Watered Conditions

by
Tégawendé Odette Bonkoungou
1,2,
Baffour Badu-Apraku
2,*,
Victor Olawale Adetimirin
3,
Kiswendsida Romaric Nanema
4 and
Idris Ishola Adejumobi
2,*
1
Pan African University Life and Earth Sciences Institute (Including Health and Agriculture), University of Ibadan, Ibadan 200284, Nigeria
2
International Institute of Tropical Agriculture (IITA), Ibadan 200001, Nigeria
3
Department of Crop and Horticultural Sciences, University of Ibadan, Ibadan 200284, Nigeria
4
Biosciences Laboratory, Joseph KI-Zerbo University, Ouagadougou 7021, Burkina Faso
*
Authors to whom correspondence should be addressed.
Agronomy 2024, 14(4), 847; https://doi.org/10.3390/agronomy14040847
Submission received: 21 March 2024 / Revised: 12 April 2024 / Accepted: 16 April 2024 / Published: 18 April 2024

Abstract

:
The consistently low yield turnout of maize on farmers’ fields owing to drought and the nutritional challenges attributable to the consumption of white endosperm maize pose a major threat to food and nutritional security in Sub-Saharan Africa (SSA). The objectives of this study were to assess the performance of newly developed extra-early maturing orange hybrids under managed drought and well-watered conditions, compare the outcomes of multiple-trait base index and multi-trait genotype–ideotype distance index selection procedures, and identify drought-tolerant hybrids with stable performance across contrasting environments for commercialization in SSA. One hundred and ninety orange hybrids and six checks were evaluated under managed drought and well-watered conditions at Ikenne for two seasons between 2021 and 2023. A 14 × 14-lattice design was used for the field evaluations under both research conditions. Drought stress was achieved by the complete withdrawal of irrigation water 25 days after planting. Results revealed significant differences among the hybrids under drought and well-watered conditions. Grain yield, ears per plant, and plant aspect under managed drought were correlated to the same traits under well-watered conditions, suggesting that the expression of these traits is governed by common genetic factors. Twenty-nine hybrids were identified as top-performing drought-tolerant hybrids by the multiple-trait base index and the multi-trait genotype–ideotype distance index. Of the selected outstanding 29 hybrids, 34% were derived from crosses involving the tester TZEEIOR 197, demonstrating the outstanding genetic potential of this inbred line. Further analysis of the 29 selected hybrids revealed TZEEIOR 509 × TZEEIOR 197 as the hybrid that combined the most drought-tolerant adaptive traits. However, the hybrids TZEEIOR 526 × TZEEIOR 97, TZEEIOR 384 × TZEEIOR 30, TZEEIOR 515 × TZEEIOR 249, TZEEIOR 510 × TZEEIOR 197, TZEEIOR 479 × TZEEIOR 197, and TZEEIOR 458 × TZEEIOR 197 were identified as the most stable hybrids across drought and well-watered conditions. These hybrids should be extensively tested in multi-location trials for deployment and commercialization in SSA.

1. Introduction

Maize is a major crop for human consumption and as animal feed in sub-Saharan Africa (SSA). The crop has the potential to combat the food insecurity and malnutrition challenges presently facing the region. It currently provides 30% of dietary calories for millions of people in SSA [1]. Maize is cultivated on approximately 42.5 million hectares in Africa [2]. Most of the varieties cultivated by farmers are deficient in essential micronutrients, particularly vitamin A [3,4], which cannot be synthesized by the human body. The essentiality of this nutrient is demonstrated by the vulnerability of people who depend largely on maize for food to several diseases such as river blindness and diarrhea [5]. Vitamin A deficiency (VAD) is also known to impair the functionality of the immune system, increase susceptibility to diseases, and cause night or complete blindness and death from severe illnesses [6]. Given its importance as a major staple cereal crop in African homes, it is imperative to develop and commercialize improved maize genotypes biofortified with essential nutrients such as provitamin A (PVA) with tolerance/resistance to major production constraints faced by SSA farmers. These constraints include drought, low soil nitrogen (low N), Striga hermonthica parasitism, fall armyworm infestation, and many diseases [7,8,9]. On farmers’ fields, these constraints usually occur jointly with devastating effects on maize grain yield. This, coupled with the low genetic potentials of varieties cultivated by most farmers has resulted in the low grain yields frequently observed in farmers’ field.
In the absence of other stress factors during the production cycle, drought is capable of causing grain yield reduction between 40 and 90% depending on the stage of plant growth and development when the drought occurs, and its severity [10,11,12,13]. The flowering (tassel and silk emergence) and post-flowering (grain filling) stages are the major determinants of photo-assimilate partitioning from the source to the sink and consequently the amount of grain yields obtained at harvest. These stages are widely considered as the most sensitive stages of maize development which, if affected by drought, can lead to considerable reduction in maize production and productivity [14,15,16,17]. To address the dietary needs of the populace in SSA and achieve increased maize productivity in the sub-region, it is of utmost importance to develop new and improved maize hybrids that combine enhanced levels of PVA and high levels of tolerance to drought for commercialization. Based on the findings from some studies high PVA contents are correlated to the orange coloration of the kernel endosperm [18,19]. Therefore, orange maize could be a source of PVA content to address malnutrition. The first step to the realization of drought-tolerant PVA-rich maize began in 2007 by the International Institute of Tropical Agriculture Maize Improvement Program (IITA-MIP). The program had as its aim the development of extra-early and early (80–85 and 90–95 days to maturity, respectively) varieties that combine high levels of drought tolerance and provitamin A for SSA farmers. Through this program, numerous extra-early inbred lines possessing drought tolerance genes and elevated levels of PVA were developed, commercialized, and are presently serving as invaluable germplasm resource for developing drought-tolerant PVA-rich hybrids in several national and international breeding programs [20]. In SSA, hybrid development and commercialization are the major focus of many breeding programs owing to the superior performance of hybrids over open pollinated varieties (OPVs). When new hybrids are developed, it is important to understand their responses to drought in multiple locations to identify tolerant hybrids for commercialization. To achieve this goal, a good selection strategy is required.
Plant breeders usually develop new genotypes with superior performance by combining several desirable traits in these new genotypes [21]. The main difficulties that frequently prevent breeders from selecting optimal genotypes using this approach are a definition of the economic value of such traits and converting these into realistic economic weights [22]. These have been the major drawbacks of the commonly used the multiple-trait base index (MBI) method. To overcome these limitations, a multivariate selection index, the multi-trait genotype–ideotype distance index (MGIDI) has been developed [21]. This index takes multicollinearity into account and identifies all variables that should be taken into account to lead to significant genetic gains from selection [21]. Using this selection approach will enable maize breeders to identify genotypes that combine high yield potential with valuable characters conditioning drought tolerance to mitigate the effects of drought on maize production in SSA. This study was conducted to (i) assess the performance of newly developed multiple stress-tolerant extra-early orange hybrids under managed drought and well-watered research conditions, (ii) compare the selection outcomes resulting from the use of the MBI and the MGIDI, and (iii) identify outstanding drought-tolerant and stable hybrids across drought stress and well-watered environments.

2. Materials and Methods

2.1. Genetic Material

In an effort by the IITA Maize Improvement Program (MIP) to develop multiple-stress-tolerant and/or -resistant, extra-early maturing cultivars with elevated levels of PVA for farmers in SSA, the extra-early Striga-resistant cultivar, 2004 TZEE-Y STR C4 was crossed to Syn-Y-STR-34-1-1-1-1-2-1-B-B-B-B-B/NC354/SYN-Y-STR-34-1-1-1 (OR1) that possess high levels of PVA, in 2007. This was aimed at incorporating genes conditioning high β-carotene into 2004 TZEE-Y STR C4. The resulting F1 from this cross was taken through a generation of backcrossing with 2004 TZEE-Y STR C4 to retrieve the recurrent parent genome (2004 TZEE-Y STR C4). From the resulting BC1 generation, kernels with a deep orange color were targeted for selection and advanced to F2 and F3 through inbreeding. At F3, the lines characterized by intense orange coloration were selected for recombination to form the extra-early PVA-rich cultivar 2009 TZEE-OR1 STR. This broad-based cultivar was evaluated for under artificial Striga infestation and managed drought since 2010 and has shown outstanding performance. The cultivar represent the first extra-early PVA maize germplasm from where the first set of PVA inbreds development was initiated in 2011. As of 2014, a total of 224 S6 inbreds characterized by a deep orange color were successfully extracted from this broad-based population. The new inbreds were evaluated under managed drought during the minor seasons of 2014 and 2015. Following the performance assessment under managed drought, the inbreds were advanced to S7 and S8 and kernels from the S8 were sampled for PVA analysis in the laboratory at the Food and Nutrition Laboratory of IITA, Ibadan [20]. After the generation of the PVA inbred lines from the extra-early PVA cultivar 2009 TZEE-OR1 STR, a new set of PVA inbred lines was generated from the biparental populations of TZdEEI 12 × TZdEEI 95 and TZdEEI 7 × TZdEEI 12. The F1 hybrids from these crosses were advanced through several cycles of repeated inbreeding and selection based on a deep orange kernel color. At the S5 stage, selected lines were evaluated under combined heat and drought stress at Kadawa (Nigeria) in 2021 (Badu-Apraku Unpublished). Based on the performance, 27 inbred lines (11 from TZdEEI 12 × TZdEEI 95 and 16 from TZdEEI 7 × TZdEEI 12) were selected. These inbred lines plus nine other inbred lines extracted from 2009 TZEE-OR1 STR (making a total of 36 inbred lines) and five drought-tolerant inbred testers, are the genetic materials used for the development of the new orange hybrids evaluated in this study. The pedigree information of the inbreds is presented in Table S1.

2.2. Generation of Crosses

The 36 extra-early PVA inbred lines were crossed to the 5 drought-tolerant PVA testers using the line by tester (L × T) design to generate 180 testcrosses at IITA-Ikenne breeding nursery in 2021. In addition, the testers were crossed in a Diallel fashion to generate 10 hybrids, which were added to the testcross hybrids for this study. A total of 6 extra-early normal yellow endosperm hybrids were included as checks to make 196 hybrids.

2.3. Field Evaluation

The 196 orange hybrids were evaluated for agronomic performance at Ikenne (7°52′ N, 30°44′ E, 61 m a.s.l., 1200 mm mean annual precipitation) under managed drought during the dry seasons (November to February) of 2021–2022 and 2022–2023 and under well-watered conditions during the rainy seasons (June to September) of 2022 and 2023. The managed drought experiment was achieved by supplying 17 mm of sprinkler irrigation water per week up to 25 days after sowing. The plants were allowed to depend on the available soil moisture to reach physiological maturity. Plots consisted of single rows, each 3 m long, with inter- and intra-row spacing of 0.75 and 0.40 m, respectively. Three seeds were sowed per hole and the seedlings were thinned to two plants per hill two weeks after sowing to give a final plant population density of 66,666 plants/ha. A 14 × 14 lattice design with two replications was used for each experiment. Compound fertilizer, NPK 15:15:15, was applied at sowing at the rate of 60 kg/ha of N, P, and K for managed-drought conditions while a similar rate of application was applied at 2 weeks after sowing (WAS) for well-watered conditions. Top-dressing was performed using urea (46% N) at the rate of 30 kg/ha N at 3 WAS for managed-drought conditions and 5 WAS for well-watered conditions. Weed control was achieved with the application of an herbicide formulation containing gramoxone and primextra at the rate of 5 L/ha as pre-emergence while subsequent weed control was by hand weeding.

2.4. Data Collection

Observations were made on grain yield (GY), days to 50% anthesis (DA), days to 50% silking (DS), anthesis–silking interval (ASI), plant height (PHT), ear height (EHT), ear per plant (EPP), plant aspect (PASP), ear aspect (EASP), stay green characteristic (STGC), and husk cover (HCV) as described in Table 1.

2.5. Data Analysis

Combined analysis of variance (ANOVA) was conducted for each of the research conditions using the mixed linear model (MLM) (Equation (1)) implemented in lmerTest package in R software 4.3.1 [23]. In the MLM, a combination of year and research condition (managed drought or well-watered) was considered as an environment. Thus, four environments namely, WW_22 (well-watered 2022), WW_23 (well-watered 2023), DS_22 (managed drought 2022), and DS_23 (managed drought 2023) were involved. Environment, block, and replications were considered as random effects while genotype was considered as fixed effect. The model for the analysis of variance is expressed as:
Y = µ + Rep + Rep (Blk) + G + E + G × E + e
where Y = phenotype; µ = mean of the trait; G = genotype; E = environment; Rep = replication; Rep (Blk) = replication nested in block; G × E = genotype by environment interaction; e = residual.
The best linear unbiased predictions (BLUPs) under both research conditions were estimated from the ANOVA. The estimates were used to compute Pearson phenotypic correlation between grain yield and other traits under each research condition and between research conditions using the metan package v.1.18 [24]. The MGIDI proposed by Olivoto and Nardino [21] was used to select maize hybrids that combine drought-tolerant adaptive traits and high yield. The MGIDI is based on four principles namely (i) traits rescaling to ensure they have a 0–100 range, (ii) accounting for correlation structure and dimensionality reduction in the data, (iii) using desired traits value to plan ideotype, and (iv) computing the distance between the planned ideotype and the genotype.
Traits rescaling was performed using the equation below
r X i j = ŋ n j ŋ o j φ n j φ o j θ i j y n j + y n j
where φoj and ηoj represent the original minimum and maximum values of the jth trait of interest; φnj and ηnj are the new minimum and maximum values for jth trait of interest after rescaling; and θij is the original value for jth trait of interest for the ith genotype.
The values for ŋ n j and φ n j were chosen in a manner that for traits in which negative gains are desired, ŋ n j = 0 and φ n j = 100 was used while for traits where positive gains are desired, ŋ n j = 100 and φ n j = 0. In the final rescaled table ( r X i j ), the column has a 0–100 range.
Following traits rescaling, explanatory factor analysis was carried out. The rescaled values were first used to group correlated traits into factors before the factorial scores were estimated for the traits using Equation (3) below.
X = μ + L f + e
where X is a p × 1 vector of the observations that were rescaled; μ is a p × 1 vector of the standardized means; L is a p × f matrix of the factorial loadings; f is a p × 1 vector of the common factors; and e is a p × 1 vector of error.
For p and f, which represent the number of traits and common factors retained, respectively, the correlation matrix of the rescaled values was used to generate the eigen values and eigen vectors. For the initial loadings, factors with eigen values higher than one were considered before the varimax rotation criteria was implemented for analytic rotation and estimation of final loadings according to (Kaiser) [25]. The final scores were obtained using Equation (4) below:
F = Z   A T R 1 T
where F is a g × f matrix with the factorial scores; Z is a g × p matrix with the rescaled means; A is a p × f matrix of canonical loading, and R is a p × p correlation matrix between the traits. The g, f, and p represent the number of genotypes, the factor kept, and the traits measured, respectively.
Ideotype planning was performed such that the ideotype has the highest rescaled value of 100 for all the analyzed traits. The MGIDI was finally estimated using Equation (5).
M G I D I = i = 1 f Y i j Y j 2 0.5
where the MGIDI is the multi-trait genotype–ideotype distance index for the ith genotype; Yij is the score of the ith genotype in the jth factor being g and f; and Yj is the jth score of the ideotype.
From the above equation, the lower the MGIDI score of a genotype, the closer the genotype is to the ideotype. Thereafter, the proportion of the MGIDI of the genotypes explained by the correlated factor is used to display the strengths and weaknesses of the genotypes based on Equation (6).
w i j = D i j 2 i = 1 f D i j 2
where w i j is the proportion of the MGIDI of the ith genotypes explained by the correlated jth factor; D i j 2 is the distance between the ith genotype and the ideotype for the jth factor.
Data processing and the computation of the index were carried out using the Metan package in R [24].
To ascertain the effectiveness of the MGIDI, the results obtained from the latter were compared to those from a multiple-trait base index (MBI) proposed by Badu-Apraku et al. [26] that incorporates grain yield, plant and ear aspects, stay green characteristic, number of ears per plant, plant and ear height, husk cover, and anthesis–silking interval. The MBI has been used for the selection of hybrids that combine drought tolerance with outstanding yield performance based on Equation (7) below:
MBI = (2 × GY) + EPP + PHT + EHTPASPEASPASISTGCHCV
where MBI = multiple-trait base index, GY = grain yield, EPP = ear per plant, PASP = plant aspect, EASP = ear aspect, ASI = anthesis–silking interval, STGC = stay green characteristic, HCV = husk cover, PHT = plant height, and EHT = ear height.
The traits used in the MBI were standardized to reduce the effects of different scales of the traits. A positive MBI value indicates tolerance to drought while a negative value indicates susceptibility to drought. Yield reduction attributable to drought stress was estimated using Equation (8).
Y i e l d   r e d u c t i o n   ( Y R   % ) = y i e l d   u n d e r   w e l l w a t e r e d y i e l d   u n d e r   m a n a g e d   d r o u g h t c o n d i t i o n s y i e l d   u n d e r   w e l l w a t e r e d   c o n d i t i o n s × 100
Forty hybrids from the MGIDI selection comprising the 20 best, 10 average, and 10 worst performers were selected for GGE biplot analysis using Metan. The “mean vs. stability” view of the GGE biplot was used to determine hybrids with stable and high grain yields across managed drought and well-watered research conditions. The data were neither transformed nor standardized and were environment centered. The model for the GGE biplot is shown in Equation (9) below:
YijYj = λ1εi1ηj1 + λ2εi2ηj2 + εij
where Yij is the average yield of ith genotype in jth environment, Yj is the average yield across genotypes in environment j, λ1 and λ2 are the singular values for principal components I and II, respectively, εi1 and εi2 are the scores of the ith genotype for the principal components I and II, ηj1 and ηj2 are the scores of the jth genotype for the principal components I and II, and εij is the error associated with the ith genotype in jth environment.
Drought susceptibility index was calculated for the 196 hybrids to assess the tolerance of the 196 hybrids using performance based on grain yield alone according to [27] as shown below.
D S I = 1 ( Y M D Y W W ) 1 ( X M D X W W )
where DSI: drought susceptibility index; YMD: grain yield under managed drought; YWW: grain yield under well-watered conditions; XMD: mean of grain yield under managed drought; XWW: mean of grain yield under well-watered conditions.

3. Results

3.1. Analysis of Variance for Grain Yield and Other Traits under Managed Drought and Well-Watered Conditions

The ANOVA results across well-watered conditions presented in Table 2 revealed significant (p < 0.05) genotype mean squares for all traits except EASP. Environment mean square was significant (p < 0.05) for GY, ASI, PASP, and EPP. Under managed drought, a significant (p < 0.001) genotype mean square was observed for all traits. The environment mean square was significant (p < 0.05) for ASI and HCV, while genotype x environment mean square was significant for ASI, PHT, EPP, and STGC (Table 3).

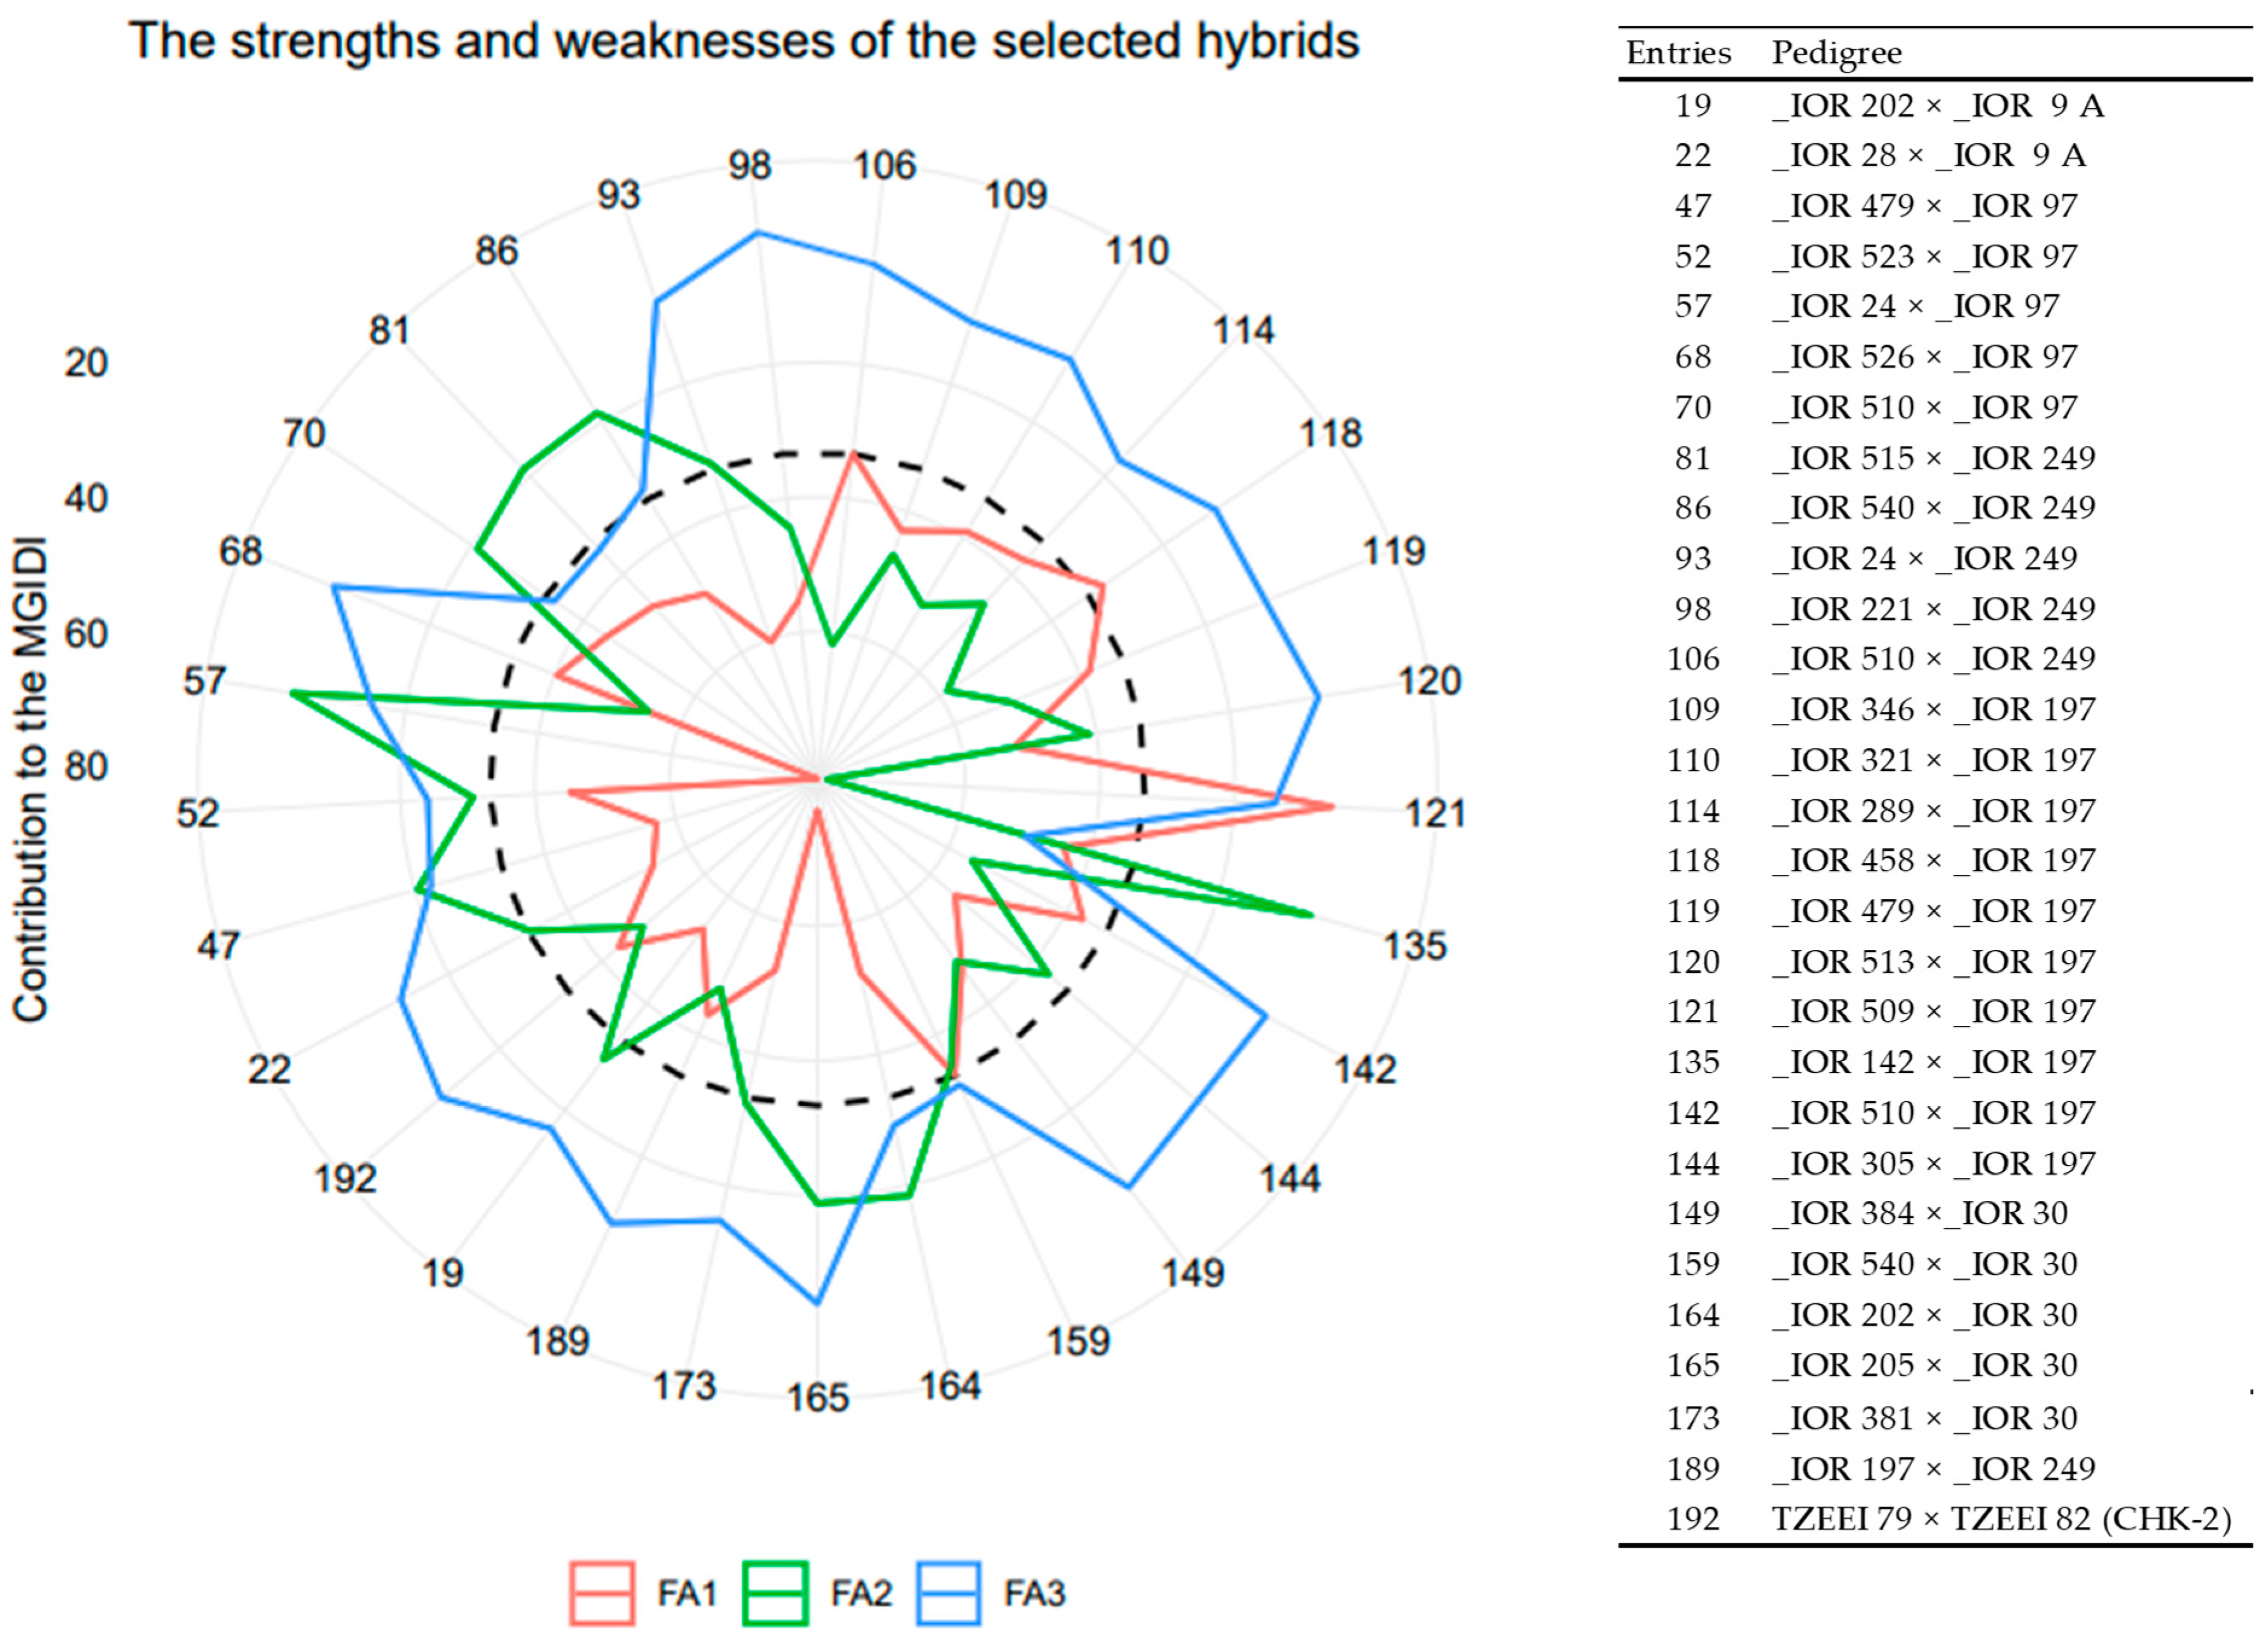
3.2. Selection of Outstanding Orange Hybrids with Drought Tolerance Using the MGIDI Selection Method

The MGIDI partitioned the measured traits into three factors. The first factor (FA1) was correlated with GY, EPP, PASP, EASP, EPP, ASI, and STGC. The second factor (FA2) was associated with HCV while the third factor (FA3) was correlated with PHT and EHT. All the measured traits showed desirable predicted gains from selection observed in the sense of selection and perfect goal. Generally, the MGIDI provided a total predicted gain from selection of 11.96% for traits for which higher positive expression was desirable and −16.65% for traits for which higher negative expression was desirable (Table 4). Using a selection intensity of 15%, 29 hybrids comprising 28 new hybrids and one commercial check (TZEEI 79 × TZEEI 82) were selected as drought-tolerant hybrids (Figure 1 and Table S2). Of the selected testcross hybrids, 10 hybrids (34%) were developed from crosses involving the tester TZEEIOR 197. The best five hybrids based on the MGIDI were TZEEIOR 510 × TZEEIOR 97, TZEEIOR 510 × TZEEIOR 249, TZEEIOR 321 × TZEEIOR 197, TZEEIOR 384 × TZEEIOR 30, and TZEEIOR 458 × TZEEIOR 197. Similarly, the worst five hybrids were TZEEIOR 523 × TZEEIOR 9A, TZEEIOR 221 × TZEEIOR 9A, TZEEIOR 24 × TZEEIOR 30, TZEEIOR 41 × TZEEIOR 30, and TZEEIOR 45 × TZEEIOR 30 (Table S2).
The result of the analysis to unmask the strengths and weaknesses of the selected extra-early maize hybrids is presented in Figure 2. In this figure, the proportion of each factor to the MGIDI accounts for the strengths and weaknesses. The red, green, and blue lines represented the three factors, and the factor protruding the most to a genotype is indicated as the strength of the genotype. Based on this, entry 121 had strength for FA1, which is correlated to GY, EASP, PASP, EPP, and STGC. Entries 135, 86, 81, 70, 57, 47, and 164 had strength for FA2, which is correlated to PHT and EHT. Entries 22, 192, 19, 189, 173, 165, 159, 149, 144, 142, 120, 119, 118, 114, 110, 109, 106, 98, 93, 68, and 52 showed strength for FA3, which is correlated to ASI and HCV (Table 5 and Figure 2).

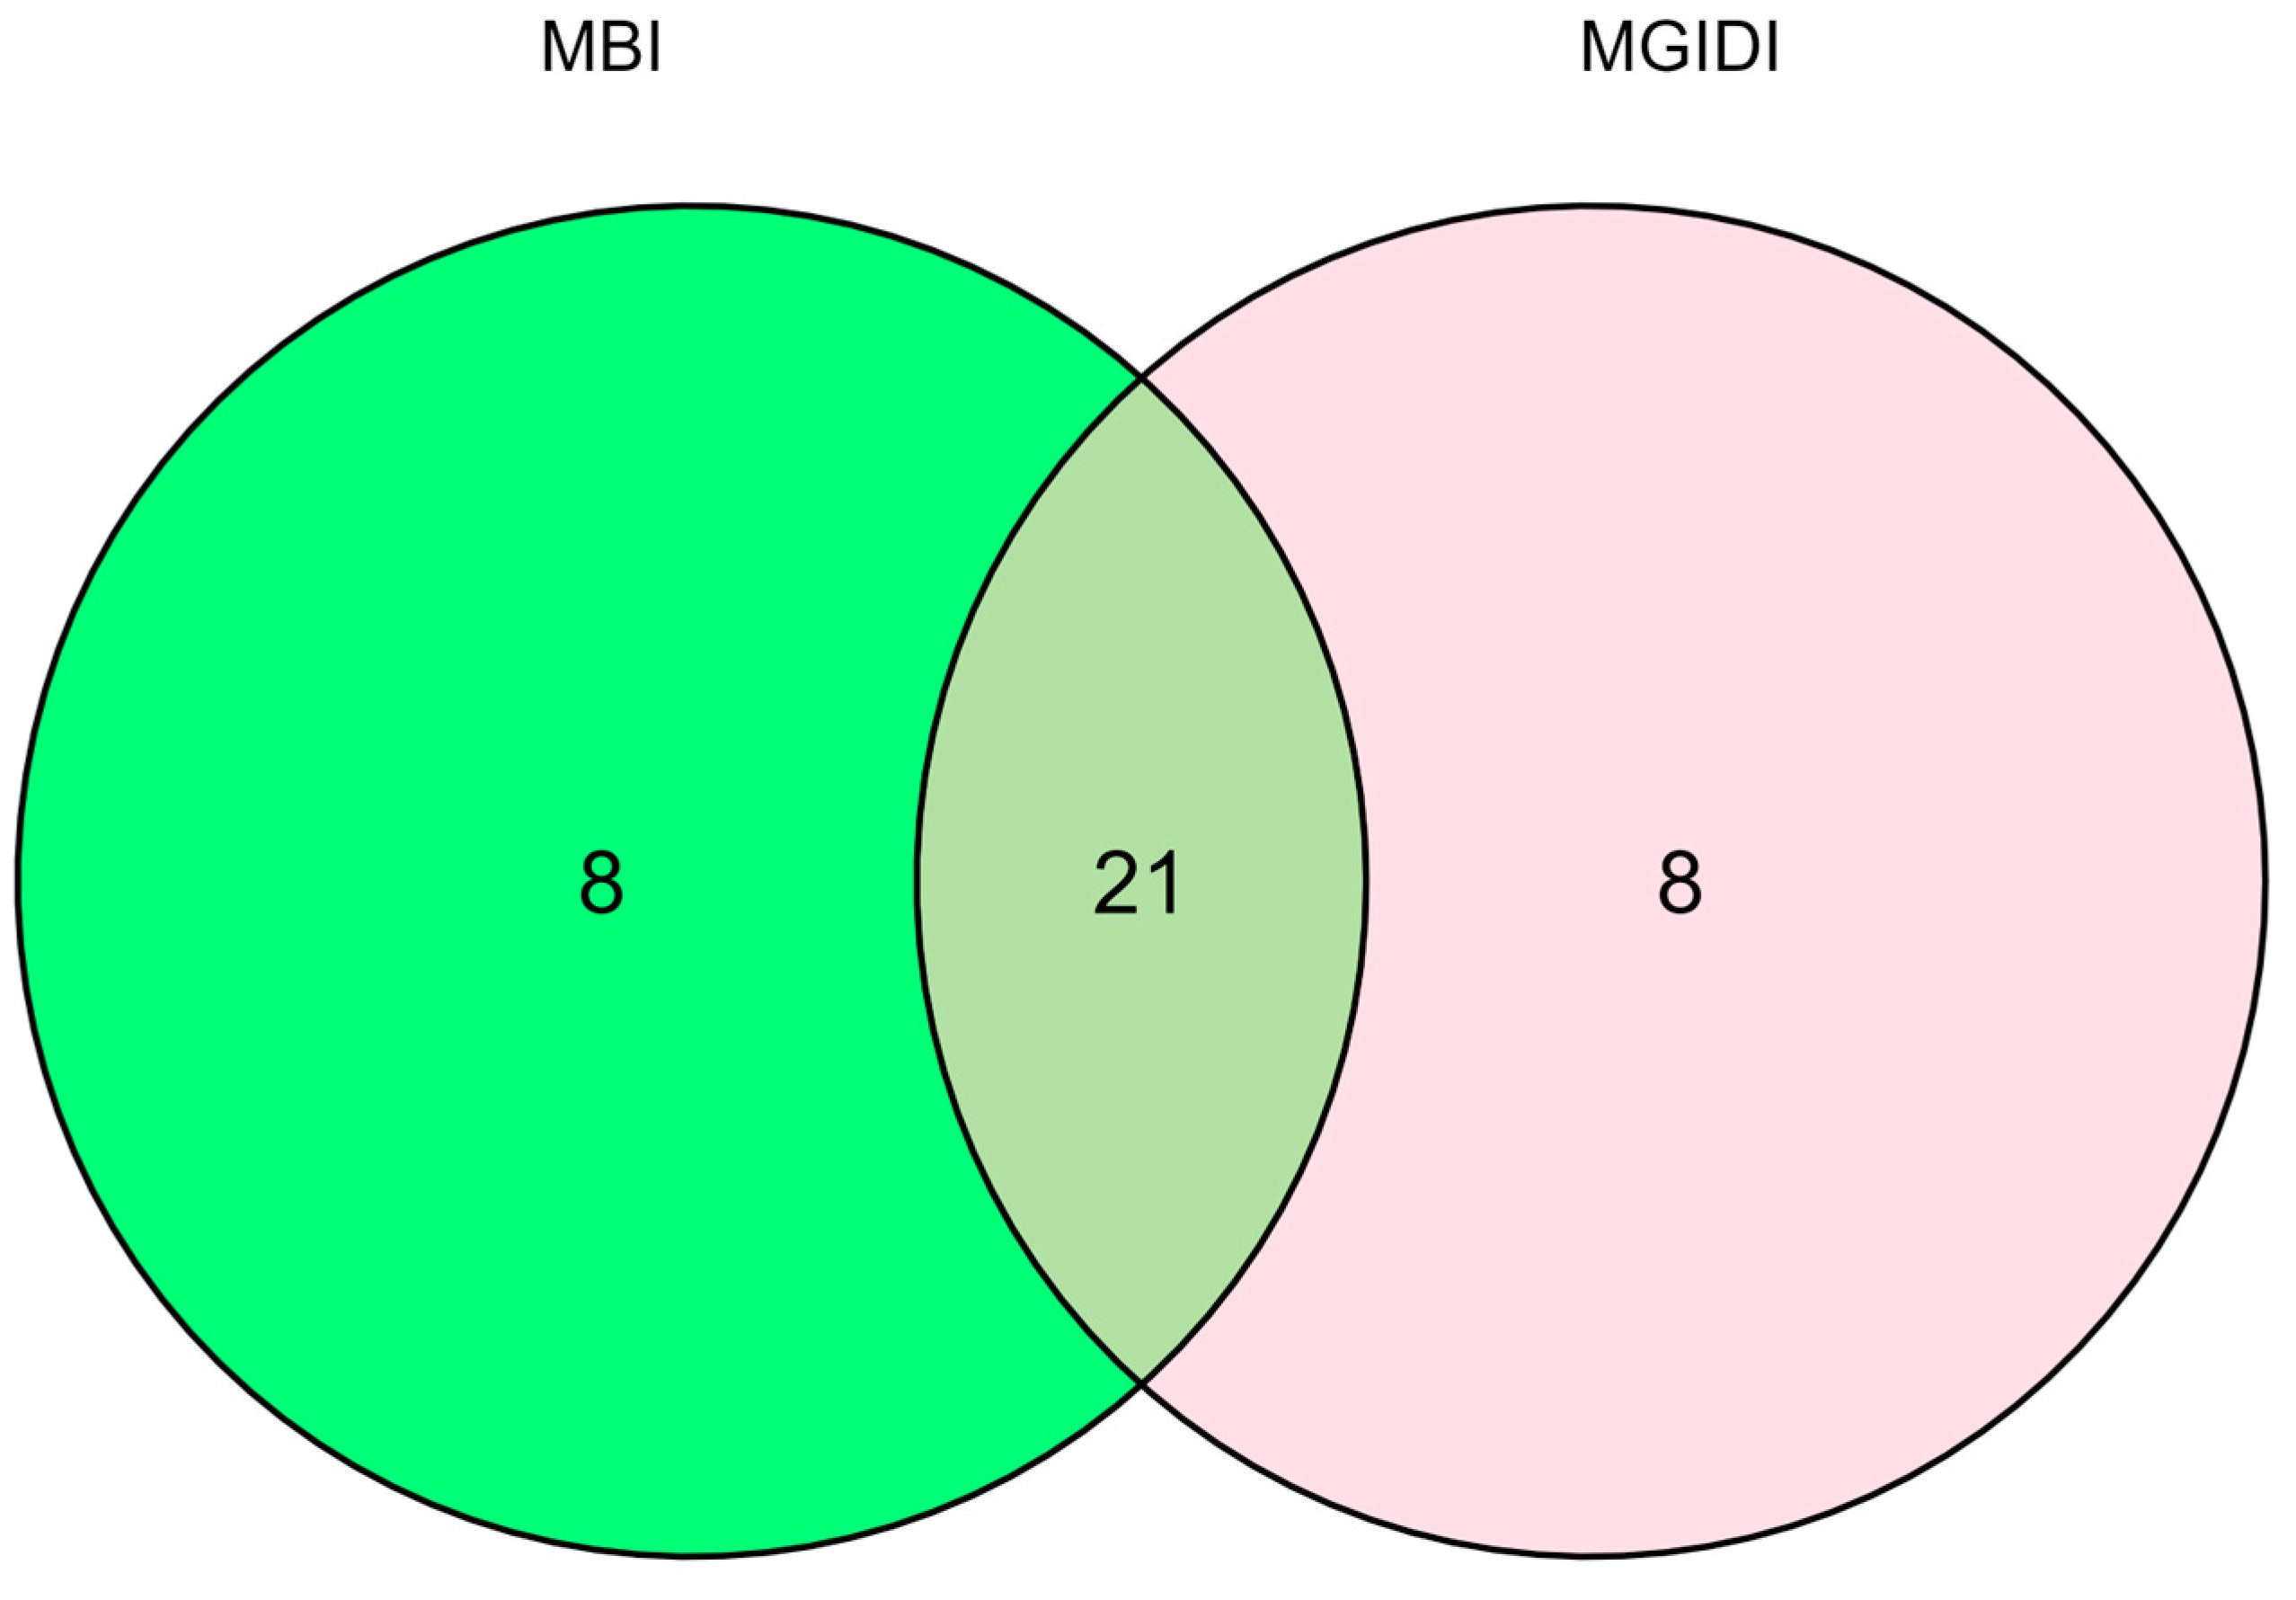
3.3. Selection of Drought-Tolerant Hybrids Using the Base Index Derived from Multiple Traits

Based on the multiple-trait base index (MBI) that integrated grain yield, plant aspect, ear aspect, anthesis–silking interval, stay green characteristic, ears per plant, plant height, ear height, and husk cover, 99 hybrids had positive selection base indices. The positive selection base index varied from 0.06 for Entry 150 to 15.93 for Entry 121. Three checks (TZEEI 79 × TZEEI 82, TZdEEI 1 × TZdEEI 12, and TZEEIY Pop STR C5 × TZEEI 58) were identified as drought-tolerant hybrids among the six checks used in this study. The best five top-performing hybrids under managed drought stress were hybrids TZEEIOR 509 × TZEEIOR 197, TZEEIOR 458 × TZEEIOR 197, TZEEIOR 510 × TZEEIOR 30, TZEEIOR 510 × TZEEIOR 97, and TZEEIOR 510 × TZEEIOR 249. Three of these five hybrids, namely TZEEIOR 510 × TZEEIOR 97, TZEEIOR 510 × TZEEIOR 249, and TZEEIOR 458 × TZEEIOR 197, were also identified to be superior for drought tolerance using the MGIDI procedure. The five worst hybrids under managed drought were hybrids TZEEIOR 41 × TZEEEIOR 30, TZEEIOR 24 × TZEEIOR 30, TZEEIOR 221 × TZEEIOR 9 A, TZEEIOR 45 × TZEEIOR 30, and TZEEIOR 525 × TZEEIOR 97 (Table S3). The selected hybrids from the MGIDI were included in the list of the hybrids identified as drought–tolerant using the MBI without consideration for selection intensity. However, when 15% selection intensity was applied as performed for the MGIDI, 21 of 29 hybrids (72%) selected were similar to the selection results from the MGIDI (Figure 3).

3.4. Yield Performance and Grain Yield Reduction under Drought

Under drought stress condition, grain yield ranged from 198 kg/ha for hybrid TZEEIOR 41 × TZEEIOR 30 to 4044 kg/ha for TZEEIOR 509 × TZEEIOR 197 with an average of 2139 kg/ha. The best-yielding hybrid (TZEEIOR 509 × TZEEIOR 197) had 34% higher grain yield than the best check (TZEEI 79 × TZEEI 82) that had a grain yield of 3015 kg/ha. Under well-watered condition, grain yield varied from 1251 kg/ha for TZEEIOR 28 × TZEEIOR 30 to 7455 kg/ha (TZEEIOR 509 × TZEEIOR 197) with a mean of 5568 kg/ha. The best check (TZEEIOR 12 × TZEEIOR 223) had a grain yield of 5732 kg/ha, which translates to 30% grain yield reduction compared to the best hybrid (Table S4).
In general, the grain yield reduction in the hybrids under managed drought stress compared with that of the well-watered conditions varied from 35% for TZEEIOR 321 × TZEEIOR 249 to 89% for TZEEIOR 41 × TZEEEIOR 30 with an average of 61%. The grain yield reduction in the selected drought-tolerant hybrids from the MGIDI under drought compared to that of the well-watered varied from 36% for the check hybrid TZEEI 79 × TZEEI 82 to 69% for TZEEIOR 202 × TZEEIOR 9A. In addition, 10 (~35%) and 26 (~90%) hybrids from the MGIDI selection had better performance than the selected commercial check under managed drought and well-watered conditions, respectively. The yield advantage of the hybrids with better performance than the selected check was 12 and 33% under managed drought and well-watered conditions, respectively. For the selected hybrids from the MBI, grain yield reduction varied from 35% for TZEEIOR 321 × TZEEIOR 249 to 62.71% for TZEEIOR 510 × TZEEIOR 197. Furthermore, 16 (~55%) and 27 (~93%) hybrids from the MBI selection had better performance than the selected commercial check under managed drought and well-watered conditions, respectively (Table 6). Considering hybrids grain yield potential under managed drought and well-watered conditions alone, 25 of 29 hybrids selected by the MGIDI had drought susceptibility index (DSI) estimates lower than the average DSI of the hybrid population (0.99). When similar observation was made for the MBI, 26 of 29 hybrids had DSI estimates lower than the average DSI of the hybrid population (Table 5 and Table S2).
Drought stress reduced PHT by 17%, EHT by 9%, EPP by 22%, DP by 2%, but increased ASI by 181%, DS by 0.2%, HCV by 7%, PASP by 25%, and EASP by 11% (Table S5).

3.5. Stability Analysis of Forty Orange Hybrids Comprising Best, Average, and Worst Performing Genotypes across All Environments

The GGE biplot view of the 40 extra-early provitamin A hybrids comprising the 20 best, 10 average, and 10 worst performing hybrids from the MGIDI selection analyzed for performance stability is presented in Figure 4. Approximately 95% of the variability in grain yield of the orange hybrids was accounted for by the first two principal components.
The best-yielding and most stable extra-early provitamin A hybrids were identified using the “mean vs. stability” biplot view across the test environments. The vertical line passing through the biplot origin is the average tester coordinate (ATC) which separates the hybrids based on yield performance. The more the distance between the hybrid and the ATC to the left, the better the yield performance of the hybrid and vice versa. The length of the hybrid projection from the ATC abscissa (horizontal line) determines their stability. The shorter the projection, the more stable the hybrid and vice versa. Based on these criteria, the five top-yielding hybrids across the test environments in descending order included TZEEIOR 509 × TZEEIOR 197, TZEEIOR 510 × TZEEIOR 97, TZEEIOR 458 × TZEEIOR 197, TZEEIOR 510 × TZEEIOR 197, and TZEEIOR 540 × TZEEIOR 30. The most stable hybrids, however, were TZEEIOR 510 × TZEEIOR 197, TZEEIOR 384 × ZEEIOR 30, TZEEIOR 515 × TZEEIOR 249, TZEEIOR 526 × TZEEIOR 97, TZEEIOR 479 × TZEEIOR 197, and TZEEIOR 458 × TZEEIOR 197. From this result, only hybrids TZEEIOR 510 × TZEEIOR 197 and TZEEIOR 458 × TZEEIOR 197 combine high-yielding character with high stability across the test environment (Figure 4).

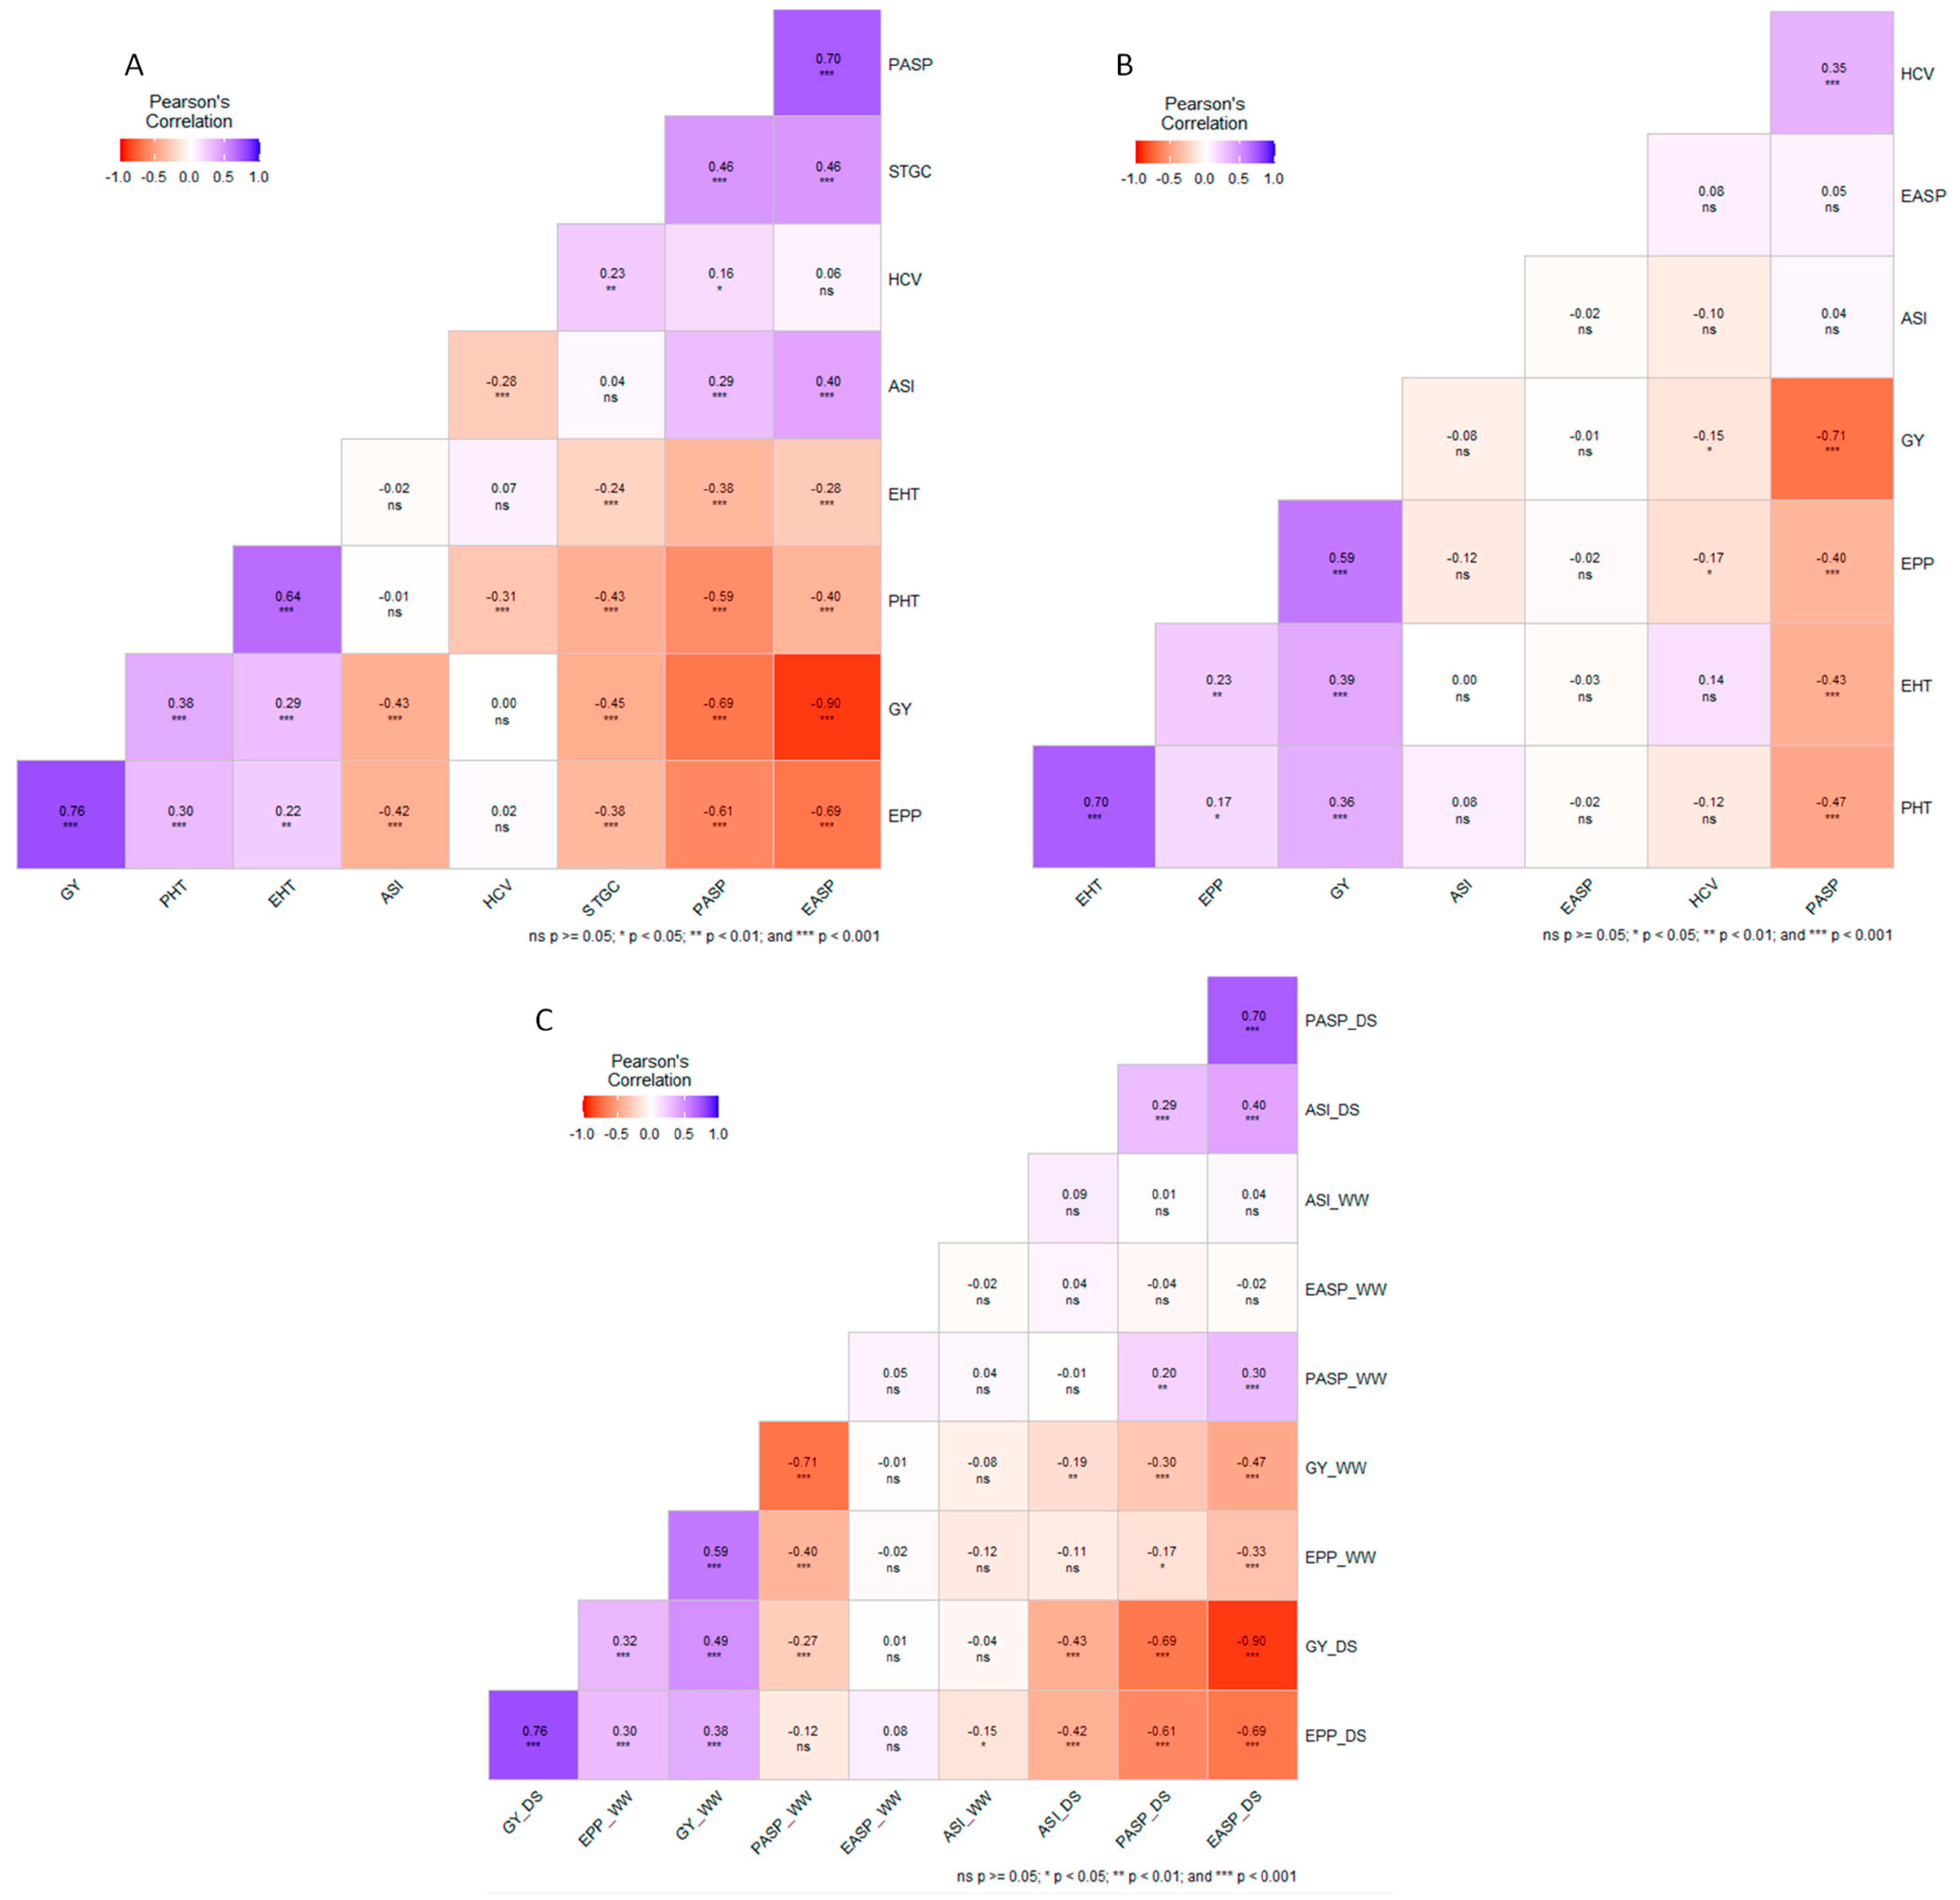
3.6. Phenotypic Correlations among Measured Traits under Managed Drought, Well-Watered, and across Research Conditions

The relationships among measured traits in each of the managed drought and well-watered conditions and across both research conditions are presented in Figure 5. Across managed drought environments, GY had a significant (p < 0.001) positive correlation with EPP (0.76), EHT (0.29), and PHT (0.38) and a significant (p < 0.001) negative correlations with EASP (−0.90), PASP (−0.69), STGC (−0.45), ASI (−0.43) (Figure 5A). Under well-watered conditions, significant (p < 0.001) positive correlations were obtained between GY and EHT (0.39), PHT (0.36), and EPP (0.59) while significant negative correlations were found between grain yield one hand and PASP (r = −0.71, p < 0.001,) and HCV (r = −0.15, p < 0.05) on the other (Figure 5B). Grain yield under managed drought and well-watered conditions had positive correlated (r = 0.49, p < 0.001,). EPP under managed drought had a significant and positive correlation with EPP under well-watered conditions (r = 0.30, p < 0.001) and PASP under managed drought showed significant positive correlation with PASP under well-watered conditions (r = 0.2, p < 0.01) (Figure 5C).

4. Discussion

Genetic variability is crucial for the improvement of desired traits in crop improvement programs [28,29,30]. Significant genotype mean squares observed for grain yield and other traits under the contrasting research conditions was indicative of the presence of genetic variability among the extra-early orange hybrids under managed drought and well-watered conditions. These results provide a basis for rapid genetic gains from selection and identification of hybrids with desirable traits for each research condition [31,32]. Significant environment mean squares observed for anthesis–silking interval and husk cover under managed drought indicated that the difference in environmental conditions that prevailed in the two years of evaluation affected these traits [33]. A similar trend of results was observed for grain yield, anthesis–silking interval, plant aspect, and ears per plant under well-watered conditions. The well-watered trials were carried out under rain-fed conditions. Considerable variation in rainfall occurs from year to year in Nigeria, even for the same site. Consequently, evaluation in several years is necessary, to expose materials being evaluated to the possible variation in rainfall, towards ensuring that materials that are selected are productive under wide rainfall regimes. Significant genotype x environment mean squares observed for anthesis–silking interval, plant height, ears per plant, and stay green characteristic under managed drought indicated that the genotypes response pattern differ under the two managed drought environments considered in this study. In contrast, the lack of significant environment and genotype x environment interaction mean squares for grain yield indicate that the relative performances of the genotypes were stable under the managed drought condition investigated. This is also true for the well-watered condition for which the mean squares for genotype by environment interactions were not significant. These results indicate that plant traits differ in their response to environmental conditions.
In the present study, both the MGIDI and the MBI were each used to identify 29 genotypes combining drought tolerance with high yield. Of the selected genotypes from both selection procedures, 72% similarity was observed. As reported by several authors [21,24,34,35], the multiple-trait base index is usually affected by multicollinearity of traits which in turn affects the efficiency of selection. The MGIDI is, however, not affected by traits multicollinearity making it a better selection procedure when ideotype design is of major interest. In addition, the MGIDI provides knowledge of the strengths and weaknesses of selected ideotype, which could guide plant breeders in identifying traits for further improvement. The MGIDI has been used to develop climate-resilient maize hybrids through the development of better selection approaches and optimization of breeding strategies [36]. Improvement in crop performance, the goal of all plant breeding programs, is usually pursued through the assembly in new varieties of genes for various desirable plant traits associated with high grain productivity [37]. The selected 29 drought-tolerant orange hybrids from the MGIDI comprised of 28 new hybrids and one commercial check. The 10 and 26 hybrids ranked above this commercial check under managed drought and well-watered conditions have an average yield advantage of 12% and 33%, respectively. These hybrids show promise for commercialization in SSA, as they are not only drought-escape as being extra-early genotypes, but also have the inherent ability to withstand drought occurring during the growing season. These hybrids could also be useful for developing open-pollinated varieties, three-way and double cross hybrids for drought-prone areas in SSA. Ten hybrids from those selected by the MGIDI had the tester TZEEIOR 197 as a parent. In a previous study [38], this tester was reported as an outstanding inbred line with positive and significant general combining ability effects for grain yield under drought. These results indicate TZEEIOR 197 to possess genes for drought tolerance as well as show it as an excellent combiner that could be used for the development of more drought-tolerant extra-early orange hybrids. In the present study, the superior combining ability was further demonstrated by the fact that hybrid combinations involving this tester were more in number than those from any other inbred tester among the selected hybrids combining drought tolerance with high yield.
Examination of the strengths and weaknesses of the MGIDI selected hybrids revealed hybrid TZEEIOR 509 × TZEEIOR 197 as the only genotype associated with the first factor. This factor correlates with high grain yield, increased ears per plant, and improved ear and plant aspects under drought conditions, an indication that this hybrid has desirable genes for these four traits under managed drought conditions. This provides a basis for its high grain yield under drought stress as well as under well-watered environments. Hybrids associated with the second factor could be selected and used as parent for plant and ear height improvement while hybrids associated to the third factor could be used as parent in a breeding program for the improvement of anthesis–silking interval and husk cover improvement. The initiation of three-way and double-cross hybridization program among these promising hybrids could further increase the number of hybrids with desired performance under drought stress.
In this study, the extended anthesis–silking interval combined with reduction in ears per plant, plant height, ear height and increased plant and ear aspects, and husk cover observed under drought stress contributed to the reduction in grain yield under drought. The imposed drought stress covered the flowering and grain filling periods. Increased anthesis–silking interval is known to increase the incidence of barrenness [39,40]. The grain yield loss obtained in the present study ranged from 35 to 89% with an average of 61% under managed drought conditions. These yield losses fall within the range reported by other authors [16,40,41,42,43]. The magnitude of grain yield reduction as a result of drought is known to depend on the duration and intensity of the drought stress [44,45,46,47].
Given that the occurrence of drought is unpredictable and crop varieties must optimize productivity under diverse environmental conditions, improved varieties must show outstanding and stable performance under both drought and well-watered conditions. Hybrids that showed these attributes in the present study and whose superior performances were stably expressed viz. TZEEIOR 509 × TZEEIOR 197, TZEEIOR 458 × TZEEIOR 197 and TZEEIOR 510 × TZEEIOR 97, have great potential for commercialization for cultivation in drought-prone environments and qualify for more extensive testing under diverse conditions.
Grain yield, plant aspect, and ears per plant under managed drought were correlated to the same traits under well-watered conditions, suggesting that the expression of these traits is governed by common genetic factors. Similar results have been reported by several authors [41,48,49]. The presence of strong associations between grain yield and ears per plant, plant and ear heights, anthesis–silking interval, plant and ear aspect, and the stay green characteristic under managed drought are indicative of potential of the latter for use as secondary traits in indirect selection in grain yield improvement. Similar results have been found by Bankole et al. [50]. These traits have been used to develop selection index for simultaneous improvement of grain yield and drought tolerance with considerable success [51,52] In the present study, the relationship between grain yield and anthesis–silking interval under well-watered conditions was not significant but significant under managed drought conditions. These results are consistent with the findings of Bolanos and Edmeades [53] and Bankole et al. [50] who reported that grain yield was weakly correlated to anthesis–silking interval under optimum condition but both are strongly correlated under moisture stress. Knowledge of trait correlations and how the relationships that they define change under contrasting research conditions is useful in guiding plant breeders in the implementation of a breeding program targeting improvements in one trait through improvement in another that is easier to measure [36,54].

5. Conclusions

The results of this study revealed significant genetic variability among the newly developed extra-early maturing orange hybrids. Some of the hybrids have considerable potential for mitigating food insecurity and reducing malnutrition in SSA. The inbred line TZEEIOR 197 possesses outstanding attributes for the development of extra-early provitamin A-rich hybrids for drought-prone environments in SSA. Both the multiple-trait base index and the multi-trait genotype–ideotype distance index selection outcome showed 72% similarity. The hybrids TZEEIOR 509 × TZEEIOR 197, TZEEIOR 458 × TZEEIOR 197 and TZEEIOR 510 × TZEEIOR 97 were identified as the most outstanding drought-tolerant hybrids based on the per se performance, yield stability analysis, and multiple-traits genotype–ideotype distance index. These hybrids should be further tested in multiple stress environments towards efforts to commercialize them in SSA. Additionally, the hybrids could be used as parents for population development and extraction of new and improved inbred lines for further development of new maize ideotypes for farmers in SSA.

Supplementary Materials

The following supporting information can be downloaded at: https://www.mdpi.com/article/10.3390/agronomy14040847/s1, Table S1: Pedigree information of the genetic materials used for this study; Table S2: Ranking of 196 hybrids using the multi-trait genotype–ideotype distance index (MGIDI); Table S3: Ranking of 196 hybrids using the multiple-trait base index (MBI); Table S4: Grain yield performance of 196 hybrids evaluated under managed drought and well-watered conditions at Ikenne during 2021–2022 and 2022–2023 the dry seasons and the 2022 and 2023 main seasons; Table S5: Trait reduction under managed drought compared to under well-watered conditions.

Author Contributions

Conceptualization, T.O.B., B.B.-A. and V.O.A.; methodology, T.O.B., B.B.-A. and I.I.A.; supervisions, B.B.-A. and V.O.A.; formal analysis, T.O.B. and I.I.A.; writing—original draft preparation, T.O.B.; writing—review and editing, B.B-A., V.O.A., I.I.A. and K.R.N. All authors have read and agreed to the published version of the manuscript.

Funding

This research was supported by the African Union through the doctoral program of the Pan African University Life and Earth Sciences Institute (PAULESI) granted to the first author and the Bill and Melinda Gates Foundation [BMGF, grant number OPP1134248].

Data Availability Statement

The datasets used in the present study have been deposited at the IITA CKAN repository.

Acknowledgments

The authors are grateful to the staff of the Maize Improvement Unit of the International Institute of Tropical Agriculture, Ibadan, Nigeria, the African Union Commission, and the African Development Bank through the Pan African University Life and Earth Science Institute (PAULESI) for providing funds for the research. The authors are also grateful for funding support from the Bill & Melinda Gates Foundation under the Accelerated Genetic Gain in Maize and Wheat (AGG) Projects.

Conflicts of Interest

The authors declare no conflict of interest.

References

  1. Shiferaw, B.; Prasanna, B.M.; Hellin, J.; Bänziger, M. Crops that feed the world. Past successes and future challenges to the role played by maize in global food security. Food Secur. 2011, 3, 307–327. [Google Scholar] [CrossRef]
  2. FAOSTAT. 2023. Available online: https://www.fao.org/faostat/en/#data/QCL (accessed on 20 March 2024).
  3. Kurilich, A.C.; Juvik, J.A. Quantification of carotenoid and tocopherol antioxidants in Zea mays. J. Agric. Food Chem. 1999, 47, 1948–1955. [Google Scholar] [CrossRef] [PubMed]
  4. Tien, L.D.; Duc, C.H.; Quynh, L.N. Improving nutritional quality of plant proteins through genetic engineering. Curr. Genom. 2016, 17, 220–229. [Google Scholar] [CrossRef] [PubMed]
  5. Villamor, E.; Fawzi, W.W. Vitamin A supplementation: Implications for morbidity and mortality in children. J. Infect. Dis. 2000, 182, S122–S133. [Google Scholar] [CrossRef] [PubMed]
  6. Sommer, A. Vitamin A deficiency and clinical disease: An historical overview. J. Nutr. 2008, 138, 1835–1839. [Google Scholar] [CrossRef]
  7. Semagn, K.; Beyene, Y.; Babu, R.; Nair, S.; Gowda, M.; Das, B.; Tarekegne, A.; Mugo, S.; Mahuku, G.; Worku, M.; et al. Quantitative trait loci mapping and molecular breeding for developing stress resilient maize for Sub-Saharan Africa. Crop Sci. 2015, 55, 1449–1459. [Google Scholar] [CrossRef]
  8. Cairns, J.E.; Hellin, J.; Sonder, K.; Araus, J.L.; MacRobert, J.F.; Thierfelder, C.; Prasanna, B.M. Adapting maize production to climate change in sub-Saharan Africa. Food Secur. 2013, 5, 345–360. [Google Scholar] [CrossRef]
  9. Kamara, A.Y.; Ewansiha, S.; Menkir, A. Assessment of nitrogen uptake and utilization in drought tolerant and Striga resistant tropical maize varieties. Arch. Agron. Soil Sci. 2014, 60, 195–207. [Google Scholar] [CrossRef]
  10. NeSmith, D.; Ritchie, J. Effects of soil water-deficits during tassel emergence on development and yield component of maize (Zea mays). Field Crops Res. 1992, 28, 251–256. [Google Scholar] [CrossRef]
  11. Menkir, A.; Akintunde, A.O. Evaluation of the performance of maize hybrids, improved open-pollinated and farmers’ local varieties under well-watered and drought stress conditions. Maydica 2001, 46, 227–238. [Google Scholar]
  12. Badu-Apraku, B.; Fontem, L.A.; Akinwale, R.; Oyekunle, M. Biplot analysis of diallel crosses of early maturing tropical yellow maize inbreds in stress and nonstress environments. Crop Sci. 2011, 51, 173–188. [Google Scholar] [CrossRef]
  13. Zia, R.; Nawaz, M.S.; Siddique, M.J.; Hakim, S.; Imran, A. Plant survival under drought stress: Implications, adaptive responses, and integrated rhizosphere management strategy for stress mitigation. Microbiol. Res. 2021, 242, 126626. [Google Scholar] [CrossRef] [PubMed]
  14. Jazayeri, S.M.; Torres, R.V. Genomic and transcriptomic approaches toward plant selection. J. Sci. Res. Rev. Cienc. Investig. 2017, 2, 54–64. [Google Scholar] [CrossRef]
  15. Campos, H.; Cooper, M.; Edmeades, G.O.; Löffler, C.; Schussler, J.R.; Ibañez, M. Changes in drought tolerance in maize associated with fifty years of breeding for yield in the U.S. corn belt. Maydica 2006, 51, 369–381. [Google Scholar]
  16. Grant, R.F.; Jackson, B.S.; Kiniry, J.R.; Arkin, G.F. Water deficit timing effects on yield components in maize. Agron. J. 1989, 81, 61–65. [Google Scholar] [CrossRef]
  17. Monteleone, B.; Borzí, I.; Bonaccorso, B.; Martina, M. Developing stage-specific drought vulnerability curves for maize: The case study of the Po River basin. Agric. Water Manag. 2022, 269, 107713. [Google Scholar] [CrossRef]
  18. Hwang, T.; Ndolo, V.U.; Katundu, M.; Nyirenda, B.; Bezner-Kerr, R.; Arntfield, S.; Beta, T. Provitamin A potential of landrace orange maize variety (Zea mays L.) grown in different geographical locations of central Malawi. Food Chem. 2016, 196, 1315–1324. [Google Scholar] [CrossRef] [PubMed]
  19. Beta, T.; Arntfield, S.; Noren, N.; Bezner-Kerr, R.; Katundu, M.; Ndolo, V.; Shumba, L. Proximate composition and carotenoid content of white, orange and yellow maize cereals grown in central and northern Malawi—Baseline information. In Proceedings of the 17th IUFoST World Congress of Food Science and Technology and EXPO, Montreal, QC, Canada, 17–21 August 2014. [Google Scholar]
  20. Badu-Apraku, B.; Fakorede, M. Advances in Genetic Enhancement of Early and Extra-Early Maize for Sub-Saharan Africa; Springer: Berlin/Heidelberg, Germany, 2017; 230p. [Google Scholar]
  21. Olivoto, T.; Nardino, M. MGIDI: Toward an effective multivariate selection in biological experiments. Bioinformatics 2021, 37, 1383–1389. [Google Scholar] [CrossRef] [PubMed]
  22. Bizari, E.H.; Unêda-Trevisoli, S.H.; Val, B.H.P.; Pereira, E.D.M.; Di Mauro, A.O. Selection indices for agronomic traits in segregating populations of soybean. Rev. Cienc. Agron. 2017, 48, 110–117. [Google Scholar] [CrossRef]
  23. Kuznetsova, A.; Brockhoff, P.B.; Christensen, R.H.B. lmerTest Package: Tests in Linear Mixed Effects Models. J. Stat. Softw. 2017, 82, 1–26. [Google Scholar] [CrossRef]
  24. Olivoto, T.; Lúcio, A.D. metan: An R package for multi-environment trial analysis. Methods Ecol. Evol. 2020, 11, 783–789. [Google Scholar] [CrossRef]
  25. Kaiser, H.F. The varimax criterion for analytic rotation in factor analysis. Psychometrika 1958, 23, 187–200. [Google Scholar] [CrossRef]
  26. Badu-Apraku, B.; Fakorede, M.A.B.; Oyekunle, M.; Akinwale, R.O. Selection of extra-early maize inbreds under low N and drought at flowering and grain-filling for hybrid production. Maydica 2011, 56, 29–42. [Google Scholar]
  27. Khatibi, A.; Omrani, S.; Omrani, A.; Shojaei, S.H.; Mousavi, S.M.N.; Illés, Á.; Bojtor, C.; Nagy, J. Response of maize hybrids in drought-stress using drought tolerance indices. Water 2022, 14, 1012. [Google Scholar] [CrossRef]
  28. Yue, H.; Wei, J.; Xie, J.; Chen, S.; Peng, H.; Cao, H.; Bu, J.; Jiang, X. A study on genotype-by-environment interaction analysis for agronomic traits of maize genotypes across Huang-Huai-Hai region in China. Phyton—Int. J. Exp. Bot. 2022, 91, 57–81. [Google Scholar] [CrossRef]
  29. Swarup, S.; Cargill, E.J.; Crosby, K.; Flagel, L.; Kniskern, J.; Glenn, K.C. Genetic diversity is indispensable for plant breeding to improve crops. Crop Sci. 2020, 61, 839–852. [Google Scholar] [CrossRef]
  30. Salgotra, K.R.; Chauhan, S.B. Genetic diversity, conservation, and utilization of plant genetic resources. Genes 2023, 14, 174. [Google Scholar] [CrossRef] [PubMed]
  31. Bhatnagar, S.; Betrán, F.J.; Rooney, L.W. Combining abilities of quality protein maize inbreds. Crop Sci. 2004, 44, 1997–2005. [Google Scholar] [CrossRef]
  32. Badu-Apraku, B.; Annor, B.; Oyekunle, M.; Akinwale, R.; Fakorede, M.; Talabi, A.; Akaogu, I.; Melaku, G.; Fasanmade, Y. Grouping of early maturing quality protein maize inbreds based on SNP markers and combining ability under multiple environments. Field Crops Res. 2015, 183, 169–183. [Google Scholar] [CrossRef]
  33. Bhadmus, O.A.; Badu-Apraku, B.; Adeyemo, O.A.; Ogunkanmi, A.L. Genetic analysis of early white quality protein maize inbreds and derived hybrids under low-nitrogen and combined drought and heat stress environments. Plants 2021, 10, 2596. [Google Scholar] [CrossRef]
  34. Graham, M.H. Confronting multicollinearity in ecological multiple regression. Ecology 2003, 84, 2809–2815. [Google Scholar] [CrossRef]
  35. Olivoto, T.; de Souza, V.Q.; Nardino, M.; Carvalho, I.R.; Ferrari, M.; de Pelegrin, A.J.; Szareski, V.J.; Schmidt, D. Multicollinearity in Path Analysis: A Simple Method to Reduce Its Effects. Agron. J. 2017, 109, 131–142. [Google Scholar] [CrossRef]
  36. Singamsetti, A.; Zaidi, P.H.; Seetharam, K.; Vinayan, M.T.; Olivoto, T.; Mahato, A.; Madankar, K.; Kumar, M.; Shikha, K. Genetic gains in tropical maize hybrids across moisture regimes with multi-trait-based index selection. Front. Plant Sci. 2023, 14, 1147424. [Google Scholar] [CrossRef]
  37. Pour-Aboughadareh, A.; Sanjani, S.; Nikkhah-Chamanabad, H.; Mehrvar, M.R.; Asadi, A.; Amini, A. Identification of salt-tolerant barley genotypes using multiple-traits index and yield performance at the early growth and maturity stages. Bull. Natl. Res. Cent. 2021, 45, 117. [Google Scholar] [CrossRef]
  38. Badu-Apraku, B.; Fakorede, M.; Talabi, A.; Oyekunle, M.; Aderounmu, M.; Lum, A.; Ribeiro, P.; Adu, G.; Toyinbo, J. Genetic studies of extra-early provitamin-A maize inbred lines and their hybrids in multiple environments. Crop Sci. 2020, 60, 1325–1345. [Google Scholar] [CrossRef] [PubMed]
  39. Edmeades, G.O.; Bolaños, J.; Hernàndez, M.; Bello, S. Causes for silk delay in a lowland tropical maize population. Crop Sci. 1993, 33, 1029–1035. [Google Scholar] [CrossRef]
  40. Lima, D.C.; de Leon, N.; Kaeppler, S.M. Utility of anthesis–silking interval information to predict grain yield under water and nitrogen limited conditions. Crop Sci. 2023, 63, 151–163. [Google Scholar] [CrossRef]
  41. Oyekunle, M. Genetic Analysis and Molecular Characterisation of Early Maturing Maize (Zea mays L.) Inbred Lines for Drought Tolerance; University of Ibadan: Ibadan, Nigeria, 2014. [Google Scholar]
  42. Badu-Apraku, B.; Menkir, A.; Ajala, S.; Akinwale, R.; Oyekunle, M.; Obeng-Antwi, K. Performance of tropical early-maturing maize cultivars in multiple stress environments. Can. J. Plant Sci. 2010, 90, 831–852. [Google Scholar] [CrossRef]
  43. Bonea, D. Grain yield and drought tolerance indices of maize hybrids. Not. Sci. Biol. 2020, 12, 376–386. [Google Scholar] [CrossRef]
  44. Cairns, J.E.; Sanchez, C.; Vargas, M.; Ordoñez, R.; Araus, J.L. Dissecting maize productivity: Ideotypes associated with grain yield under drought stress and well-watered conditions. J. Integr. Plant Biol. 2012, 54, 1007–1020. [Google Scholar] [CrossRef]
  45. Széles, A.; Horváth, É.; Simon, K.; Zagyi, P.; Huzsvai, L. Maize production under drought stress: Nutrient supply, yield prediction. Plants 2023, 12, 3301. [Google Scholar] [CrossRef]
  46. Sah, R.P.; Chakraborty, M.; Prasad, K.; Pandit, M.; Tudu, V.K.; Chakravarty, M.K.; Narayan, S.C.; Rana, M.; Moharana, D. Impact of water deficit stress in maize: Phenology and yield components. Sci. Rep. 2020, 10, 2944. [Google Scholar] [CrossRef]
  47. Farooq, M.; Wahid, A.; Kobayashi, N.; Fujita, D.; Basra, S.M.A. Plant drought stress: Effects, mechanisms and management. Agron. Sustain. Dev. 2009, 29, 185–212. [Google Scholar] [CrossRef]
  48. Meseka, S.; Menkir, A.; Bossey, B.; Mengesha, W. Performance assessment of drought tolerant maize hybrids under combined drought and heat stress. Agronomy 2018, 8, 274. [Google Scholar] [CrossRef]
  49. Cairns, J.E.; Crossa, J.; Zaidi, P.H.; Grudloyma, P.; Sanchez, C.; Araus, J.L.; Thaitad, S.; Makumbi, D.; Magorokosho, C.; Bänziger, M.; et al. Identification of drought, heat, and combined drought and heat tolerant donors in maize. Crop Sci. 2013, 53, 1335–1346. [Google Scholar] [CrossRef]
  50. Bankole, F.; Menkir, A.; Olaoye, G.; Olakojo, O.; Melaku, G. Association studies between grain yield and agronomic traits of a MARS maize (Zea mays L.) population under drought and non-stress condition. Acta Agric. Slov. 2019, 114, 75–84. [Google Scholar] [CrossRef]
  51. Nasser, L.M.; Badu-Apraku, B.; Gracen, V.E.; Mafouasson, H.N.A. Combining ability of early-maturing yellow maize inbreds under combined drought and heat stress and well-watered environments. Agronomy 2020, 10, 1585. [Google Scholar] [CrossRef]
  52. Ziyomo, C.; Bernardo, R. Drought tolerance in maize: Indirect selection through secondary traits versus genomewide selection. Crop Sci. 2013, 53, 1269–1275. [Google Scholar] [CrossRef]
  53. Bolaños, J.; Edmeades, G. The importance of the anthesis-silking interval in breeding for drought tolerance in tropical maize. Field Crop Res. 1996, 48, 65–80. [Google Scholar] [CrossRef]
  54. Kumar, P.; Hazarika, M. Application of correlation analysis in conventional plant breeding and genome wide association mapping. Int. J. Curr. Microbiol. Appl. Sci. 2020, 9, 3372–3375. [Google Scholar] [CrossRef]
Figure 1. View of the selected (red dots) and non-selected (grey dots) hybrids based on multi-traits genotype–ideotype distance index. The lower the MGIDI of a genotype on the left side of the graph, the closer the genotype is to an ideotype. The red circle is the cut-off MGIDI value that determines the genotype to be selected based on their individual MGIDI estimate.
Agronomy 14 00847 g001
Figure 2. The radar plot showing the strengths and weaknesses of the MGIDI selected hybrids. The red, green and blue lines represent the three factors and the factor protruding the most t a genotype is indicated as the strength of the genotype. The black broken circle shows the theoretical value if all the factors contributed equally. _IOR: TZEEIOR.
Agronomy 14 00847 g002
Figure 3. Venn diagram showing the similarity level (as the intersection) between the multiple-trait base index (MBI) and the multi-trait genotype–ideotype distance index (MGIDI) methods.
Agronomy 14 00847 g003
Figure 4. Mean performance and stability of 40 extra-early provitamin A maize hybrids based on grain yield as measured by the principal components across four environments at Ikenne. _IOR: TZEEIOR.
Agronomy 14 00847 g004
Figure 5. Phenotypic correlations among measured traits. (A) Under managed drought, (B) under well-watered, and (C) between contrasting research conditions.
Agronomy 14 00847 g005
Table 1. Description of the measured traits of the extra-early PVA hybrids evaluated under drought stress and well water conditions between 2021 and 2023.
TraitsStageDescription
DAFloweringNumber of days from sowing 50% of the plants in a row had pollen shed
DSFloweringNumber of days from sowing 50% of the plants in a row had silk emergence
ASIFloweringThe interval between 50% anthesis and silking
PHTPost floweringDistance in centimeters from the base of the plant and the first tassel branch
EHTPost floweringDistance in centimeters between the base of the plant and the uppermost ear
PASPPost-floweringThe general phenotypic appearance of the plants in a plot at 70 days after sowing scored on a scale of 1–9, where 1 = excellent and 9 = very poor
HCVPost-floweringThe protective outer covering of the cob is scored on a scale of 1 to 9 at 70 days after sowing, where 1 = husks tightly arranged and extended beyond the ear tip and 9 = ear tips exposed
STGCPost-floweringThe ability of the plant to retain the greenness of the leaves at 70 days after sowing is scored on a scale of 1 to 9, where 1 = almost all leaves green and 9 = virtually all leaves dead
EASPHarvestThe phenotypic appearance of the cob after harvest scored on a scale of 1–9, where 1 = clean, uniform, large, and well-filled ears and 9 = ears with undesirable features, such as diseases, small ears, ears rot and ears with poorly filled grains
EPPHarvestCalculated by dividing the number of ears harvested by the number of plants from where the ears were harvested.
GYHarvestComputed from the weight of the shelled grain adjusted to 80% shelling percentage and corrected for 15% moisture content
DA: days to anthesis; DS: days to silking; GY: grain yield; ASI: anthesis–silking interval; PHT: plant height; EHT: ear height; PASP: plant aspect; EASP: ear aspect; EPP: ear per plant; HCV: husk cover; STGC: stay green characteristic.
Table 2. Mean squares of grain yield and other measured traits across well-watered environments.
Source of VariationDFGYASIPHTEHTPASPEASPEPPHCV
Environment (Env)137,593,481 *46.76 *6.65 ns50.26 ns37.12 *3.46 ns1.25 *3.71 ns
Genotype (Gen)1954,330,349 ***0.71 **422.55 ***192.61 ***2.07 ***0.85 ns0.02 ***7.19 ***
Env × Gen1951,174,838 ns0.42 ns67.95 ns54.75 ns0.65 ns1.00 ns0.01 ns0.82 ns
Residual 1,108,1550.4069.2852.120.890.750.010.84
Min 590.50.00129.257220.381
Max 10,0644.00213.8180881.278
Mean 55680.62179.383.564.444.680.923.92
DF: degree of freedom; Env: environment; GY: grain yield; ASI: anthesis–silking interval; PHT: plant height; EHT: ear height; PASP: plant aspect; EASP: ear aspect; EPP: ear per plant; HCV: husk cover; *, **, ***: significant at 0.05, 0.01 and 0.001 probability levels, respectively. ns: non-significant.
Table 3. Mean squares of grain yield and others agronomic traits across drought stress environments.
Source of VariationDFGYASIPHTEHTPASPEASPEPPHCVSTGC
Environment (Env)11,560,132 ns35.57 *673.19 ns2.05 ns8.51 ns2.45 ns0.19 ns81.67 ***0.10 ns
Genotype (Gen)1951,464,750 ***3.085 ***485.84 ***193.81 ***1.55 ***1.61 ***0.05 ***3.90 ***1.93 ***
Env × Gen195979,359.6 ns2.16 *258.2 **70.25 ns1.08 ns1.15 ns0.04 **0.95 ns1.07 ***
Residual 835,3461.57 ns191.565.20.9810.030.780.99
Min 00653421012
Max 84079205.8128.4991.1789
Mean 2138.741.5147.976.275.425.130.713.975.02
DF: degree of freedom; Env: environment; GY: grain yield; ASI: anthesis–silking interval; PHT: plant height; EHT: ear height; PASP: plant aspect; EASP: ear aspect; EPP: ear per plant; HCV: husk cover; STGC: stay green characteristic; *, **, ***: significant at 0.05, 0.01 and 0.001 probability levels, respectively; ns: non-significant.
Table 4. Factorial loadings and predicted genetic gains of 196 orange hybrids based on the MGIDI.
TraitsFA1FA2FA3XoXsPredicted GainSenseGoal
ASI−0.620.49−0.131.511.49−1.03decrease100
PHT−0.28−0.330.80147.87148.240.25increase100
EHT−0.110.130.9376.3678.693.04increase100
HCV0.00−0.90−0.023.973.57−10.13decrease100
PASP−0.73−0.200.415.425.41−0.17decrease100
EASP−0.89−0.080.195.135.06−1.24decrease100
EPP−0.850.020.110.710.732.63increase100
GY−0.91−0.020.192138.742267.906.04increase100
STGC−0.48−0.470.275.024.82−4.08decrease100
NB: bold values represent traits that are correlated to each of the factor analysis 1, 2, and 3. FA1: factor analysis; FA2: factor analysis 2; FA3: factor analysis 3; Xo: population mean before selection; Xs: population mean of the selected individuals; ASI: anthesis–silking interval, PHT: plant height, EHT: ear height, HCV: husk cover, PASP: plant aspect, EASP: ear aspect, EPP: ear per plant, GY: grain yield, STGC: stay green characteristic.
Table 5. Factorial loadings, communalities and uniqueness of 29 selected orange hybrids based on the multi-trait genotype–ideotype distance index.
TraitsFA1FA2FA3CommunalityUniqueness
ASI0.130.260.870.840.16
PHT0.15−0.84−0.050.730.27
EHT−0.27−0.710.100.590.41
HCV−0.020.36−0.740.690.31
PASP0.720.210.010.570.43
EASP0.91−0.060.030.820.18
EPP0.740.000.140.570.43
GY0.81−0.080.190.690.31
STGC0.380.09−0.180.180.82
NB: bold values represent traits are correlated to each factor analysis 1, 2, and 3. FA1: factor analysis 1; FA2: factor analysis 2; FA3: factor analysis 3; ASI: anthesis–silking interval, PHT: plant height, EHT: ear height, HCV: husk cover, PASP: plant aspect, EASP: ear aspect, EPP: ear per plant, GY: grain yield, and STGC: stay green characteristic.
Table 6. Grain yield (kg/ha) of selected drought-tolerant extra-early maturing hybrids identified from both the MGIDI and the multiple-trait base index with a 72% level of similarity.
EntriesGenotypesGY (kg/ha)
under MD
GY (kg/ha)
under WW
YR%MBIMGIDI DSI
19_IOR 202 × _IOR 9 A2098671468.755.39 *2.651.12
22_IOR 28 × _IOR 9 A2501534153.177.792.060.86
39_IOR 314 × _IOR 973604699348.468.383.37 *0.79
47_IOR 479 × _IOR 972858524845.547.72.690.74
52_IOR 523 × _IOR 973054638652.1710.52.120.85
57_IOR 24 × _IOR 97 2503439243.026.412.660.70
68_IOR 526 × _IOR 973319643648.439.692.070.79
70_IOR 510 × _IOR 973569738051.6415.071.530.84
74_IOR 321 × _IOR 2493208491834.789.312.89 *0.56
81_IOR 515 × _IOR 249 2917672256.69.812.360.92
86_IOR 540 × _IOR 2492923581849.769.022.60.81
92_IOR 205 × _IOR 249 2559524051.178.462.91 *0.83
93_IOR 24 × _IOR 249 1989436754.462.29 *2.830.88
98_IOR 221 × _IOR 249 2157518658.414.19 *2.680.95
106_IOR 510 × _IOR 2493295584643.6412.151.850.71
109_IOR 346 × _IOR 1972438639861.896.582.591.00
110_IOR 321 × _IOR 1973116571445.4611.241.90.74
114_IOR 289 × _IOR 1972873734160.867.612.850.99
118_IOR 458 × _IOR 1973643706248.4215.912.060.79
119_IOR 479 × _IOR 1973074642852.1810.412.240.85
120_IOR 513 × _IOR 1972799695359.756.03 *2.850.97
121_IOR 509 × _IOR 1974044745545.7515.942.170.74
128_IOR 205 × _IOR 197 2308599061.466.712.95 *1.00
135_IOR 142 × _IOR 1972578595456.696.03 *2.660.92
142_IOR 510 × _IOR 1972629705162.728.92.421.02
144_IOR 305 × _IOR 19726485885556.08 *2.640.89
149_IOR 384 ×_IOR 30 3415675349.4310.711.960.80
158_IOR 509 × _IOR 303097546943.376.843.01 *0.70
159_IOR 540 × _IOR 303261708653.9810.692.360.88
164_IOR 202 × _IOR 302297491853.298.972.080.87
165_IOR 205 × _IOR 30 2360628062.424.80 *2.761.01
173_IOR 381 × _IOR 303000589849.136.972.670.80
175_IOR 536 × _IOR 303498739052.676.343.13 *0.86
178_IOR 525 × _IOR 303217561842.738.853.17 *0.69
179_IOR 510 × _IOR 303805639240.4715.183.63 *0.66
189_IOR 197 × _IOR 2492300546457.914.53 *2.780.94
192TZEEI 79 × TZEEI 82 (CHK-2)3015472036.137.912.260.59
_IOR: TZEEIOR; GY: grain yield; YR: yield reduction; MBI: multiple-trait base index; MGIDI: multi-trait genotype–ideotype distance index; DSI: drought susceptibility index; *: hybrids that were not selected as drought-tolerant using the alternative selection method.
Disclaimer/Publisher’s Note: The statements, opinions and data contained in all publications are solely those of the individual author(s) and contributor(s) and not of MDPI and/or the editor(s). MDPI and/or the editor(s) disclaim responsibility for any injury to people or property resulting from any ideas, methods, instructions or products referred to in the content.

