Article

Comparison of Juvenile Development of Maize and Sorghum in Six Temperate Soil Types under Extreme Water Regimes

Department of Agronomy, Institute of Agronomy, Hungarian University of Agriculture and Life Sciences, Kaposvár Campus, 2100 Godollo, Hungary
*
Author to whom correspondence should be addressed.
Agronomy 2024, 14(4), 862; https://doi.org/10.3390/agronomy14040862
Submission received: 6 March 2024 / Revised: 17 April 2024 / Accepted: 18 April 2024 / Published: 20 April 2024
(This article belongs to the Section Plant-Crop Biology and Biochemistry)

Abstract

:
Climate change requires the introduction of alternative crops in certain temperate areas due to the warmer and drier growing seasons. Maize, one of the most important crops, is projected to become less tolerant of a drier climate. Therefore, it is necessary to find an alternative species that is less susceptible to environmental stressors. This study compared the germination, growth vigour, and stress tolerance of maize and sorghum grow in six types of soil under three water regimes. The results indicate that sorghum germination is faster and more uniform. The most significant differences in germination rates were found in chernozem (88.9% and 72.2% for sorghum and maize, respectively) and saline solonetz (74.4% and 63.3% for sorghum and maize, respectively). Maize exhibited higher growth vigour only in three cases, i.e., under solonetz–flooding, shifting sand–drought, and brown forest floor–flooding conditions. An ANOVA showed a significant difference between sorghum and maize stress conditions due to soil conditions and water availability (p < 0.0001). Sorghum can be a suitable alternative to maize, but only in areas with hot, dry periods and in areas where the soil is not too prone to waterlogging, regardless of its quality.

1. Introduction

Maize (Zea mays L.) and sorghum (Sorghum bicolor (L.) Moench.) stand prominently among the most important cereal crops globally, owing to their extensive versatility across various domains, notably encompassing human and animal nutrition, as well as industrial applications, with a particular emphasis on ethanol manufacturing.
The phenomenon of climate change, characterized by notable shifts in temperature patterns and precipitation dynamics, is compelling maize producers across diverse regions worldwide to reassess their conventional crop portfolios to ensure crop security [1]. Drought and waterlogging are significant climatic hazards, particularly in vulnerable agricultural regions where traditional cultivation methods are still used. These methods have led to the formation of a compacted plow pan, which has negatively affected the texture, permeability, and water retention capacity of the soil [2]. As a consequence, water is the most significant factor, as it can cause distress to maize, ranging from droughts to heavy rains and floods [3] in every phenological stage, resulting in the deterioration of the general health status of plants. Water stress profoundly influences germination vigour and early growth, as indicated by recent research [4,5,6,7,8] (Osakabe et al., 2014; Sun et al., 2020; Yang et al., 2021). Drought conditions during maize germination notably diminish seedling viability [9]. Furthermore, inadequate water availability during the vegetative phase induces physiological alterations such as decreases in leaf size, leaf dropping, and reductions in photosynthetic efficiency and chlorophyll contents, negatively impacting the expected yield [10]. Maize exhibits pronounced sensitivity to excessive moisture levels from germination through to the heading stages, having the potential for regeneration following excess water runoff but a limited recuperative capacity upon post-drought cessation [11,12].
Conversely, sorghum demonstrates a degree of resilience to water stress during its juvenile phase, with negligible yield impacts observed initially. However, sustained water deficits lasting 35–40 days post-sowing significantly curtail the final yield [13]. Yield losses are more significant when drought occurs later in the vegetative stage than in the earlier phenological stages [14]. Water deficits during the transition from the vegetative to the generative stage can inhibit plant gamete development and flowering [13]. In addition to drought, the abundance of water in the juvenile stages also affects plant production adversely. Sorghum is especially vulnerable to waterlogging at the five-leaf stage, which can lead to reduced photosynthesis, chlorophyll content, biomass, and yield loss [15]. The survival of plants is affected by the dynamics between the duration of flooding and air temperature. Nielsen [16] confirmed that maize plants can be flooded for two to four days at 15 °C but may die if temperatures exceed 25 °C under the same water conditions. After 14 days of waterlogging, the length of maize leaves can be shortened by 25–35% compared to the control group [17].
The advancement of plant stress identification technologies has resulted in the development of novel non-destructive methods for evaluating stress, such as the detection of biophoton emissions [18,19]. When plants are deprived of light, they lose their excitation energy, causing electrons to go back to the reaction centres and become excited again. Subsequently, a period of relaxation ensues, wherein a modest yet discernible amount of photon emission takes place [20]. The detection of the initial intensity and the dynamics of decay [21] enable the characterization of plant homeostasis and stress reactions [18,19,22,23] as well. Water stress, whether in the form of drought [21,24] or flooding [25,26], affects the photosynthetic production of maize. The value of the initial signal emission and the more intense decay dynamics indicate a higher stress state [18,27] if the stressor has an effect on the formation or functioning of the photosynthetic apparatus. Drought stress was successfully assessed in the work of Salvatori et al. [21], where the measured photon emissions indicated a significant decrease in the sub-parameters of delayed fluorescence. Furthermore, it was more pronounced in the case of the combined stress effects of drought and UV application. As for the other extreme water event, the flood stress responses of soybean plants were also successfully detected via the combination of protein profiling and biophoton emission measurement [26].
Several studies have shown that sorghum has a yield advantage over maize under dry field conditions [28,29], while flooding reduces the leaf area, plant height, and leaf expansion rate in maize [27,30] and sorghum [31,32,33] as well. Furthermore, it is well known that sorghum is less soil-sensitive than maize and that it can be grown in almost any type of soil [34]. However, there is no comprehensive study in the literature that includes six soil types and three water regimes comparing germination, growth, and stress factors in maize and sorghum.
Therefore, the objectives of this study are twofold: Firstly, to compare the germination characteristics of maize and sorghum in six different soil types commonly found in temperate zones (brown forest floor, chernozem, shifting and humic sand, solonetz, control) while also considering three different water supply conditions (drought, waterlogging, control). Secondly, to compare the development intensity and stress characteristics of maize and sorghum under the same soil and water conditions mentioned in the first objective using biophoton emission measurement as a highly sensitive, non-invasive stress assessment tool.

2. Materials and Methods

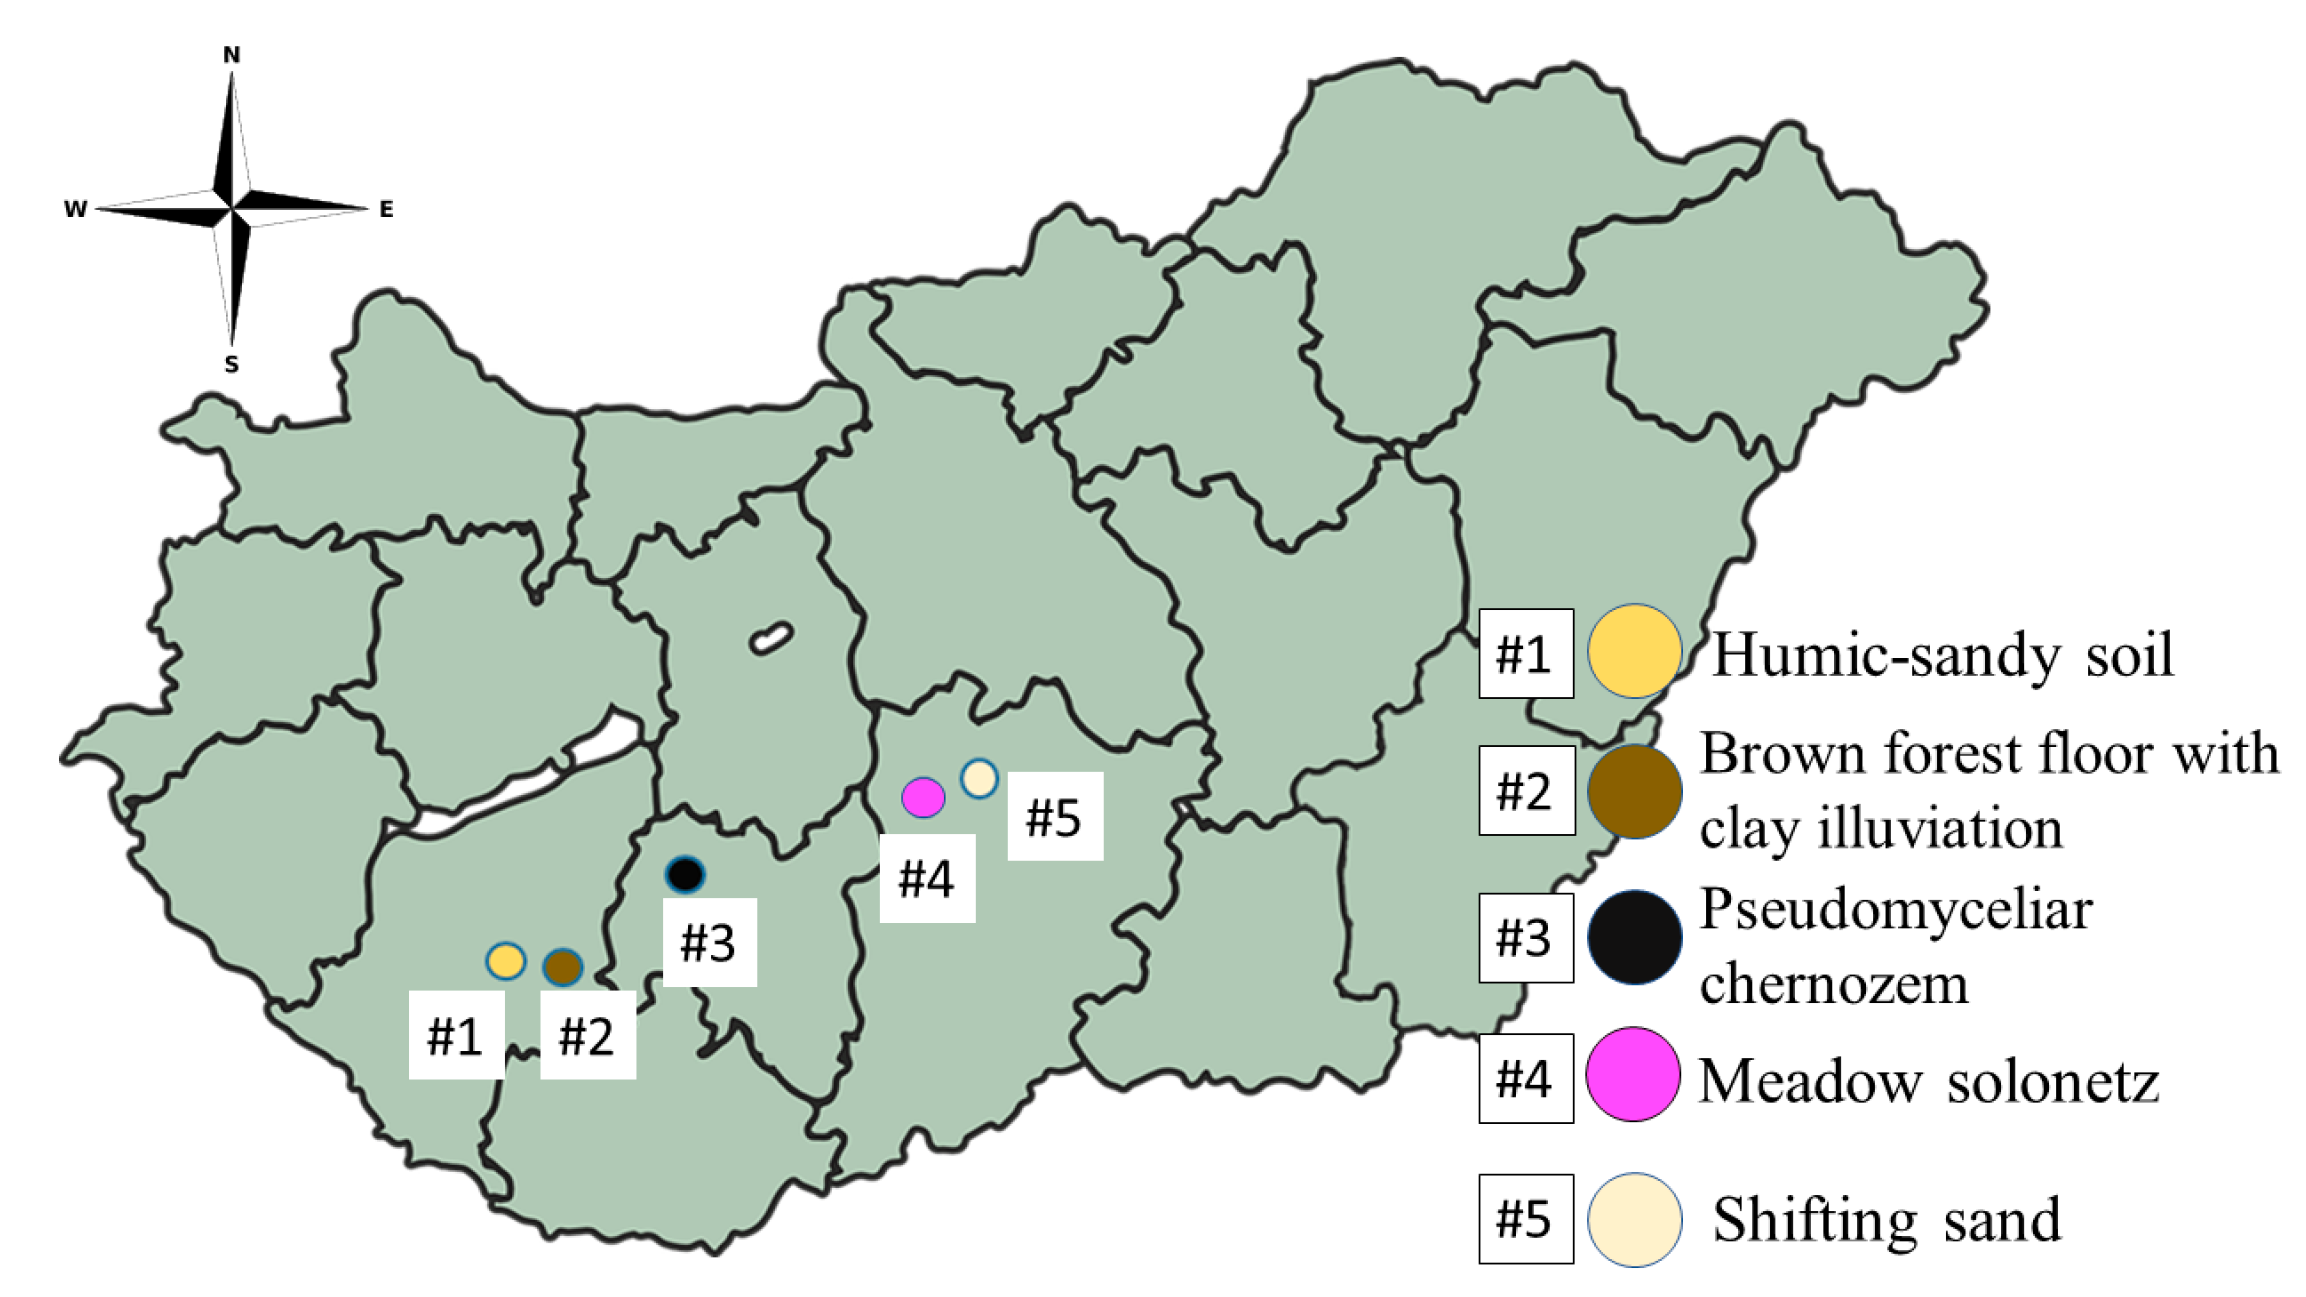
2.1. Collection and Analysis of Soil Samples

The initial stage of the research was to identify and collect the soil types commonly found in the temperate climate zone of Hungary. These included brown forest floor with clay illuviation (Luvisols), pseudomyceliar chernozem (chernozems), two types of soil with different sand chemistry (Arenosols), meadow solonetz soil (solonetz), and soil with an optimal structure and chemistry, traditionally known as potting soil, which functioned as the control soil (control). The control potting soil was the so-called Florimo® general potting soil. It is composed of Sphagnum moss peat, plain peat, composted cattle manure, and some clay, providing a growing substrate with a loose structure and good moisture retention. The soils were collected from five different areas of the country (Figure 1). The exact locations, with coordinates, are listed in Table 1. Soil samples were collected in March and April of 2023 from agricultural areas where no nutrients had been applied for four months prior to sampling. The sites were located far from major roads or busy byways. The topography was flat in all study areas, without signs of erosion or accumulation due to water runoff. No crops were found in the fields at the time of sampling, and any unintentional crop residues were removed from all soil types.
The selected soil types, together, cover 16.5% of Europe (Arenosols 1%, Chernozems 9%, Luvisols 6%, solonetz 0.5%). Furthermore, it is also important to note that these percentages of soil types represent absolute proportions, as not all of the soil types listed in the WRB for Europe are suitable for agriculture. If this condition was considered, the percentage of soil types among the available agricultural areas would be significantly higher than the reported 16.5%.
All the soil samples were analysed at the accredited soil laboratory of the Hungarian University of Agriculture and Life Sciences accredited by the National Accreditation Authority (NAH-1-1339/2016). The detailed results of the soil analysis are presented in Table 1.

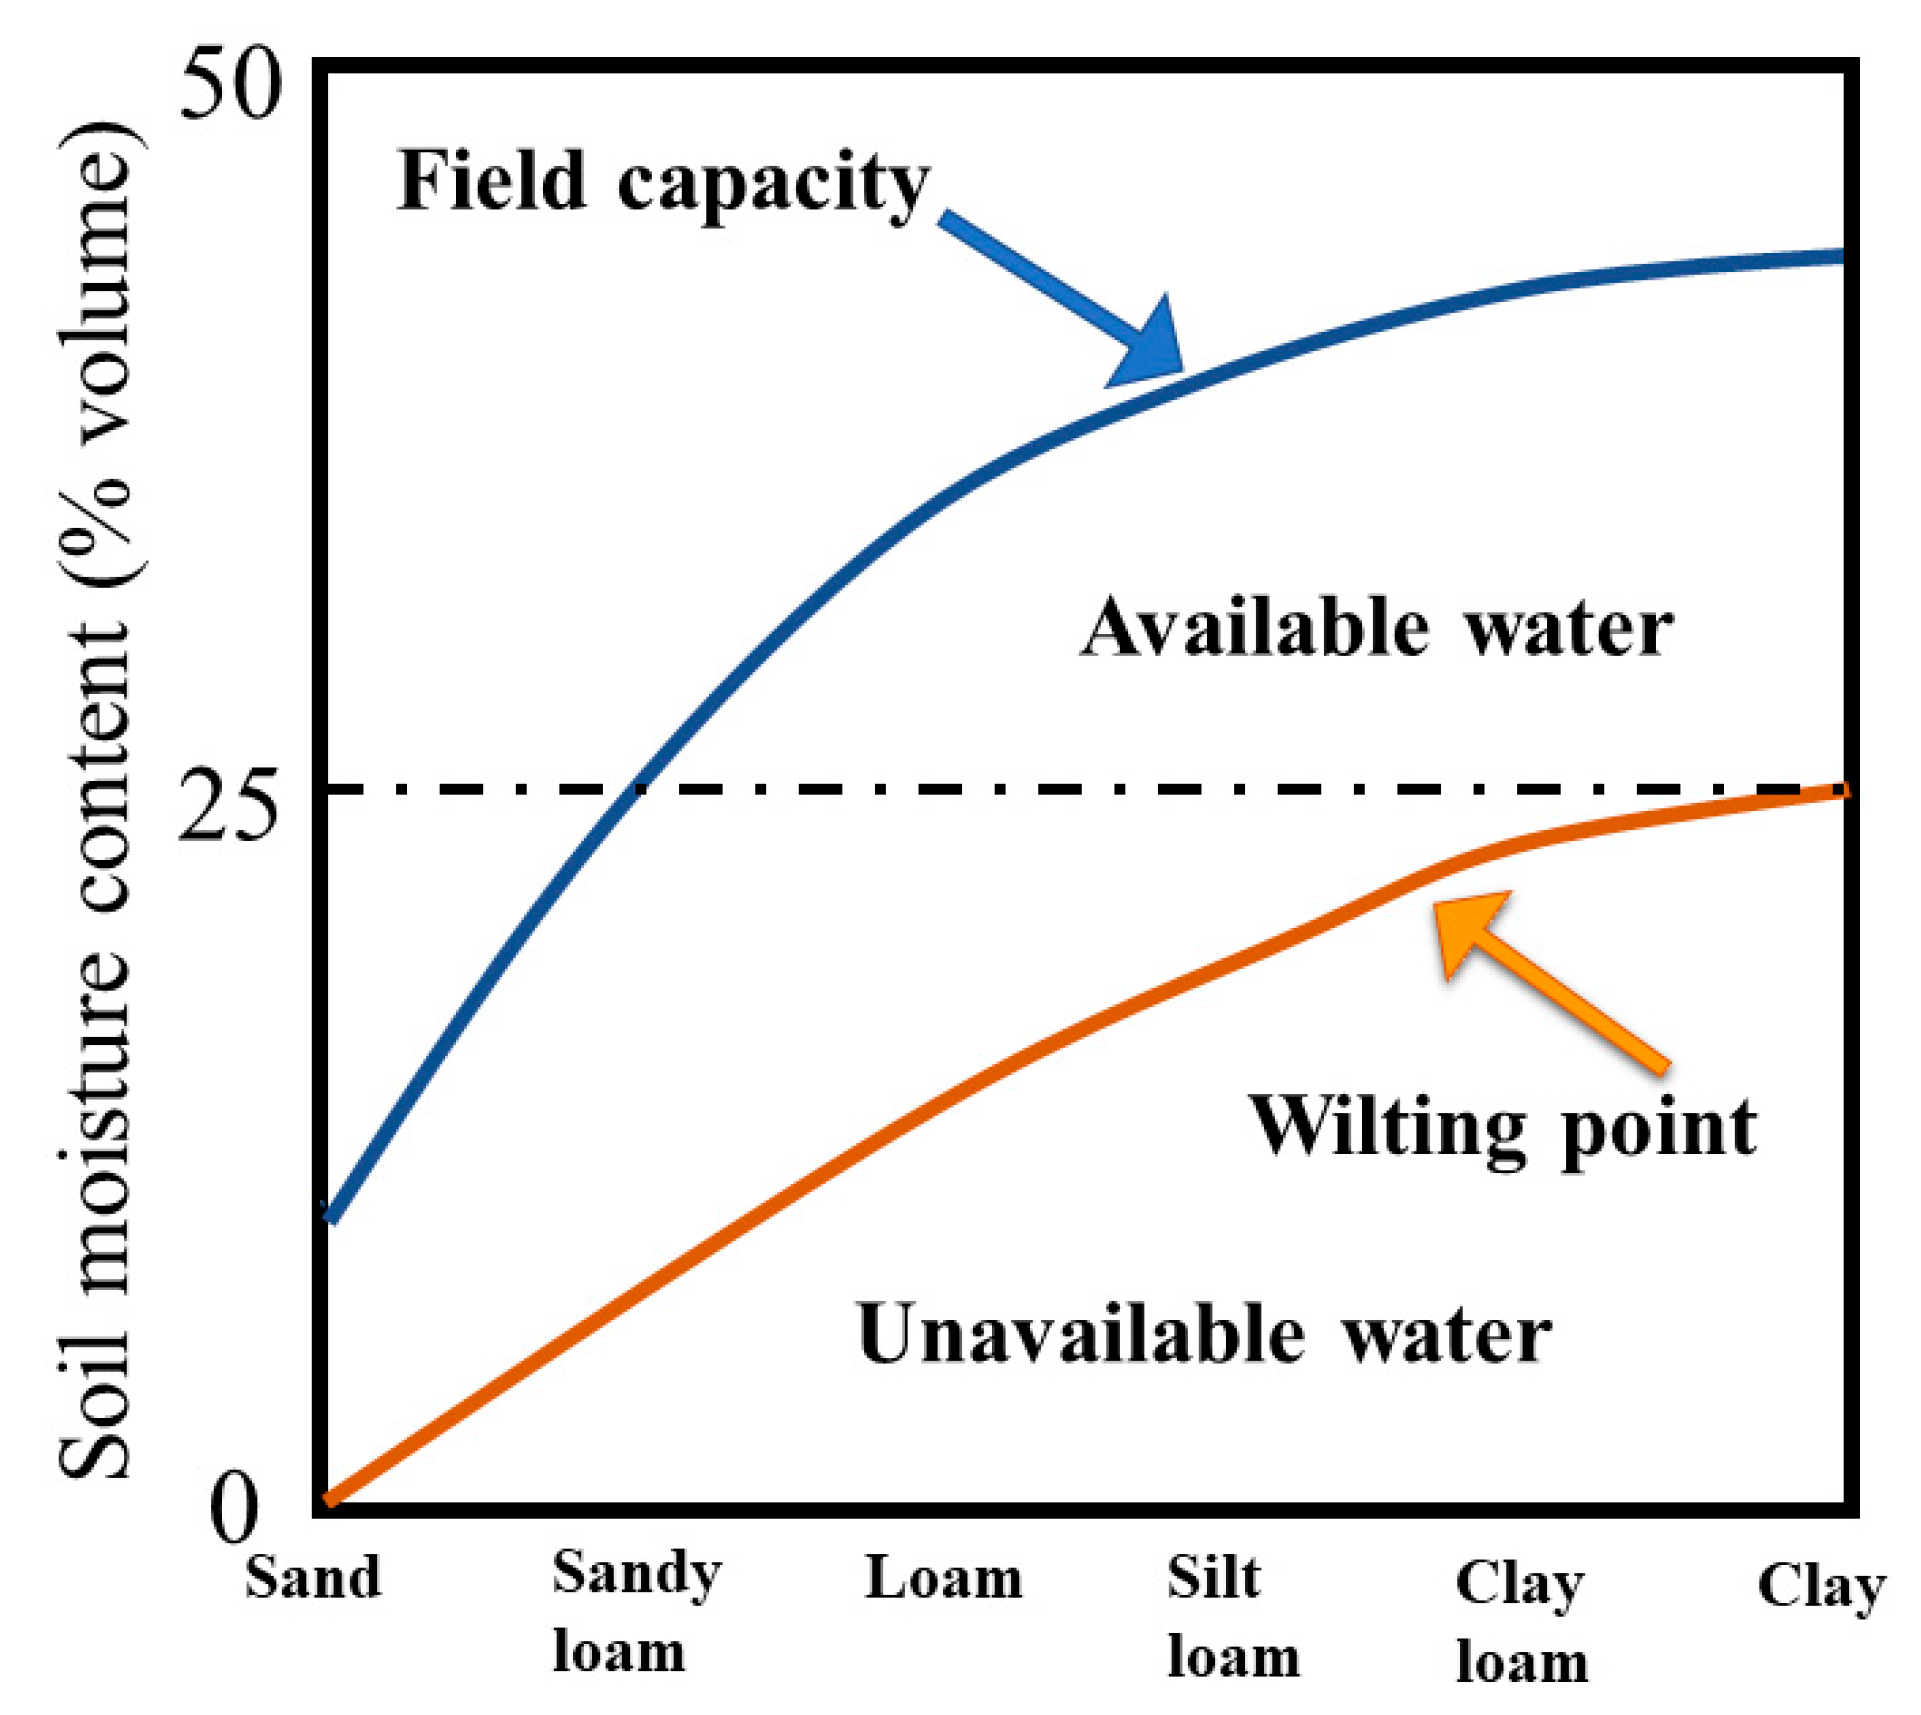
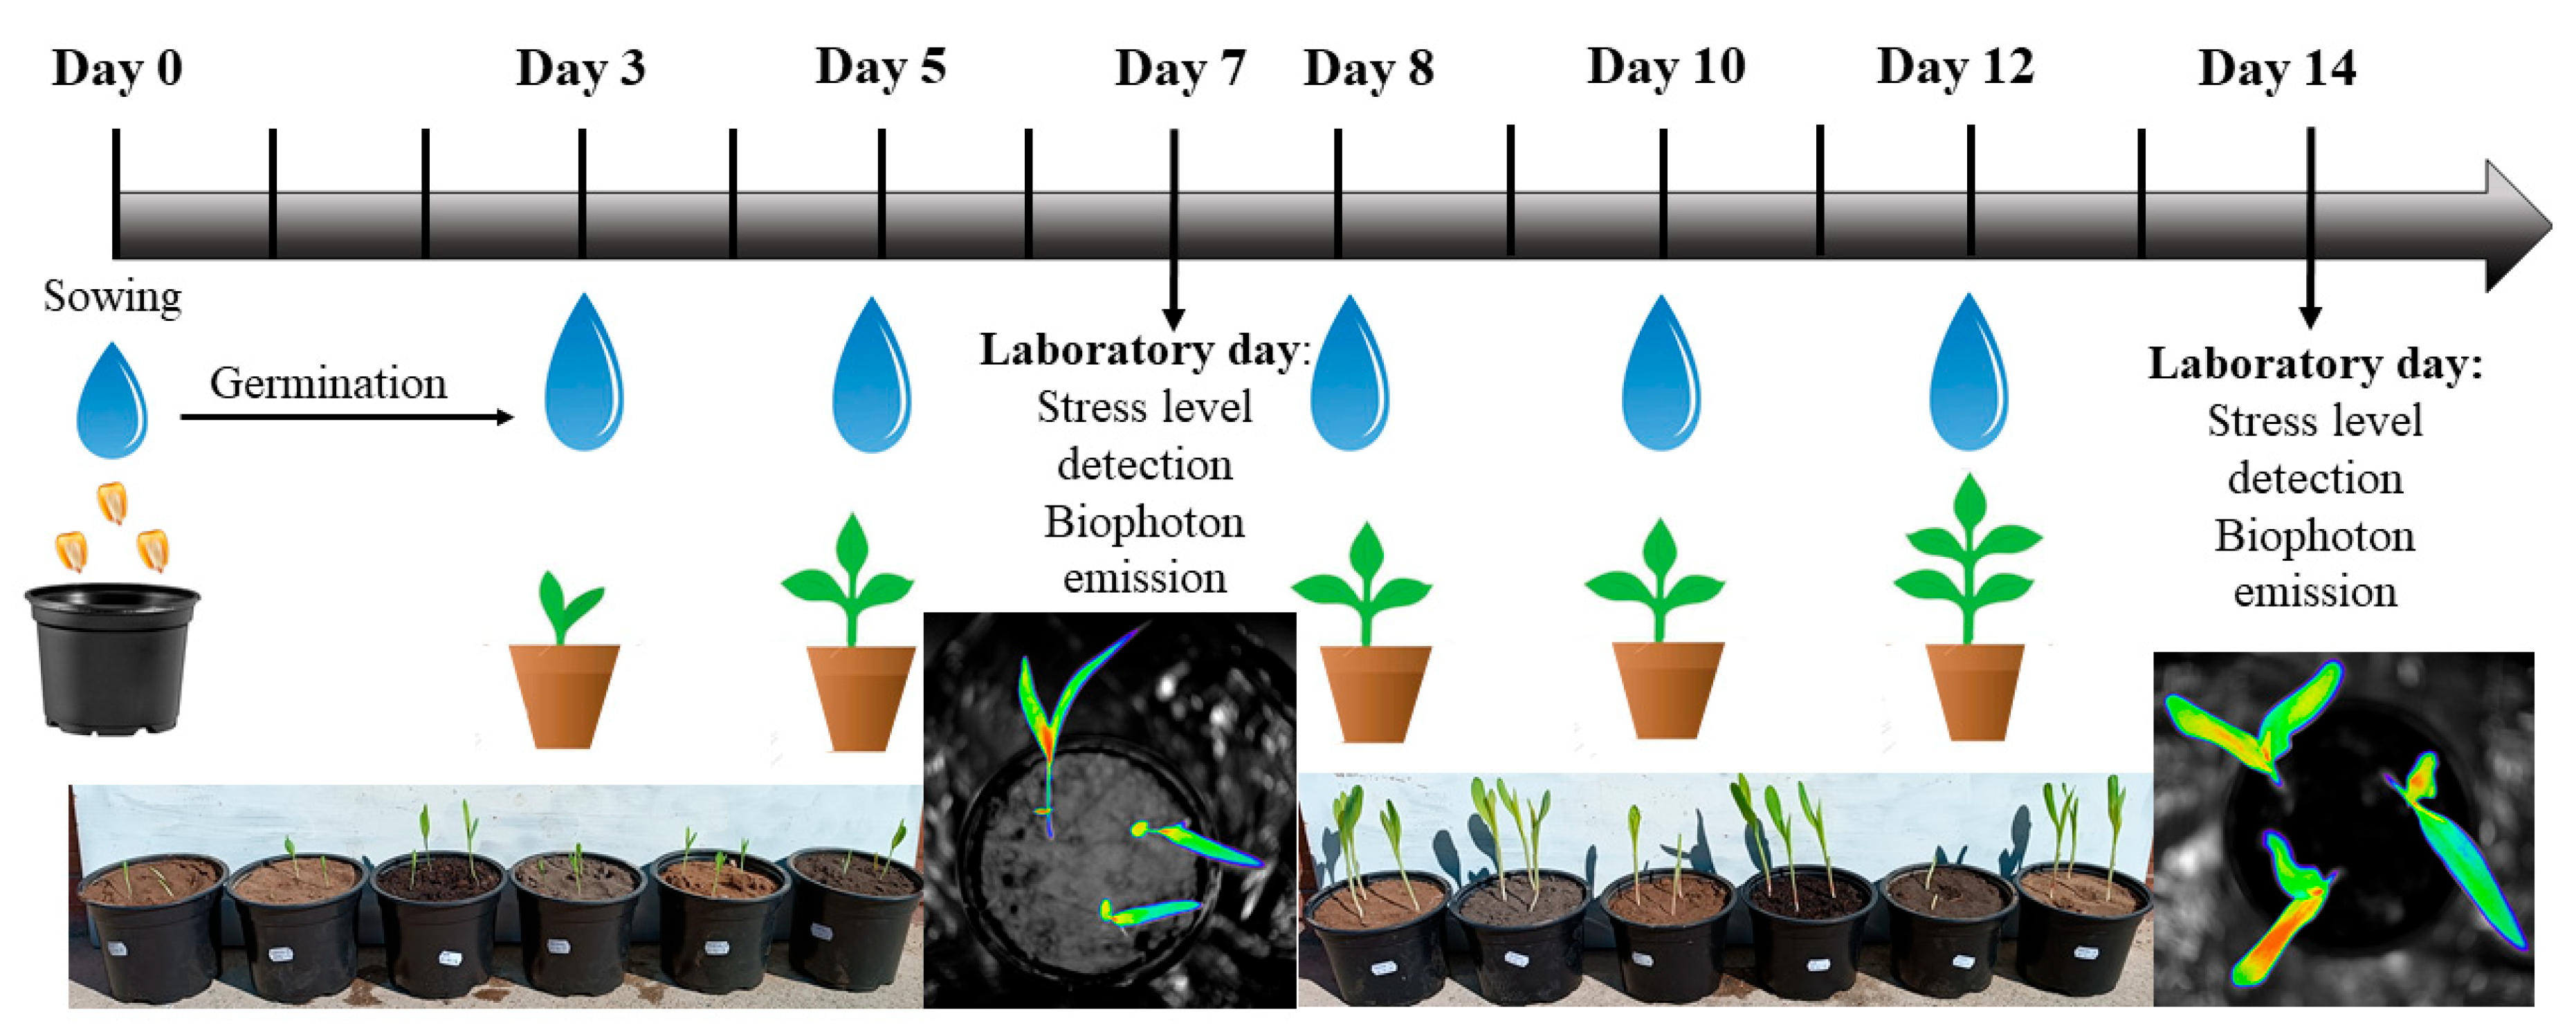
2.2. Experimental Setup and Irrigation Schemes

The soil samples were placed in identical pots with a diameter of 13 cm. To ensure consistency, seeds of the same maturity group were used for both maize and sorghum. Therefore, the KWS® KASHMIR maize hybrid and the KWS® SO MSN190 sorghum hybrid were selected. KWS® KASHMIR is a medium-maturity hybrid with an FAO number of 350–400. It exhibits early and rapid growth vigour, excellent drought tolerance, and good disease resistance. The hybrid of sorghum was also of medium maturity, with good drought tolerance and disease resistance. Both plants were treated with the seed dressing Redigo M + Concep III (Syngenta Crop Protection, Greensboro, NC, USA). The sowing depth was 0.02 m, and the number of pots was ten for each soil type and water supplement, with three seeds in each pot, resulting in a total of 540 seeds per species sown in 360 pots (Table 2).
The experiment involved three irrigation schedules to accommodate three different water regimes. Accordingly, different soil textures have different water storage capacities (Figure 2), so a soil-specific irrigation plan was developed based on the following mathematical formula:
M m = M % × M d 100 + M d
where Mm represents the unit mass [g] of the moist soil sample, Md represents the unit mass [g] of the dry soil sample dried on the standard 105 °C, and M% is the mass% moisture content. The optimal water content interval in the soil varies with the soil texture (Figure 2). Therefore, a dynamic irrigation plan was required for each soil type based on Figure 3 to ensure low, optimal, and high water contents in the soils. Figure 3 shows the irrigation schedule, including the laboratory measurement days. The masses of soil samples were standardized to ensure a consistent water supply in all water regimes (control, drought, and flooding). The field water capacity [ml water/100 g dry soil] and the irrigation plan are shown in Table 3. The soil laboratory of the Hungarian University of Agriculture and Life Sciences, Kaposvar Campus, conducted soil texture and water retention tests, which were officially characterized by the so-called Arany-type soil texture coefficient (refers as Arany number), which could be considered as the field water capacity in mL water/100 g soil. The procedure was as follows: soil samples were cleaned, air-dried at 60 °C, and broken down into their smallest components (sand, silt, and clay). Each soil sample was weighed at 100 g using a precision balance. Water was then added from above with precise mL concentrations, and each sample was homogenized to ensure no isolated inhomogeneities. This process was repeated until the soil samples became malleable. Based on this mL value, which was equal to the Arany number, the soil could be classified with sufficient accuracy into soil texture classes, on the basis of which the irrigation strategy was developed (Table 3). The necessary water amount could be calculated (Equation (1)) based on the Arany number and the mass of dry soil mass (gramm) in the pots. Water content compared to the Arany number gave the rate (%) of watering, so 70% of the Arany number was the control group, 20% of the Arany number was considered to represent drought conditions, and 120% of the Arany number represented flooding. The exact mass of water depended on the water loss from the soils as a consequence of evapotranspiration and plant water uptake. The exact mass of soil samples and the actual water demand were measured with a calibrated scale. The plants were cultivated in a Pol-Eco Apartura KK 1450 climate chamber at an optimal daylight temperature of 22 °C with 120 μmol m−2 s−1 and 16 °C with 0 μmol m−2 s−1 at night with 12 h-12 h time intervals. The whole duration of the experiment from sowing was 14 days.

2.3. Experimental Measurements

2.3.1. Germination and Growth Indices

The germination experiment started with a laboratory germination test in Petri dishes using 100 maize and 100 sorghum seeds with four replicates. Germination was observed in the 12th, 24th, 36th, 48th, 60th, 72nd, and 96th hours at 22 °C. These results served as the control for germination ability compared to unit germination in the pots. Subsequently, after sowing the seeds in the pots, germination data were recorded daily at 8 am, along with the daily growth rate of the juvenile plants.
Various germination indices can be found in the literature [38]. However, all are primarily based on the number of germlings that have emerged on a particular day and the number of days that have elapsed since the start date [39]. In our study, four commonly used germination indices were applied: the Germination percentage (GP) (%); the Mean Germination Time (MGT) and the Mean Germination Speed (MGS) (%/day), which values are reciprocals of each other; and finally, the Coefficient of Uniformity of Germination (CUG). The formulas for these are as follows:
G P = i = 1 k n i N × 100
where N is the number of seeds at the beginning of the germination experiment, and ni is the number of germinated seeds on the ith day of the experiment. The Mean Germination Time (MGT) (days) is calculated using the following:
M G T = i = 1 k n i t i i = 1 k n i
where ni is the number of germinated seeds on the ith day of the experiment, and ti is the number of days elapsed after sowing. The Mean Germination Speed (MGS) (%×day−1) is the reciprocal value of MGT:
M G S = i = 1 k n i i = 1 k n i t i × 100
where ni and ti refer to the same as in Equation (3). The faster the germination rate (MGS), the shorter the time required for germination (MGT). Finally, the Coefficient of Uniformity of Germination (CUG) needs to be determined by the following formula:
C U G = i = 1 k n i i = 1 k t ¯ t i 2 n i ,   with
t ¯ = 100 M G S
where ni and ti refer to the same as in Equation (3), while t ¯ is inversely proportional to the Mean Germination Speed (MGS).
The length from the surface to the tip of the uppermost leaf [mm] of the maize and sor-ghum plants, sown in various soil types, were regularly recorded at 10 pm on the 1st, 2nd, 3rd, 4th, 5th, 9th, and 12th days after sowing. The comparison of the growth dynamics could not be direct because the two species have divergent morphological characteristics. Hence, comparability was ensured by fitting a linear regression line on the length data, whose slope gave the growth dynamics of a particular plant. However, this was still not sufficient to eliminate morphological differences. Therefore, the average growth rate was calculated and compared to the slope of each plant. The fitted linear regression line is as follows:
A L = a × D k + b
where AL is the actual length [mm] of the plant on the kth day, D is the number of the kth day, b is the intercept of the y-axis, and a is the slope of the regression line and needed for further calculations. The Normalized Growth Rate (NGR) can be calculated by the following formula:
N G R = a i a n N
where ai is the slope of the growth rate of the ith plant, while the denominator of Equation (8) is the average value of the slopes belonging to a specific plant, i.e., maize or sorghum. If the NGR is greater than one, the growth of the plant is faster than the average, and if the NGR is smaller than one, the growth rate remains below average.

2.3.2. In Vivo Stress Analytical Method

Biophoton emission was quantified with the NightSHADE LB 985 In Vivo Plant Imaging System (Institute Berthold Technologies Bioanalytical Instruments, Bad Wildbad, Germany). This system included a highly sensitive, thermoelectrically cooled slow-scan NighOwlcam CCD device (Institute Berthold Technologies Bioanalytical Instruments, Bad Wildbad, Germany) that was cooled to a temperature of −68 °C. The duration of the exposure was 60 s, with a pixel binning of 4 × 4. Both the “background correction” and “cosmic suppression” settings were activated to exclude high-intensity pixels that could be generated by cosmic radiation. To establish a standardized initial value, LED panels emitting light at maximum intensities of far red (730 nm), red (660 nm), green (565 nm), and blue (470 nm) were used for a period of 5 s. After deactivating the LEDs, luminescence was observed for 10 min. Photon counts were collected at 60-s intervals and analysed using IndiGO™ 2.0.5.0 software (Institute Berthold Technologies Bioanalytical Instruments, Bad Wildbad, Germany), and the obtained counts per second (cps) values were subsequently transformed into counts per second per square millimeter (cps mm2). The biophoton emission observed in this study indicates (Figure 4) that the photosynthetic system of these plants is healthy when the emission signal is higher (Figure 4A), and disrupted or under stress when the emission signal is lower (Figure 4B).
Biophoton emission measurements were taken from two randomly chosen pots per experimental setup (each pot contained three plants), resulting in a total of six plants for the statistical calculations of the biophoton emission intensities. Each set of biophoton emission measurements was limited to a maximum time of 10 min in order to ensure the principles of consistency and comparability. The maximum number of daily sets was 32.

2.4. Statistical Methods

The dataset based on the germination, growth, and in vivo analytical detection of stress level was analysed using a four-way ANOVA to investigate differences in germination ability, growth rates, and biophoton emissions across the experimental setups and treatments. Duncan’s post hoc test and Principal Component Analysis (PCA) were employed to examine the impact of the treatments on the different parameters. Calculations were performed using R Statistical Software 4.3.2. (R Core Team, Vienna, AUT) [40] using the functions aov() 3.6.2, duncan.test() 1.3.7, and prcomp() 2.4.5 from the Agricolae 1.3.7 and Devtools 2.4.5 packages [41]. The results have been visualized using density function plots, violin plots, and boxplots.

3. Results

3.1. Germination and Growth Rate

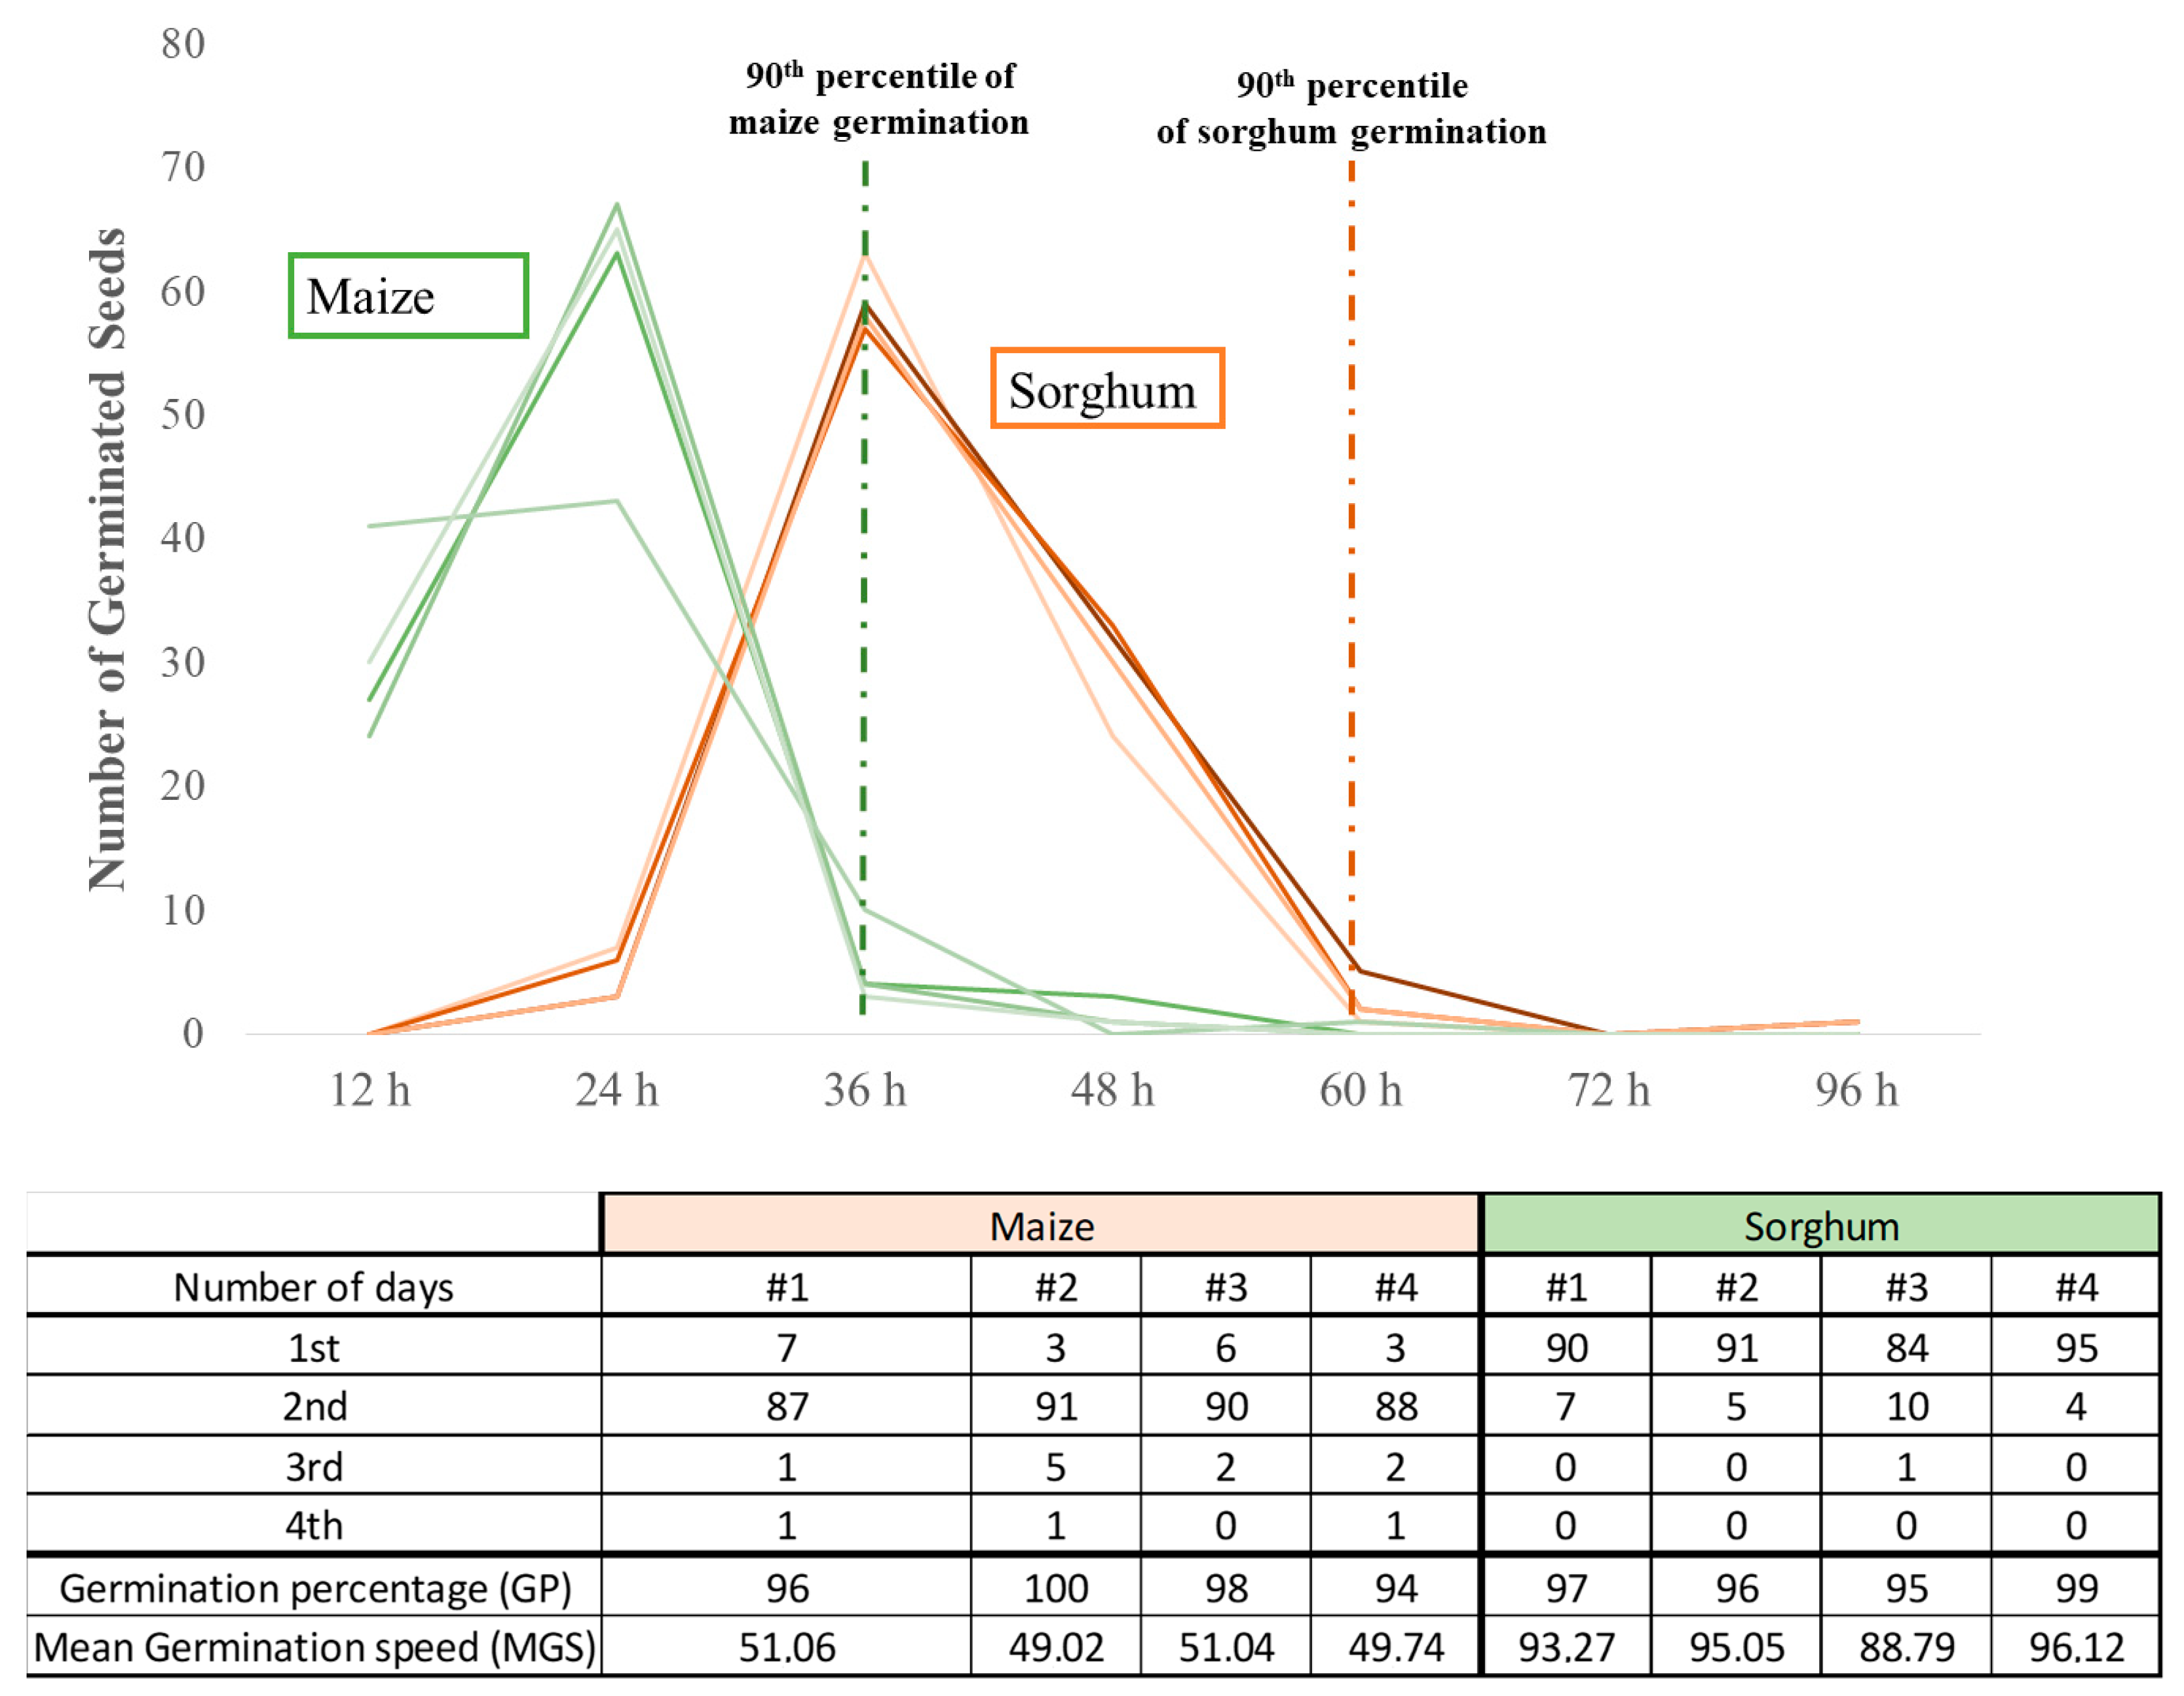
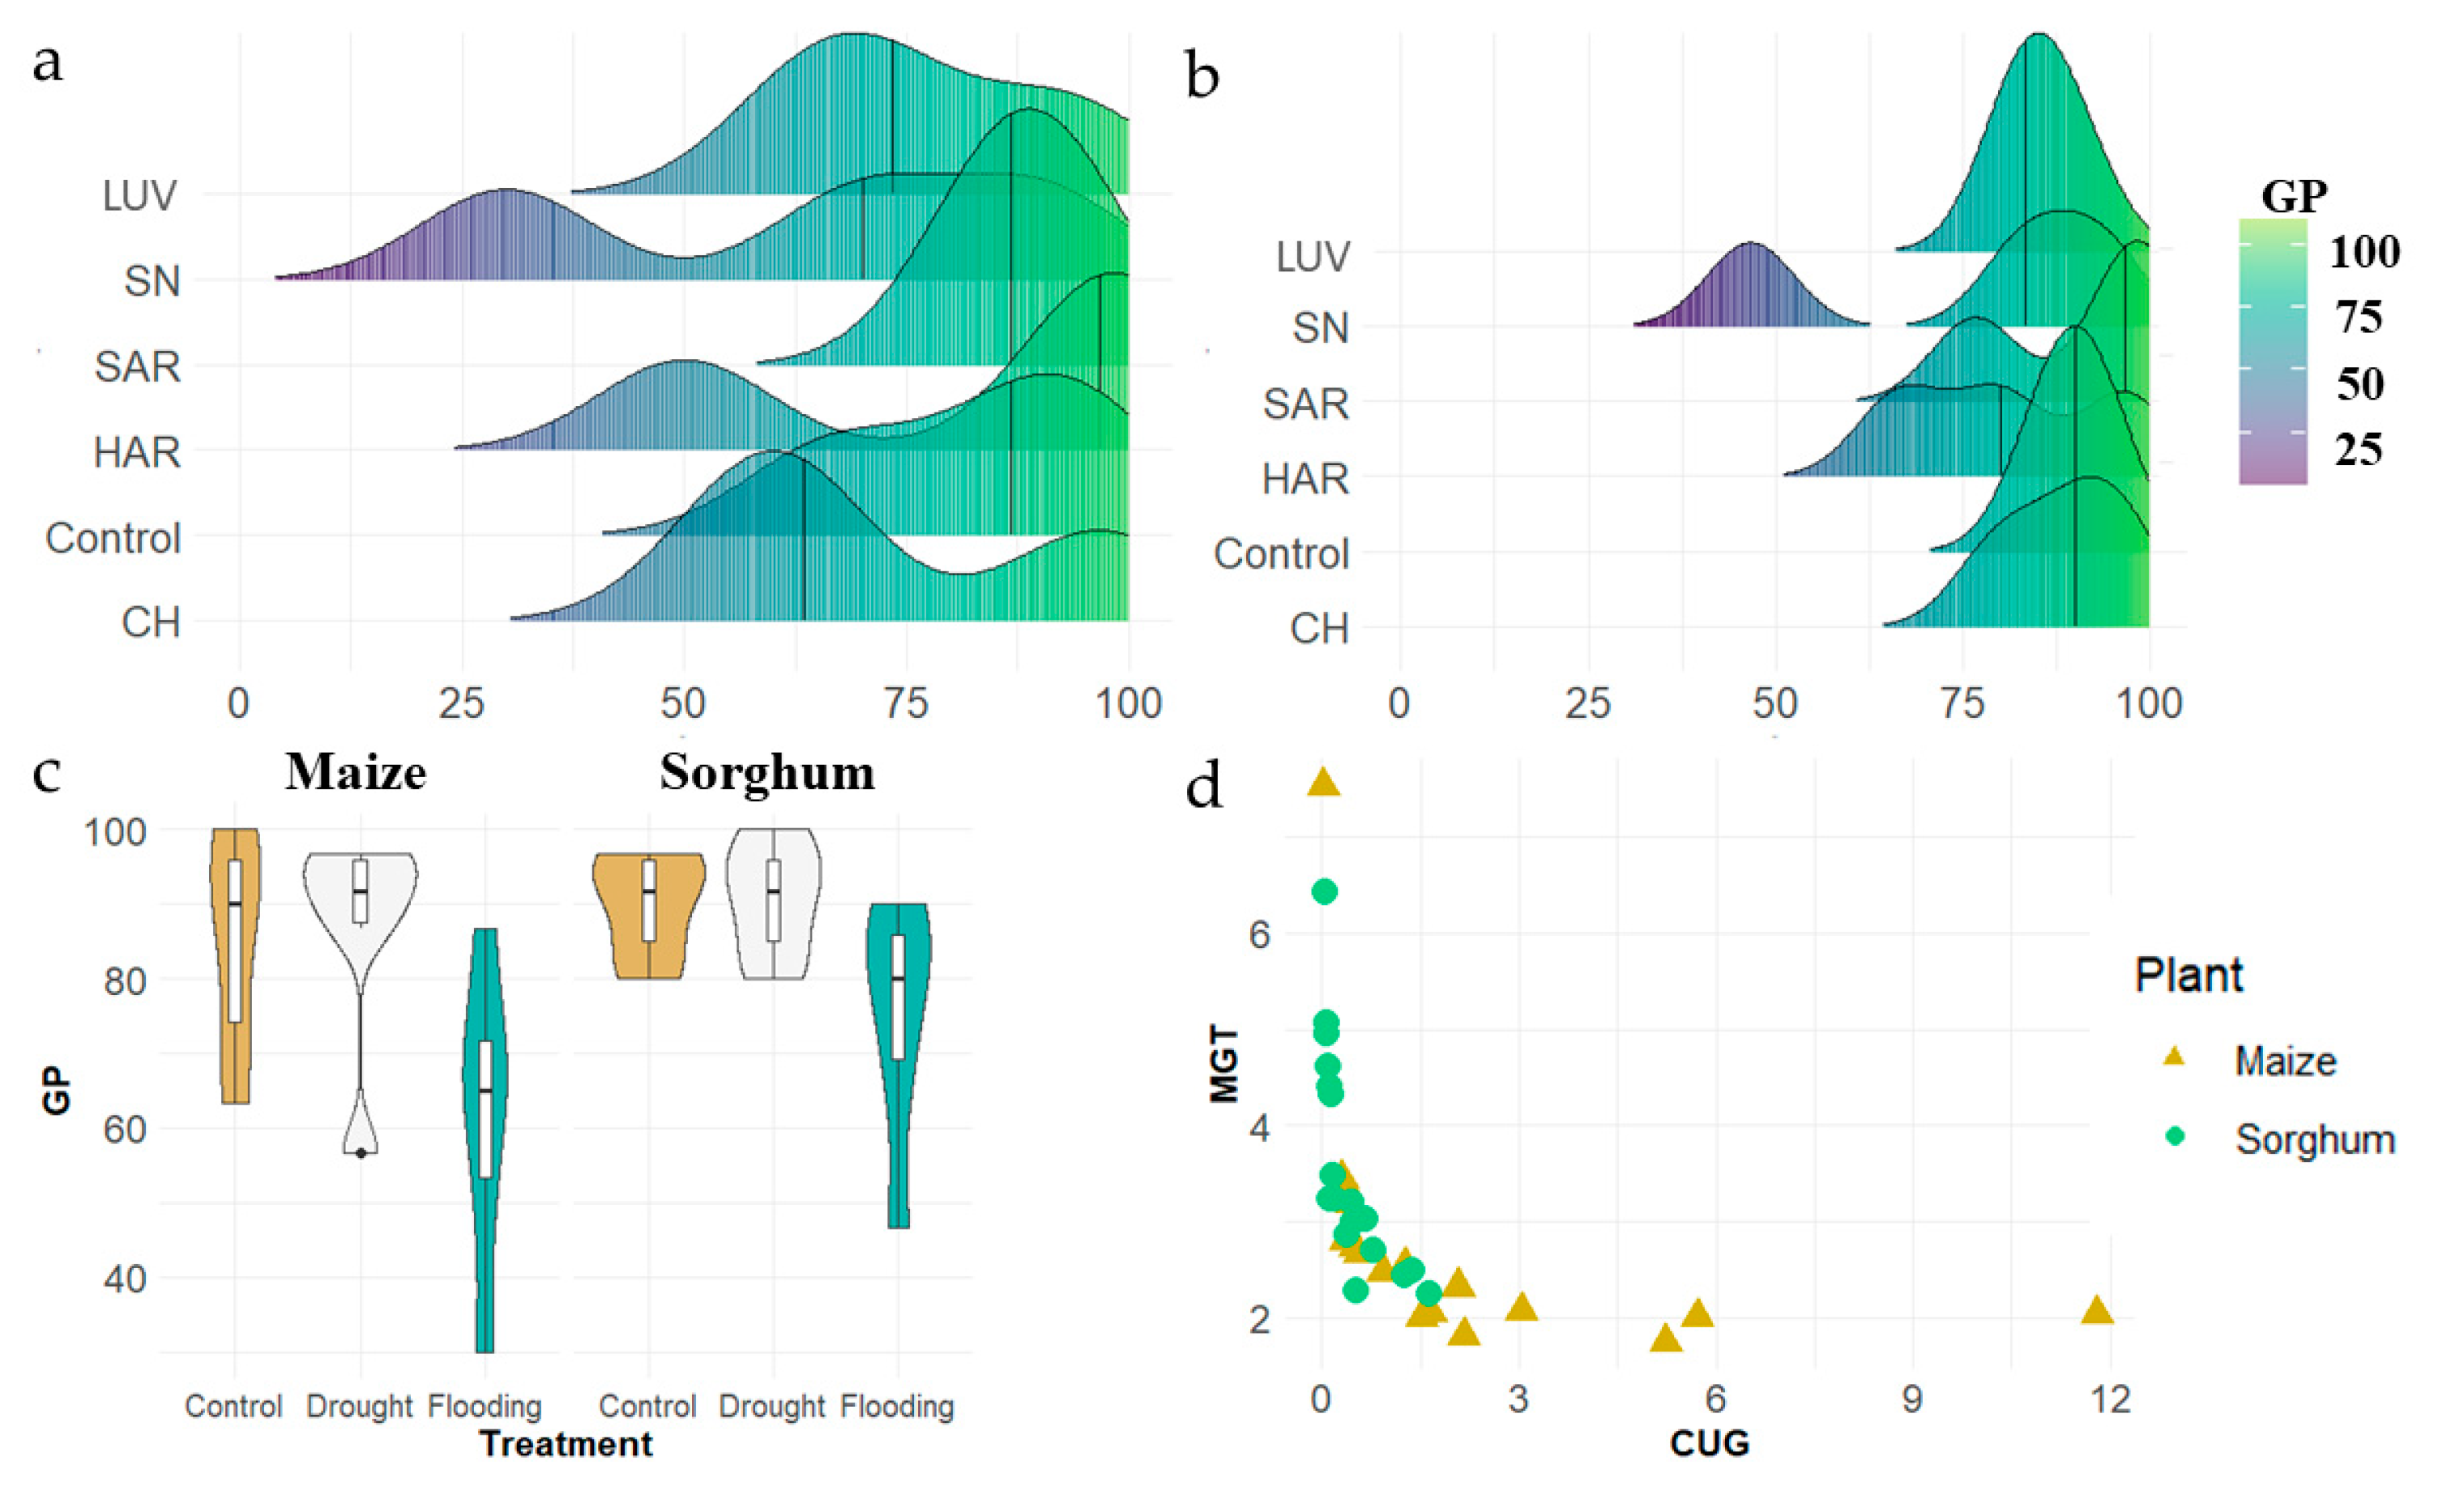
3.1.1. Laboratory Germination Test

Maize and sorghum germination peaked at 24 and 36 h after sowing. After 36 h of seeding for maize and 60 h for sorghum, 90% of the seeds had germinated (Figure 5). Maize seeds germinated 94%, 96%, 98%, and 100%, while sorghum germinated 95%, 96%, 97%, and 99%. Our one-way ANOVA indicated no significant differences in the mean germination percentages (p = 0.877). The maize seeds had a considerably higher mean germination speed (MGS) than the sorghum seeds (p-value < 0.0001).

3.1.2. Germination in Different Environmental Conditions

Figure 6 shows the germination indices for the different soil types and water regimes. The shifting sand soil (SAR) was the most suitable, with an average GP of 88.89% for maize (Figure 6a) and 91.11% for sorghum (Figure 6b, Table 4). Chernozem (CH) for sorghum (88.89%) and humic sand soil (HAR) for maize (82.22%) were the third most suitable soil types after the control group, with GP values of 90% and 83.33%. Both maize and sorghum germinated poorly on the saline solonetz soils (63.33% and 74.44%, respectively). Sorghum outperformed all soil types except humic sand soil (HAR) in germination, but the difference was not significant [42]. Sorghum showed a higher germination percentage and more uniform germination with fewer variations than maize across all water regimes (Figure 6c). Sorghum tolerated water shortage better than the control group, with average germination vigour. The shape of the distribution function slightly favoured the control group. Flooding reduced germination vigour the most, affecting both crops (Figure 6c). The high water content in the saline soil (meadow solonetz) inhibited germination the most (Figure 6a). Sorghum tolerated excessive water better than maize. CGU and MGT are compared in Figure 6d. The CUG range was narrower for sorghum than maize, with a higher MGT. Thus, sorghum seedlings emerged earlier and more uniformly than maize seedlings.

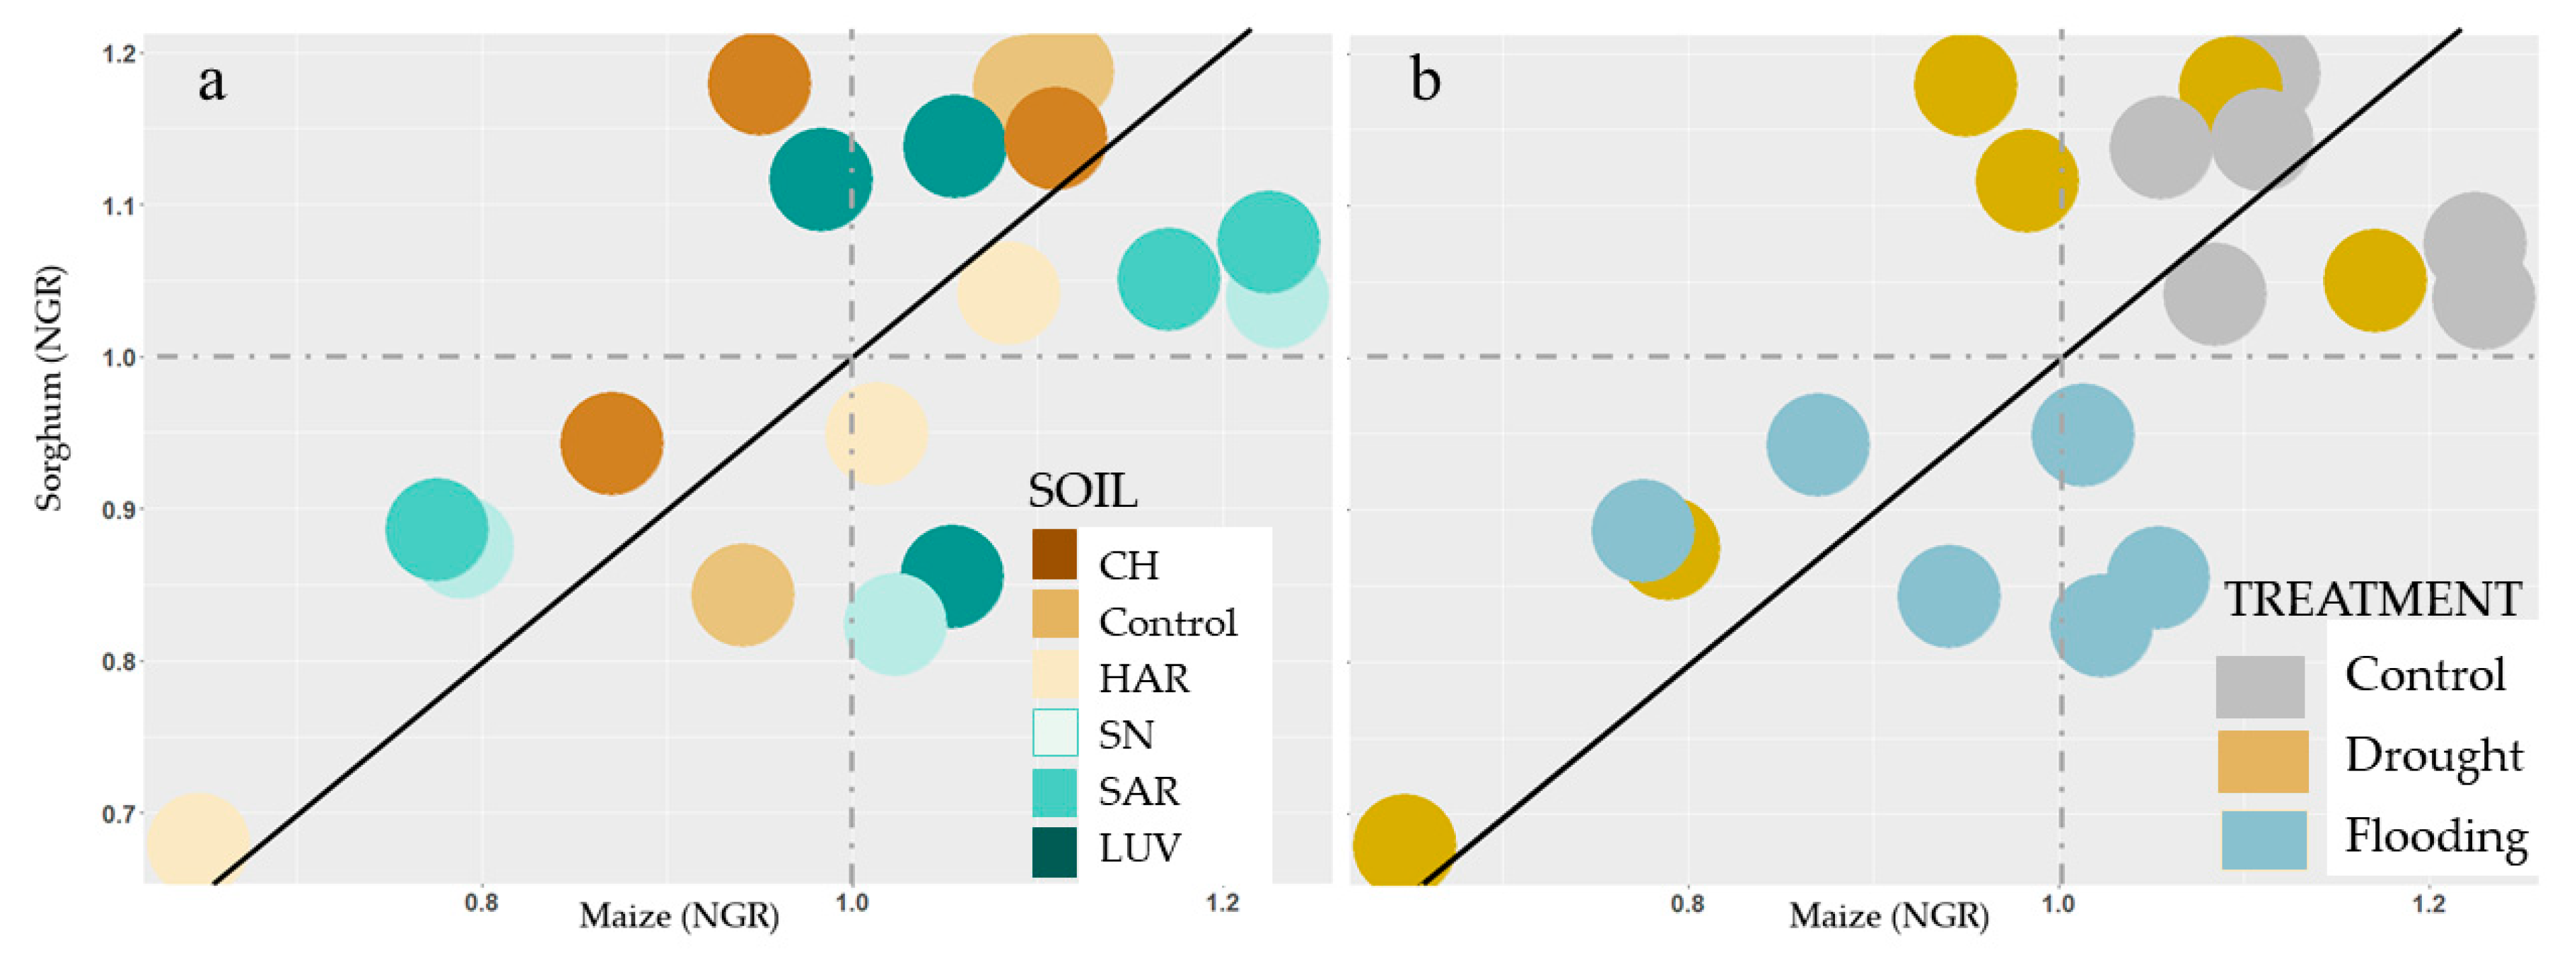
3.1.3. Growth Rate in Different Environmental Conditions

In addition to germination, plant growth was monitored on days 1, 2, 3, 4, 5, 9, and 12. The Normalized Growth Rate (NGR) measured how fast an individual of the same species grew compared to others—above or below the average. Equations (7) and (8) define a growth rate as when the growth intensity of the individual species is equal to the group average. Figure 7a,b illustrate the differences in NGR for maize and sorghum. Flooding had a negative effect on sorghum development in all soil types (Figure 7a), but drought had no significant effect, as it was comparable to the control group except for two soil types (SN and HAR). However, it grew more vigorously even on these soils than maize (Figure 7a). Maize responded differently to different environmental conditions. Water shortage slowed the growth of chernozem, brown forest floor, and saline solonetz. Curiously, maize and sorghum grew least on drought-stricken humic sandy soil, with the results for this soil being worse than those for any other soil (Figure 7b). Unlike sorghum, the floods did not threaten the development of maize on humic sandy soil, brown forest floor, and saline solonetz.

3.2. Comparison of Stress Tolerance of Maize and Sorghum

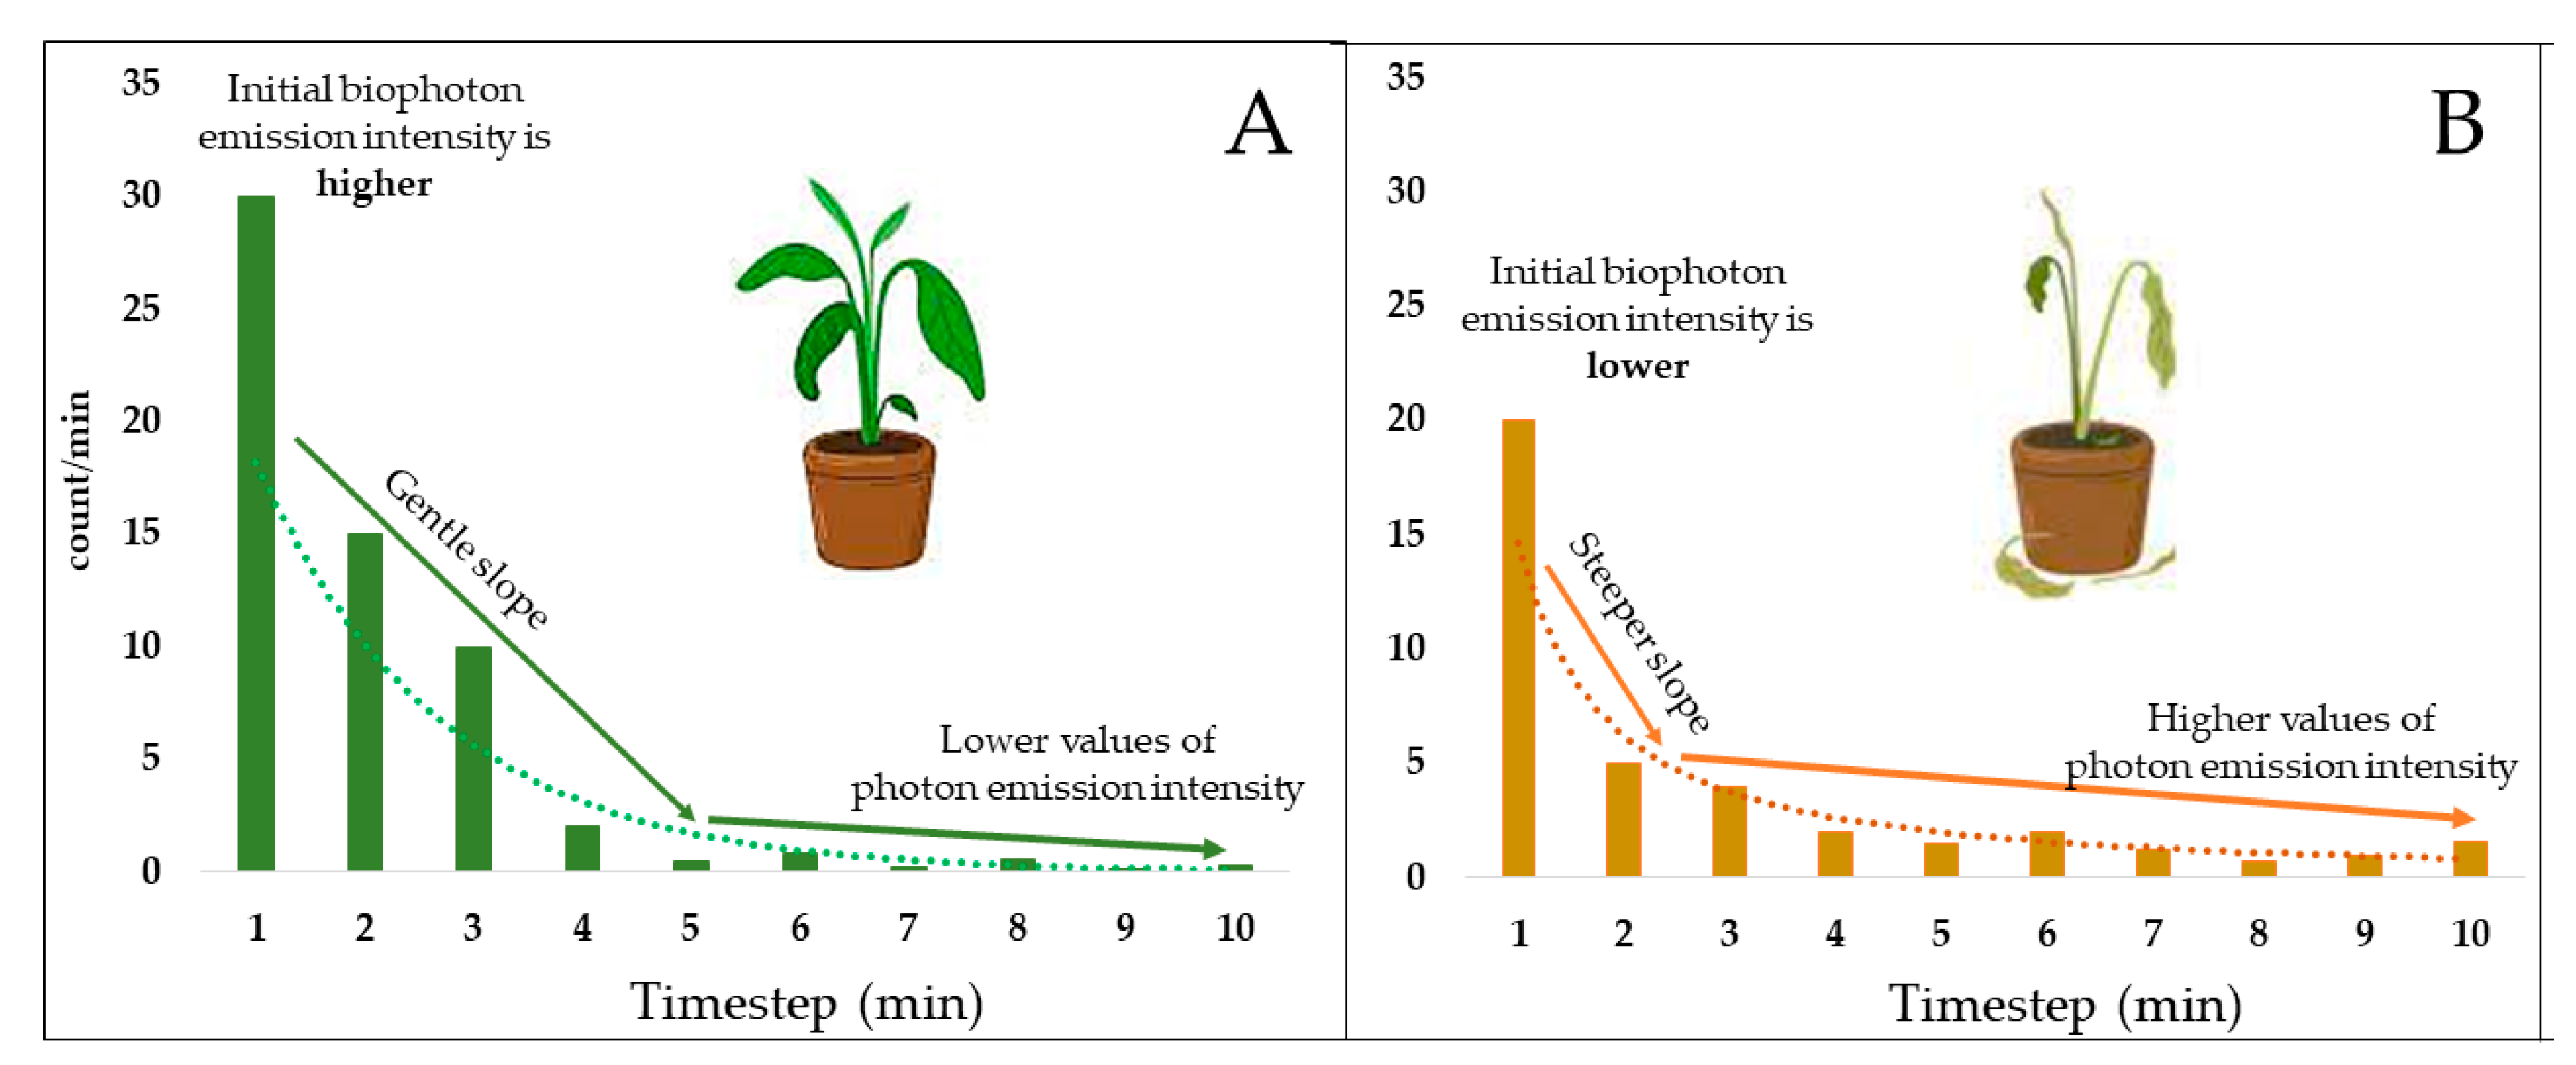
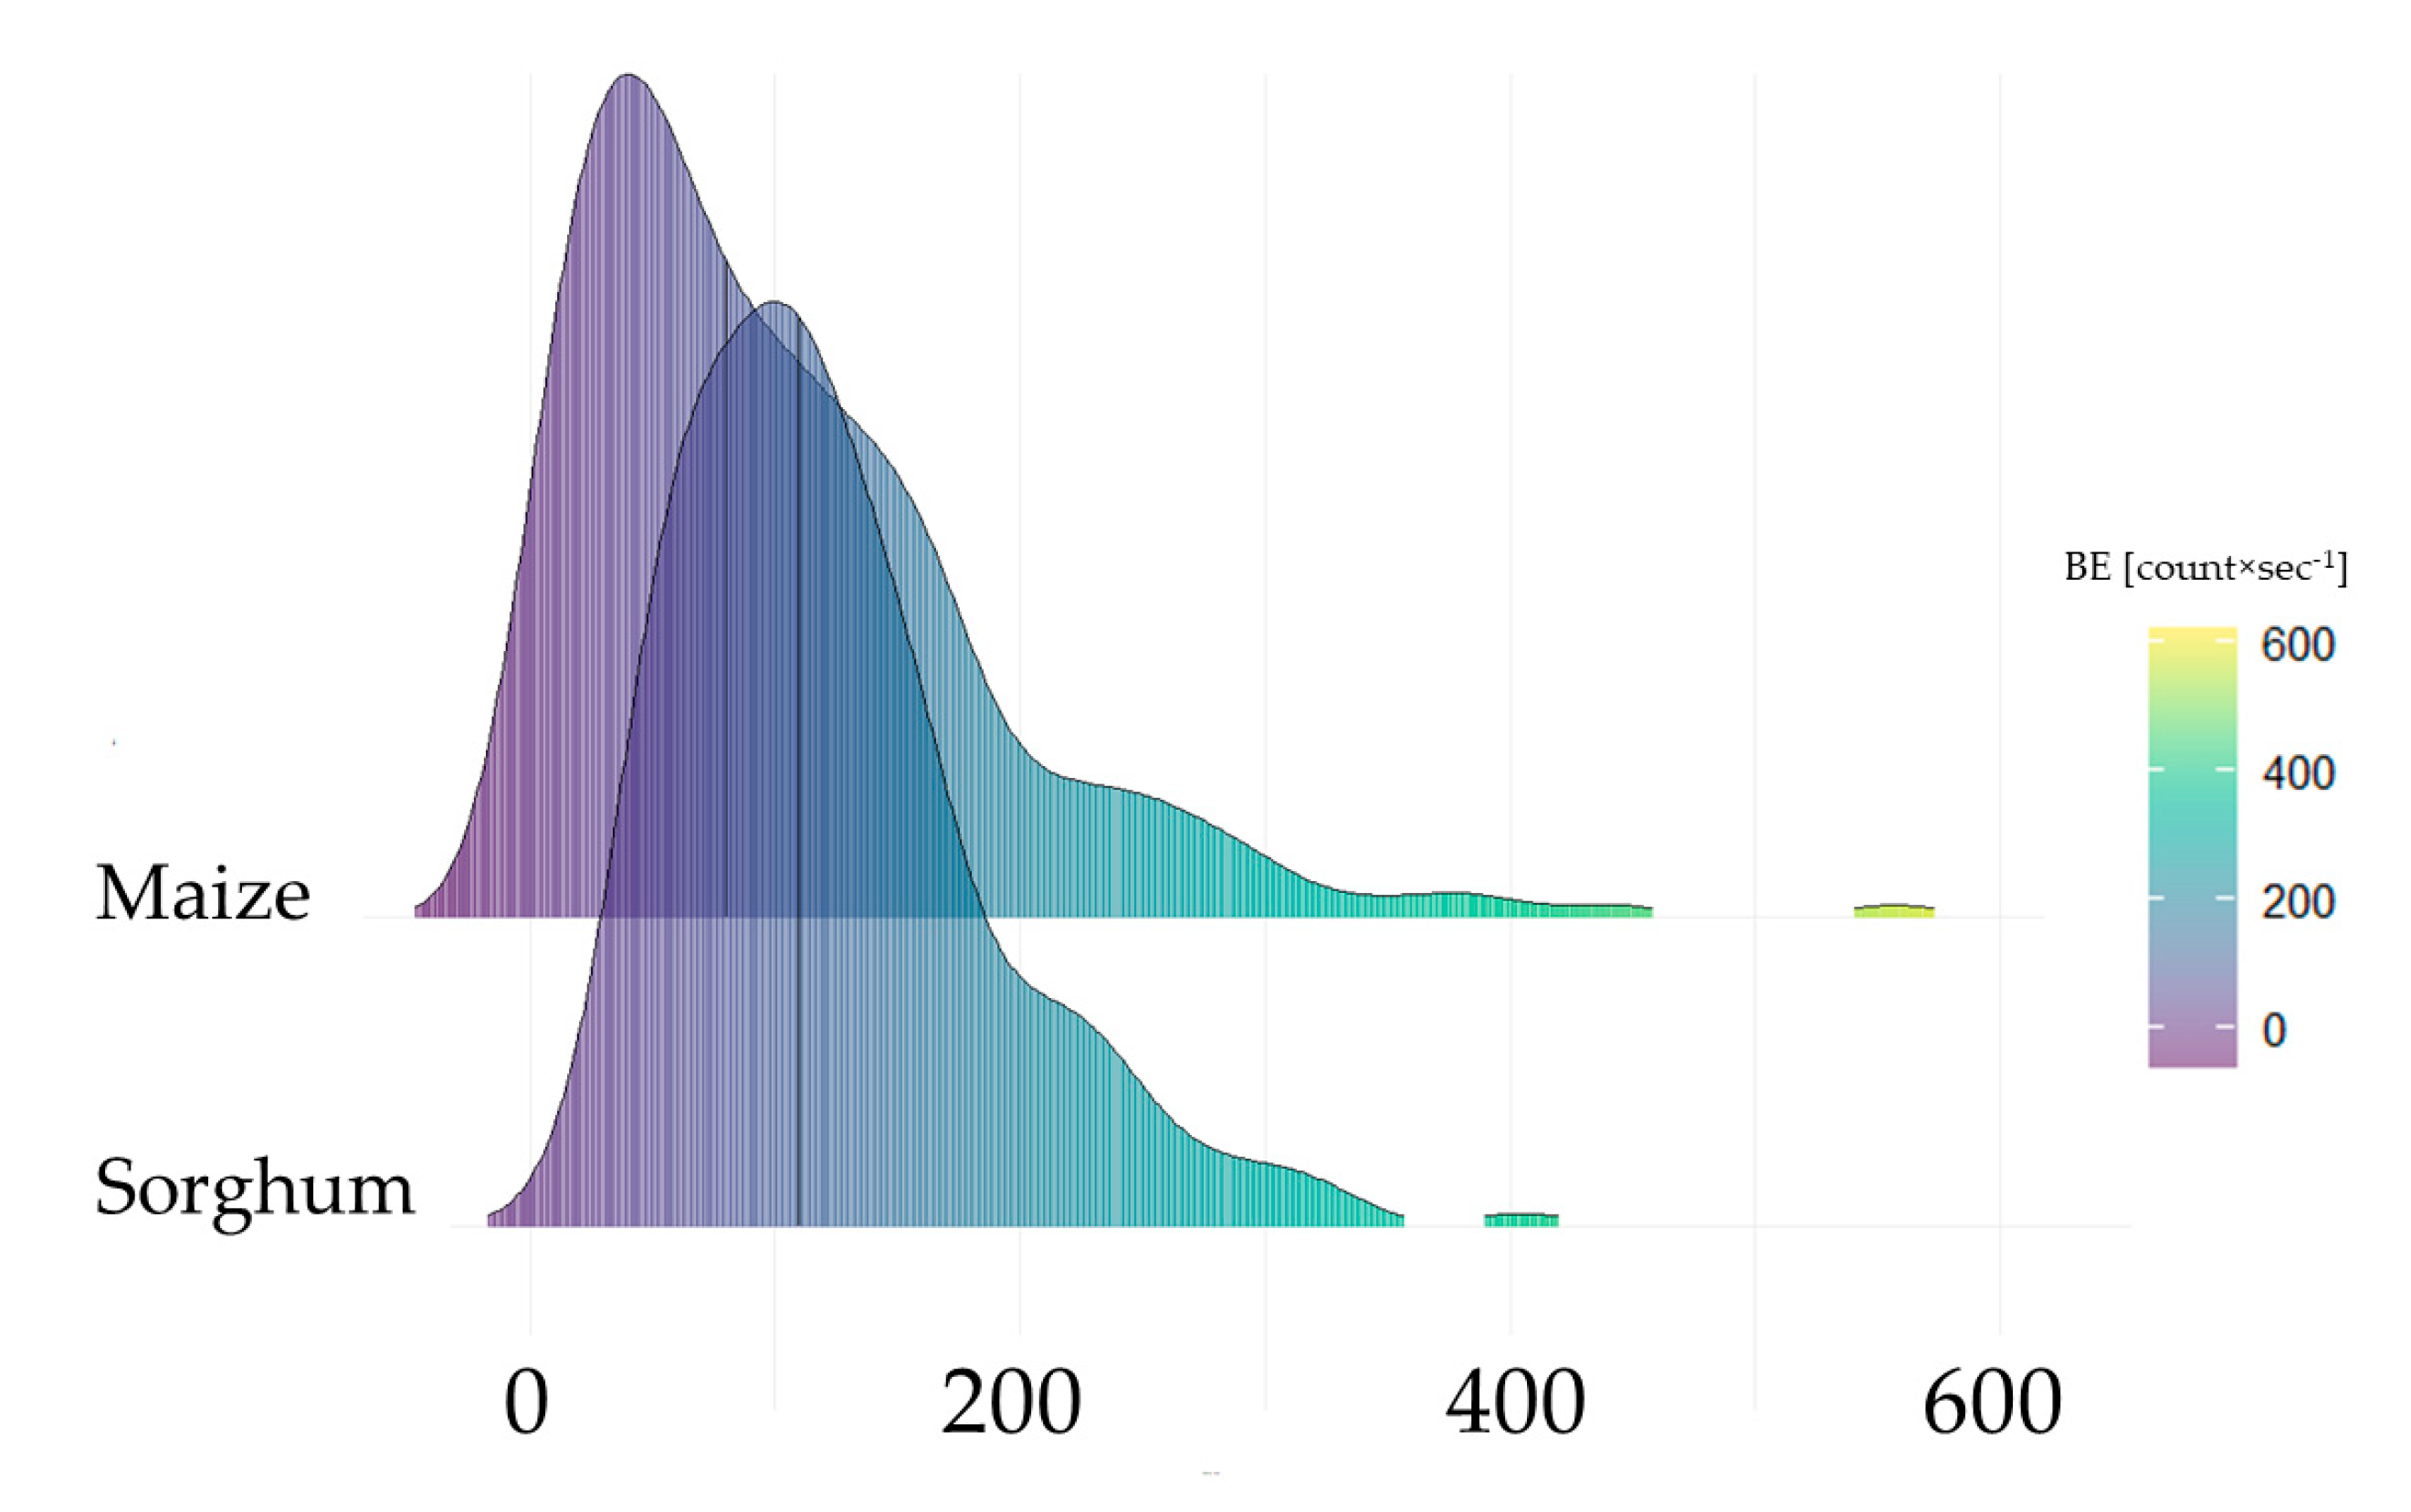
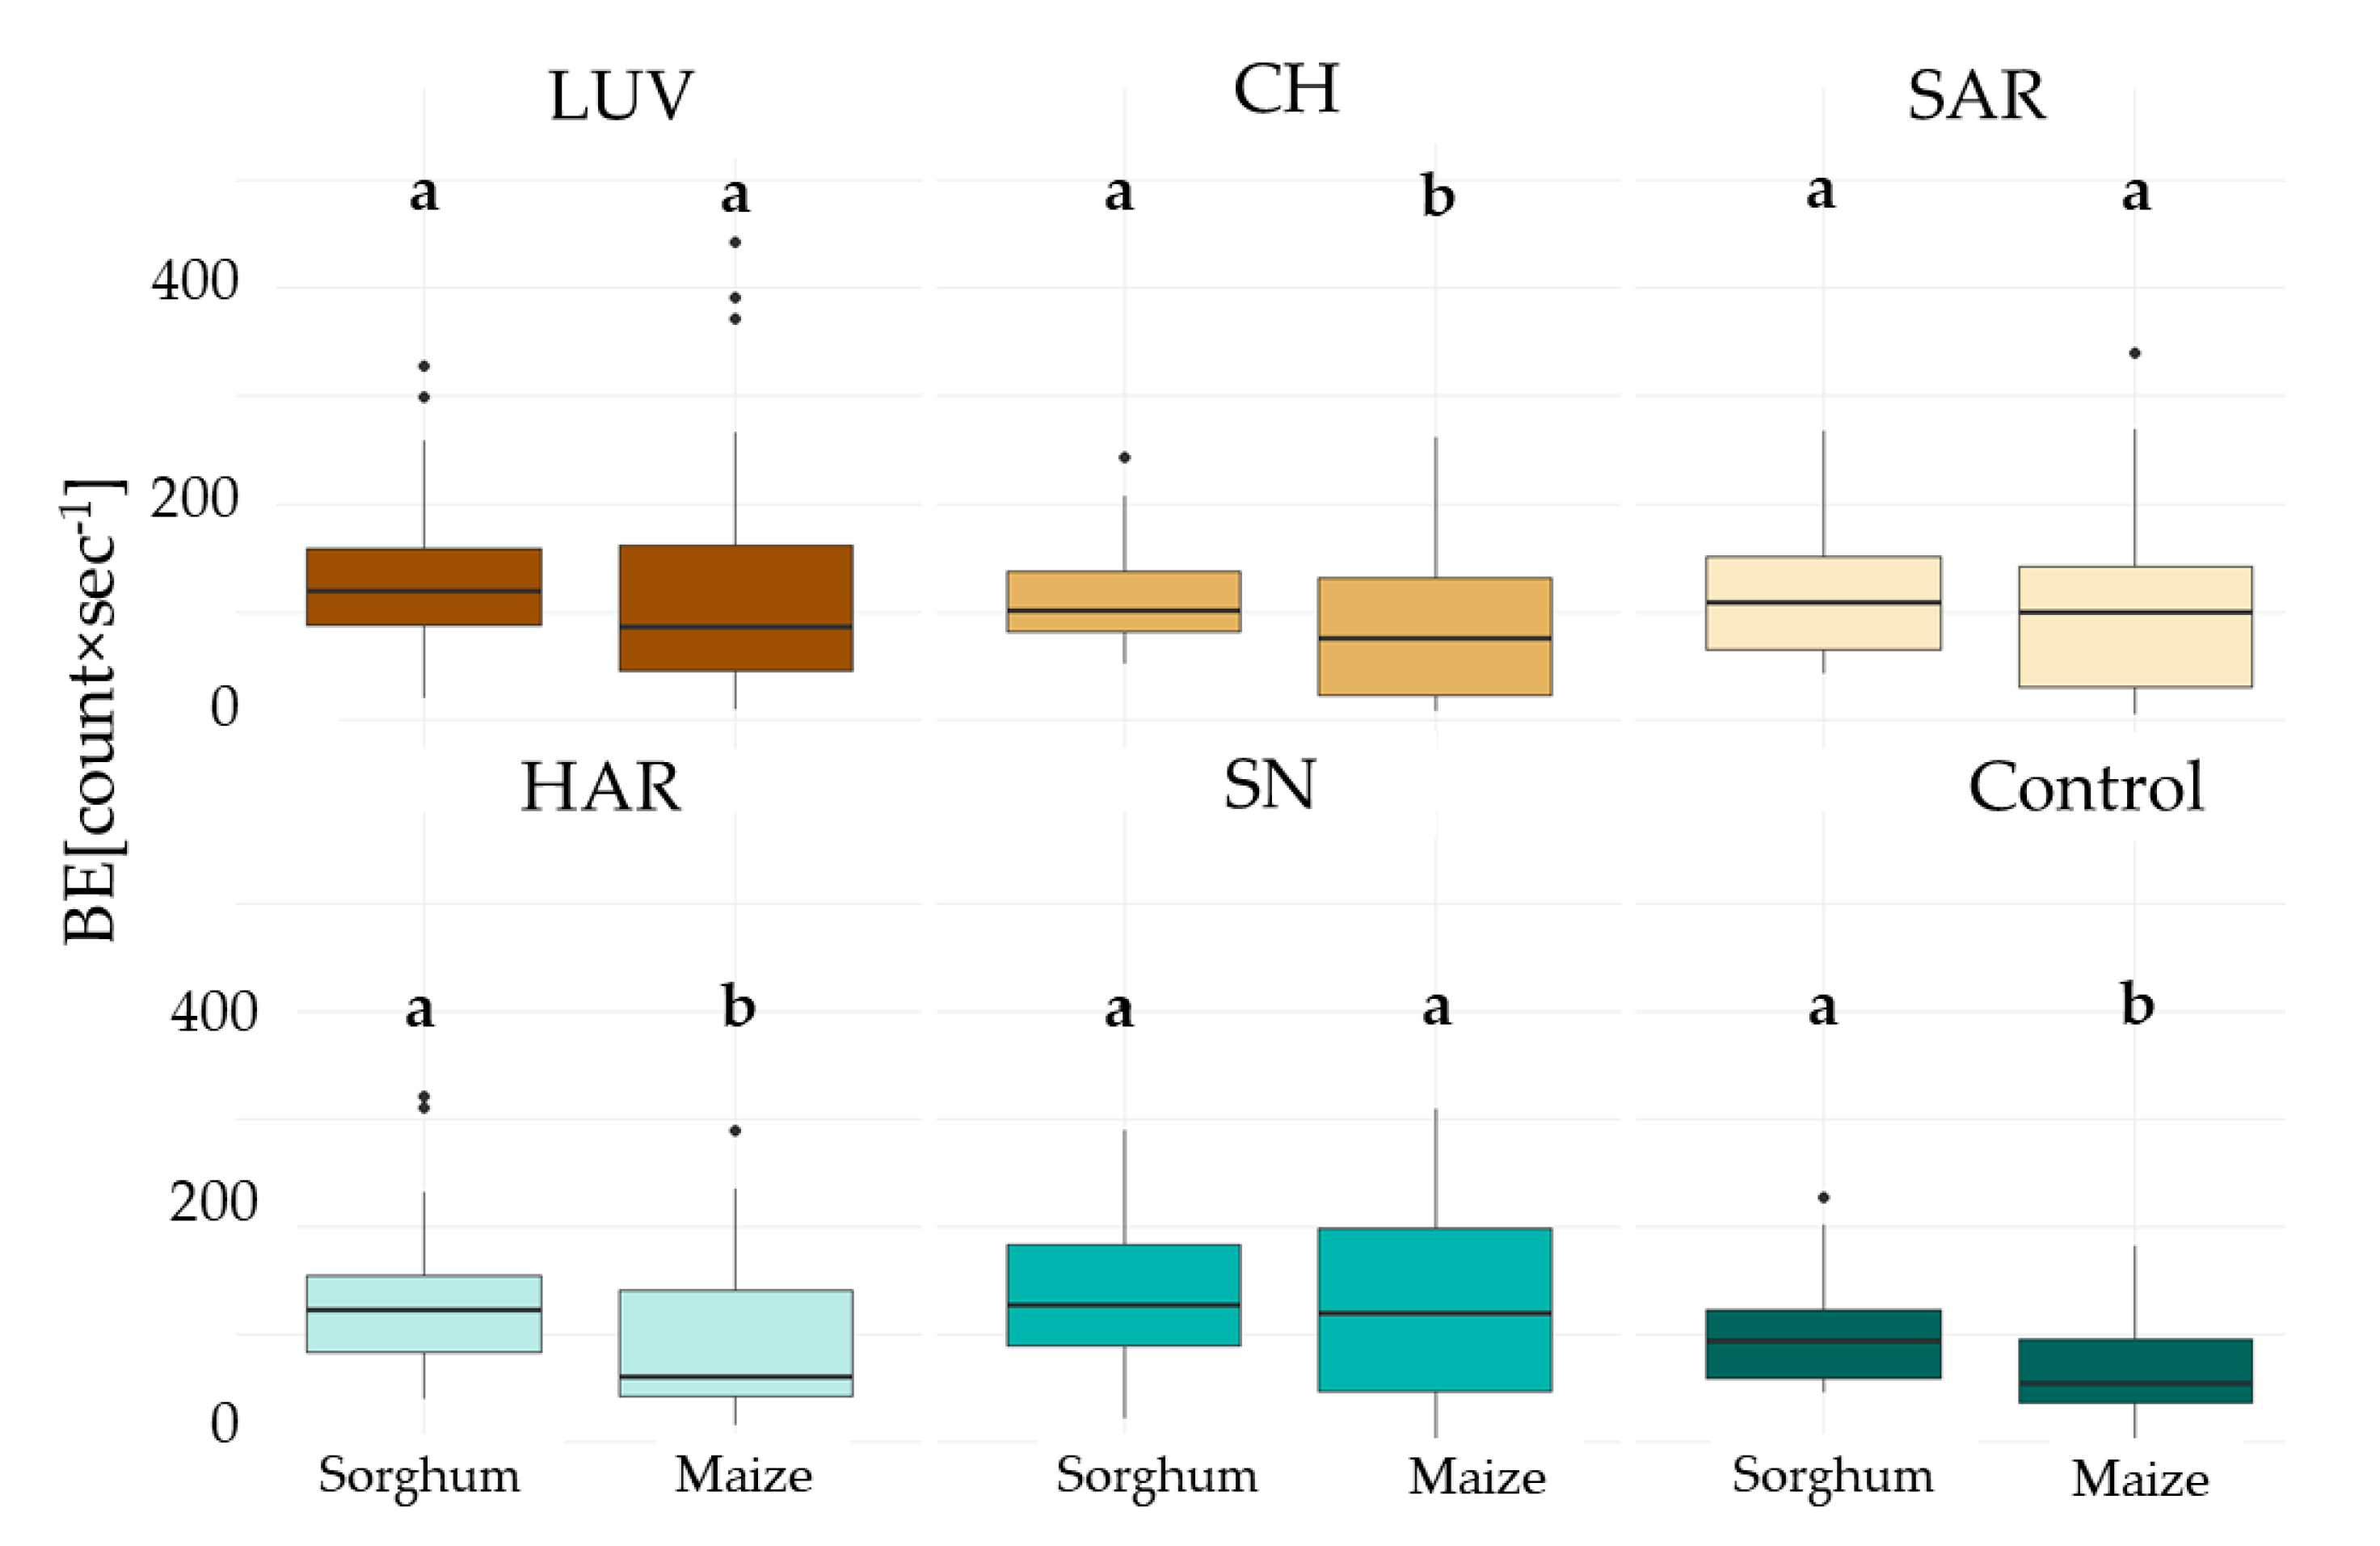
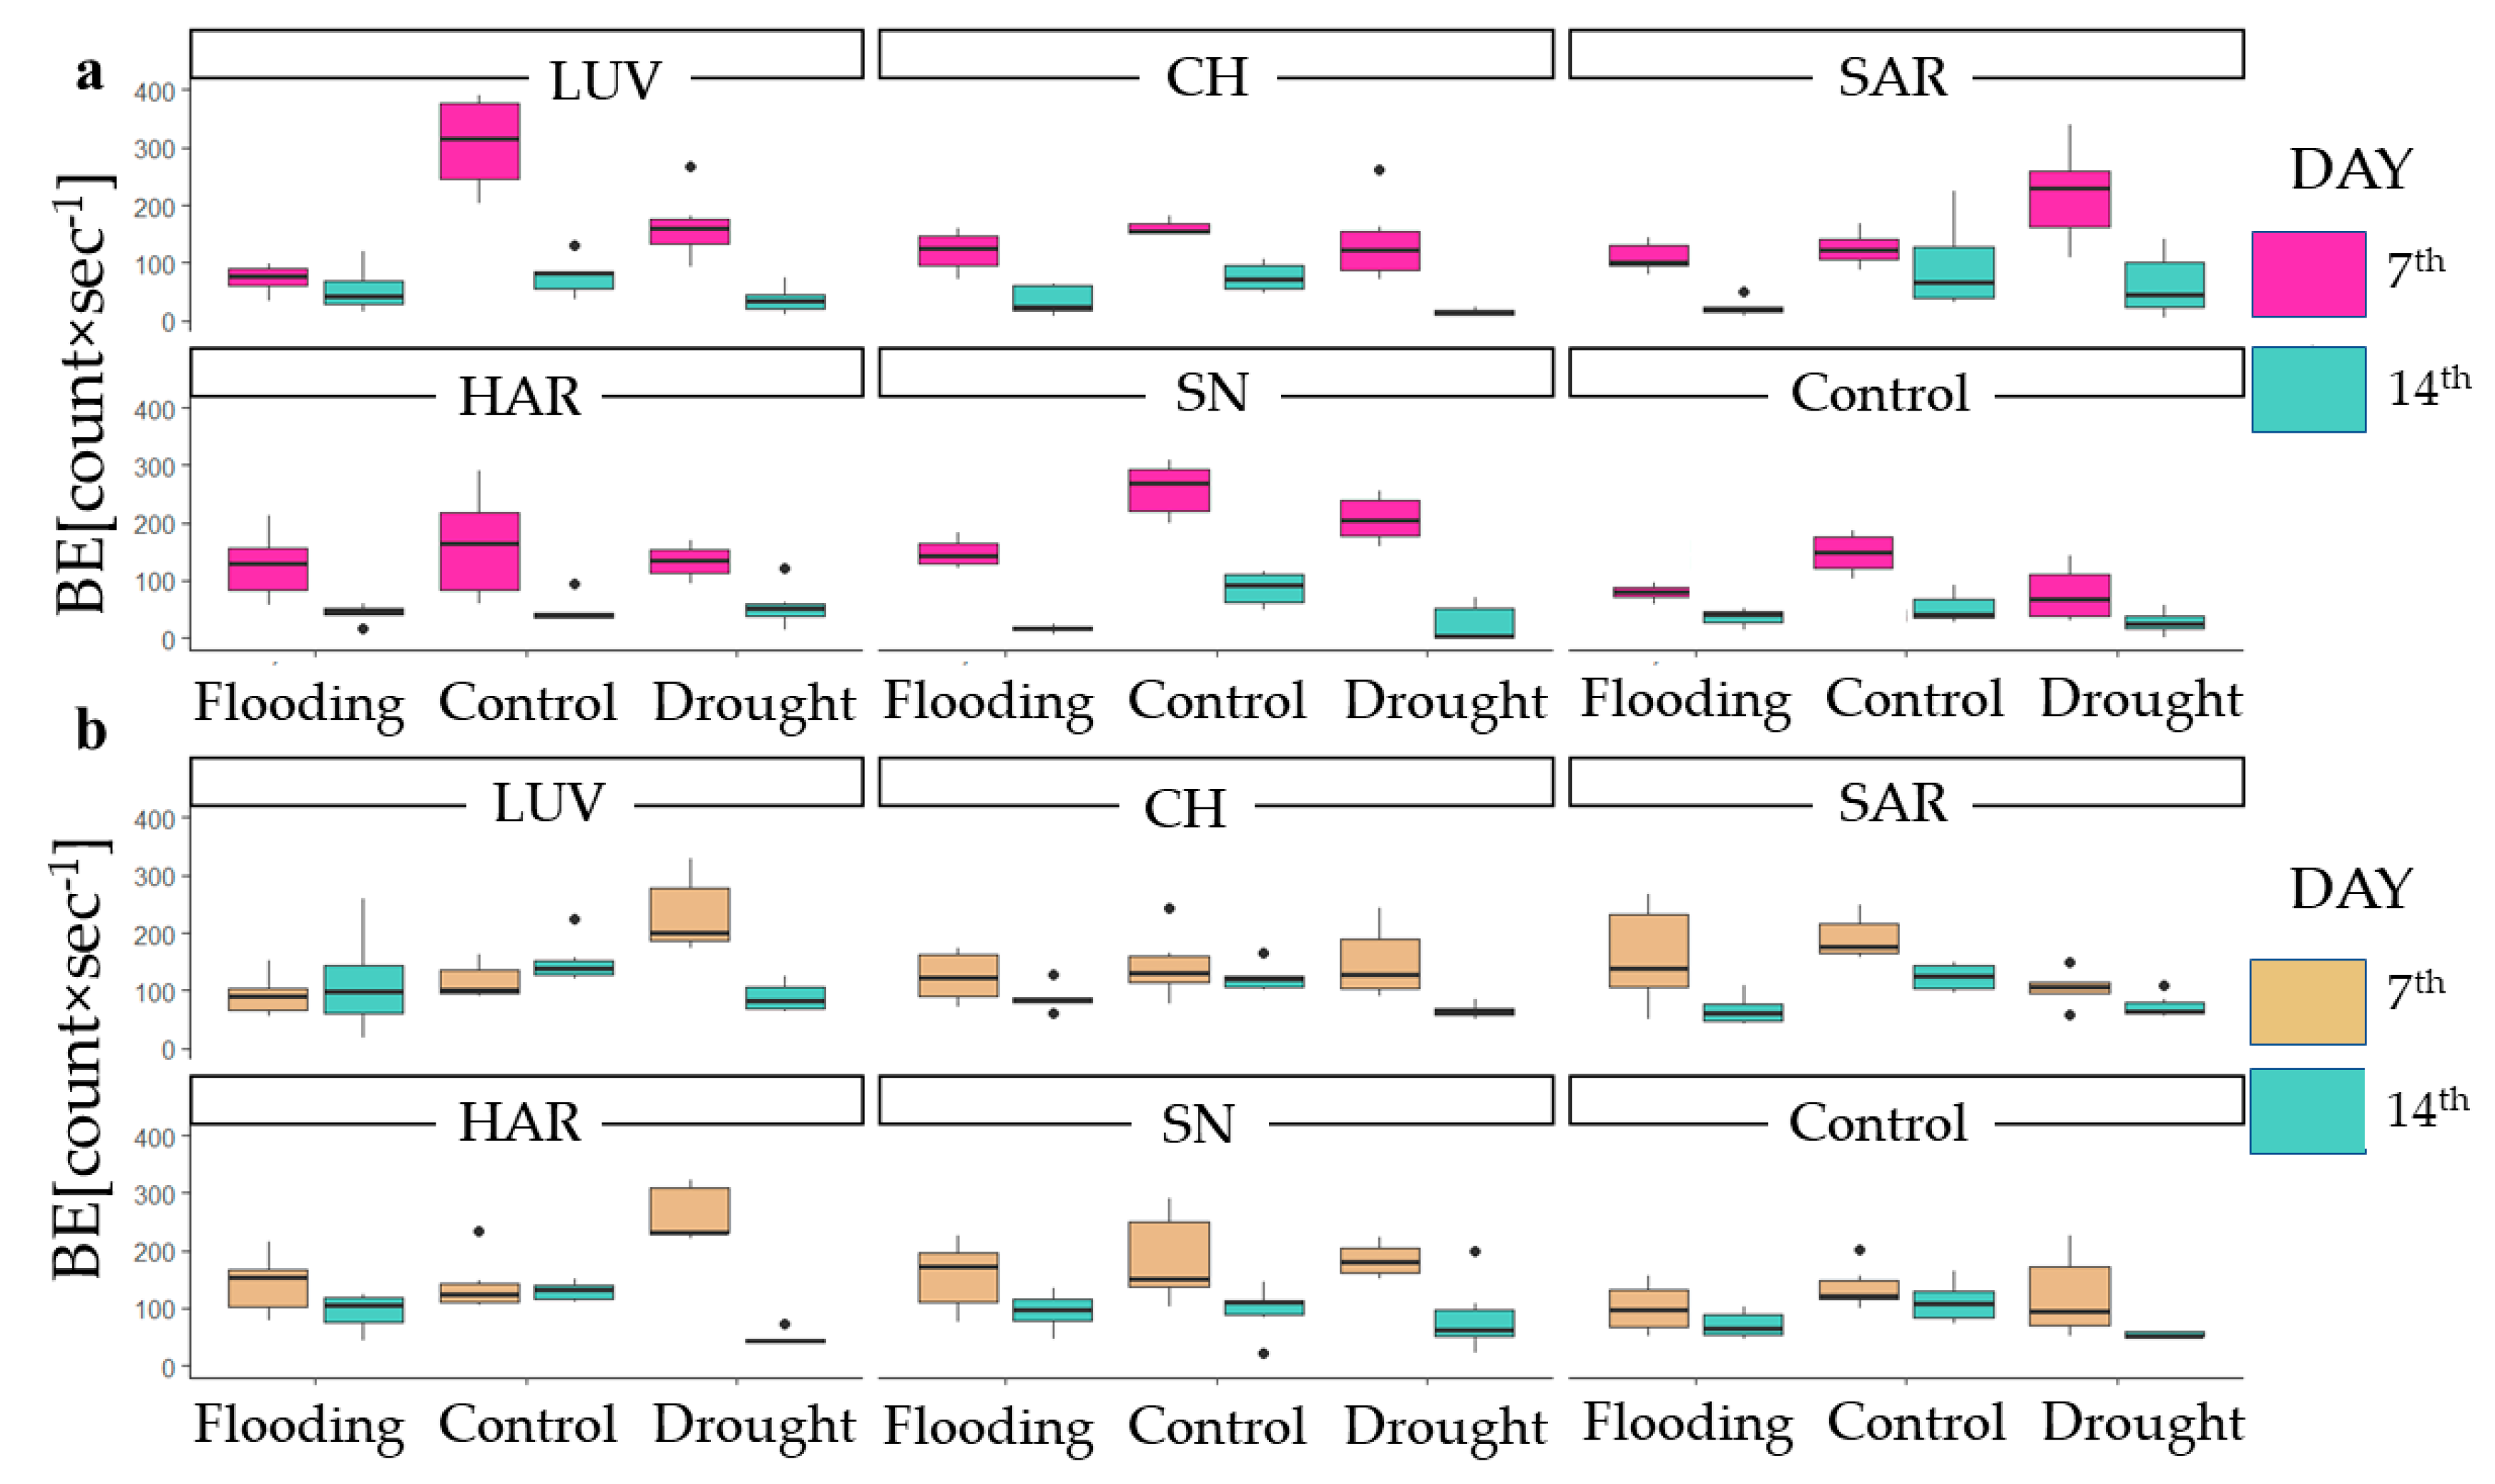
3.2.1. Initial Biophoton Emission Intensity Results

First, the initial biophoton emission intensity was used to quantify plant stress. A higher initial biophoton emission intensity [cps] means a healthier, less stressed plant. Table 4 shows how variables individually and together affect initial biophoton emission. Soil type and evaluation day affect plant stress individually and together (Table 5). Plant and evaluation day have a strong interaction influence, while the “Soil:Plant” and “Treatment:Plant” have a less significant but still measurable effect. The four-way ANOVA showed a common effect for “Soil:Day:Treatment:Plant”, demonstrating that all four components should be included in future analyses.
A Principal Component Analysis (PCA) was used to identify the variables that had the greatest impact on the variance of the data (Figure 8). The variable with the highest impact was time (“Day”) (Figure 8a), followed by species (“Species”) (Figure 8b). The third and fourth variables were “Treatment” and “Soil”, respectively (Figure 8c,d). It should be emphasized, that the interaction between these four variables was confirmed by the results of the four-way ANOVA (Table 5).
The initial biophoton emission intensity is an important factor in identifying the stress level of plants [23]. Based on the density functions, sorghum had a smaller variance, resulting in a more uniform and less variable stress response compared to maize. However, the difference in mean emission values was minor (Figure 9). There were some outlier data for maize, which may be related to some plants growing on the brown forest floor. The measurements have been validated and are therefore considered to be accurate.
The effect of soil type on stress levels is one of the main focuses of this study. The ANOVA results (Table 4) indicate that soil type individually had a significant effect on initial biophoton emission intensity. For further analysis, a Duncan’s post hoc test was performed, which showed a significant difference in the health status between maize and sorghum in the cases of the chernozem (CH), humic sand (HAR), and control potting soil (control) (Figure 10). Both the mean and the interquartile range show differences between the crop species, with maize having a lower mean and a higher variance.
A visualization of the three-way ANOVA is presented in Figure 11. It shows the effect of time (evaluation day), soil type, and treatment on the initial biophoton emission intensity for maize (Figure 11a) and sorghum (Figure 11b) separately. Overall, it was observed that the initial biophoton emission intensity for maize decreased more radically by the second evaluation day (14th day after sowing), meaning that the general stress level and condition of the plants were considered to have deteriorated to a greater extent than in sorghum.
Due to the onset of oxidative processes, which can be described as a natural process, by the second evaluation day (14th day), even in a stress-free environment, the biophoton emission intensity decreased to lower values. Therefore, comparing the control water regime for both species, it can be stated that sorghum was more able to maintain its general physical condition at a higher level compared to the first evaluation day (7th day) than maize. Consequently, maize was more affected by the soil type, which was considered to be less suitable for it. Maize is more resistant to waterlogging and performs better on compacted soils such as brown forest floor (LUV), chernozem (CH), or saline soils (SN). Sorghum, on the other hand, tolerates these soils well only under drought conditions, as evidenced by the increase in biophoton emission values on the second evaluation day (14th day). In looser sandy soils, the difference between the water treatments was smaller for both species. Moreover, humic sand (HAR) showed an exceptionally good performance under drought conditions for sorghum.

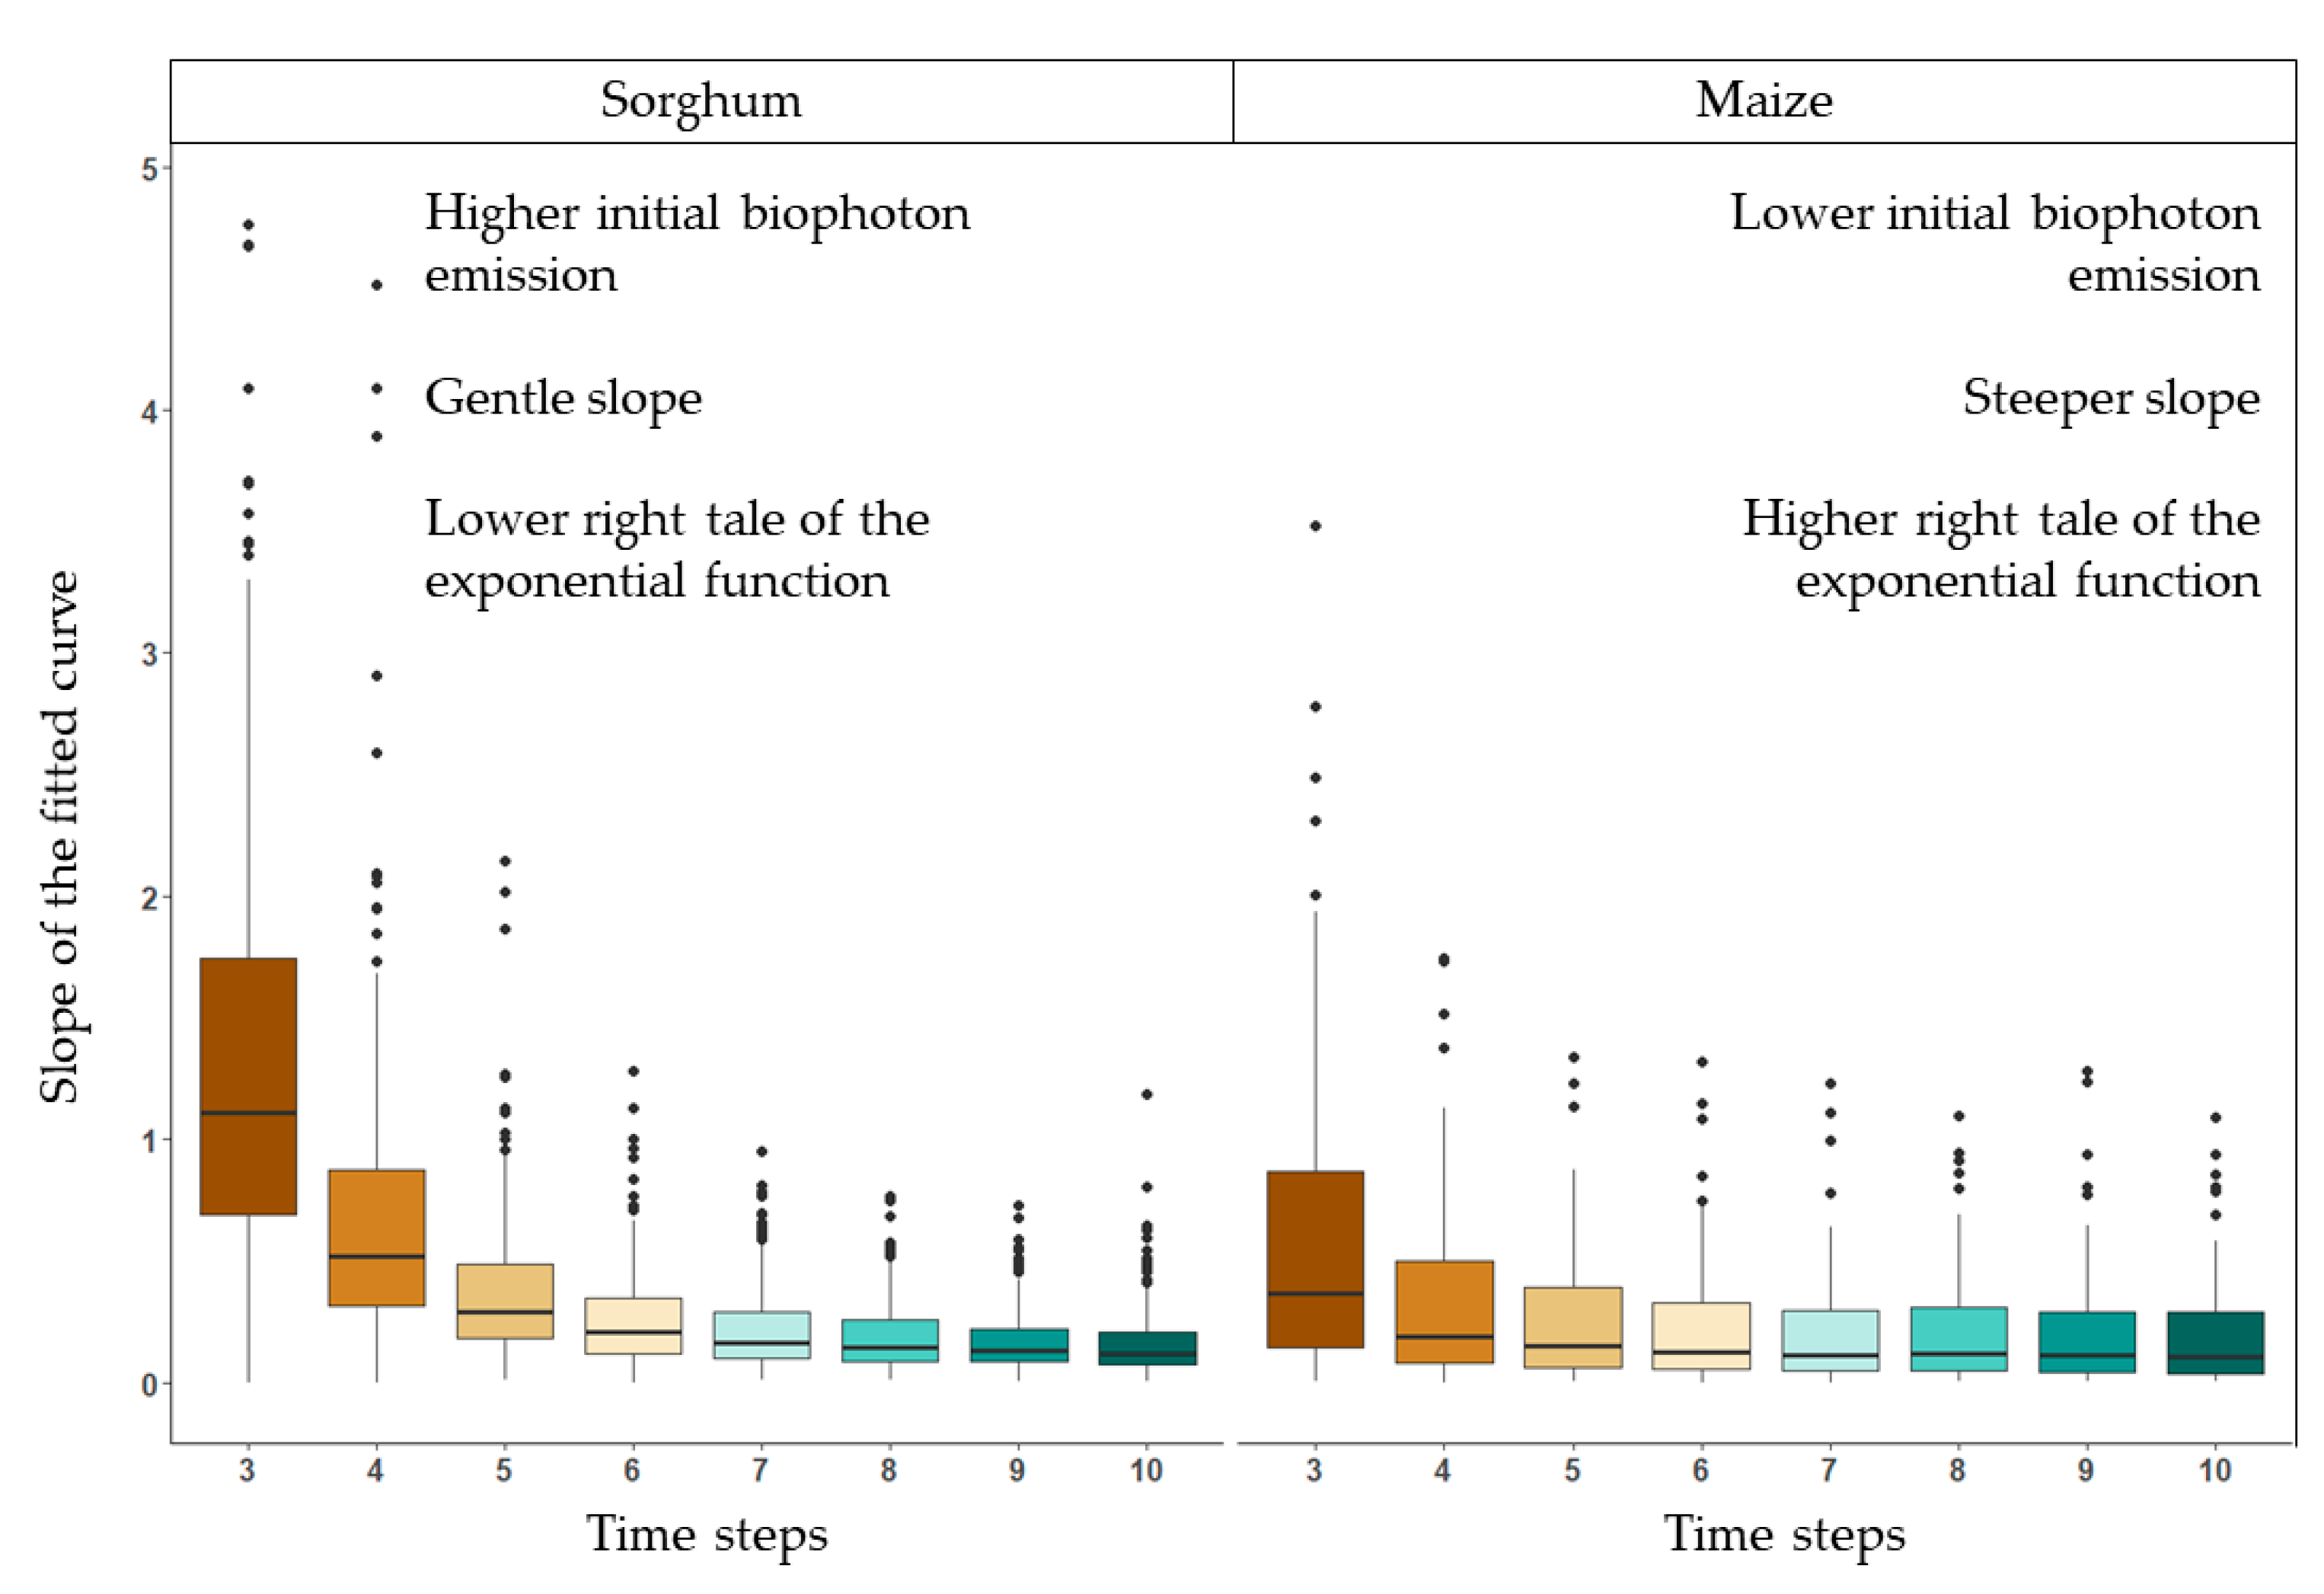
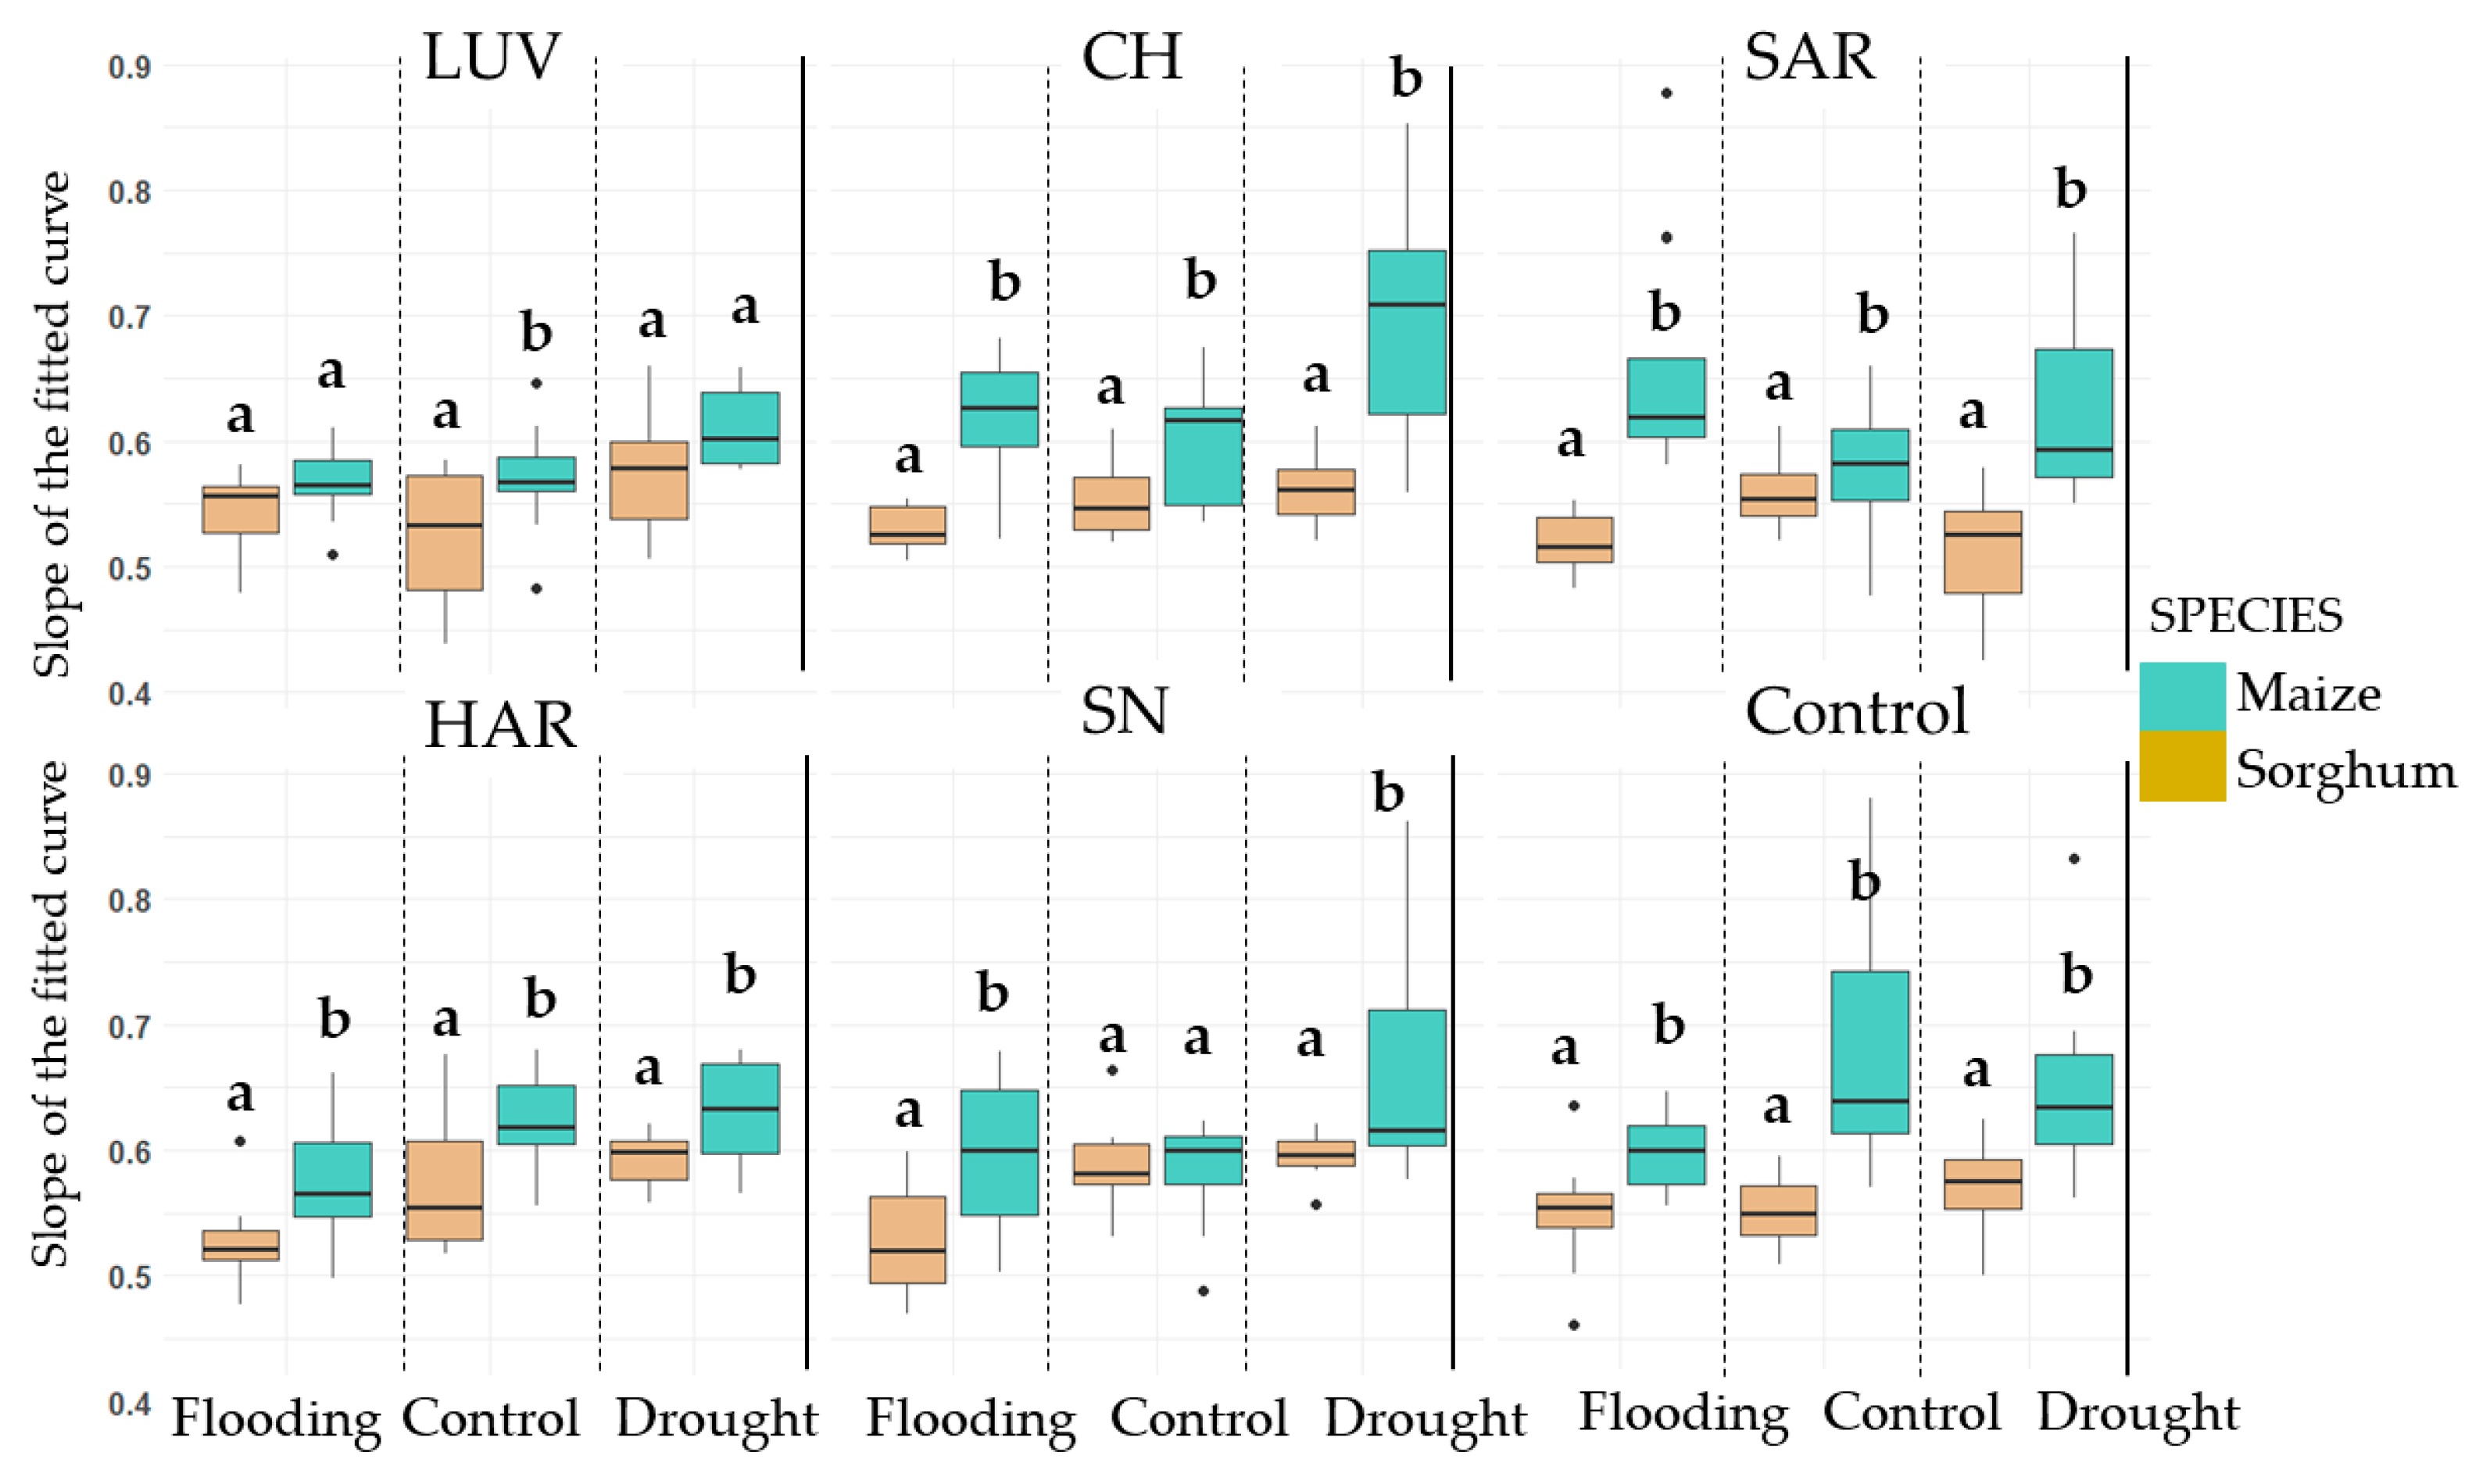
3.2.2. Decay of the Biophoton Emission Intensities

The slope of the decay is an appropriate indicator of the stress level of the plants be-cause the steeper the slope, the more stress the plant is likely to be exposed to. The first two time steps were ignored because, due to the exponential decrease, there was a significant difference between the first and subsequent time steps, which smooths the curve and obscures the emerging differences. Figure 12 shows the total biophoton emission intensities at time steps between 3 and 10 min. The lower biophoton emission values and the smoother slope of the decay suggest that sorghum was in a better physiological condition than maize. For a more detailed analysis, the slope of the decay with the results of Duncan’s post hoc test is shown in Figure 13. In most instances, both along the soil types and the water treatments, sorghum is considered to be in a better health state, except at times when there was no significant difference between the results. These instances are the brown forest floor (LUV) with the extreme water regimes of flood and drought and the saline solonetz with the control water regime. There was no case in which the biophoton emission decline of maize was below the slope of sorghum (Figure 13).

4. Discussion

4.1. Germination

Germination speed and uniformity were significantly higher for maize. This could have been the result of physiological responses to constant temperature. This experimental temperature may have been closer to the optimum germination temperature for maize, which, according to the literature, is 24–26 °C [43], which led to the earlier and more uniform germination vigour of maize [44]. At the same time, the germination of sorghum is supported by the findings of Brar and Stewart [45], who found that sorghum germination exceeded 80% in three days at a constant temperature of 21 °C, which is consistent with our results, as, in our study, the germination rate exceeded this level of germination on the second day at a constant temperature of 22 °C.
As a next step, the germination ability of maize and sorghum seeds was studied in five different soil types characteristic of temperate climates.(Figure 6). The percentage and speed of germination were the highest under optimal water supply, which is in agreement with the results of Khaeim et al. [46]. In their study, the germination and growth rate of maize were examined under various water supplies ranging from 0 to 12 mL with a volume step of 1 mL. For maize, waterlogging caused a more significant reduction in germination than drought, and the difference was significant. The average germination percentage was 90% in the control group and 88% under dry conditions. Flooding caused a reduction to an average of 80% of germination rate. This result is also in agreement with the results found by Khaeim et al. [46]. The high water content indicated severe oxygen reduction in the soils, which led to a reduced germination percentage and a prolonged germination time. These results correspond with those of Yasin and Andreasen [47], whose study of six different vegetable species proved that lower oxygen levels resulted in a significant reduction in germination. Owing to the low-oxygen environment, metabolic processes shift from aerobic to anaerobic [48,49]. As a consequence, soil texture may be a key element in successful germination, based on the hypothesis that the initial development stage is more successful in a well-drained, looser soil. This assumption was verified in our study because the shifting sand and the control group showed the highest germination percentage, while the more compact soils with high clay content, such as brown forest floor with clay illuviation and saline solonetz, produced the lowest germination percentage (Table 4). A hard, almost impenetrable layer of soil had formed on top of the soil in the experimental pots, preventing the seedlings from emerging. It would be worthwhile to repeat the experiment under natural conditions as a field experiment, where this phenomenon is less likely to occur [50]. The germination percentage of sorghum was better than that of maize in all soil types except in the humic–sandy soils; however, the difference in this soil was not significant (82.22% for maize and 81.11% for sorghum). All in all, comparing the two species studied, it can be stated that sorghum germinated faster and more uniformly than maize regardless of soil texture or water stress.
Although our study only compared one maize/sorghum hybrid, it is important to note that hybrid selection can significantly alter germination and growth rates. Specific waterlogging-resistant maize/sorghum hybrids are available, so the results may differ if these more resistant hybrids are selected [51].

4.2. Growth Rate

In order to compare the growth rates of maize and sorghum, a parameter was created: the Normalized Growth Rate. This parameter relates the growth of each individual to the group average. It allows the effect of different soils on plant growth to be compared while avoiding the limitation of including different growth rates of different species in the analysis.
The growth rate of sorghum in the first 14 days was more prosperous in dry conditions, especially on compact soils such as brown forest floor or solonetz, while flooding favoured the growth of maize, except on chernozem and shifting sand soils (Figure 7). The worst growth rate results for both species were associated with the humic sandy soils in all water conditions. Sorghum growth is less dependent on soil type than maize, but it is also less tolerant to flooding. These characteristics of sorghum were studied by Starggenborg et al. [28], who found that sorghum has an advantage over maize in dryland conditions due to its better water uptake capacity, achieving higher yields and organoleptic values. On the contrary, maize is more sensitive to soil quality and water scarcity but more tolerant of flooding. Tolk et al. [52] demonstrated that sorghum thrived on clay soils with adequate irrigation. In regions with insufficient irrigation or precipitation, loam soil is favoured for grain sorghum production due to its substantial plant-available water-holding capacity.
In the context of climate change, soil saturation in the growing season is expected to decrease in the future [53]. Although winter precipitation in the temperate zone has been increasing in recent decades, spring drought has recently become an increasing threat [54,55]. This is an unfavourable trend for maize development but could be a potential opportunity for sorghum production. In addition, elevated atmospheric CO2 reduces the water requirements of sorghum [56], which further strengthens the potential use of sorghum in temperate but vulnerable mid-latitude areas.

4.3. Analysis of Stress Tolerance

In addition to investigating germination and growth indicators, it was necessary to assess stress tolerance to gain insight into the physiological processes of the plants.
First, the initial biophoton emission was studied. Higher values are associated with more favourable physiological conditions. Considering all soils and treatments together, there was no significant difference in plant stress status between maize and sorghum (Figure 9). However, when the treatments (soil types and water regimes) were taken into account, significant differences in the initial biophoton emission values of the plants were observed. These differences were confirmed by multi-way ANOVAs in this study (Table 5).
Between the two plant species, the largest difference in the initial biophoton emission value during the experimental period was the difference in biophoton emission between plant species of the same age but different developmental stages and sizes (Figure 11). The physiological background for this could be the fact that during the initial developmental stage, cell division processes, including chloroplast differentiation and chlorophyll formation, are very intense, which is reflected in the initial biophoton values of the two plant species studied. This is also supported by the decrease in the biophoton emission intensity values in the control group. Additionally, the abiotic stresses applied may also amplify their effects over time.
Significant differences in initial biophoton emission were observed in a comparison of optimal and drought-stressed plants. Compared to the optimal water supply, which consistently showed the highest biophoton emission values, the values for maize under the chernozem–drought, saline solonetz–drought, and brown forest floor–drought conditions were significantly lower by the 14th day after sowing (Figure 11). Initial biophoton values are considered to be indicative of the physiological state of a plant and, more precisely, the state of the photosynthetic apparatus [57,58]. In earlier works, it has been demonstrated that this type of photon emission decreases when a stressor affects the photosynthetic apparatus, as has been observed for Chlorella spp. herbicide treatment [20] and heat stress in wheat [59]. This was clearly shown in the higher values of initial biophoton emission intensities for sorghum, which only exhibited significantly worse results than the control group in the humic–sandy soil–drought treatment pair on the 14th day. It can be stated that sorghum is more stress-tolerant in dry conditions. This result is identical to those of Silah et al. [60] and Tari et al. [61]. They found that the resilience of sorghum is connected to efficient water extraction from the soil, a lower number of nodal roots per plant, and a reduced count of metaxylem vessels in nodal roots. Additionally, these plants exhibited characteristics such as a smaller leaf area and the presence of well-developed sclerenchyma in their leaf tissues. As a consequence, the role of the soil texture, even in the juvenile development phase of the plants, can be detected; however, the sensitivity to water scarcity varies among developmental stages. Sorghum is affected by water shortage on the highest level in the vegetative and early reproductive stages [62]. However, sorghum is also more capable of taking up nutrients from soil in drought conditions [63]. As well as sorghum, the highest water demands of maize are in the vegetative phase, causing a severe reduction in leaf area values [64,65].
The last studied stress parameter was the slope of the fitted exponential curve on the 10-min biophoton emission measurements. The steeper the slope, the higher the stress level of the plants (Figure 12). This parameter is suitable for testing the effects of stress [23]. This parameter showed a significant difference between maize and sorghum (Figure 13). Zhou et al. [66] used initial biophoton emission to assess the effects of drought stress and salinity on barley. This analysis revealed that as the duration of drought stress increased, parameters derived from the decay curve decreased progressively. Drought stress harmed the donor and acceptor sides of photosystem II (PSII), as well as the reaction centre, resulting in a reduction in the electron transfer capacity and overall efficiency of PSII, according to their findings. Furthermore, since this phenomenon is ubiquitous for stressors affecting photosynthetic processes, it also applies to the detection of damage induced by biotic stressors. It was verified by Lukács et al. [22] for cereal leaf beetle (Oulema melanopus L.) infestation and Jócsák et al. [19] for barley powdery mildew (Blumeria graminis f. sp. tritici) infection that the stressed wheat plants exhibited lower initial and faster decay characteristics compared to that of the control. In our study, maize exhibited the highest decrease in biophoton emission in chernozem–drought, chernozem–flooding, shifting sand–drought, shifting sand–flooding, saline solonetz–drought, saline solonetz–flooding, and control soil–drought.
The germination and growth tests showed that sorghum’s stress tolerance exceeds that of maize in many, but not all, conditions. The gradually warming and drying growing season poses a particular threat to maize production in continental areas. However, our experiment has shown that further experiments under field conditions over several consecutive years are needed to obtain a more realistic picture of environmental factors. It is therefore important to consider the effects of atmospheric humidity, radiation stress, and frost sensitivity on the species now being studied. It is important to introduce more precise measurements to gain a comprehensive understanding of microbiological and physiological processes. This will provide a more complete perspective on the subject.

5. Conclusions

The aim of this study was to compare the germination, growth ability, and stress tolerance of maize and sorghum in five different soil types typical of temperate climates and under three water regimes (control, drought, and flooding). All in all, sorghum seemed to be less sensitive to soil texture and more resilient against all the studied abiotic stresses (drought, flooding). The parameters of germination percentage (%), growth rate, and stress tolerance were measured by conducting an analysis biophoton emission intensities (cps). All the three parameters were found to be suitable for detecting differences in the adaptation of species to stress. The results indicated that sorghum can effectively replace maize in areas where there is no waterlogging and the weather is tending to be drier than in the past. In the future, field experiments including more maize and sorghum varieties should be conducted in the areas where the experimental soil types have been collected in order to explore the effects of the natural environment.

Author Contributions

Conceptualization, K.S.-T., R.H., A.P. and S.K.; data curation, K.S.-T. and A.P.; formal analysis, I.J.; methodology, K.S.-T., I.J. and A.P.; supervision, S.K.; validation, R.H. and I.J.; visualization, K.S.-T.; writing—original draft, K.S.-T., R.H. and I.J.; writing—review and editing, A.P. and S.K. All authors have read and agreed to the published version of the manuscript.

Funding

This research received no external funding.

Data Availability Statement

The datasets analysed during the current study are not publicly available due to privacy reasons, but they are available from the corresponding author on reasonable request.

Conflicts of Interest

The authors declare no conflicts of interest.

References

  1. Khanal, A.R.; Mishra, A.K. Enhancing food security: Food crop portfolio choice in response to climatic risk in India. Glob. Food Sec. 2017, 12, 22–30. [Google Scholar] [CrossRef]
  2. Hamza, M.A.; Anderson, W.K. Soil compaction in cropping systems: A review of the nature, causes and possible solutions. Soil Tillage Res. 2005, 82, 121–145. [Google Scholar] [CrossRef]
  3. Mustroph, A. Improving Flooding Tolerance of Crop Plants. Agronomy 2018, 8, 160. [Google Scholar] [CrossRef]
  4. Chaudhry, S.; Sidhu, G.P.S. Climate change regulated abiotic stress mechanisms in plants: A comprehensive review. Plant Cell Rep. 2022, 41, 1–31. [Google Scholar] [CrossRef] [PubMed]
  5. Osakabe, Y.; Osakabe, K.; Shinozaki, K.; Tran, L.S.P. Response of plants to water stress. Front. Plant Sci. 2014, 5, 76566. [Google Scholar] [CrossRef] [PubMed]
  6. Sun, Y.; Wang, C.; Chen, H.Y.; Ruan, H. Response of plants to water stress: A meta-analysis. Front. Plant Sci. 2020, 11, 541682. [Google Scholar] [CrossRef] [PubMed]
  7. Yang, X.; Lu, M.; Wang, Y.; Wang, Y.; Liu, Z.; Chen, S. Response Mechanism of Plants to Drought Stress. J. Hortic. 2021, 7, 50. [Google Scholar] [CrossRef]
  8. Seleiman, M.F.; Al-Suhaibani, N.; Ali, N.; Akmal, M.; Alotaibi, M.; Refay, Y.; Dindaroglu, T.; Abdul-Wajid, H.H.; Battaglia, M.L. Drought Stress Impacts on Plants and Different Approaches to Alleviate Its Adverse Effects. Plants 2021, 10, 259. [Google Scholar] [CrossRef] [PubMed]
  9. Mao, H.; Wang, H.; Liu, S.; Li, Z.; Yang, X.; Yan, J.; Li, J.; Tran, L.S.; Qin, F.A. Transposable element in a NAC gene is associated with drought tolerance in maize seedlings. Nat. Commun. 2015, 6, 8326. [Google Scholar] [CrossRef] [PubMed]
  10. Bunce, J.A. Leaf transpiration efficiency of some drought-resistant maize lines. Crop Sci. 2010, 50, 1409. [Google Scholar] [CrossRef]
  11. Ren, B.; Zhang, J.; Li, X.; Fan, X.; Dong, S.; Liu, P.; Zhao, B. Effects of Waterlogging on the Yield and Growth of Summer Maize under Field Conditions. Can. J. Plant Sci. 2014, 94, 23–31. [Google Scholar] [CrossRef]
  12. Mangani, R.; Tesfamariam, E.H.; Bellocchi, G.; Hassen, A. Growth, development, leaf gaseous exchange, and grain yield response of maize cultivars to drought and flooding stress. Sustainability 2018, 10, 3492. [Google Scholar] [CrossRef]
  13. Borrell, A.; van Oosterom, E.; George-Jaeggli, B.; Vadez, V.; Singh, V.; Hammer, G. Physiology of Growth, Development and Yield. In Sorghum in the 21st Century: Food–Fodder–Feed–Fuel for a Rapidly Changing World, 1st ed.; Tonapi, V.A., Talwar, H.S., Are, A.K., Bhat, B.V., Reddy, C.R., Dalton, T.J., Eds.; Springer: Singapore, Singapore, 2020; pp. 127–155. [Google Scholar]
  14. Yahaya, M.A.; Shimelis, H. Drought stress in sorghum: Mitigation strategies, breeding methods and technologies—A review. J. Agron. Crop Sci. 2022, 208, 127–142. [Google Scholar] [CrossRef]
  15. Zhang, R.; Yue, Z.; Chen, X.; Huang, R.; Zhou, Y.; Cao, X. Effects of waterlogging at different growth stages on the photosynthetic characteristics and grain yield of sorghum (Sorghum bicolor L.). Sci. Rep. 2023, 13, 7212. [Google Scholar] [CrossRef] [PubMed]
  16. Nielsen, R.L. Effects of Flooding or Ponding on Corn prior to Tasseling. Corny News Network 2024. Available online: http://www.Kingcorn.Org/news/timeless/pondingyoungcorn.html (accessed on 19 April 2024).
  17. Kaur, G.; Zurweller, B.; Motavalli, P.P.; Nelson, K.A. Screening Corn Hybrids for Soil Waterlogging Tolerance at an Early Growth Stage. Agriculture 2019, 9, 33. [Google Scholar] [CrossRef]
  18. Gerhardt, V.; Bodemer, U. Delayed fluorescence excitation spectroscopy: A method for determining phytoplankton composition. Archiv. Für. Hydrobiol. 2000, 55, 101–120. [Google Scholar]
  19. Jócsák, I.; Lukács, H.; Varga-Visi, É.; Somfalvi-Tóth, K.; Keszthelyi, S. Identification and investigation of barley powdery mildew (Blumeria graminis f. sp. tritici) infection in winter wheat with conventional stress reactions and non-invasive biophoton emission parameters. J. Biosci. 2023, 49, 6. [Google Scholar] [CrossRef]
  20. Bodemer, U.; Gerhardt, V.; Yacobi, Y.Z.; Zohary, Z.; Friedrich, G.; Pohlmann, M. Phytoplankton abundance and composition of freshwaters systems determined by DF excitation spectroscopy and conventional methods. Arch. Hydrobiol. Spec. Issues Adv. Limnol. 2000, 55, 101–120. [Google Scholar]
  21. Salvatori, E.; Fusaro, L.; Gottardini, E.; Pollastrini, M.; Goltsev, V.; Strasser, R.J.; Bussotti, F. Plant stress analysis: Application of prompt, delayed chlorophyll fluorescence and 820 nm modulated reflectance. Insights from independent experiments. Plant Physiol. Biochem. 2014, 85, 105–113. [Google Scholar] [CrossRef] [PubMed]
  22. Lukács, H.; Jócsák, I.; Somfalvi-Tóth, K.; Keszthelyi, S. Physiological responses manifested by some conventional stress parameters and biophoton emission in winter wheat as a consequence of cereal leaf beetle infestation. Front. Plant Sci. 2022, 13, 839855. [Google Scholar] [CrossRef] [PubMed]
  23. Pónya, Z.; Somfalvi-Tóth, K. Modelling biophoton emission kinetics based on the initial intensity value in Helianthus annuus plants exposed to different types of stress. Sci. Rep. 2022, 12, 2317. [Google Scholar] [CrossRef]
  24. Liu, J.; Guo, Y.Y.; Bai, Y.W.; Camberato, J.J.; Xue, J.Q.; Zhang, R.H. Effects of drought stress on the photosynthesis in maize. Russ. J. Plant Physiol. 2018, 65, 849–856. [Google Scholar] [CrossRef]
  25. Tian, L.; Li, J.; Bi, W.; Zuo, S.; Li, L.; Li, W.; Sun, L. Effects of waterlogging stress at different growth stages on the photosynthetic characteristics and grain yield of spring maize (Zea mays L.) under field conditions. Agric. Water Manag. 2019, 218, 250–258. [Google Scholar] [CrossRef]
  26. Kamal, A.H.M.; Komatsu, S. Proteins involved in biophoton emission and flooding-stress responses in soybean under light and dark conditions. Mol. Biol. Rep. 2016, 43, 73–89. [Google Scholar] [CrossRef] [PubMed]
  27. Daku, E.K.; Salack, S.; Worou, O.N.; Ogunjobi, K. Maize response to temporary floods under ambient on-farm conditions of the West African Sahel. Environ. Res. Commun. 2022, 4, 045004. [Google Scholar] [CrossRef]
  28. Staggenborg, S.A.; Dhuyvetter, K.C.; Gordon, W.B. Grain sorghum and corn comparisons: Yield, economic, and environmental responses. Agron. J. 2008, 100, 1600–1604. [Google Scholar] [CrossRef]
  29. Choudhary, S.; Guha, A.; Kholova, J.; Pandravada, A.; Messina, C.D.; Cooper, M.; Vadez, V. Maize, sorghum, and pearl millet have highly contrasting species strategies to adapt to water stress and climate change-like conditions. Plant Sci. 2020, 295, 110297. [Google Scholar] [CrossRef] [PubMed]
  30. Ostrowska, A.; Hura, T. Physiological Comparison of Wheat and Maize Seedlings Responses to Water Stresses. Sustainability 2022, 14, 7932. [Google Scholar] [CrossRef]
  31. Promkhambut, A.; Younger, A.; Polthanee, A.; Akkasaeng, C. Morphological and physiological responses of sorghum (Sorghum bicolor L. Moench) to waterlogging. Asian J. Plant Sci. 2010, 9, 183. [Google Scholar] [CrossRef]
  32. Promkhambut, A.; Polthanee, A.; Akkasaeng, C.; Younger, A. Growth, yield and aerenchyma formation of sweet and multipurpose sorghum (’Sorghum bicolor’ L. Moench) as affected by flooding at different growth stages. Aust. J. Crop Sci. 2011, 5, 954–965. [Google Scholar]
  33. Djanaguiraman, M.; Prasad, P.V.V.; Ciampitti, I.A.; Talwar, H.S. Impacts of abiotic stresses on sorghum physiology. In Sorghum in the 21st Century: Food–Fodder–Feed–Fuel for a Rapidly Changing World; Springer: Singapore, Singapore, 2020; pp. 157–188. [Google Scholar]
  34. Keten, M.; Değirmenci, H. Comparison of stress susceptibility index of silage corn and sorghum crops. Infrastrukt. i Ekol. Teren. Wiej. 2022, 1, 21–28. [Google Scholar]
  35. Pásztor, L.; Laborczi, A.; Bakacsi, Z.; Szabó, J.; Illés, G. Compilation of a national soil-type map for Hungary by sequential classification methods. Geoderma 2018, 311, 93–108. [Google Scholar] [CrossRef]
  36. Schad, P. World Reference Base for Soil Resources—Its fourth edition and its history. JPNSS 2023, 186, 151–163. [Google Scholar] [CrossRef]
  37. Haqiqi, I.; Grogan, D.S.; Hertel, T.W.; Schlenker, W. Quantifying the impacts of compound extremes on agriculture. HESS 2021, 25, 551–564. [Google Scholar] [CrossRef]
  38. Ranal, M.A.; Santana, D.G. de How and why to measure the germination process? Rev. Bras. Bot. 2006, 29, 1–11. [Google Scholar] [CrossRef]
  39. Gianinetti, A. Basic features of the analysis of germination data with generalized linear mixed models. Data 2020, 5, 6. [Google Scholar] [CrossRef]
  40. R Core Team. R: A Language and Environment for Statistical Computing. R Foundation for Statistical Computing, Vienna, Austria. 2023. Available online: https://www.R-project.org/ (accessed on 18 April 2024).
  41. Wickham, H.; Hester, J.; Chang, W.; Bryan, J. devtools: Tools to Make Developing R Packages Easier. 2022. Available online: https://cran.r-project.org/web/packages/devtools/devtools.pdf (accessed on 18 April 2024).
  42. Rajabi Dehnavi, A.; Zahedi, M.; Ludwiczak, A.; Cardenas Perez, S.; Piernik, A. Effect of Salinity on Seed Germination and Seedling Development of Sorghum (Sorghum bicolor (L.) Moench) Genotypes. Agronomy 2020, 10, 859. [Google Scholar] [CrossRef]
  43. Sánchez, B.; Rasmussen, A.; Porter, J.R. Temperatures and the growth and development of maize and rice: A review. Glob. Change Biol. 2013, 20, 408–417. [Google Scholar] [CrossRef] [PubMed]
  44. Matthews, S.; Beltrami, E.; El-Khadem, R.; Khajeh-Hosseini, M.; Nasehzadeh, M.; Urso, G. Evidence that time for repair during early germination leads to vigour differences in maize. SST 2011, 39, 501–509. [Google Scholar] [CrossRef]
  45. Brar, G.S.; Stewart, B.A. Germination under controlled temperature and field emergence of 13 sorghum cultivars. Crop Sci. 1994, 34, 1336–1340. [Google Scholar] [CrossRef]
  46. Khaeim, H.; Kende, Z.; Jolánkai, M.; Kovács, G.P.; Gyuricza, C.; Tarnawa, Á. Impact of Temperature and Water on Seed Germination and Seedling Growth of Maize (Zea mays L.). Agronomy 2022, 12, 397. [Google Scholar] [CrossRef]
  47. Yasin, M.; Andreasen, C. Effect of reduced oxygen concentration on the germination behavior of vegetable seeds. Hortic. Environ. Biotechnol. 2016, 57, 453–461. [Google Scholar] [CrossRef]
  48. Christianson, J.A.; Wilson, I.W.; Llewellyn, D.J.; Dennis, D.J. The low-oxygen-induced NAC domain transcription factor ANAC102 affects viability of Arabidopsis seeds following low-oxygen treatment. Plant Physiol. 2009, 149, 1724–1738. [Google Scholar] [CrossRef] [PubMed]
  49. Xu, X.; Wang, H.; Qi, X.; Qiang, X.; Chen, X. Waterlogging-induced increase in fermentation and related gene expression in the root of cucumber (Cucumis sativus L.). Sci. Hortic. 2014, 179, 388–395. [Google Scholar]
  50. Simojoki, A.; Jaakkola, A.; Alakukku, L. Effect of compaction on soil air in a pot experiment and in the field. Soil Tillage Res. 1991, 19, 175–186. [Google Scholar] [CrossRef]
  51. Khodarahmpour, Z. Evaluation of maize (Zea mays L.) hybrids, seed germination and seedling characters in water stress conditions. Afr. J. Agric. Res. 2012, 7, 6049–6053. [Google Scholar]
  52. Tolk, J.A.; Howell, T.A.; Steiner, J.L.; Evett, S.R. Grain sorghum growth, water use and yield in contrasting soils. Agric. Water Manag. 1997, 35, 29–42. [Google Scholar] [CrossRef]
  53. Wang, G. Agricultural drought in a future climate: Results from 15 global climate models participating in the IPCC 4th assessment. Clim. Dyn. 2005, 25, 739–753. [Google Scholar] [CrossRef]
  54. Hänsel, S.; Ustrnul, Z.; Łupikasza, E.; Skalak, P. Assessing seasonal drought variations and trends over Central Europe. Adv. Water Resour. 2019, 127, 53–75. [Google Scholar] [CrossRef]
  55. Somfalvi-Tóth, K. A kukoricatermesztés feltételeinek változása 1901-től napjainkig. Agrofórum Extra 2020, 87, 16–18. [Google Scholar]
  56. Conley, M.M.; Kimball, B.A.; Brooks, T.J.; Pinter, P.J., Jr.; Hunsaker, D.J.; Wall, G.W.; Adam, N.R.; LaMorte, R.L.; Matthias, A.D.; Thompson, T.L.; et al. CO2 enrichment increases water use efficiency in sorghum. New Phytol. 2001, 151, 407–412. [Google Scholar] [CrossRef]
  57. Goltsev, V.; Zaharieva, I.; Chernev, P.; Strasser, R. Delayed chlorophyll fluorescence as a monitor for physiological state of photosynthetic apparatus. Biotechn. Biotechn. Equip. 2009, 23, 452–457. [Google Scholar] [CrossRef]
  58. Sánchez-Moreiras, A.M.; Graña, E.; Reigosa, M.J.; Araniti, F. Imaging of chlorophyll a fluorescence in natural compound-induced stress detection. Front. Plant Sci. 2020, 11, 583590. [Google Scholar] [CrossRef] [PubMed]
  59. Jócsák, I.; Gyalog, H.; Hoffmann, R.; Somfalvi-Tóth, K. In-Vivo Biophoton Emission, Physiological and Oxidative Responses of Biostimulant-Treated Winter Wheat (Triticum eastivum L.) as Seed Priming Possibility, for Heat Stress Alleviation. Plants 2022, 11, 640. [Google Scholar] [CrossRef] [PubMed]
  60. Salih, A.A.; Ali, I.A.; Lux, A.; Luxová, M.; Cohen, Y.; Sugimoto, Y.; Inanaga, S. Rooting, water uptake and xylem structure adaptation to drought of two sorghum cultivars. Crop Sci. 1999, 39, 168–173. [Google Scholar] [CrossRef]
  61. Tari, I.; Laskay, G.; Takács, Z.; Poór, P. Response of Sorghum to Abiotic Stresses: A Review. J. Agron. Crop Sci. 2012, 199, 264–274. [Google Scholar] [CrossRef]
  62. Xie, T.; Su, P.; Shan, L. Photosynthetic characteristics and water use efficiency of sweet sorghum under different watering regimes. Pak. J. Bot. 2010, 42, 3981–3994. [Google Scholar]
  63. Lemaire, G.; Charrier, X.; Hebert, Y. Nitrogen uptake capacities of maize and sorghum crops in different nitrogen and water supply conditions. Agronomie 1996, 16, 231–246. [Google Scholar] [CrossRef]
  64. Cakir, R. Effect of water stress at different development stages on vegetative and reproductive growth of corn. Field Crops Res. 2004, 89, 1–16. [Google Scholar] [CrossRef]
  65. Ge, T.; Sui, F.; Bai, L.; Tong, C.; Sun, N. Effects of water stress on growth, biomass partitioning, and water-use efficiency in summer maize (Zea mays L.) throughout the growth cycle. Acta Physiol. Plant. 2012, 34, 1043–1053. [Google Scholar] [CrossRef]
  66. Zhou, R.; Kan, X.; Chen, J.; Hua, H.; Li, Y.; Ren, J.; Feng, K.; Liu, H.; Deng, D.; Yin, Z. Droughtinduced changes in photosynthetic electron transport in maize probed by prompt fluorescence, delayed fluorescence, P700 and cyclic electron flow signals. Environ. Exp. Bot. 2019, 158, 51–62. [Google Scholar] [CrossRef]
Figure 1. Soil sampling locations with the soil types. The soil types were determined based on the soil map of Pásztor et al. [35] The locations are #1 Kaposfő, #2 Kaposvár, #3 Tamási, #4 Izsák, and #5 Fülöpháza.
Agronomy 14 00862 g001
Figure 2. Soil moisture content (% volume) varies with soil texture. Sandy soils have a lower field capacity and less favourable water content interval for plants, while the higher the clay content in the soil, the higher the wilting point and the field capacity [37].
Agronomy 14 00862 g002
Figure 3. Flow chart of the research schedule. Precision irrigation based on Equation (1) was applied on the 3rd, 5th, 8th, 10th, and 12th days. The laboratory measurement days happened on the 7th and 14th days after sowing. The photos show some examples of sorghum plants on the 7th and 14th days of the study in the six soil types, while the images to the right of these photos show the biophoton emission intensity of three sorghum plants in a pot (photon cps), measured using the NightShade® LB985 (Institute Berthold Technologies Bioanalytical Instruments, Bad Wildbad, Germany).
Agronomy 14 00862 g003
Figure 4. The decay of biophoton emission intensity (cps) in (A) healthy and (B) stressed plants. The initial biophoton emission intensity is inversely proportional to the level of plant stress. The rate of decay, represented by the slope of the fitted curve, is directly proportional to the level of plant stress, i.e., the steeper the slope, the more intense the stress. After a few minutes, delayed fluorescence decays, and owing to oxidative processes, the oscillation of biophoton emission is observed (A) around a lower average value for healthy plants and (B) around a higher average value for plants under stress.
Agronomy 14 00862 g004
Figure 5. The dynamics of the germination of the maize and sorghum seeds as a function of time with 12 h timesteps (above). The maximum germination intensity was 24 h after starting the laboratory test for sorghum, while it was 36 h after starting the test for maize. The germination data (seeds/day), including the calculated GP and MGS, can be seen in the table with the four repetitions (#1, #2, #3, #4) for a more reliable validation of the laboratory experiment.
Agronomy 14 00862 g005
Figure 6. Germination indices for maize and sorghum in (a) different soil types using density functions for maize. (b) Density function of germination percentage in different soil types for sorghum. (c) Germination percentage under different water regimes for maize and sorghum. (d) XY plot to compare the Coefficient of Uniformity of Germination (CUG) and Mean Germination Time (GMT) for maize and sorghum.
Agronomy 14 00862 g006
Figure 7. Comparison of Normalized Growth Rate (NGR) for maize and sorghum in (a) six soil types and (b) under three water regimes. The grey lines (dotdash) show where the NGR equals one; below this line, the growth rate was lower than the species average, and above this number, the growth rate was above the average. The black line (solid) is a guide line that has been included to help compare the growth rates of maize and sorghum. The closer the points are to this solid line, the more similar the growth rate of the plants was under the given experimental growing conditions.
Agronomy 14 00862 g007
Figure 8. Principle Component Analysis (PCA) of different variables that influenced the initial biophoton emission intensity as the indicator of the actual stress states of the plants. (a) PCA results clustered by variable Day. (b) PCA results clustered by variable Species. (c) PCA results clustered by variable Treatment. (d) PCA results clustered by variable Soil. The explanation of arrows is from left to right: Day, Treatment, Soil, Plant, and Photon rate.
Agronomy 14 00862 g008
Figure 9. The density functions of the initial biophoton emission intensities [cps] for maize and sorghum. The higher the value, the healthier and more stress-free the plant is considered to be.
Agronomy 14 00862 g009
Figure 10. The results of the Duncan’s post hoc test for the different soil types and species (maize and sorghum). The letters a and b represent the result of Duncan’s post hoc test. Different letters mean significant differences between the group averages.
Agronomy 14 00862 g010
Figure 11. Comparison of initial biophoton emission intensity [count×sec-1] for different soil types, water regimes, and evaluation days for (a) maize and (b) sorghum.
Agronomy 14 00862 g011
Figure 12. Exponential decay of biophoton emission intensities ranging from the 3rd to the 10th time step. The steeper the slope of the biophoton emission intensity and the lower the values of the biophoton emission, the higher the stress level of the plants.
Agronomy 14 00862 g012
Figure 13. The slope of the exponential decay of biophoton emission intensity by soil type, water regime, and species. The slope is steeper in almost every case for maize, except in the brown forest floor (LUV) and saline meadow solonetz (SN) cases. The letters a and b represent the result of Duncan’s post hoc test. Different letters mean significant differences between the group averages.
Agronomy 14 00862 g013
Table 1. Soil analysis results of the accredited soil laboratory of the Hungarian University of Agriculture and Life Sciences, accredited by the National Accreditation Authority (NAH-1-1339/2016).
Sample Number#1#2#3#4#5#6
LocationKaposfőKaposvárTamásiIzsákFülöpházaControl
Coordinates
(latitude, longitude)
46.371819, 17.61918046.371887, 17.811380 46.648951, 18.27229546.821052, 19.206805 46.865305, 19.398247 -
Sampling depth (m)0.30.30.30.30.3-
Soil type by Pásztor et al. [35]Humic-sandy soilBrown forest floor with clay illuviationPseudo-myceliar chernozemMeadow solonetzShifting sandControl
Soil type by WRB [36]ArenosolLuvisolChernozemSolonetzArenosol
Referred to asHARLUVCHSNSARControl
Soil texturesandsandy clayclay loamsandy claysand-
Humus content (%)0.981.783.621.650.546.09
P2O5 (mg/kg)435582281625976.11041
K2O (mg/kg)3713127502691021675
CaCO3 (m/m%)3.182.662.897.053.665.73
pH (KCL)6.577.167.117.496.266.81
Mg (mg/kg)90.316423622945.41089
Zn (mg/kg1.221.346.960.810.8715.1
Cu (mg/kg)1.283.423.71.941.48.28
Mn (mg/kg)23626564.129.634.7110
(NO2 + NO3)-N content (mg/kg)11.267.210751.615.692.9
Na (mg/kg)23.536.977.722839.6170
SO4 (mg/kg)22.54376.545.918.34329
Water-soluble salinity (m/m%)<0.020.060.090.13<0.020.14
pH (H2O)7.237.757.468.576.96.98
Table 2. The number of pots in each experimental setup was 10. Each pot contained 3 plants, so the sample size for both maize and sorghum was 3 (water supply category) × 6 (types of soils) × 10 (number of pots) × 3 (number of plants in each pot) = 1080 plants.
ControlFloodingDroughtNumber of Pots
Soil TypeMaizeSorghumMaizeSorghumMaizeSorghumΣ
LUV10101010101060
CH10101010101060
SAR10101010101060
HAR10101010101060
SN10101010101060
Control10101010101060
Table 3. The field capacity of the soil samples was measured in the accredited soil laboratory at MATE Kaposvár Campus, and the water amount was determined for the six soil types and three water regimes.
Soil TypeWater RegimeField Water Capacity
(mL/100 g)
Water Amount (mL/pot)Dry Soil Mass (g) in a Pot
LUVControl36240950
LUVDrought3665950
LUVFlooding36410950
CHControl43290950
CHDrought4380950
CHFlooding43490950
HARControl272051080
HARDrought27601080
HARFlooding273501080
SARControl262101150
SARDrought26651150
SARFlooding263601150
SNControl302301050
SNDrought301001050
SNFlooding303801050
Table 4. Mean germination percentage [%] for maize and sorghum in different soil types with the results of our ANOVA (p-values).
Soil TypeMaizeSorghumOverall Meanp-Value
CH72.2288.8980.560.03
Control83.3390.0086.670.42
HAR82.2281.1181.670.78
SAR88.8991.1190.000.72
SN63.3374.4468.890.05
LUV76.6785.5681.110.06
Table 5. Individual and interaction effects of different variables on the initial biophoton emission intensity (cps) of maize and sorghum, including all the soil types and water regimes. Only combinations with p-value < 0.1 are listed here, except for some pertinent and indispensable variables.
F-Valuep-Value
One-way ANOVASoil14.75<0.0001
Day334.36<0.0001
Treatment0.210.648
Plant3.730.055
Two-way ANOVASoil:Day45,520<0.0001
Soil:Treatment0.990.42
Day:Treatment0.400.526
Soil:Plant2.860.016
Day:Plant16.1<0.0001
Treatment:Plant7.050.008
Three-way ANOVASoil:Day:Treatment1.020.407
Soil:Day:Plant3.820.002
Soil:Treatment:Plant6.82<0.0001
Day:Treatment:Plant11.73<0.0001
Four-way ANOVADay:Plant:Treatment:Soil9.75<0.0001
Disclaimer/Publisher’s Note: The statements, opinions and data contained in all publications are solely those of the individual author(s) and contributor(s) and not of MDPI and/or the editor(s). MDPI and/or the editor(s) disclaim responsibility for any injury to people or property resulting from any ideas, methods, instructions or products referred to in the content.

