Article

Biochar Application Combined with Water-Saving Irrigation Enhances Rice Root Growth and Nitrogen Utilization in Paddy Fields

1
School of Water Conservancy and Civil Engineering, Northeast Agricultural University, Harbin 150030, China
2
College of Agriculture and Hydraulic Engineering, Suihua University, Suihua 152001, China
3
Post-Doctoral Scientific Research Station of Crop Science, College of Agriculture, Northeast Agricultural University, Harbin 150030, China
4
Key Laboratory of Effective Utilization of Agricultural Water Resources, Ministry of Agriculture and Rural Affairs, Northeast Agricultural University, Harbin 150030, China
5
School of Water Conservancy and Electric Power, Heilongjiang University, Harbin 150006, China
6
College of Hydrology and Water Resources, Hohai University, Nanjing 210098, China
*
Author to whom correspondence should be addressed.
Agronomy 2024, 14(5), 889; https://doi.org/10.3390/agronomy14050889
Submission received: 26 March 2024 / Revised: 14 April 2024 / Accepted: 22 April 2024 / Published: 24 April 2024

Abstract

:
To improve nitrogen use efficiency (NUE) during rice cultivation, it is essential to comprehend the morphological and physiological traits of rice roots. However, in high-fertility black soil regions of Northeast China, the effects of combining biochar application with water-saving irrigation (WSI) conditions on rice root development and nitrogen utilization are still unknown. To address this knowledge gap, a combination of field experiments and 15N tracer micro-area investigations was conducted in this study. Four treatments were implemented: (i) controlled irrigation without biochar application (CB0); (ii) controlled irrigation with 2.5 t ha−1 biochar application (CB1); (iii) controlled irrigation with 12.5 t ha−1 biochar application (CB2); and (iv) controlled irrigation with 25 t ha–1 biochar application (CB3). Flooded irrigation conditions without biochar treatment (FB0) were used as the control. The primary objective of this research was to identify the mechanisms by which combined WSI conditions and biochar application affect rice root development and nitrogen utilization. Biochar application enhanced rice root morphological and physiological characteristics. Optimal biochar application increased the longest root length (RL), root volume (RV), root fresh weight (RFW), root active absorption area, root bleeding intensity, and root activity (RA) of rice while also optimizing the root–shoot ratio and facilitating nitrogen absorption by roots. These changes in root morphological and physiological characteristics facilitated the absorption of fertilizer-15N and soil nitrogen by rice roots, ultimately leading to improvements in rice yields and NUEs. Notably, the rice yields, NUE, nitrogen agronomic efficiency (NAE), and nitrogen partial factor productivity (NPFP) of CB2 plants were 16.45%, 39.42%, 24.48%, and 16.45% higher than those of FB0 plants, respectively. These results highlight the effectiveness of biochar application as a strategy to ensure food security and enhance NUE under WSI conditions. Furthermore, this study suggests that the recommended optimal application amount of biochar for the black soil area of Northeast China is 12.5 t ha−1.

1. Introduction

Rice (Oryza sativa L.) is one of the world’s major cereal crops and provides essential nutrition for 50 percent of the world’s population [1]. China is one of the world’s main rice producers, and a recent FAOSTAT analysis from 2021 indicates that China’s rice plantation area comprises approximately 18% of the global total, while its rice production contributes to about 27% of the global output [2,3]. Rice cultivated in Northeast China has a reputation for high quality and superior taste, garnering increasing popularity among Chinese consumers [4]. Rice plantation area and yield in Northeast China have grown significantly in recent years, with increases of 17% and 157%, respectively [5]. Flooded irrigation remains prevalent in most parts of Northeast China, with the expansion of rice cultivation increasing the demand for irrigation water [6]. Groundwater were used to meet the normal demands of rice production, resulting in serious over-exploitation of groundwater in some areas [7]. Furthermore, population urbanization and China’s unequal allocation of water resources over time and space have made the country’s agricultural irrigation water shortage worse [8]. Hence, selecting the most appropriate irrigation regime for Northeastern China is critical.
To ensure agricultural water safety, various water-saving irrigation (WSI) techniques have been introduced for rice production, including intermittent irrigation, controlled irrigation, and dry–wet alternating irrigation [9]. WSI methods reduce water usage relative to flooding irrigation but can also increase yields [10,11]. The adoption of WSI techniques has become widespread for the past few years, with the rice-growing area of the Heilongjiang Province that uses WSI alone exceeding 1.24 × 10⁶ ha in 2018 [12]. Nevertheless, the implementation of WSI methods alters soil moisture levels, modifies the ecology of farmland environments, and influences rice root growth and development [13]. Akter et al. [14] reported that WSI enhances rice root activity (RA) and promotes rice growth. Li et al. [15] further demonstrated that WSI enhanced the oxidation capacity, active absorption surface area, total absorption surface area, and root nitrogen metabolism enzyme activity of rice roots, thereby facilitating root development. In addition, Wang et al. [16] observed that WSI reduced nitrogen loss and increased nitrogen uptake by rice, consequently boosting crop yields. Furthermore, Chen et al. [17] demonstrated that WSI decreased nitrogen loss in paddy fields by 15.42–28.64% while also improving NUE and yields. The implementation of WSI technologies in paddy fields can effectively alleviate the imbalance between water supply and demand while simultaneously enhancing nitrogen utilization rates. However, such methods also quicken the disintegration of soil organic carbon (SOC) in paddy fields [18], potentially leading to soil degradation during long-term application. Therefore, achieving sustainable use of water and soil resources in paddy fields necessitates integrating WSI with related soil carbon management adaptations. Combining these efforts will help promote the unified enhancement of water conservation and carbon sequestration efficiency, ensure the sustainable development of paddy field ecosystems, and contribute to the realization of “dual carbon” goals.
Previous studies have consistently demonstrated the effectiveness and environmental friendliness of biochar application as an agricultural management technique that contributes to soil carbon enrichment and enhanced NUE [19,20]. Pan et al. [21] reported that SOC contents improved by at least 23% after biochar application. Liu et al. [22] found that biochar application increased the NUE of paddy fields by 12.04%. Biochar exhibits abundant pore structures, high cation exchange capacity (CEC), and high specific surface area [23,24,25,26], thereby facilitating SOC accumulation and influencing nitrogen retention [27]. Numerous studies have found the effects of biochar application on soil nitrogen, revealing its ability to mitigate nitrogen leaching loss and enhance NUE [28,29,30,31]. Furthermore, biochar facilitates gradual nitrogen release into soils, while its organic nutrients enhance soil productivity [32] and positively influence soil microbial characteristics such as community and diversity, thereby promoting crop growth [33]. Root morphological and physiological traits play critical roles in aboveground plant growth, nitrogen utilization, and yields [34,35]. Biochar application also promotes the conversion of soil nutrients into readily absorbable forms, consequently stimulating rice root growth and nutrient uptake, resulting in increases in rice yields and NUE of approximately 10.73% and 12.04%, respectively [36]. Biochar application specifically impacts rice yields and nitrogen use by enhancing soil structure, soil microenvironments, and root growth [37], with soil fertility then influencing its efficacy [38]. Hussain et al. [39] observed increased crop yields in low-fertility soils with biochar application, although its effects on rice yields and nitrogen utilization in high-fertility soils were inconclusive. Consequently, investigating the effects of biochar application on nitrogen utilization and yields in high-fertility black soil regions is critical.
Black soil is a type of highly fertile clay soil that is characterized by high levels of organic matter, rich nutrient content, and a rapid rate of SOC mineralization [40]. Prolonged flooding of paddy soils leads to the formation of anaerobic conditions and the accumulation of harmful chemical elements such as Fe2+, Mn2+, and S2−, which adversely impact rice root growth and reduce nutrient absorption [40]. Notably, biochar application mitigates the accumulation of these harmful elements in paddy fields, improves soil structure, and creates a conducive environment for rice growth under WSI conditions [41]. However, the specific effects of biochar application combined with WSI on rice root morphology, physiological characteristics, and NUE remain unclear, in addition to the underlying molecular mechanisms.
To address these knowledge gaps, field experiments using a combination of field trials and 15N (an isotope of the element nitrogen) tracer micro-area testing were used in this study, with flooding irrigation used as the control. The objectives of this study were to (i) elucidate the impact of biochar application on the morphological and physiological characteristics of rice roots under WSI conditions, (ii) investigate the use of 15N-fertilizer and soil nitrogen by roots under WSI and biochar application conditions, and (iii) explore the influence of root morphological and physiological characteristics on nitrogen utilization.

2. Materials and Methods

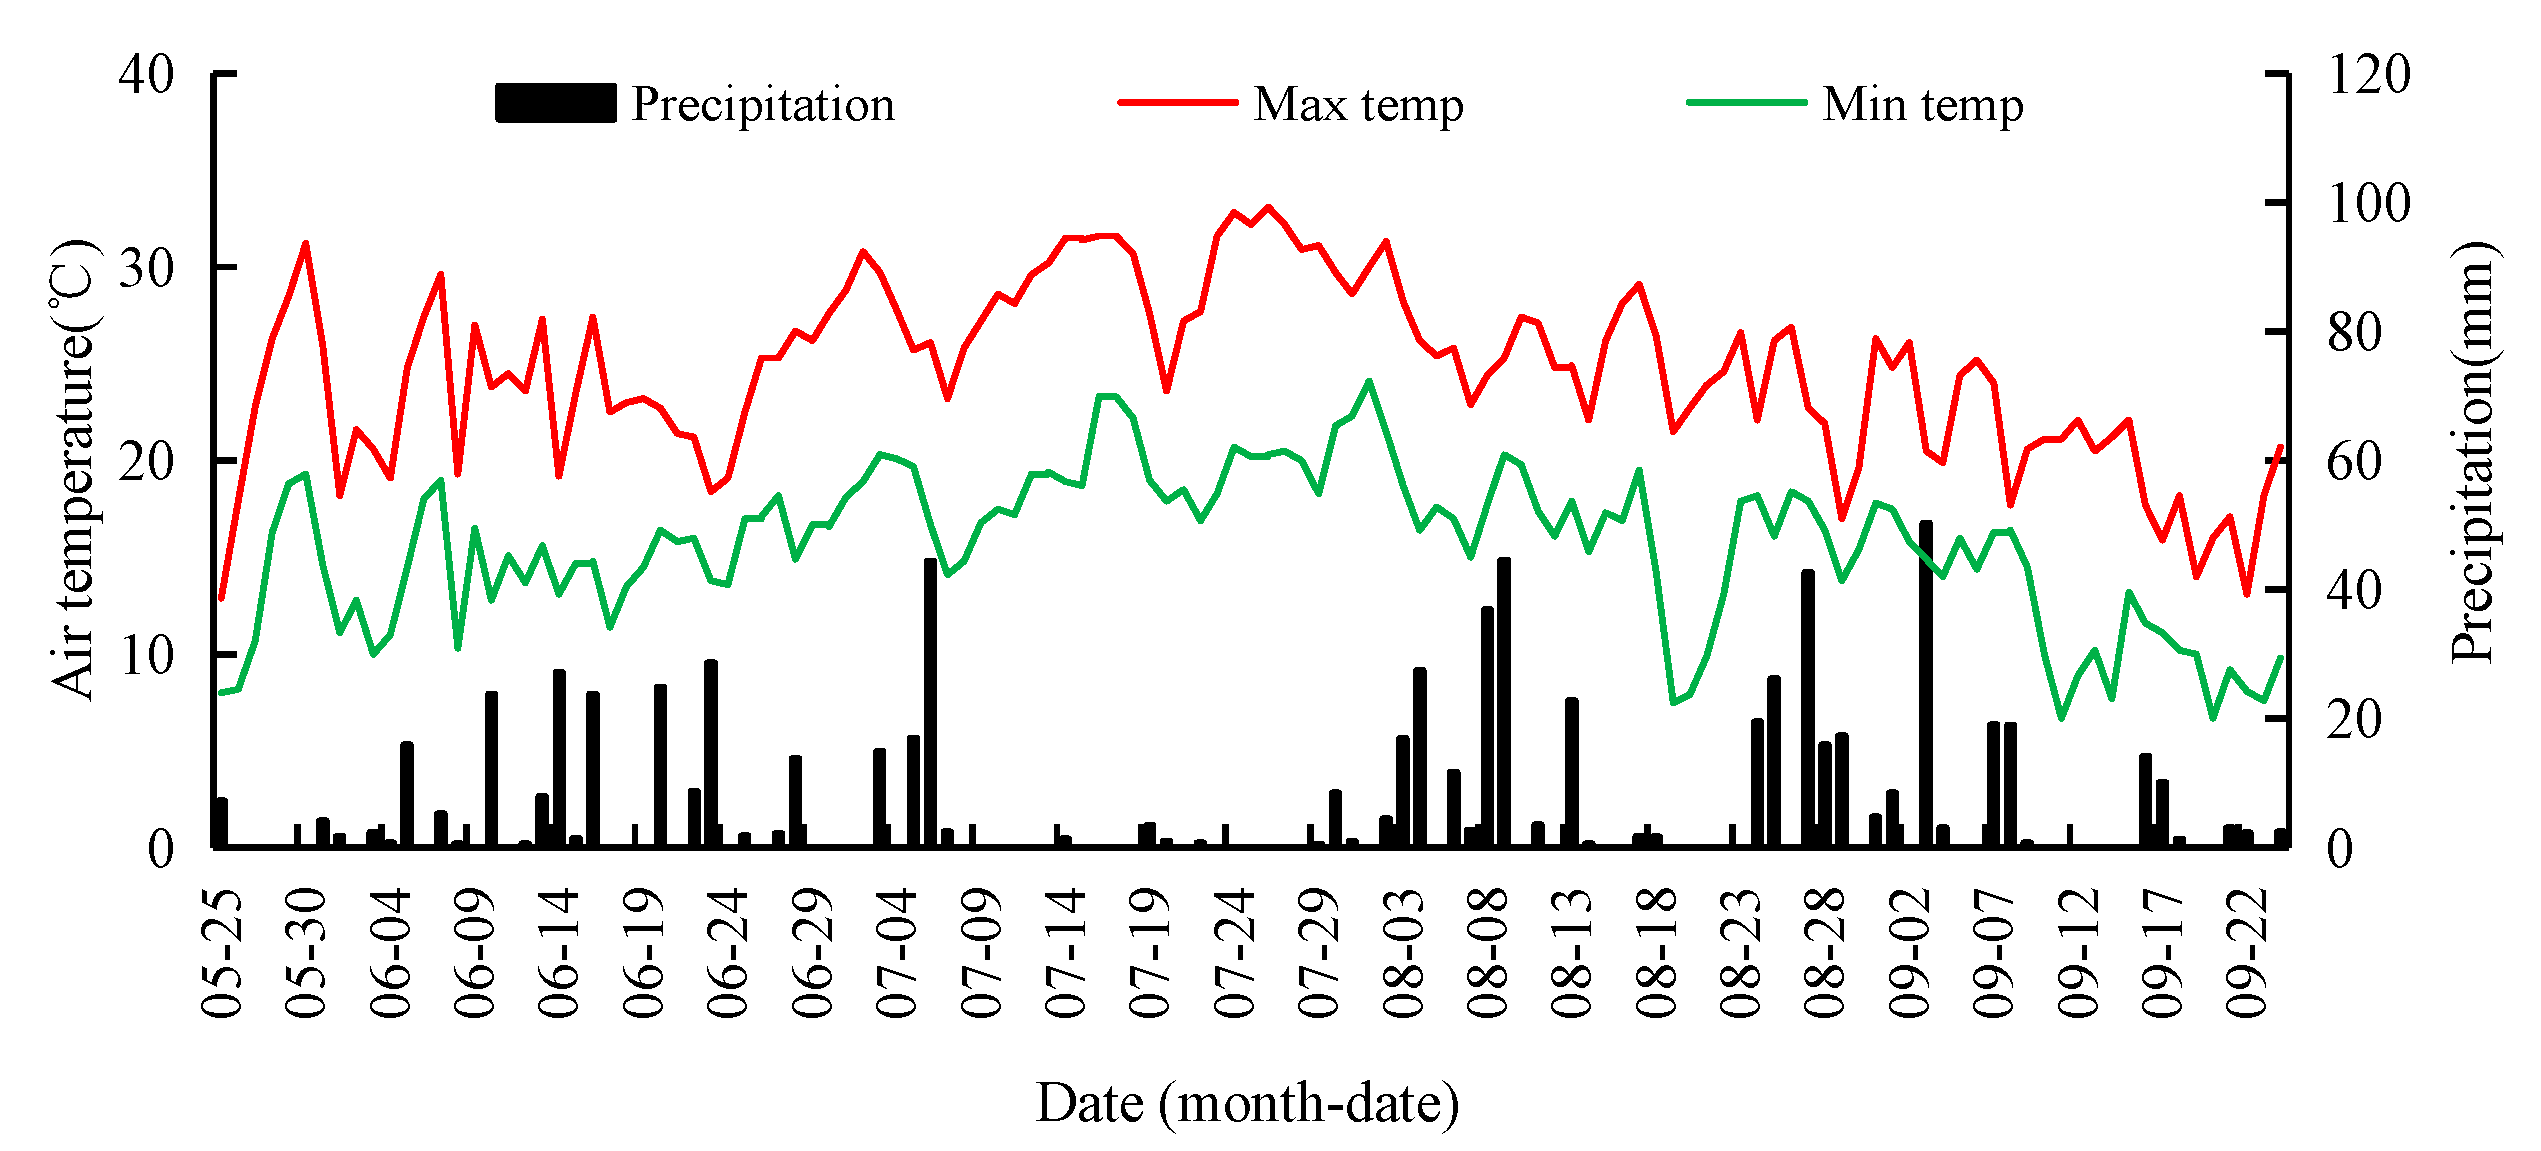
2.1. Site Description

The experiments of this study were conducted at the National Irrigation Experimental Station (127°40′45″ E, 46°57′28″ N) in the Heping Irrigation District of Heilongjiang Province, Northeast China, from 25 May to 24 September 2020. The region is characterized by a typical distribution of Mollisols, and the physical–chemical properties of the 0–20 cm soil layer include a pH of 6.42, 42.51 g kg−1 of organic matter, 1.62 g kg−1 of total N, 15.43 g kg−1 of total P, 20.08 g kg−1 of total K, 168.37 mg kg−1 of alkaline N, 34.54 mg kg−1 of available P, 125.81 mg kg−1 of available K, 26.48 cmol kg−1 of CEC, 629.46 µg g−1 of Ca, 76.34 µg g−1 of Ma, and 256.82 mV of redox potential. The region exhibits a monsoon climate in a cold temperate zone, with average annual precipitation of 500–600 mm, average annual water surface evaporation of 700–800 mm, an average temperature of 2–3 °C, 2600 average sunshine hours, and 156–171 days of crop growth. Meteorological data for the rice growth period are shown in Figure 1. Prior to the experiment, the test field was cultivated with rice for over 20 years.

2.2. Experimental Design

The experiment comprised two water management modes: controlled irrigation (CI) and flooded irrigation (FI). (Table 1). The flooded irrigation method without biochar treatment (FB0) was considered the control, while four different levels of biochar application were used with the CI: 0 t ha–1 (B0), 2.5 t ha–1 (the 1-year returning amount, B1), 12.5 t ha–1 (the 5-year returning amount, B2), and 25 t ha–1 (the 10-year returning amount, B3). Each treatment included three replicates comprising a total of 15 experimental plots sized 10 × 10 m2. The plots were separated from each other, and a concrete barrier (height 40 cm) was established between each plot to prevent surface water–fertilizer exchange. Treatments under CI determined the irrigation time and quota according to the control index. The soil water content of each plot was measured every day using a soil moisture analyzer (TPIME-PICO64/32 type; IMKO; Ettlingen, Germany) at 8:00 and 18:00 after the field surface was anhydrous. When the soil moisture content was close to or lower than the lower limit of irrigation, artificial irrigation was conducted to the upper limit, and the level of irrigation in each treatment was recorded. When no water layer was left on the field surface of the treatment under flooding irrigation, artificial irrigation was conducted to the upper limit.
Rice straw biochar was prepared by pyrolysis at 450 °C under anaerobic conditions. Each hectare of rice straw was transformed into 2 mm diameter biochar particles comprising about 2.5 t. The biochar properties included a pH of 8.86, 42.72% of the mass fraction as carbon, 1.26% of the mass fraction as nitrogen, 0.13 g cm−3 of filling density, 81.85 m2 g−1 of specific surface area, 0.08 cm3 g−1 of total pore volume, and 44.7 cmol kg−1 of CEC. Biochar was added to digest in the soil in 2019, and the experiment was conducted in the next cropping season. After the rice harvest in the fall of 2019, biochar was applied to the surface soils of paddy fields and evenly mixed.
The rice variety evaluated here was Suijing 18, which is widely planted in the study region, with the planting density in the study area being 25 hills m−2. A 110–45–80 kg ha−1, N–P–K ratio was used for rice cultivation, as recommended for the study region. Basal fertilizer was applied to the soil at a depth of 4–5 cm using a side-deeping fertilizer machine (FSPV6; Kubaotian Corporation; Osaka, Japan), with the application of tillering fertilizer and panicle fertilizer when no water layer or shallow water layer was present. A total of 50% of the N fertilizer was applied as basal fertilizer, 20% as tillering fertilizer, and 30% as panicle fertilizer. The P fertilizer was applied once before transplanting. In addition, 50% of the K2O was applied ahead of rice transplanting, with the other 50% applied when the leaf age was 8.5. The fertilizers evaluated in the study included urea (with a mass fraction of 46.4% N), superphosphate (with a mass fraction of 12% P2O5), and potassium sulfate (with a mass fraction of 52% K2O), which were then converted into the actual amounts of applied fertilizer. Other agricultural management practices, including seed raising and pesticide application, were consistent with local high-yield fields.
Three 15N tracer micro-areas were established in each experimental plot. In each treatment, three sub-treatments were applied, including the M1, M2, and M3 treatments. In addition, only basal fertilizer was used in the M1 treatment, tillering fertilizer in M2, and panicle fertilizer in M3 along with 15N-labeled urea, while the others had unlabeled urea. Immediately after soil preparation of the paddy field, a 2 m × 2 m × 0.5 m bottomless steel-plate rectangular frame was buried in each plot, and the micro-area was buried 30 cm under the plow pan. The purpose of this was to prevent the exchange of water and fertilizer in the field. The 15N-labeled urea (10.22% abundance) was produced by the Shanghai Research Institute of Chemical Industry, and the application depth was the same as in the experimental plot. Separate irrigation and drainage systems were established in the micro-area, while the planting density, fertilizer amount, biochar application amount, and rice irrigation method were the same as in the experimental plot.

2.3. Soil Chemical Indices

Soil pH was determined using a portable testing instrument. The NH4+–N and NO3–N contents of surface soils were determined using an AA3 continuous flow analyzer (Seal Analytical GmbH; Hamburg, Germany) after extraction with 2 mol L KCL.

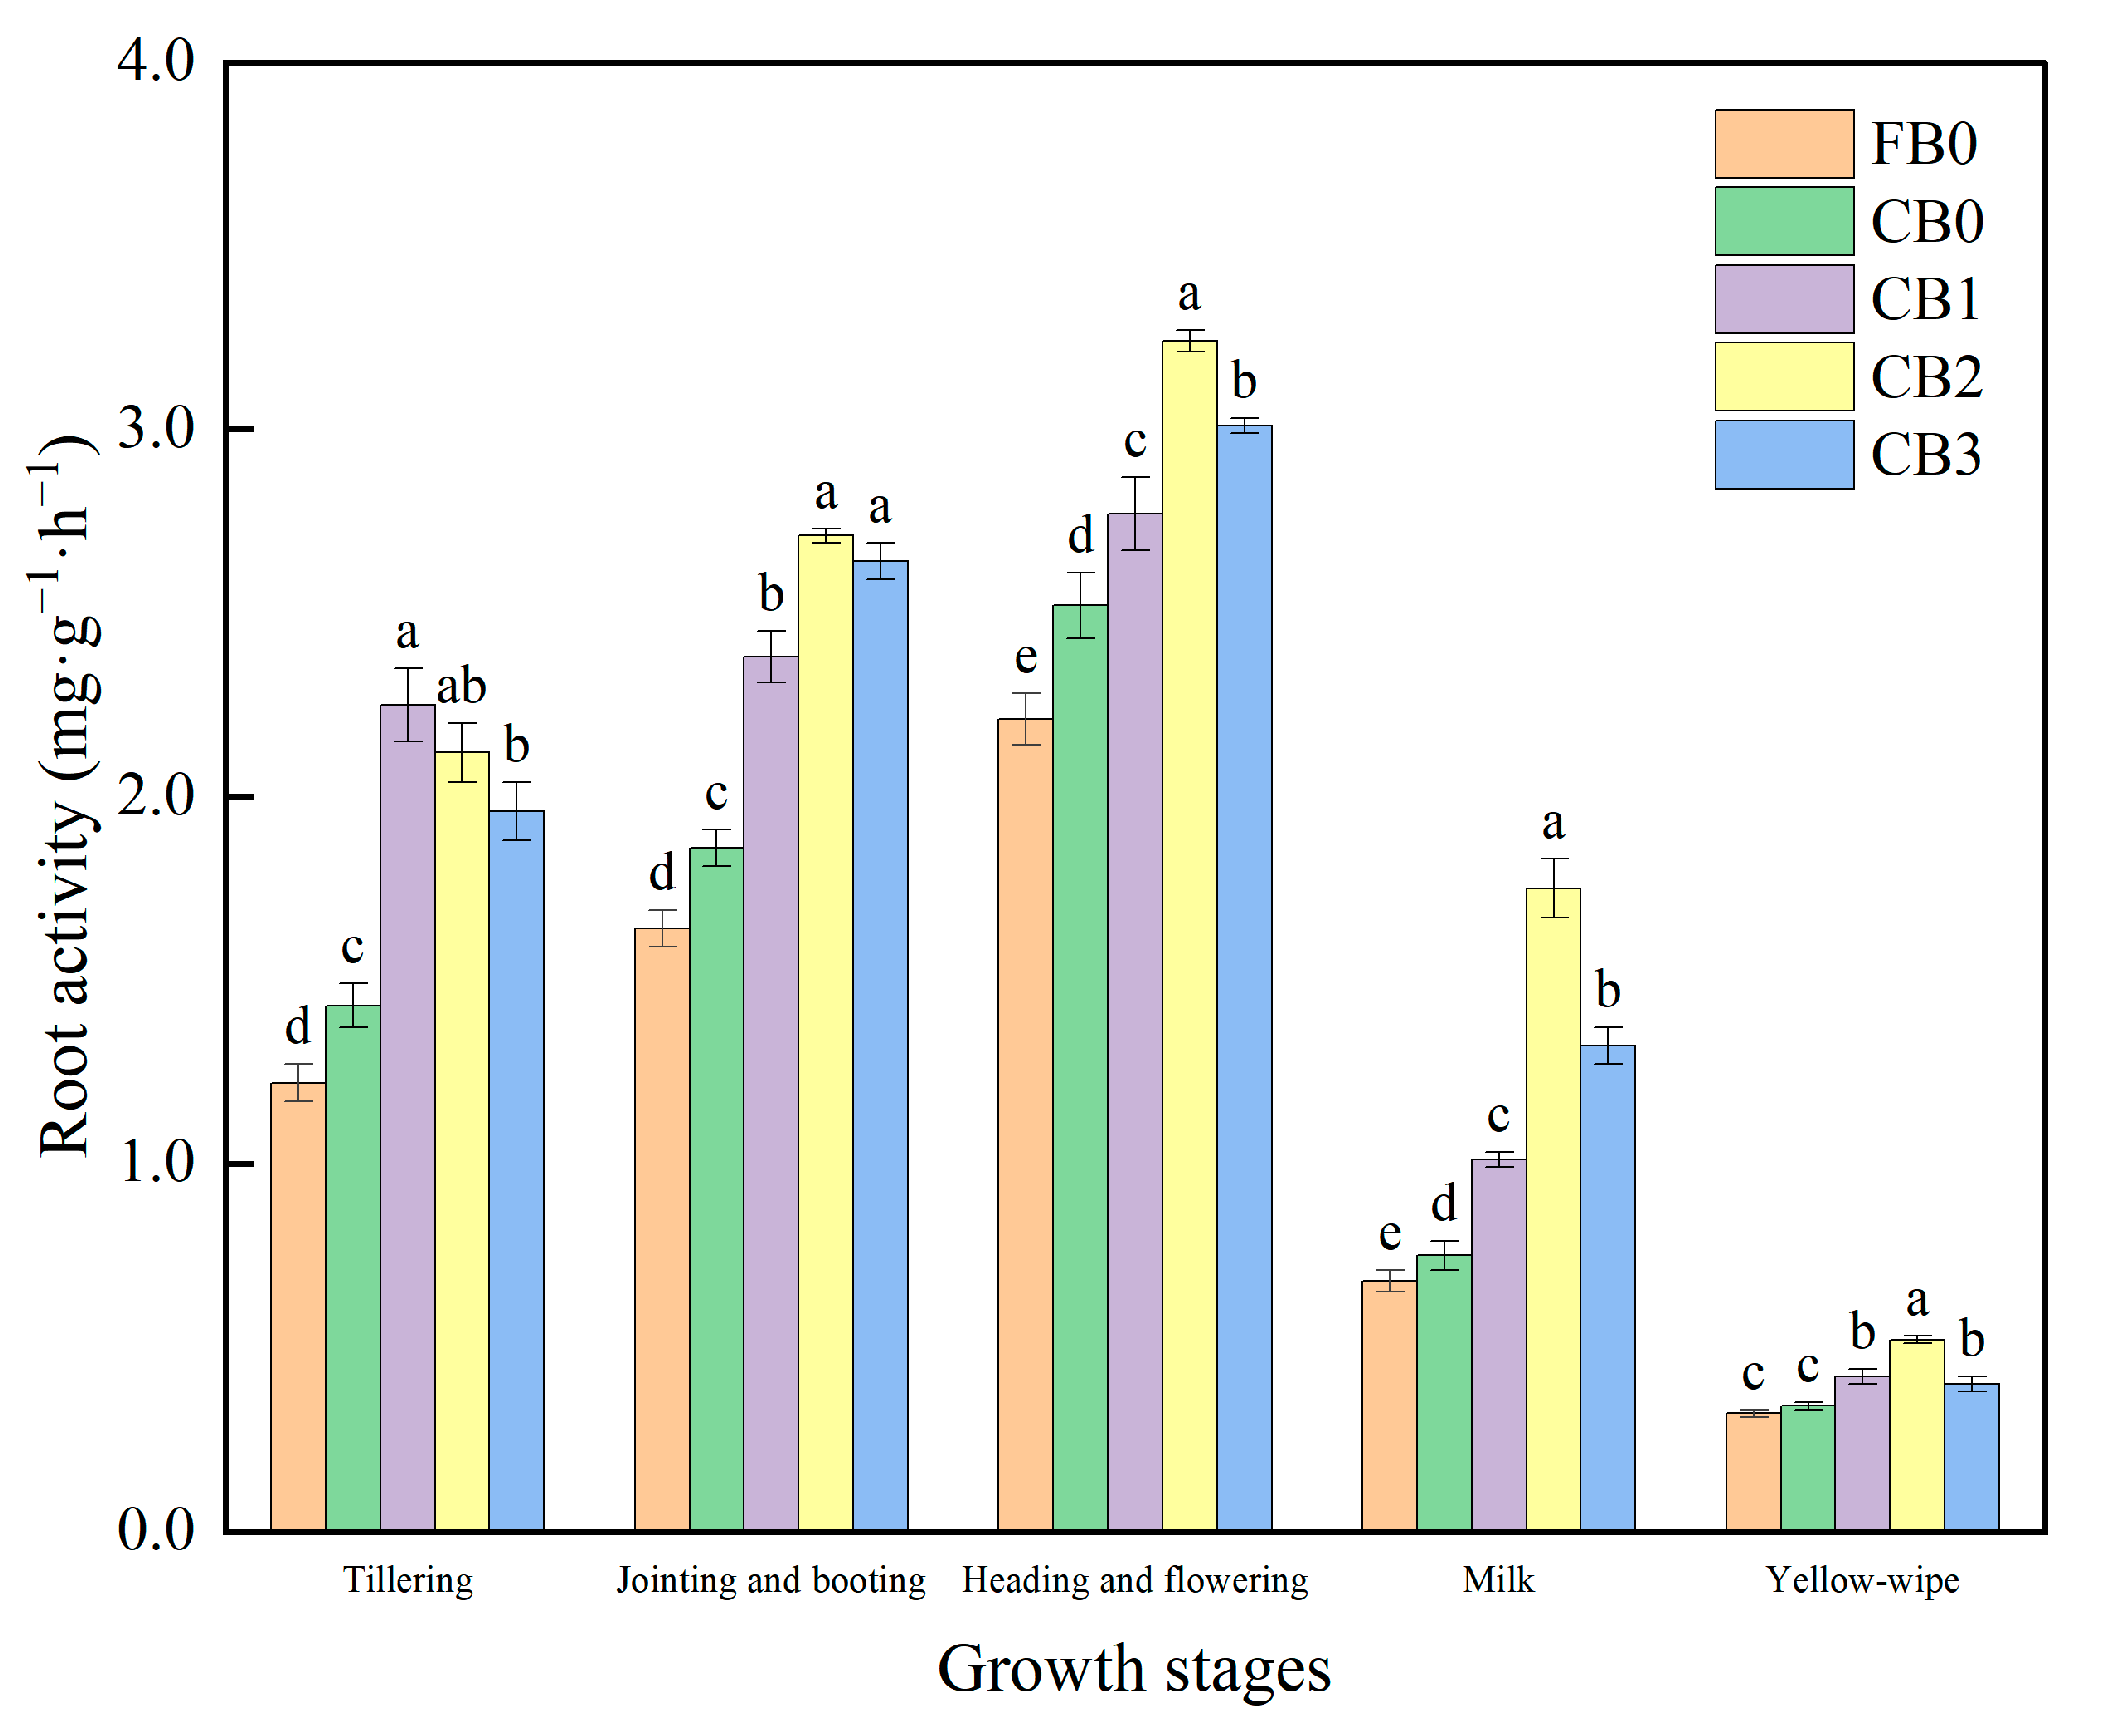
2.4. Root Morphological and Physiological Indices

The fresh weights of root systems and the total fresh weight of the aboveground components were weighed using an electronic scale, followed by the calculation of the root–shoot ratio. Root volume (RV) was determined using the drainage method, and RA was evaluated using the 2,3,5-triphenyl tetrazolium chloride (TTC) method [42]. The total absorption area and active absorption area of the roots were measured using the methylene blue colorimetric method [43].

2.5. Plant Nitrogen Utilization

To evaluate plant nitrogen use, plant samples were placed in a drying oven at 105 °C for 30 min and dried at 70 °C to a constant mass based on weighing. The total nitrogen contents of the samples were determined by H2SO4–H2O2 digestion using an AA3 continuous flow analyzer (Seal Analytical GmbH, Germany). The plant samples were brought to the laboratory and the 15N abundances in samples and grains were determined by isotope mass spectrometry (DELTA V Advantage; Thermo Fisher Scientific, Waltham, MA, USA) using an elemental analyzer (Flash 2000 HT; Thermo Fisher Scientific, Waltham, MA, USA).
The percentage of nitrogen in samples from the base fertilizer (Ndff(b)), tiller fertilizer (Ndff(t)), and panicle fertilizer (Ndff(p)) was calculated as follows [17]:
N d f f ( b , t , p ) = a b c d × 100 %
where a is the abundance of 15N in a sample (%), b is the abundance of 15N in the sample in the same treatment plot (%), c is the abundance of 15N in labeled urea (10.22%), and d is the natural abundance of 15N (0.3663%).
The total nitrogen accumulation in plants (PTNA) was calculated as follows:
P T N A = D M N C
where DM is the dry matter weight (kg ha–1), and NC is the nitrogen content (%).
The 15N accumulation of plants (N(b,t,p), kg ha–1) absorbed from basal fertilizer (b), tillering fertilizer (t), and panicle fertilizer (p) in the micro-area was calculated as follows:
N ( b , t , p ) = P T N A N d f f ( b , t , p )
The total nitrogen accumulation of plants from nitrogen fertilizer (PFN, kg ha–1) was calculated as follows:
P F N = N ( b ) + N ( t ) + N ( p )
The NUE (%) was calculated as follows:
N U E = P F N N F × 100 %
where NF is the nitrogen application rate (kg ha–1).
The percentage of soil nitrogen accumulated in plants (Ndfs) was calculated as follows:
N d f s = 1 N d f f
The amount of nitrogen absorbed from soil in plants (PSN, kg ha–1) was calculated as follows:
P S N = N d f s D M N C

2.6. Nitrogen Agronomic Efficiency and Nitrogen Partial Factor Productivity

Nitrogen agronomic efficiency (NAE, kg kg−1) and nitrogen partial factor productivity (NPFP, kg kg−1) were calculated as follows:
N A E = Y Y 0 N F
where Y is rice yield (kg ha–1), and Y0 is the rice yield of treatments with no-nitrogen fertilizer application (kg ha–1).
N P F P = Y N F

2.7. Rice Yields

Rice yields were measured at the rice maturity stage. Ten holes of rice were randomly selected from each plot, and the effective panicle number, grain number per panicle, and 1000-grain weight indices were measured to calculate yields.

2.8. Statistical Analyses

Statistical analyses were performed using the SPSS v19.0 software program. The statistical significance threshold for statistical analyses was p < 0.05. Figures were visualized using the ORIGIN v9.0 software program.

3. Results

3.1. Soil Chemical Properties

The changes in pH, NH4+–N, and NO3–N contents at different rice growth stages are summarized in Table 2. Biochar application resulted in increased soil pH under WSI conditions. Specifically, the soil pH of CB2 and CB3 was significantly higher than that of the FB0 treatment (p < 0.05), increasing by 7.96–14.49% and 13.35–19.69%, respectively. Furthermore, biochar application led to increased soil NH4+–N contents under WSI conditions. The soil NH4+–N contents of CB1, CB2, and CB3 treatment soils were significantly higher compared with the FB0 treatment soils (p < 0.05), increasing by 12.43–30.58%, 33.66–56.01%, and 28.56–78.25%, respectively. In addition, CI increased soil NO3–N contents compared with FI, with biochar application-related effects being more pronounced. Specifically, the soil NO3–N contents of the CB1, CB2, and CB3 soils were significantly higher than those in the FB0 treatment (p < 0.05), with increases of 19.08–60.15%, 41.32–91.42%, and 37.38–85.08%, respectively.

3.2. Root Morphological Characteristics

3.2.1. Root Length, Volume, and Fresh Weight

Changes in longest root length (RL), RV, and root fresh weight (RFW) at different growth stages are summarized in Table 3. The longest RL with biochar application was significantly higher than without biochar application (p < 0.05). The longest RL under CI reached a maximum at the end of the jointing–booting stage, and that under FI reached a maximum at the end of the heading–flowering stage. The RVs at the tillering and jointing–booting stages with biochar application were significantly higher than without biochar application (p < 0.05), with the RV reaching a maximum at the end of the heading–flowering stage. The RFWs after biochar application were significantly higher at the tillering and jointing–booting stages than without biochar application (p < 0.05). Except for the CB3 treatments, the RFWs of other treatments reached maximum values at the end of the heading–flowering stage.

3.2.2. Root–Shoot Ratios

Changes in root–shoot ratios at different growth stages are shown in Figure 2. At the tillering stage, the root–shoot ratio after biochar application was significantly higher than without biochar application (p < 0.05), and the root–shoot ratio of each treatment has the maximum value for the whole growth period. The root–shoot ratio of CB0 plants was 14.47% higher than in the FB0 treatment. In addition, the root–shoot ratios of CB1, CB2, and CB3 plants were higher than in the CB0 treatment by 14.29%, 34.81%, and 22.17%, respectively. Differences in root–shoot ratios among treatments gradually decreased over time, and no significant differences were observed among treatments at the grouting and yellow-ripe stages (p > 0.05). In the early stage of rice growth, biochar application promoted root growth and significantly increased the root–shoot ratios of plants under WSI conditions. In the late growth stage, the root–shoot ratios of plants with biochar application were lower under WSI conditions.

3.3. Root Physiological Characteristics

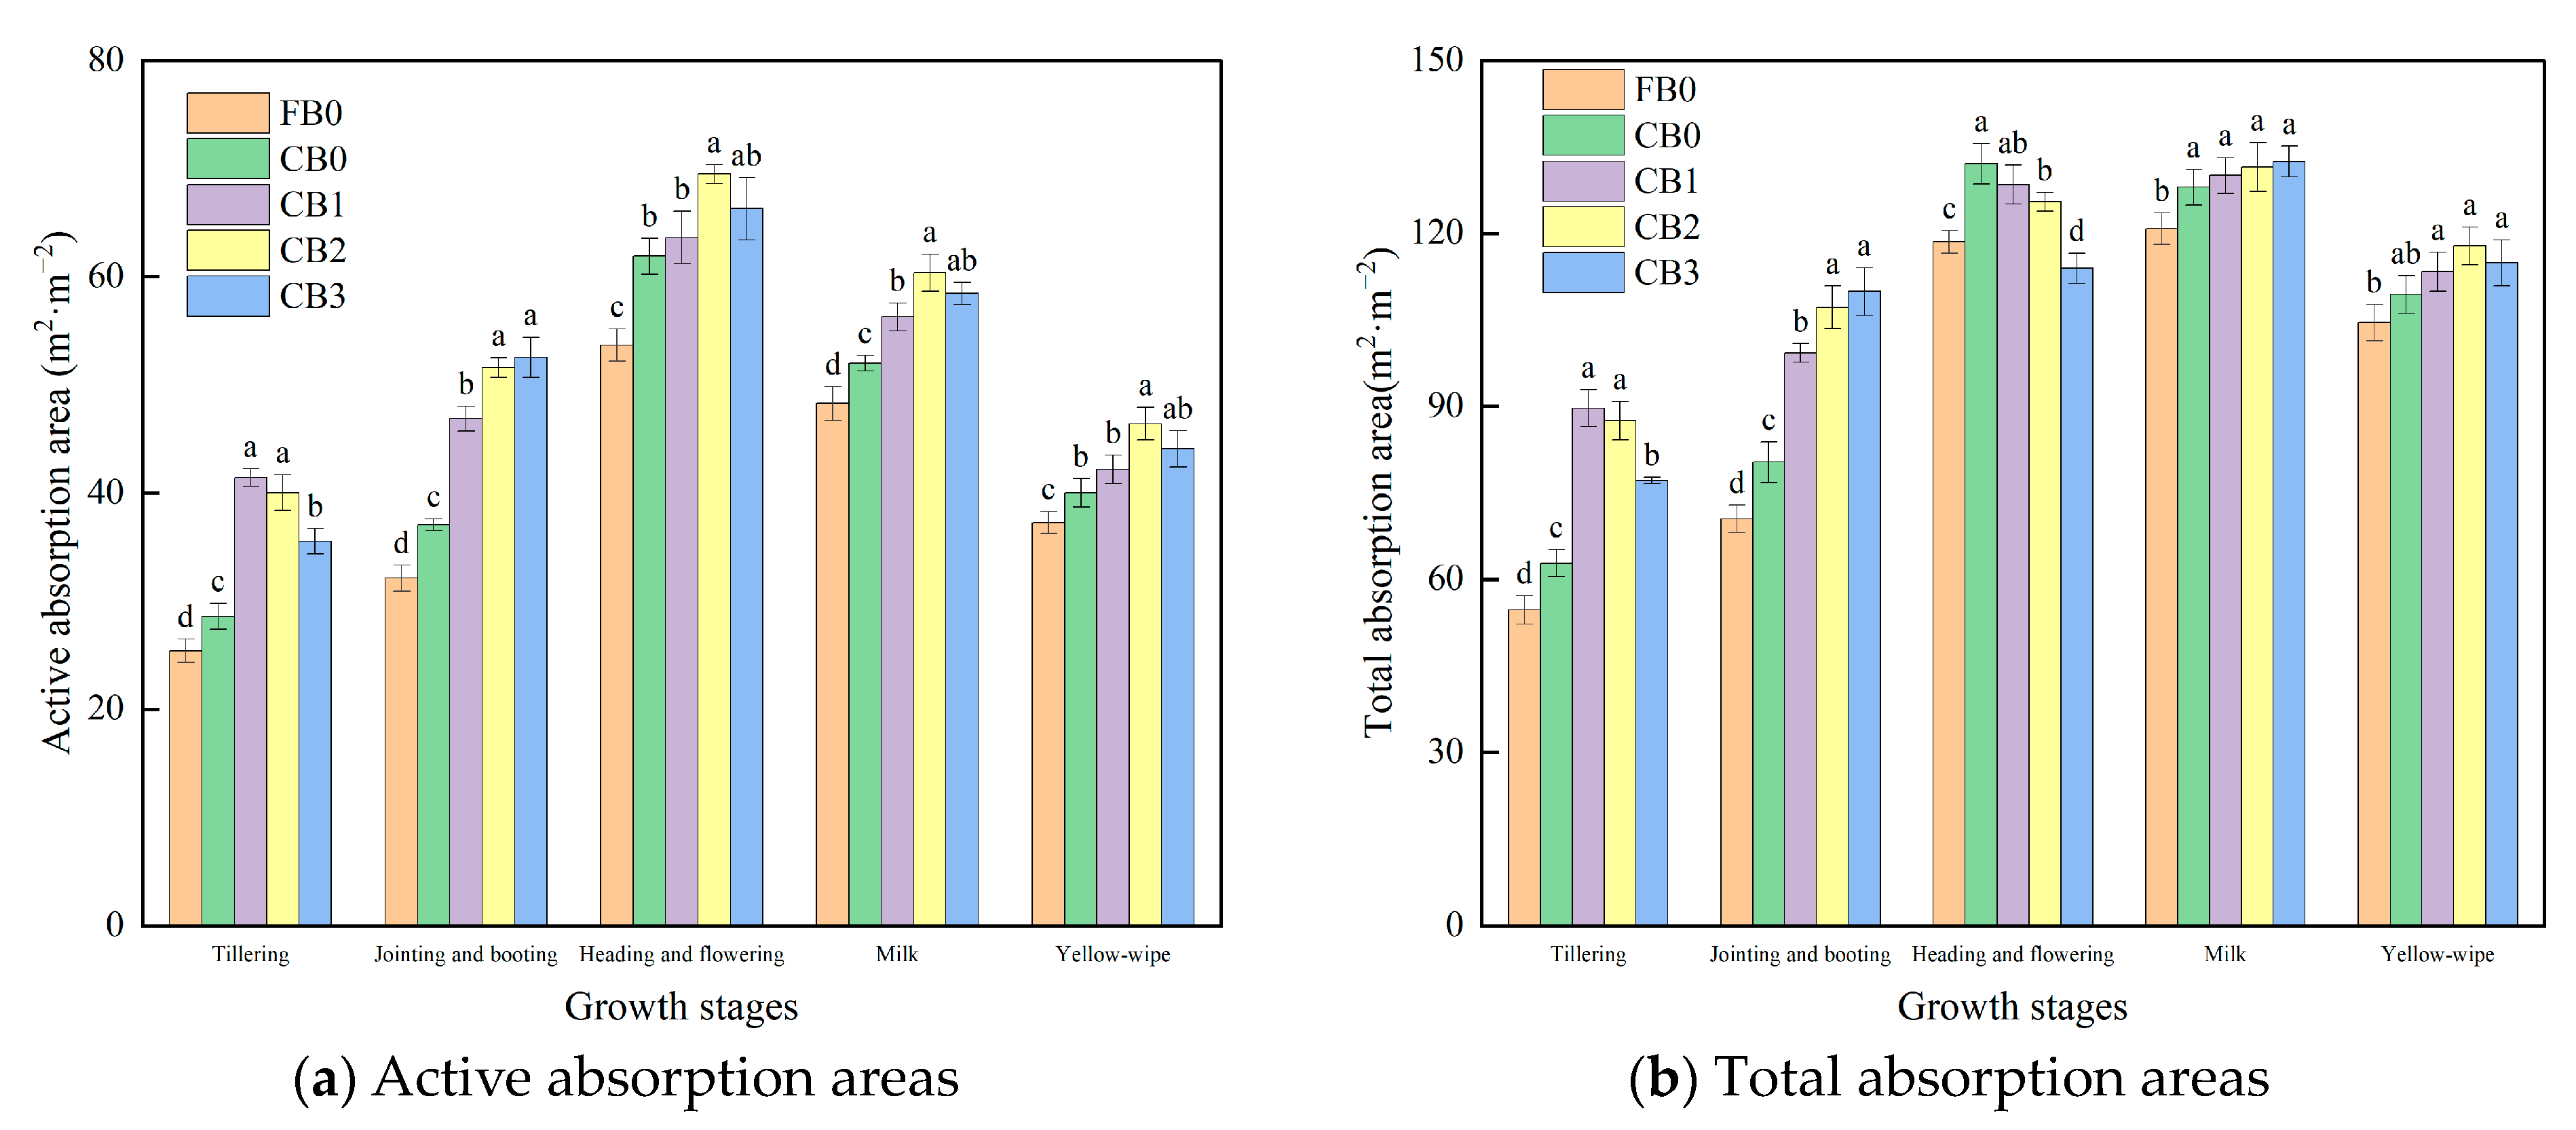
3.3.1. Root Active Absorption Areas and Total Absorption Areas

Active absorption areas and total absorption areas of rice roots at different growth stages are shown in Figure 3. Biochar application increased plant active absorption areas and total absorption areas under WSI conditions. At the tillering stage, the active absorption areas of CB0 plants were higher than in the FB0 treatment by 12.49%, and the active absorption areas of CB1, CB2, and CB3 plants were higher than the CB0 plants by 45.03%, 40.13%, and 24.40%, respectively. At the jointing–booting stage, the active absorption areas of CB0 plants were higher than in the FB0 treatment by 15.45%, and the active absorption areas of CB1, CB2, and CB3 plants were higher than CB0 plants by 26.47%, 39.26%, and 41.80%, respectively. At the heading–flowering stage, the active absorption areas of CB0 plants were higher than for the FB0 plants by 15.33%, and the active absorption areas of CB1, CB2, and CB3 plants were higher than in CB0 plants by 2.78%, 12.28%, and 7.08%, respectively. In the early stage of rice growth, biochar application significantly increased plant total absorption areas and active absorption areas under WSI conditions. As growth periods progressed, differences between the total root absorption areas and the active absorption areas between treatments gradually decreased, while treatments with biochar application still exhibited higher total absorption and active absorption areas in root systems.

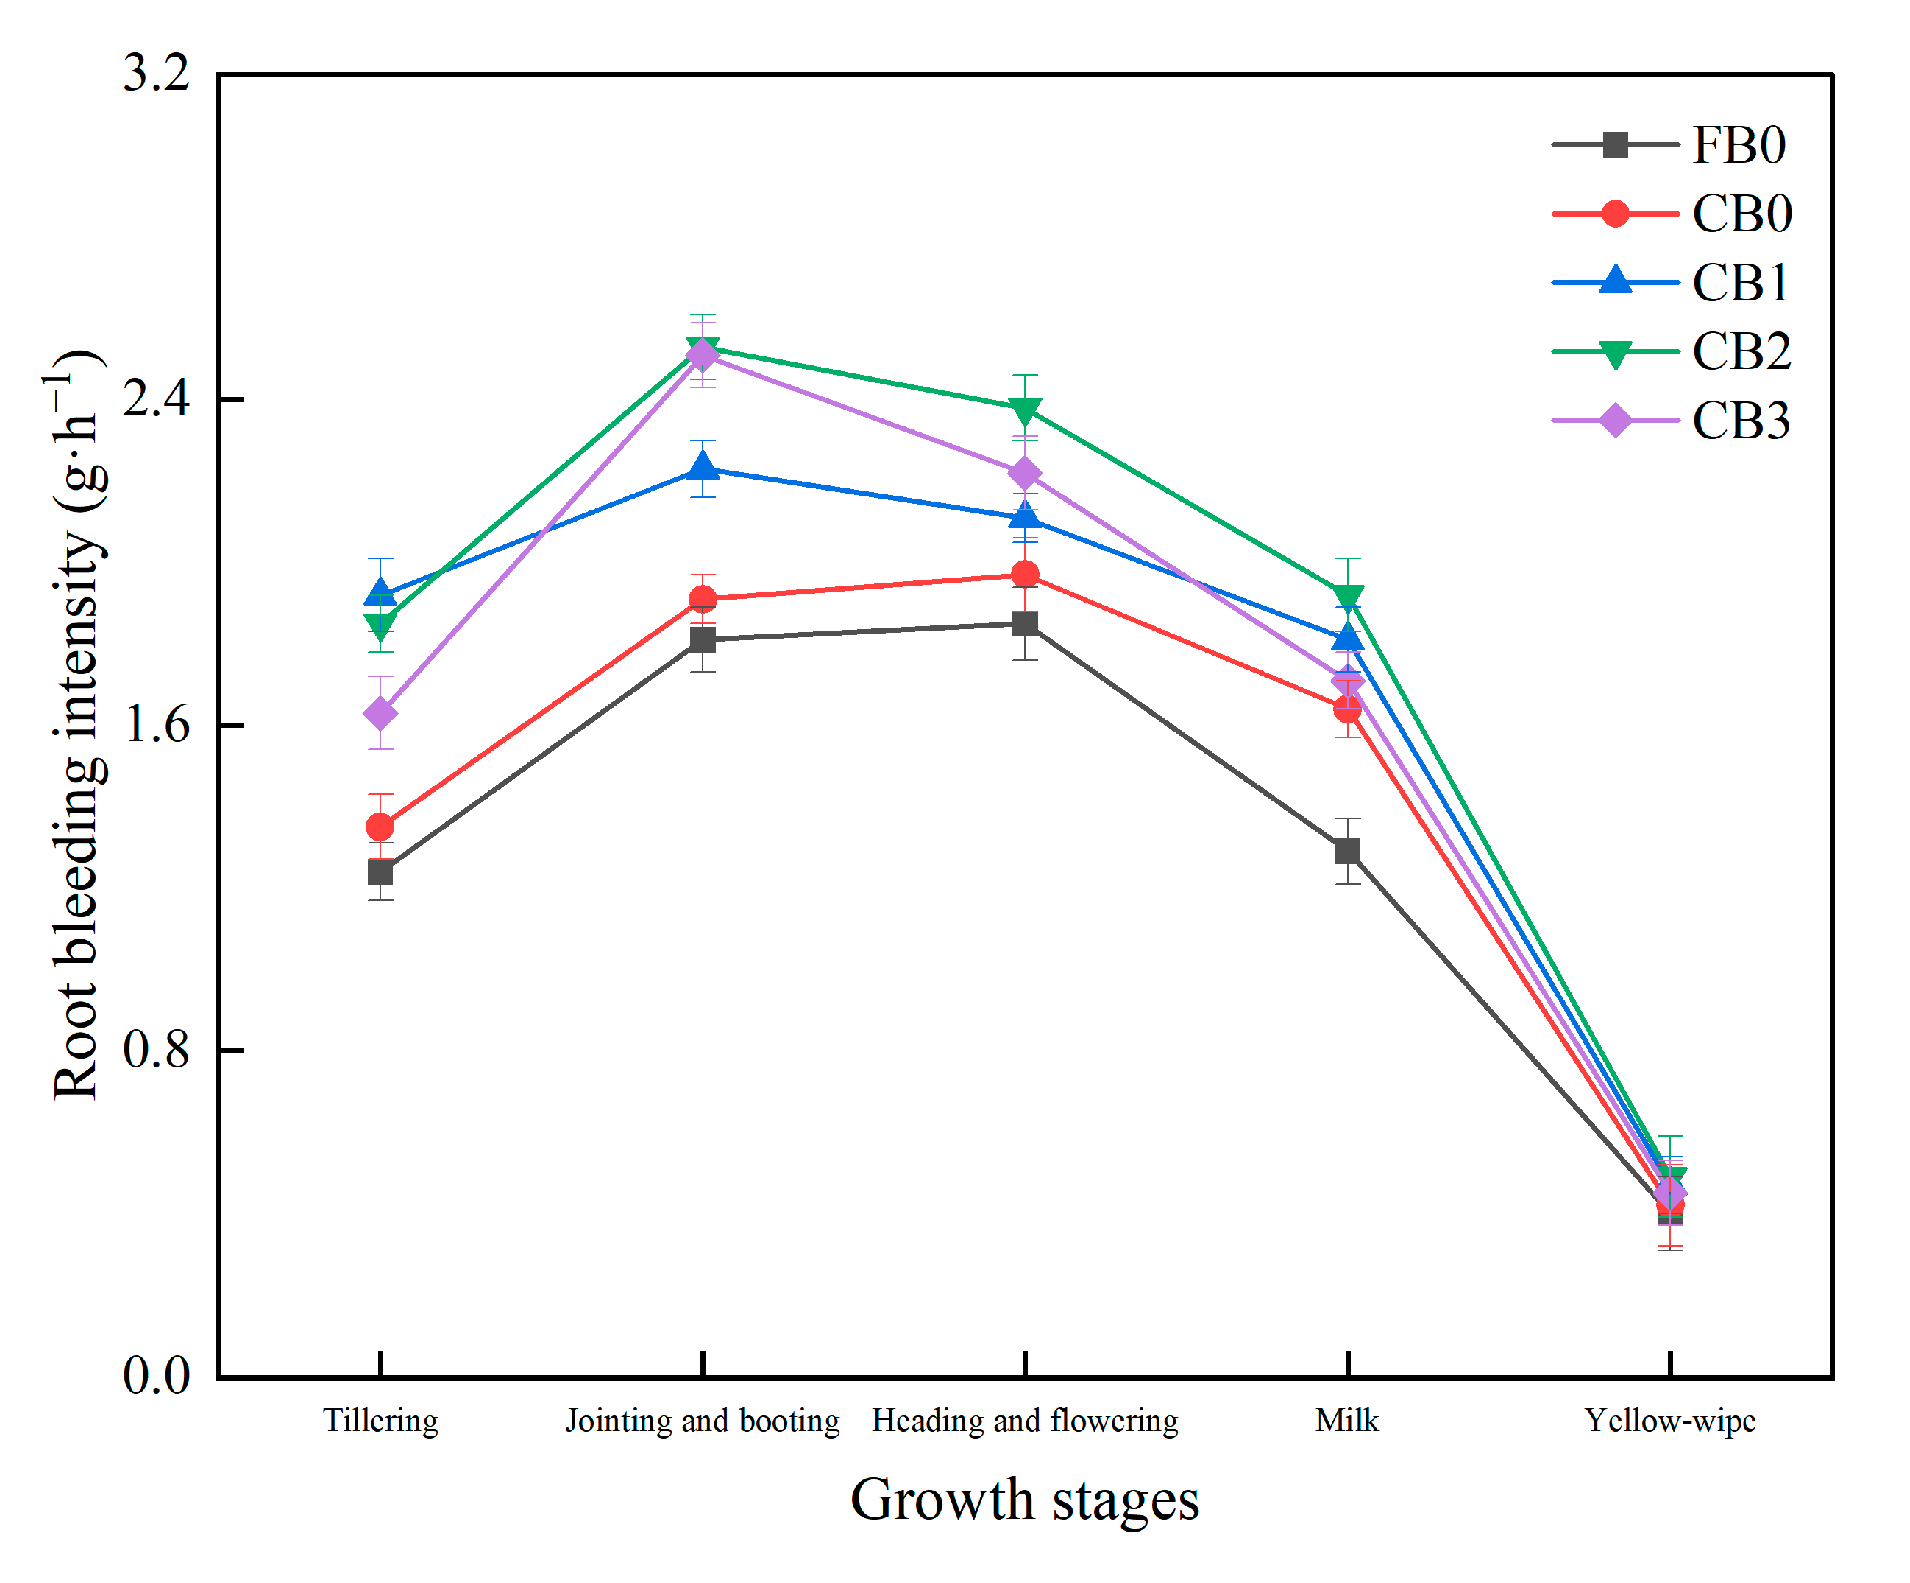
3.3.2. Root Bleeding Intensity

Changes in root bleeding intensity at different growth stages are shown in Figure 4. Rice root bleeding intensity first increased and then decreased with growth stages. From the tillering to heading–flowering stages, root bleeding intensity after biochar application was significantly higher than without biochar application (p < 0.05). The rice root bleeding intensity with biochar application reached maximum values at the jointing–booting stage, while that without biochar application reached a maximum value at the heading–flowering stage. At the tillering stage, the root bleeding intensity of CB0 plants was higher than in FB0 plants by 8.87%. The root bleeding intensities of CB1, CB2, and CB3 plants were higher than in the CB0 treatment by 42.22%, 37.04%, and 20.74%, respectively. At the jointing–booting stage, the root bleeding intensity of CB0 plants was higher than in FB0 plants by 5.52%. The root bleeding intensity of CB1, CB2, and CB3 plants was higher than in CB0 plants by 16.75%, 32.46%, and 31.41%, respectively. At the heading–flowering stage, the root bleeding intensity of CB0 plants was higher than in FB0 plants by 6.49%. The root bleeding intensities of CB1, CB2, and CB3 plants were higher than in CB0 plants by 7.11%, 20.81%, and 12.69%, respectively. At the grouting and yellow-ripe stages, differences in root bleeding intensity among treatments were minimal.
Changes in RA at different growth stages are shown in Figure 5. The RA of rice in each treatment first increased and then decreased, reaching a maximum value at the heading–flowering stage. Except for the yellow-ripe stage, the RA of rice after biochar application was significantly higher than without biochar application (p < 0.05). At the tillering stage, CB0 plant RAs were higher than for FB0 plants by 17.21%. The RAs of CB1, CB2, and CB3 treatments were higher than for CB0 treatments by 57.34%, 48.25%, and 37.06%, respectively. At the jointing–booting stage, the RAs of CB0 plants were higher than for FB0 plants by 13.41%, The RAs of CB1, CB2, and CB3 plants were higher than in CB0 plants by 27.96%, 45.70%, and 41.94%, respectively. At the heading–flowering stage, CB0 RAs were higher than in FB0 plants by 14.03%. The RAs of CB1, CB2, and CB3 plants were higher than in CB0 plants by 9.92%, 28.57%, and 19.44%, respectively. At the grouting stage, CB0 RAs were higher than in FB0 plants by 10.29%. The RAs of CB1, CB2, and CB3 treatments were higher than in CB0 plants by 34.67%, 133.33%, and 76.00%, respectively. At the yellow-ripe stage, CB0 RAs were higher than in FB0 plants by 6.25%. The RAs of CB1, CB2, and CB3 plants were higher than in CB0 plants by 23.53%, 52.94%, and 17.65%, respectively. Biochar application increased rice RA under C in each growth period. Biochar greatly influences root physiological processes, with the most obvious effect occurring before the heading–flowering stage.

3.4. Absorption of 15N-Fertilizer and Soil Nitrogen by Rice Roots

The amount of 15N-fertilizer and soil nitrogen absorbed by rice roots at different growth stages is shown in Table 4. Except for the yellow-ripe stage, the 15N-fertilizer absorbed by rice roots after biochar application treatments under CI was significantly higher than for FB0 plants (p < 0.05), with the appropriate application level of biochar increasing soil nitrogen absorption by rice roots. 15N-fertilizer nitrogen accounted for 12.42–15.67%, 17.45–20.20%, 20.33–22.22%, 13.24–16.45%, and 11.90–17.51% of the nitrogen absorbed by roots in each growth period. The proportions of 15N-fertilizer nitrogen absorbed by roots were highest at the heading–flowering stage, followed by the jointing–booting stage. A total of 35.16–38.59% and 30.20–31.60% of the 15N-fertilizer nitrogen absorbed by rice roots was absorbed in the jointing–booting and heading–flowering stages, respectively. In addition, 33.99–35.41% and 22.38–25.51% of soil nitrogen absorbed by rice roots was absorbed in the jointing–booting and heading–flowering stages, respectively.
Statistical analysis (Table 5) indicated that the absorption of 15N-fertilizer by rice roots was significantly positively correlated with the longest RL, root bleeding intensity, and RA (p < 0.01). Furthermore, 15N-fertilizer was significantly positively correlated with the active absorption area (p < 0.05). Soil nitrogen absorbed by rice roots was significantly positively correlated with root bleeding intensity and RA (p < 0.01), in addition to being significantly positively correlated with the longest RL (p < 0.05).

3.5. Nitrogen Use Efficiency

The yields and NUE of different treatments are summarized in Table 6. Biochar application increased the yields, NUE, NAE, and NPFP under WSI conditions. Compared with FB0 treatment plants, the rice yields of CB0, CB1, CB2, and CB3 plants increased by 1.64%, 5.12%, 16.45%, and 7.54%, respectively. Compared with FB0 plants, the NUE of CB0, CB1, CB2, and CB3 plants increased by 6.80%, 13.25%, 39.42%, and 30.72%, respectively. Compared with FB0 plants, the NAE of CB0, CB1, CB2, and CB3 plants increased by 2.88%, 12.18%, 24.48%, and 19.04%, respectively. Compared with FB0 plants, the NPFP of CB0, CB1, CB2, and CB3 plants increased by 1.64%, 5.12%, 16.45%, and 7.54%, respectively.

4. Discussion

4.1. Relationships between Rice Root Morphological and Physiological Characteristics with Nitrogen Uptake

Root systems serve as vital organs for water and nutrient absorption and are key contributors to the synthesis of various hormones, amino acids, and organic acids [44]. Root growth consequently directly influences crop yields and aboveground plant growth [45]. Here, significant correlations were observed between the utilization of 15N-fertilizer nitrogen and soil nitrogen by rice roots with the longest RL, root bleeding intensity, and RA (p < 0.01) (Table 5). These observations highlight the impact of rice root morphological and physiological characteristics on nitrogen absorption by roots.
Crop root morphology is influenced by various factors including water and fertilization management practices, soil properties, and environmental conditions [46]. During the tillering stage in particular, establishing a robust root system can enhance rice root function in later growth stages, prolong leaf lifespans, facilitate grain filling, facilitate seed setting, and ultimately increase rice yield [47,48,49]. Biochar application promoted early-stage rice root growth in this study, albeit to a diminishing effect in later growth stages. Overall, root morphology was optimized after biochar application (Table 3). Furthermore, the combination of biochar application and WSI conditions significantly increased total root absorption and active absorption areas, RA, and root bleeding intensity, thereby enhancing root absorption capacity and substance transport efficiency while also promoting nitrogen absorption during the early stage of rice growth (Figure 3, Figure 4 and Figure 5). As growth periods progressed, differences in total absorption area and active absorption area diminished among treatments, while areas of plants with biochar application consistently exhibited higher values, consequently facilitating water and nutrient absorption in later stages and ultimately leading to increased yields (Figure 3).

4.2. Effects of Biochar Application on Root Growth under WSI Conditions

The combined application of biochar with WSI methods altered the morphological and physiological traits of rice roots in this study. The application of an appropriate amount of biochar increased the longest RL, RV, RFW, root active absorption area, root bleeding intensity, and RA owing to several biochar characteristics. First, biochar is rich in nutrients such as nitrogen, phosphorus, and potassium, thereby enhancing soil nutrient supply and providing a foundation for root tissue development and morphogenesis [50,51]. Second, the dark color of biochar yields endothermic properties, elevating soil temperature and mitigating cold-related damage during early spring in Northeast China, consequently creating favorable conditions for root growth and development [52]. Third, biochar application reduces soil bulk density, increases total soil porosity, improves soil aeration, and improves soil permeability, creating an optimal growth environment for root physiological structures and morphological development and facilitating deep rooting and root extension [53]. Fourth, biochar application increases soil microbial abundances and enhances microbial activity, thereby improving rhizosphere growth environments and promoting root growth [54].
It is worth noting that during the tillering to heading–flowering stages, the DB3 treatment plants exhibited reduced utilization of fertilizer nitrogen and soil nitrogen by root systems compared with the DB2 plants. This reduction may be attributed to several factors. First, excessive biochar application can lead to dramatic changes in soil pH, weakening nutrient adsorption by roots and inhibiting root growth and nutrient utilization [55]. Second, increased soil pH and C/N ratios due to excessive biochar application may negatively impact soil microbial community structure and function, thereby affecting root physiological functions [56]. Third, excessive biochar application may increase paddy soil porosity and accelerate water and nutrient loss, resulting in diminished nutrient absorption by roots and compromised rice growth [57]. Thus, optimizing biochar application within an optimal range is essential for promoting root growth and development.

4.3. Effects of Biochar Application on NUE and Yields under WSI Conditions

Ammonium nitrogen and nitrate nitrogen levels in soils increased with greater biochar application (Table 2). Biochar application can enhance soil nutrient supply capacity, thereby influencing nitrogen cycling and transformation [58,59]. The rice yields, NUE, NAE, and NPFP of biochar application treatment plants under WSI conditions were notably higher compared with those of FB0 plants, ranging from 13.25% to 39.42%, 12.18% to 24.48%, and 5.12% to 16.45%, respectively. These increases can be primarily attributed to nitrogen retention by biochar that reduces ammonia volatilization and leaching losses [60,61], consequently enhancing crop nutrient supply and promoting crop growth. Recent studies indicated that biochar application raises soil pH, alters soil microbial community structures, and increases the abundances of nitrogen-fixing microorganisms, potentially explaining how biochar slows soil nitrogen loss rates and enhances nitrogen retention [33]. However, excessive biochar application exceeding 40 t ha−1 may lead to nitrogen loss, carbon–nitrogen ratio imbalances in soils [62], inhibited crop growth, reduced soil microbial activity, and diminished nutrient absorption [63]. When biochar application surpasses 20 t ha−1, crop yields may decrease [64]. Hence, the biochar application level is a critical factor to be considered. It is worth noting that rice yields in this study after biochar application were influenced by the levels of biochar application. The yields of treatments after biochar application initially increased and then decreased with increasing biochar application under WSI conditions, consistent with previous results [65].
The application of an appropriate amount of biochar under WSI conditions in black soil areas of Northeast China has been shown to regulate soil water content, fertilizer levels, gas production, and heat production, consequently generating optimal growth environments for rice roots. Thus, biochar application optimizes root morphological characteristics, enhances plant physiological functions, and promotes root growth. These factors collectively ensure the supply, transformation, and accumulation of nutrients in aboveground plant components, ultimately resulting in increased yields. Despite these benefits, the reasonable application of biochar and its long-term effects on rice roots and yields still require further verification, especially regarding ecological effects under different environmental conditions and soil types, necessitating further systematic and in-depth research.

5. Conclusions

In this study, we investigated the effects of biochar application on the morphological and physiological traits of rice roots along with the utilization of 15N-fertilizer and soil nitrogen by roots under WSI conditions. The results of this study indicate that combining WSI conditions with biochar application increased the longest RL, RV, RFW, root active absorption area, root bleeding intensity, and RA while also optimizing root–shoot ratios. In addition, these changes improved the absorption of nitrogen by roots and increased rice yields, NUE, NAE, and NPFP. These results carry implications for soil fertilization and the sustainable management of water and soil resources in paddy fields. Further, these results provide insights into the application of biochar in paddy fields under WSI conditions, particularly in black soil regions. Future studies are also required to understand the impacts of nitrogen fertilizer reduction alongside biochar application on rice root morphological and physiological characteristics under WSI conditions.

Author Contributions

Methodology, Z.Z. (Zuohe Zhang); software, T.L.; validation, Z.Z. (Zhongxue Zhang) and Z.G.; formal analysis, T.N. and P.C.; investigation, Y.H. and L.X.; data curation, Z.Z. (Zuohe Zhang); writing—original draft preparation, Z.Z. (Zuohe Zhang); writing—review and editing, Z.Z. (Zhongxue Zhang) and Z.G.; funding acquisition, Z.Z. (Zhongxue Zhang). All authors have read and agreed to the published version of the manuscript.

Funding

This research was funded by the General Projects of the National Natural Science Foundation of China (52079028), the Suihua University Scientific Research Launch Fund project (SQ21009), the Postdoctoral Fellowship Program of CPSF (GZC20230668), and the Basic Scientific Research Business Expenses Projects for Provincial Higher Education Institutions in Heilongjiang Province (YWF10236230215).

Data Availability Statement

The data presented in this study are available on request from the corresponding author.

Acknowledgments

We would like to thank the Heilongjiang Province Hydraulic Research Institute for granting us access to the test sites, and for their valuable time providing us with management information. We would also like to acknowledge the National Bureau of Statistics of China for their data support.

Conflicts of Interest

The authors declare no conflicts of interest.

References

  1. Ullah, S.; Zhao, Q.; Wu, K.; Ali, I.; Liang, H.; Iqbal, A.; Wei, S.; Cheng, F.; Ahmad, S.; Jiang, L.; et al. Biochar application to rice with 15N-labelled fertilizers, enhanced leaf nitrogen concentration and assimilation by improving morpho-physiological traits and soil quality. Saudi J. Biol. Sci. 2021, 28, 3399–3413. [Google Scholar] [CrossRef] [PubMed]
  2. FAOSTAT. Food and Agriculture Organization of the United Nations. 2021. Available online: http://www.fao.org/faostat/en/#data/QCL (accessed on 19 December 2023.).
  3. Niu, Y.; Xie, G.; Xiao, Y.; Liu, J.; Zou, H.; Qin, K.; Wang, Y.; Huang, M. The story of grain self-sufficiency: China’s food security and food for thought. Food Energy Secur. 2022, 11, e344. [Google Scholar] [CrossRef]
  4. Chen, Y.; Wen, Z.; Meng, J.; Liu, Z.; Wei, J.; Liu, X.; Ge, Z.; Dai, W.; Lin, L.; Chen, W. The positive effects of biochar application on Rhizophagus irregularis, rice seedlings, and phosphorus cycling in paddy soil. Pedosphere 2023, 33, 1–16. [Google Scholar] [CrossRef]
  5. Xin, F.; Xiao, X.; Dong, J.; Zhang, G.; Zhang, Y.; Wu, X.; Li, X.; Zou, Z.; Ma, J.; Du, G.; et al. Large increases of paddy rice area, gross primary production, and grain production in Northeast china during 2000–2017. Sci. Total Environ. 2020, 711, 135183. [Google Scholar] [CrossRef]
  6. Li, T.; Nie, T.; Chen, P.; Zhang, Z.; Lan, J.; Zhang, Z.; Qi, Z.; Han, Y.; Jiang, L. Carbon budget of paddy fields after implementing water-saving irrigation in Northeast China. Agronomy 2022, 12, 1481. [Google Scholar] [CrossRef]
  7. Wang, S.; Liu, W.; Liu, Q. Agricultural water consumption and suitable paddy rice plantareas of the Three-River-Plain. Trans. CSAE 2004, 20, 50–53. [Google Scholar]
  8. Tian, Q.; Wang, F.; Tian, Y.; Jiang, Y.; Weng, P.; Li, J. Copula-based comprehensive drought identification and evaluation over the Xijiang River Basin in South China. Ecol. Indic. 2023, 154, 110503. [Google Scholar] [CrossRef]
  9. Carracelas, G.; Hornbuckleb, J.; Rosas, J.; Roel, A. Irrigation management strategies to increase water productivity in Oryza sativa (rice) in Uruguay. Agric. Water Manag. 2019, 222, 161–172. [Google Scholar] [CrossRef]
  10. Nie, T.; Huang, J.; Zhang, Z.; Chen, P.; Li, T.; Dai, C. The inhibitory effect of a water-saving irrigation regime on CH4 emission in Mollisols under straw incorporation for 5 consecutive years. Agric. Water Manag. 2023, 278, 108163. [Google Scholar] [CrossRef]
  11. Zhuang, Y.; Zhang, L.; Li, S.; Liu, H.; Zhai, L.; Zhou, F.; Ye, Y.; Ruan, S.; Wen, W. Effects and potential of water-saving irrigation for rice production in China. Agric. Water Manag. 2019, 217, 374–382. [Google Scholar] [CrossRef]
  12. China Water. 2019. Available online: http://slt.hlj.gov.cn/contents/9/4645.html (accessed on 23 July 2019).
  13. Xu, G.; Lu, D.; Wang, H.; Li, Y. Morphological and physiological traits of rice roots and their relationships to yield and nitrogen utilization as influenced by irrigation regime and nitrogen rate. Agric. Water Manag. 2018, 203, 385–394. [Google Scholar] [CrossRef]
  14. Akter, M.; Deroo, H.; Kamal, A.M.; Kader, M.A.; Verhoeven, E.; Decock, C.; Boeckx, P.; Sleutel, S. Impact of irrigation management on paddy soil N supply and depth distribution of abiotic drivers. Agric. Ecosyst. Environ. 2018, 261, 12–24. [Google Scholar] [CrossRef]
  15. Li, T.; Feng, Y.; Zhu, A.; Huang, J.; Wang, H.; Li, S.; Liu, K.; Peng, R.; Zhang, H.; Liu, L. Effects of main water-saving irrigation methods on morphological and physiological traits of rice roots. Chin. J. Rice Sci. 2019, 33, 293–302. [Google Scholar]
  16. Wang, M.; Yu, S.; Shao, G.; Gao, S.; Wang, J.; Zhang, Y. Impact of alternate drought and flooding stress on water use, and nitrogen and phosphorus losses in a paddy field. Pol. J. Environ. Stud. 2018, 27, 345–355. [Google Scholar] [CrossRef] [PubMed]
  17. Chen, P.; Nie, T.; Chen, S.; Zhang, Z.; Qi, Z.; Liu, W. Recovery efficiency and loss of 15N-labelled urea in a rice-soil system under water saving irrigation in the Songnen Plain of Northeast China. Agric. Water Manag. 2019, 222, 139–153. [Google Scholar] [CrossRef]
  18. Xu, J.; Yang, S.; Peng, S.; Wei, Q.; Gao, X. Solubility and leaching risks of organic carbon in paddy soils as affected by irrigation managements. Sci. World J. 2013, 2013, 546750. [Google Scholar] [CrossRef] [PubMed]
  19. Kuppusamy, S.; Thavamani, P.; Megharaj, M.; Venkateswarlu, K.; Naidu, R. Agronomic and remedial benefits and risks of applying biochar to soil: Current knowledge and future research directions. Environ. Int. 2016, 87, 1–12. [Google Scholar] [CrossRef] [PubMed]
  20. Fan, Q.; Sun, J.; Chu, L.; Cui, L.; Quan, G.; Yan, J.; Hussain, Q.; Iqbal, M. Effects of chemical oxidation on surface oxygen-containing functional groups and adsorption behavior of biochar. Chemosphere 2018, 207, 33–40. [Google Scholar] [CrossRef] [PubMed]
  21. Pan, S.; Dong, C.; Su, J.; Wang, P.; Chen, C.; Chang, J.; Kim, H.; Huang, C.; Hung, C. The role of biochar in regulating the carbon, phosphorus, and nitrogen cycles exemplified by soil systems. Sustainability 2021, 13, 5612. [Google Scholar] [CrossRef]
  22. Liu, Y.; Li, H.; Hu, T.; Mahmoud, A.; Li, J.; Zhu, R.; Jiao, X.; Jing, P. A quantitative review of the effects of biochar application on rice yield and nitrogen use efficiency in paddy fields: A meta-analysis. Sci. Total Environ. 2022, 830, 154792. [Google Scholar] [CrossRef]
  23. Wu, C.; Hou, Y.; Bie, Y.; Chen, X.; Dong, Y.; Lin, L. Effects of biochar on soil water soluble sodium, calcium, magnesium and soil enzyme activity of peach seedlings. IOP Conf. Ser. Earth Environ. Sci. 2020, 446, 032007. [Google Scholar] [CrossRef]
  24. Zhang, J.; Zhou, S.; Sun, H.; Lü, F.; He, P. Three-year rice grain yield responses to coastal mudflat soil properties amended with straw biochar. J. Environ. Manag. 2019, 239, 23–29. [Google Scholar] [CrossRef] [PubMed]
  25. Baiamonte, G.; Crescimanno, G.; Parrino, F.; Pasquale, C. Effect of biochar on the physical and structural properties of a sandy soil. Catena 2019, 175, 294–303. [Google Scholar] [CrossRef]
  26. Qiu, B.; Tao, X.; Wang, H.; Li, W.; Ding, X.; Chu, H. Biochar as a low-cost adsorbent for aqueous heavy metal removal: A review. J. Anal. Appl. Pyrol. 2021, 155, 105081. [Google Scholar] [CrossRef]
  27. Cui, X.; Yuan, J.; Yang, X.; Wei, C.; Bi, Y.; Sun, Q.; Meng, J.; Han, X. Biochar application alters soil metabolites and nitrogen cycle-related microorganisms in a soybean continuous cropping system. Sci. Total Environ. 2024, 917, 170522. [Google Scholar] [CrossRef] [PubMed]
  28. Asadyar, L.; Xu, C.; Wallace, H.M.; Xu, Z.; Reverchon, F.; Bai, S.H. Soil-plant nitrogen isotope composition and nitrogen cycling after biochar applications. Environ. Sci. Pollut. Res. 2021, 28, 6684–6690. [Google Scholar] [CrossRef]
  29. Be, S.; Vinitnantharat, S.; Pinisakul, A. Effect of mangrove biochar residue amended shrimp pond sediment on nitrogen adsorption and leaching. Sustainability 2021, 13, 7230. [Google Scholar] [CrossRef]
  30. Liu, B.; Li, H.; Li, H.; Zhang, A.; Rengel, Z. Long-term biochar application promotes rice productivity by regulating root dynamic development and reducing nitrogen leaching. GCB Bioenergy 2021, 13, 257–268. [Google Scholar] [CrossRef]
  31. Ahmad, Z.; Mosa, A.; Zhan, L.; Gao, B. Biochar modulates mineral nitrogen dynamics in soil and terrestrial ecosystems: A critical review. Chemosphere 2021, 278, 130378. [Google Scholar] [CrossRef]
  32. Ul Islam, M.; Jiang, F.; Guo, Z.; Peng, X. Does biochar application improve soil aggregation? A meta-analysis. Soil Till. Res. 2021, 209, 104926. [Google Scholar] [CrossRef]
  33. Chen, P.; Liu, Y.; Mo, C.; Jiang, Z.; Yang, J.; Lin, J. Microbial mechanism of biochar addition on nitrogen leaching and retention in tea soils from different plantation ages. Sci. Total Environ. 2021, 757, 143817. [Google Scholar] [CrossRef] [PubMed]
  34. Xiong, Q.; Hu, J.; Wei, H.; Zhang, H.; Zhu, J. Relationship between plant roots, rhizosphere microorganisms, and nitrogen and its special focus on rice. Agriculture 2021, 11, 234. [Google Scholar] [CrossRef]
  35. Li, H.; Liu, Y.; Jiao, X.; Li, J.; Liu, K.; Wu, T.; Zhang, Z.; Luo, D. Response of soil nutrients retention and rice growth to biochar in straw returning paddy fields. Chemosphere 2023, 312, 137244. [Google Scholar] [CrossRef] [PubMed]
  36. Liu, J.; Jiang, B.; Shen, J.; Zhu, X.; Yi, W.; Li, Y.; Wu, J. Contrasting effects of straw and straw-derived biochar applications on soil carbon accumulation and nitrogen use efficiency in double-rice cropping systems. Agric. Ecosyst. Environ. 2021, 311, 107286. [Google Scholar] [CrossRef]
  37. Zhang, Y.; Xu, J.; Cheng, Y.; Wang, C.; Liu, G.; Yang, J. The effects of water and nitrogen on the roots and yield of upland and paddy rice. J. Integr. Agric. 2020, 19, 1363–1374. [Google Scholar] [CrossRef]
  38. Khadem, A.; Raiesi, F. Response of soil alkaline phosphatase to biochar amendments: Changes in kinetic and thermodynamic characteristics. Geoderma 2019, 377, 44–54. [Google Scholar] [CrossRef]
  39. Hussain, M.; Farooq, M.; Nawaz, A.; Al-Sadi, A.M.; Solaiman, Z.M.; Alghamdi, S.S.; Ammara, U.; Ok, Y.S.; Siddique, K.H.M. Biochar for crop production: Potential benefits and risks. J. Soil. Sediment. 2017, 17, 685–716. [Google Scholar] [CrossRef]
  40. Mehmood, I.; Qiao, L.; Chen, H.; Tang, Q.; Woolf, D.; Fan, M. Biochar addition leads to more soil organic carbon sequestration under a maize-rice cropping system than continuous flooded rice. Agric. Ecosyst. Environ. 2020, 298, 106965. [Google Scholar] [CrossRef]
  41. Zhang, C.; Huang, X.; Zhang, X.; Wan, L.; Wang, Z. Effects of biochar application on soil nitrogen and phosphorous leaching loss and oil peony growth. Agric. Water Manag. 2021, 255, 107022. [Google Scholar] [CrossRef]
  42. Zhou, L.; Yuan, L.; Zhao, B.; Li, Y. Effects of single-sided application of humic acid on maize root growth. Sci. Agric. Sin. 2022, 55, 339–349. [Google Scholar]
  43. Sun, H.; Li, X.; Ren, T.; Cong, R.; Lu, J. Effects of fertilizer in shallow soils on growth and distribution of rice roots at seedling stage. Sci. Agric. Sin. 2014, 47, 2476–2484. [Google Scholar]
  44. Zou, Z.; Fan, L.; Li, X.; Dong, C.; Zhang, L.; Zhang, L.; Fu, J.; Han, W.; Yan, P. Response of plant root growth to biochar amendment: A meta-analysis. Agronomy 2021, 11, 2442. [Google Scholar] [CrossRef]
  45. Yu, H.; Zou, W.; Chen, J.; Chen, H.; Yu, Z.; Huang, J.; Tang, H.; Wei, X.; Gao, B. Biochar amendment improves crop production in problem soils: A review. J. Environ. Manag. 2019, 232, 8–21. [Google Scholar] [CrossRef] [PubMed]
  46. Jha, S.K.; Gao, Y.; Liu, H.; Huang, Z.; Wang, G.; Liang, Y.; Duan, A.-W. Root development and water uptake in winter wheat under different irrigation methods and scheduling for North China. Agric. Water Manag. 2017, 182, 139–150. [Google Scholar] [CrossRef]
  47. Dong, D.; Feng, Q.; McGrouther, K.; Yang, M.; Wang, H.; Wu, W. Effects of biochar amendment on rice growth and nitrogen retention in a waterlogged paddy field. J. Soil Sediment. 2015, 15, 153–162. [Google Scholar] [CrossRef]
  48. Zhang, J.; Zhang, Y.; Song, N.; Chen, Q.; Sun, H.; Peng, T.; Huang, S.; Zhao, Q. Response of grain-filling rate and grain quality of mid-season indica rice to nitrogen application. J. Integr. Agric. 2021, 20, 1465–1473. [Google Scholar] [CrossRef]
  49. Xiang, Y.; Deng, Q.; Duan, H.; Guo, Y. Effects of biochar application on root traits: A meta-analysis. GCB Bioenergy 2017, 9, 1563–1572. [Google Scholar] [CrossRef]
  50. Enders, A.; Hanley, K.; Whitman, T.; Joseph, S.; Lehmann, J. Characterization of biochars to evaluate recalcitrance and agronomic performance. Bioresour. Technol. 2012, 114, 644–653. [Google Scholar] [CrossRef]
  51. Yan, S.; Niu, Z.; Yan, H.; Yun, F.; Peng, G.; Yang, Y.; Liu, G. Biochar application significantly affects the N pool and microbial community structure in purple and paddy soils. PeerJ 2019, 7, e7576. [Google Scholar] [CrossRef]
  52. Kamali, M.; Jahaninafard, D.; Mostafaie, A.; Davarazar, M.; Gomes, A.P.D.; Tarelho, L.A.C.; Dewil, R.; Aminabhavi, T.M. Scientometric analysis and scientific trends on biochar application as soil amendment. Chem. Eng. J. 2020, 395, 125128. [Google Scholar] [CrossRef]
  53. Ahmed, R.; Li, Y.; Mao, L.; Xu, C.; Lin, W.; Ahmed, S.; Ahmed, W. Biochar effects on mineral nitrogen leaching, moisture content, and evapotranspiration after 15N urea fertilization for vegetable crop. Agronomy 2019, 9, 331. [Google Scholar] [CrossRef]
  54. Muhammad, N.; Aziz, R.; Brookes, P.C.; Xu, J. Impact of wheat straw biochar on yield of rice and some properties of Psammaquent and Plinthudult. J. Soil Sci. Plant Nut. 2017, 17, 808–823. [Google Scholar] [CrossRef]
  55. Prendergast-Miller, M.T.; Duvall, M.; Sohi, S.P. Biochar-root interactions are mediated by biochar nutrient content and impacts on soil nutrient availability. Eur. J. Soil Sci. 2014, 65, 173–185. [Google Scholar] [CrossRef]
  56. Zhang, M.; Liu, Y.; Wei, Q.; Gou, J. Biochar enhances the retention capacity of nitrogen fertilizer and affects the diversity of nitrifying functional microbial communities in karst soil of southwest China. Ecotox. Environ. Safe 2021, 226, 112819. [Google Scholar] [CrossRef] [PubMed]
  57. Wang, M.; Fu, Y.; Wang, Y.; Li, Y.; Shen, J.; Liu, X.; Wu, J. Pathways and mechanisms by which biochar application reduces nitrogen and phosphorus runoff losses from a rice agroecosystem. Sci. Total Environ. 2021, 797, 149193. [Google Scholar] [CrossRef]
  58. Hossain, M.Z.; Bahar, M.M.; Sarkar, B.; Donne, S.W.; Ok, Y.S.; Palansooriya, K.N.; Kirkham, M.B.; Chowdhury, S.; Bolan, N. Biochar and its importance on nutrient dynamics in soil and plant. Biochar 2020, 2, 379–420. [Google Scholar] [CrossRef]
  59. Yao, R.; Li, H.; Yang, J.; Zhu, W.; Yin, C.; Wang, X.; Xie, W.; Zhang, X. Combined application of biochar and N fertilizer shifted nitrification rate and amoa gene abundance of ammonia-oxidizing microorganisms in salt-affected anthropogenic-alluvial soil. Appl. Soil Ecol. 2022, 171, 104348. [Google Scholar] [CrossRef]
  60. Pan, X.; Gu, Z.; Chen, W.; Li, Q. Preparation of biochar and biochar composites and their application in a Fenton-like process for wastewater decontamination: A review. Sci. Total Environ. 2021, 754, 142104. [Google Scholar] [CrossRef]
  61. Laird, D.; Fleming, P.; Wang, B.; Horton, R.; Karlen, D. Biochar impact on nutrient leaching from a Midwestern agricultural soil. Geoderma 2010, 158, 436–442. [Google Scholar] [CrossRef]
  62. Liu, Q.; Liu, B.; Zhang, Y.; Hu, T.; Lin, Z.; Liu, G.; Wang, X.; Ma, J.; Wang, H.; Jin, H.; et al. Biochar application as a tool to decrease soil nitrogen losses (NH3 volatilization, N2O emissions, and N leaching) from croplands:options and mitigation strength in a global perspective. Glob. Chang. Biol. 2019, 25, 2077–2093. [Google Scholar] [CrossRef]
  63. Gao, J.; Zhao, Y.; Zhang, W.; Sui, Y.; Jin, D.; Xin, W.; Yi, J.; He, D. Biochar prepared at different pyrolysis temperatures affects urea-nitrogen immobilization and N2O emissions in paddy fields. PeerJ 2019, 7, e7027. [Google Scholar] [CrossRef] [PubMed]
  64. Farhangi-Abriz, S.; Torabian, S.; Qin, R.; Noulas, C.; Lu, Y.; Gao, S. Biochar effects on yield of cereal and legume crops using meta-analysis. Sci. Total Environ. 2021, 775, 145869. [Google Scholar] [CrossRef]
  65. Yao, T.; Zhang, W.; Gulaqa, A.; Cui, Y.; Zhou, Y.; Weng, W.; Wang, X.; Liu, Q.; Jin, F. Effects of peanut shell biochar on soil nutrients, soil enzyme activity, and rice yield in heavily saline-sodic paddy field. J. Soil Sci. Plant Nut. 2021, 21, 655–664. [Google Scholar] [CrossRef]
Figure 1. Daily precipitation and temperatures during the rice growing season of 2020.
Agronomy 14 00889 g001
Figure 2. Plant root–shoot ratios at different rice growth stages. Bars represent mean SEs.
Agronomy 14 00889 g002
Figure 3. Active absorption areas and total absorption areas of roots at different rice growth stages. Bars represent mean SEs. Different letters indicate significant differences (p < 0.05) between different treatments.
Agronomy 14 00889 g003
Figure 4. Root bleeding intensity at different rice growth stages. Bars represent mean SEs.
Agronomy 14 00889 g004
Figure 5. Root activities at different rice growth stages.Bars represent mean SEs. Different letters indicate significant differences (p < 0.05) between different treatments.
Agronomy 14 00889 g005
Table 1. Field water control standards under different irrigation regimes at different rice growth stages.
Irrigation
Regime
Control
Index
Turning
Green
Early
Tillering
Middle
Tillering
Later
Tillering
Jointing and
Booting
Heading and
Flowering
GroutingYellow-Ripe
Controlled irrigation (CI) Upper irrigation threshold30 mm30 mm30 mmDrainage30 mm30 mm0 mmNaturally drying
Lower irrigation threshold00.7θs0.7θs0.8θs0.8θs0.7θs
Flooded irrigation (FI)Upper irrigation threshold30 mm50 mm50 mmDrainage50 mm50 mm50 mmNaturally drying
Lower irrigation threshold10 mm10 mm10 mm10 mm10 mm10 mm
Note: θs refers to the soil-saturated water content mass fraction in the root layer. The soil water content was not less than 0.6θs during the later tillering period.
Table 2. Soil pH and NH4+–N and NO3–N contents at different rice growth stages.
TreatmentsGrowth Stages
TilleringJointing and BootingHeading and FloweringGroutingYellow-Ripe
pHFB06.41 c6.55 d6.08 c6.74 c6.21 c
CB06.43 c6.64 d6.14 c6.86 c6.37 c
CB16.51 c6.82 c6.27 c7.12 b6.73 b
CB26.92 b7.23 b6.62 b7.51 a7.11 a
CB37.34 a7.84 a6.95 a7.64 a7.28 a
NH4+–N
(mg g–1)
FB015.58 d9.79 d7.36 d8.23 d11.38 d
CB017.35 c10.26 d7.15 d9.78 c13.02 c
CB119.21 b12.71 c8.05 c10.37 c14.86 b
CB221.86 a15.13 b9.57 b12.84 b16.78 a
CB320.03 b16.48 a11.79 a14.67 a16.35 a
NO3–N
(mg g–1)
FB07.23 e11.69 c8.13 d5.47 d7.64 d
CB08.48 d12.25 c9.58 c7.30 c10.31 c
CB110.47 c13.92 b11.81 b8.76 b10.85 c
CB213.84 a16.52 a13.76 a10.01 a12.37 b
CB312.04 b16.06 a12.17 b9.58 a14.14 a
Note: Different lowercase letters indicate statistically significant differences between treatments (p < 0.05).
Table 3. Longest length, volume, and fresh weight at different rice growth stages.
TreatmentsGrowth Stages
TilleringJointing and BootingHeading and FloweringGroutingYellow-Ripe
Longest root length
(cm)
FB029.26 d48.84 d52.27 b46.27 c43.93 b
CB032.76 c54.15 c53.40 b50.46 b45.50 b
CB140.85 a61.56 a59.82 a53.81 a49.56 a
CB237.88 b63.15 a61.06 a54.78 a51.80 a
CB336.07 b58.82 b58.45 a54.80 a52.01 a
Root volume
(cm3 hill–1)
FB034.23 d53.79 d97.82 c80.95 c76.72 b
CB042.27 c63.41 c110.25 b89.16 b81.54 b
CB162.45 a79.01 a115.99 b91.02 b83.81 b
CB258.84 a83.91 a127.05 a99.71 a93.22 a
CB348.22 b70.81 b105.58 bc102.24 a94.18 a
Root fresh weight
(g hill–1)
FB028.12 d40.51 d62.36 c56.05 c52.35 c
CB033.43 c45.48 c67.98 b63.09 b57.85 b
CB151.37 a50.47 b70.82 b65.31 b63.08 a
CB247.19 ab58.12 a75.49 a70.91 a65.53 a
CB337.47 b51.84 b68.23 b70.18 a66.36 a
Note: Different lowercase letters indicate statistically significant differences between treatments (p < 0.05).
Table 4. Amount of 15N-fertilizer and soil nitrogen absorbed by rice roots at different rice growth stages (kg ha–1).
TreatmentsTilleringJointing and BootingHeading and FloweringGroutingYellow-Ripe
15N-FertilizerSoil Nitrogen15N-FertilizerSoil Nitrogen15N-FertilizerSoil Nitrogen15N-FertilizerSoil Nitrogen15N-FertilizerSoil Nitrogen
FB04.28 e30.18 b11.47 d52.75 c9.42 d35.06 d3.63 d23.79 c1.92 a14.22 a
DB04.74 d30.01 b12.14 c57.44 bc10.11 c39.62 c4.14 c26.12 b1.68 b11.78 b
DB15.12 c31.44 b12.95 b59.29 b10.63 c40.69 c4.57 c 28.75 ab1.52 bc8.99 d
DB26.21 a33.43 a16.53 a65.29 a13.44 a47.04 a5.32 b30.21 a1.33 c8.42 d
DB35.65 b31.22 b14.12 b60.13 b12.13 b44.43 b6.05 a30.72 a2.21 a10.41 c
Note: Different lowercase letters indicate statistically significant differences between treatments (p < 0.05).
Table 5. Correlation coefficients between nitrogen utilization and rice root morphological and physiological characteristics.
Nitrogen UtilizationLongest RLRVRFWRoot–Shoot RatioRoot Bleeding IntensityRoot Active Absorption AreaRA
15N-fertilizer0.604 **0.2900.1550.1870.864 **0.411 *0.866 **
Soil nitrogen0.458 *0.1330.2510.3090.885 **0.2150.806 **
Note: *: p < 0.05; **: p < 0.01.
Table 6. Yield and nitrogen use efficiency of plants under different treatments.
TreatmentYield
(kg ha–1)
NUE
(%)
NAE
(kg kg–1)
NPFP
(kg kg–1)
FB08189.67 c27.93 d23.68 c74.45 c
CB08324.15 c29.83 c24.36 c75.67 c
CB18608.74 b31.63 c26.56 b78.26 b
CB29536.50 a38.94 a29.47 a86.70 a
CB38807.11 b36.51 b28.18 a80.06 b
Note: Different lowercase letters indicate statistically significant differences between treatments (p < 0.05).
Disclaimer/Publisher’s Note: The statements, opinions and data contained in all publications are solely those of the individual author(s) and contributor(s) and not of MDPI and/or the editor(s). MDPI and/or the editor(s) disclaim responsibility for any injury to people or property resulting from any ideas, methods, instructions or products referred to in the content.

