Article

Imbalance Water Deficit Improves the Seed Yield and Quality of Soybean

1
Key Laboratory of Crop Ecophysiology and Farming System in Southwest, Ministry of Agriculture, Chengdu 611130, China
2
Institute of Ecological Agriculture, Sichuan Agricultural University, Chengdu 611130, China
*
Authors to whom correspondence should be addressed.
These authors contributed equally to this work.
Agronomy 2018, 8(9), 168; https://doi.org/10.3390/agronomy8090168
Submission received: 24 July 2018 / Revised: 24 August 2018 / Accepted: 27 August 2018 / Published: 30 August 2018

Abstract

:
Water imbalance condition (WIC) in a maize-soybean relay intercropping system is the main abiotic stress limiting biomass production and seed yield and, consequently, seed-quality. This experiment was started to study the effects of WIC on soybean, in which two soybean genotypes ND12 and C103 were grown in pots with roots split equally between two soil column and six WIC treatments (%) T1 (100), T2, (100:50), T3 (100:20), T4 (50:50), T5 (50:20), and T6 (20:20) field capacity on both sides of soybean roots were used. Results showed that both genotypes responded significantly to WIC treatments for all the parameters; however, the level of response differed between genotypes. Maximum osmoprotectants (except proline), biomass, yield and yield-related traits and superior seed quality were observed with ND12. Among WIC treatments, T2 and T3 produced 94% and 85%, and 93% and 81% of T1 biomass and yield, respectively. Similarly, treatments T2 and T3 also improved the oil quality by maintaining the content of unsaturated fatty acids and isoflavone content, while opposite trends were observed for protein content. Overall, moderate water reduction (T2 and T3) can improve soybean seed-quality and by selecting drought-resistant genotypes we can increase the soybean yield under intercropping systems.

1. Introduction

Soybean is a highly consumable oilseed and protein crop that is mainly intercropped with maize in the south-west of China [1]. The maize-soybean strip intercropping system has minimum soil water losses with high water productivity [2]. Similarly, these strip intercropping systems have the potential to resolve food crises in developing countries. However, maize plants in maize-soybean strip intercropping conditions change the field microenvironment of soybean (especially light and water conditions) which negatively affects the plant growth and development of soybean under this system [3,4]. Previously, scientists have observed uneven water utilization and distribution (Figure 1) between maize and soybean rows in maize-soybean intercropping systems [3]. Specifically, soil volumetric water content and soil evaporation in the maize–soybean relay intercropping system showed the decreasing trends in the following order: maize row < maize-to-soybean row < soybean row [2,5]. This phenomenon produces the imbalanced water deficit conditions which may activate the various drought stress mechanisms in soybean plants under a maize–soybean intercropping system (Figure 1). These imbalanced water or drought conditions significantly reduce the seed yield and quality of oilseed crops.
Environmental factors such as drought significantly affected the seed yield and seed metabolites which in turn decrease the yield and quality of soybean plants [6]. In past reports, researchers have confirmed the reductions in secondary metabolites of soybeans under water deficit conditions. Recently, a study revealed that mild water stress prior to the flowering stage accelerated the accumulation of isoflavone content, but water deficit conditions imposed at the R6 stage of soybean considerably reduced the total isoflavone content [7]. In another study, it was found that prolonged drought conditions during the seed development stages significantly decreased isoflavone content in seeds [8]. Moreover, Lozovaya et al. concluded that optimum soil moisture availability at the start of seed formation favors seed formation while slight water reduction at R6 improved seed quality by increasing daidzein, genistein and total isoflavones (except glycitein) [9].
In addition, the composition of fatty acids in soybean is also influenced by irrigation regimes and cultivar differences. An experiment conducted by Bellaloui et al., investigated the effects of environment and genetics on soybean fatty acids. They reported that water stress altered the seed oil composition by increasing oleic acid and decreasing linoleic and linolenic acid concentrations [10]. However, the decrease or increase depends on drought severity [11]. Lee et al. conducted a field experiment to investigate the irrigation effects on elevated oleic acid and reduced linolenic acid cultivars. They did not find significant effects of irrigation on the unsaturated fatty acid concentration of soybean. They further noted the increment of oleic acid and decrease of linolenic acid with high oleic acid and low linolenic acid cultivars, which suggests the importance of adequate irrigation to maintain optimum level of fatty acid [12].
Physio-morphological responses of soybean plant under water deficit conditions have also been considered. A number of studies have shown the significant reduction in stomatal conduction, photosynthetic rate, number of nodes, number of seeds and eventually seed yield (24~50%) under water deficit conditions [13,14,15]. Therefore, great emphasis is placed on crop management with an aim to make plants more efficient in water use and enhance yield under drought conditions. However, the comprehensive understanding of physiology, morphology, biosynthesis of primary and secondary metabolites, and accumulation is still unclear because they are highly influenced by environmental factors under changing conditions especially intercropping systems.
Earlier studies revealed the relation of chemical constituents and yield under water deficit conditions produced naturally or artificially in the agricultural field. Therefore, the aims of this study were to (1) investigate the effects of water imbalance condition on biomass accumulation, yield and yield components; and (2) assess the impact of water imbalance condition on the seed quality parameters of soybean.

2. Materials and Methods

2.1. Plant Material and Experimental Design

Two soybean genotypes Nandou-12 (ND12, drought resistant) and C-103 (C103, drought susceptible) were grown from seeds under laboratory conditions at Sichuan Agricultural University, Chengdu campus, China. These soybean genotypes were screened out on the basis of our pre-experiment. The experiment was designed as a randomized complete block with six treatments and three biological replicates.

2.2. Growth Conditions and Treatments

Seeds were first sterilized with 0.5% sodium hypochlorite solution for 15 min, and then germinated in the dark for five days in compost trays. Seedlings were cultured hydroponically in basins containing half strength Hoagland nutrient solution in a growth chamber characterized by a 12 h dark/12 h light photoperiod, 28 °C day and 25 °C night temperature and approximately 60% relative humidity. Plants were allowed to grow well under normal conditions. One month after the seed germination, healthy soybean plants were selected that were uniform in height. One plant per pot was planted in soil boxes with separate chambers. The root of each plant was equally divided into two parts in the soil boxes (V4 stage) (Figure 1). The pots were covered with aluminum foil, in order to preserve moisture. Normal irrigation was then applied to plants until the onset of the R4 stage.
At the R4 stage, the combinations of six different treatments were imposed: 100% of the field capacity on both sides of roots (T1 = 100%A:100%B) in which both sides of the root system of each plant contained soil moisture of about 30%; 100%:50% field capacity on both sides of the root (T2 = 100%A:50%B) in which both sides of the root system of each plant contained soil moisture of about 30% and 20% respectively; 100%:20% field capacity on both sides of the root (T3 = 100%A:20%B) in which both sides of the root system of each plant contained soil moisture of about 30% and 10% respectively; 50%:50% field capacity on both sides of root (T4 = 50%A:50%B) in which both sides of the root system of each plant contained soil moisture of about 20%; 50%:20% field capacity on both sides of the root (T5 = 50%A:20%B) in which both sides of the root system of each plant contained soil moisture of about 20% and 10% respectively; and 20% field capacity on both sides of root (T6 = 20%A:20%B) in which both sides of the root system of each plant contained soil moisture of about 9% to 10%. The experimental period duration was 32 days. Plants were harvested at maturity and seeds were air-dried for further chemical analysis.

2.3. Measurement of Agronomic Characters

Soil moisture (in volumetric water content, VWC) was measured every three to five days with the help of TRIME-PICO (IMKO, Ettlingen, Germany). Each pot was considered for reading at the same time of day. The morphological traits such as plant heights (cm), stem diameter (mm), number of node per plant, number of branches per plant, and pod length (cm) were measured at harvest by sampling each plant. The first internode was used to measure stem diameter using a vernier caliper. Plant height and pod length were measure with the help of a scale. Number of nodes per plant and number of branches per plant were counted at harvest. The soybean yield (g) and yield-related components such as 100 seed weight (g), number of grains per plant, number of pods per plant and number of interfile pods per plant were measured at harvest on each plant per treatment. Soybean seeds were harvested by hand at maturity stage and air-dried. Yield and 100 seed weight of each plant were noted individually using an electrical balance. All harvested plants were used to measure total biomass accumulation (g) and partitioning at maturity. Leave, stem, pod and seed were separated from each plant and constant weight was recorded using an electrical balance.

2.4. Quantification of Osmoprotectants in Soybean Leaves

2.4.1. Proline

A previously published method was followed to measure free proline from soybean leaves [16]. Leaves were collected at R5 stage and immediately stored at −80 °C. Freeze dried leaf samples (0.20 g) were extracted with 5 mL 3% sulfosalicylic acid. Supernant (2 mL) was reacted with 2.0 mL glacial acid and 3 mL acid ninhydrin, and heated in boiling water for 40 min. Samples were then mixed with 5 mL toluene to extract, and vortex. Supernant was taken to read absorbance at 520 nm using spectrophotometer (Mapada-V-1100D).

2.4.2. Sucrose and Soluble Polysaccharide

Leaves were collected at the R5 stage and immediately stored at −80 °C. Leaves were freeze dried to make fine powder. Leaves (0.1 g) were mixed with 10 mL of 80% ethanol. Samples were incubated at 80 °C for 30 min and then centrifuged at 3000 rpm for 15 min. The extraction was carried out twice more as mentioned above.
To measure sucrose, 0.9 mL extracted solution was taken in 20 mL test tubes and 0.1 mL of 2 mol/L NaOH was added and heated for 10 min. Samples were cooled down at room temperature for 15 min. 1.0 mL 0.1% resorcinol and 3.0 mL 10 mol/L HCL were added in the test tubes. Samples were incubated at 80 °C in a water bath for 30 min. Supernant was taken to read absorbance at 500 nm using a spectrophotometer (Mapada-V-1100D).
To measure soluble polysaccharide, 1.0 mL extracted solution was taken in 20 mL test tubes and 4 mL of 0.2% sulfate anthrone reagent was added and heated for 15 min. Samples were cooled down at room temperature for 15 min. Supernant was taken to read absorbance at 620 nm using a spectrophotometer (Mapada-V-1100D). A standard curve was used to estimate the concentrations by following the previously described method [17].

2.4.3. Starch

To measure starch, 0.1 g of leaves was homogenized with 2.0 mL of 9.2 mol/L HClO4. After 10 min, 6.0 mL water was added and centrifuged at 3000 rpm for 20 min. Supernatants were collected and residues were reacted again with 2.0 mL of 4.6 mol/L HClO4. Then, 6.0 mL water was added and centrifuged at 3000 rpm for 20 min. Supernatants were taken and combined. 1.0 mL extracted solution was taken in 20 mL test tubes and 4.0 mL of 0.2% sulfate anthrone reagent was added and heated for 15 min. Samples were cooled down to room temperature for 15 min. Supernant was taken to read absorbance at 620 nm using spectrophotometer (Mapada-V-1100D). A standard curve was used to estimate total water soluble sugar concentration by following the previously described method [17].

2.5. Quantification of Qualities in Soybean Seeds

2.5.1. Protein

Soybean seeds were air dried and ground into fine power. Approximately 0.25 g was taken to measure total protein content using the automated instrument Dumas (Elementar, Rapid N Exceed, Langenselbold, Germany).

2.5.2. Isoflavones

Harvested soybean seeds were ground into fine powder for isoflavone extraction. Samples were dried in a vacuum oven at 40 °C for 24 h and cool down at room temperature. Isoflavone extraction was done by previously published protocol with small modification [18]. Approximately 25.0 mg of each replicate was mixed with 2.5 mL MeOH/H2O (80/20 v/v) solution and subjected to ultrasonic extraction (40 kHz) for 3 h with an ice water-bath. Samples were centrifuged at 10,000 g for 10 min and supernatant was filtered using a syringe filter (0.22 µm). Samples were subjected to an Agilent 1260-series high-performance liquid chromatography (HPLC) system equipped with a mass spectrometric detector (Quadrupole LC/MS 6120, Agilent, USA) to quantified isoflavones by external standardization.
The chromatographic conditions were as follows: mobile phase was comprised with solvent A (acetonitrile) and solvent B (0.1% acetic acid aqueous solution). A sample was injected to waters X select HSS T3 (2.1 mm × 100 mm, 2.5 mm) chromatographic column (0.2 µL). The temperature of column was 30 °C. Linear gradient: 15–25% of eluent A (0–16 min), 25–40% of eluent A (16–24 min), and 40–15% eluent A (24–24.1 min) and 15–85% of isocratic conditions (24.1–30 min). Positive ion mode was used for mass spectral conditions ESI and nitrogen was used as the collision gas. The desolvation gas flow rate was 10 L per minute. The desolvation temperature and pressure, and capillary voltage, were 350 °C, 35 psig, 3.8 kV, respectively. Selected ion monitoring (SIM) mode was used in the mass spectral acquisition. [M + H]+ ions were observed at m/z 417(DG), 447(GLG), 433(GEG), 503(MD), 533(MGL), 459(AD), 489(AGL), 519(MG), 255(DE), 475(AG), 285(GLE), and 271(GE).
Twelve standard isoflavones were purchased from Wako Pure Chemical Industries Co., Ltd. (Osaka, Japan). HPLC-grade acetonitrile was obtained from Thermo Fisher Scientific Inc. (Waltham, MA, USA). Ultrapure water was used to prepare all aqueous solutions with the help of Milli-Q system (18.2 MX; Millipore, Bedford, MA, USA). Samples retention time was compared to identified isoflavones and mass spectra to those of standard compounds.

2.5.3. Fatty Acids

Air-dried soybean seeds were ground into fine powder and stored at −80 °C until fatty acid analysis. Three experimental replicates were produced for each biological replicate. Standard mixtures of 37 fatty acid methyl esters which include common fatty acids such as palmitic acid (PA), stearic acid (SA), linoleic acid (LA), oleic acid (OA) and α-linolenic acid (ALA) were purchased from Nu-chek-prep, Inc. (USA). The previously published method was used to extract soybean fatty acids [19]. The ground soybean samples (50.0 mg) were ultrasonic extracted (40 kHz) for 1 h by adding 1.5 mL n-hexane. Then samples were centrifuged at 10,000 g, and 4 °C for 5 min. A solution of 1.0 mL was transferred to another centrifuge tube and 0.8 mL methanolic potassium hydroxide solution (0.4 M) was mixed and subjected to a vortex. Samples were kept at room temperature for 1 h after 30 min ultrasonic. Samples were again centrifuged at 10,000 g, and 4 °C for 5 min. Supernatants were transferred to volumetric flask (5.0 mL) through a syringe filter (0.45 µm), and directly injected into the gas chromatography mass spectrometry system (GC-MS).
Shimadzu GCMS-QP2010 technology, equipped with an auto sampler was used for fatty acids metabolite profiling. A sample of 1.0 µL was applied to capillary column (Rtx-5Ms, 30 m × 0.25 mm × 0.25 µm) and chromatographic conditions were used as follows; initial, final and injection temperature was set at 130 °C, 230 °C and 270 °C, respectively. The oven temperature was first increased from 130 to 170 °C at the heating rate of 6.5 °C min−1, and was maintained for 6 min. Then, the temperature was increased to 215 °C at a rate of 3 °C min−1 and maintained for 13 min. Again, the temperature was increased to 230 °C at a rate of 3 °C min−1, and maintained for a further 10 min. The flow rate of helium gas was 1 mL min−1 which was used as carrier gas. The ionization potential of the mass-selective detector was 70 eV, and the mass spectrometry was operated at a 270 °C. The splitting ratio was 30:1, the selected ion monitoring (SIM) mode was m/z 55, 67, 74, and 79, and the full-scan mode was from m/z 50 to 400. The samples were identified by comparing the retention times and mass spectra of with 37-component fatty acid methyl esters standard mixtures. The standard curve method was used as a quantitative approach to construct the calibration plots of the analytic standard peak-area ratios versus standard concentrations.

2.6. Statistical Analyses

Data analyses were performed using the Statistics software (version, 8.1. Statistix, Tallahassee, FL, USA). An analysis of variance (ANOVA) technique was used to verify the overall significance of the data. The least significance difference (LSD) test was employed to compare the means at 5% probability level. Microsoft office 2010 was used to draw figures using standard error (±SE).

3. Results

3.1. Water Consumption and Soil Water Contents

The amount of water applied to all irrigation treatments was calculated and compared. The maximum and minimum amount of water was applied in treatments T1 and T6, respectively. In fact the crop production under T1 and T2 was fairly comparable with both soybean genotypes. However, less water was applied in treatment T2. Water was applied when soil water contents reached between 10% and 15% of volume. Limited water levels decreased the soil moisture content of both soybean genotypes as shown in Figure 2. After two hours of water application, soil water contents showed significantly higher values (About 30%) in sides with 100% field capacity. Less water application had an effect on the soil water contents of sides with 50% field capacity, and about 15% to 24% of soil water contents were observed. However, soil water contents were maintained between 10% and 14% in other sides with 20% field capacity (Figure 3).

3.2. Effect of Different Split-Root Water Imbalance Treatments on Morphological Characters of Soybean Genotypes

In our present experiment, the morphological parameters; plant height, stem diameter, number of node per plant, number of branch per plant, and pod length were significantly (p < 0.05) affected by soybean genotypes and different split root-zone irrigation treatments. Differences among soybean genotypes in plant height, stem diameter, number of node per plant and number of branch per plant, at maturity, were driven by the drought-susceptible genotype C103, which had maximum (86.11 cm), (6.39 mm), (16.66) and (7.22), respectively, in comparison to the drought-resistant genotype ND12 (Table 1). The highest pod length (4.59 cm) was noted in ND12, whereas minimum pod length (3.96 cm) was recorded for C103. Different split root-zone irrigation treatments significantly changed the morphological parameters of the soybean genotypes. The maximum plant height (72.50 cm), stem diameter (6.35 mm), number of node per plant (15.83), number of branch per plant (6.83), and pod length (4.45 cm) were observed under treatment T1, while minimum plant height, stem diameter, number of node per plant, number of branch per plant, and pod length were measured under T6 treatment (T6 = 0%A:0%B) in which both sides of the root system of each plant were contained soil moisture about 9% to 10% (Table 1). Interactive effects of different split root-zone irrigation treatments and soybean genotypes for all the morphological parameters were found to significant.

3.3. Effect of Different Split-Root Water Imbalance Treatments on Yield and Yield Components of Soybean Genotypes

In this study, the different split root-zone irrigation treatments and soybean genotypes showed considerable effects on yield and yield components; 100-seed weight (SW), number of grains per plant (NGP), number of pods per plant (NPP), number of infertile pods per plant (NIPP), and seed yield per plant (SYP). Among all the split root-zone irrigation treatments, full field capacity (T1) had produced the highest SYP (21.22 g), SW (16.80 g), NGP (142.17) and NPP (69.16), while the lowest SYP (10.88 g), SW (14.39 g), NGP (93.50) and NPP (45.16) were observed in treatment T6, and the maximum NIPP was recorded under treatment T6 (Table 2). Furthermore, the highest NGP (129.78), NPP (60.67), and NIPP (4.44), and SW (19.57 g) and SYP (16.88 g) were obtained for soybean genotypes C103 and ND12, respectively. The interactive effect of different split root-zone irrigation treatments and soybean genotypes for yield and yield-related parameters were found to be significant (Table 2).

3.4. Effect of Different Split-Root Water Imbalance Treatments on Biomass Accumulation and Distribution of Soybean Genotypes

In the present study, the different split root-zone irrigation treatments and soybean genotypes showed considerable effects on total biomass accumulation (TB). The maximum (44.57 g·p−1) and minimum (43.99 g·p−1) total biomass accumulation was recorded with the drought-susceptible genotype (C103) and the drought-resistant genotype (ND12) at maturity, respectively (Table 2). Different split root-zone irrigation treatments significantly changed the TB accumulation of soybean genotypes. The maximum TB (54.18 g) was observed under treatment T1, while the minimum TB (34.59 g) was measured under treatment T6. Interactive effects of different split root-zone irrigation treatments and soybean genotypes for TB accumulation were found to be significant.
The split-root water imbalance treatments changed the pattern of biomass partitioning among different plant organs of soybean genotypes (Figure 4). At maturity of the soybean, the maximum allocation of biomass was observed in seeds followed by stems, leaves, and pods. The biomass partitioning in reproductive parts (pod + seed) was decreased from T1 to T6, and the highest biomass accumulation in the pod (5.26 g·p−1) and seed (21.84 g·p−1) were found in the genotype Nandou-12 and C-103 under T1, respectively. The lowest biomass partitioning to the pod (2.85 g·p−1) and seed (9.65 g·p−1) was noticed in T6 treatment with C-103. In addition, treatment T1 followed by T2 substantially increased the allocation of biomass into reproductive parts compared with other treatments (Figure 4; Nandou-12 and C-103). On average, at maturity, pod and seed biomass decreased by 33% and 56% in C-103, and 32% and 42 % in Nandou-12 under T6 in comparison with T1.

3.5. Effect of Different Split-Root Water Imbalance Treatments on Osmoprotectant of Soybean Leaves

The effect of different split root-zone irrigation treatments and soybean genotypes on starch, sucrose, soluble polysaccharide, and proline contents are shown in Figure 5. In our experiment, the mean table for proline contents exhibited the maximum proline contents measured for genotype ND12 (1657.9 µg·g−1), while minimum (1248.6 µg·g−1) proline contents were determined with C103. Different split root-zone irrigation treatments significantly affected the proline contents of soybean genotypes. The proline contents increased as the water stress increased from T1 to T6. The highest and lowest proline contents were 2459.3 µg·g−1 and 866.4 µg·g−1 in T6 and T1, respectively. Meanwhile, the opposite trend was noticed for starch, sucrose and soluble polysaccharide contents from T1 to T6. The maximum starch (0.1584 mg·g−1), sucrose (0.0132 mg·g−1) and soluble polysaccharide contents (0.0395 mg·g−1) were measured in T1 and the minimum starch (0.1014 mg·g−1), sucrose (0.0072 mg·g−1) and soluble polysaccharide contents (0.0331 mg·g−1) were noted under T6 treatment. Among soybean genotypes, the highest concentration of starch (0.0.1395 mg·g−1) and sucrose (0.0118 mg·g−1) were noted for ND12, whereas the highest concentration of soluble polysaccharide contents (0.0372 mg·g−1) was observed in genotype C103. The interactive effect of different split root-zone irrigation treatments and soybean genotypes for proline contents and total soluble sugar contents were found to be significant (Figure 5).

3.6. Effect of Different Split-Root Water Imbalance Treatments on Seed Protein Contents of Soybean Genotypes

The determination of seed protein content in soybean seeds is the important component to obtain a higher market value of a soybean crop. In the present study, seed protein contents of soybean genotypes significantly changed with different split root-zone irrigation treatments. The maximum (44.57%) and minimum (38.27%) seed protein content in soybean seed were noted in the drought-resistant genotype (ND12) and drought susceptible genotype (C103), respectively. Furthermore, decrease in water content significantly increased the seed protein content of soybean seeds. The highest protein content (44.42%) in seeds was measured under treatment T6, while the lowest protein content (39.69%) was determined in treatment T1. The interactive effect of different split root-zone irrigation treatments and soybean genotypes for seed protein contents was found to be significant (Figure 6A).

3.7. Effect of Different Split-Root Water Imbalance Treatments on Isoflavone of Soybean Genotypes

Variations in isoflavone concentration of the different soybean varieties in response to different drought treatments are shown in Figure 6. In this experiment, soybean genotypes and split-root drought treatments showed the significant differences (p < 0.05) for isoflavone concentrations in seed. In this experiment, results exhibited that water imbalance with moderate reduction in water availability from T1 to T3 did not reduce the total isoflavone concentrations significantly in soybean seeds. The highest concentrations of malonyl glycoside (3.91 mg·g−1) and acetyle glycoside (0.00829 mg·g−1) were measured in treatment T1 which were statically at par with T2 and T3 treatments. Similarly, the highest concentrations of aglycone (0.026 mg·g−1) and β-glucoside (0.99 mg·g−1) were measured in treatment T3 which were statically at par with the T2 and T1 treatments.
However, excessive water shortage conditions significantly reduced the isoflavone concentrations in seed, and the lowest concentrations of aglycone (0.013 mg·g−1), β-glucoside (0.70 mg·g−1), malonyl glycoside (2.54 mg·g−1), and acetyle glycoside (0.00528 mg·g−1) were determined under the T6 treatment. In soybean genotypes, the maximum and minimum (0.022 mg·g−1), (1.05 mg·g−1), (4.29 mg·g−1), and (0.00914 mg·g−1), and (0.019 mg·g−1), (0.75 mg·g−1), (2.72 mg·g−1), and (0.00571 mg·g−1) values of aglycone, β-glucoside, malonyl glycoside, and acetyle glycoside were observed in the drought-susceptible genotype (C103) and drought-resistant genotype (ND12), respectively. The interactive effect of drought levels and soybean genotypes for aglycone, β-glucoside, malonyl glycoside, and acetyle glycoside were found to be significant. Overall, relative to treatment T1, the aglycone, β-glucoside, malonyl glycoside, and acetyle glycoside were decreased by 77%, 39%, 54%, and 57% under the T6 treatment, indicating that quality indices of soybean seed are directly linked with adequate water availability and severe water stress conditions considerably reduced the isoflavone concentrations in the seed.

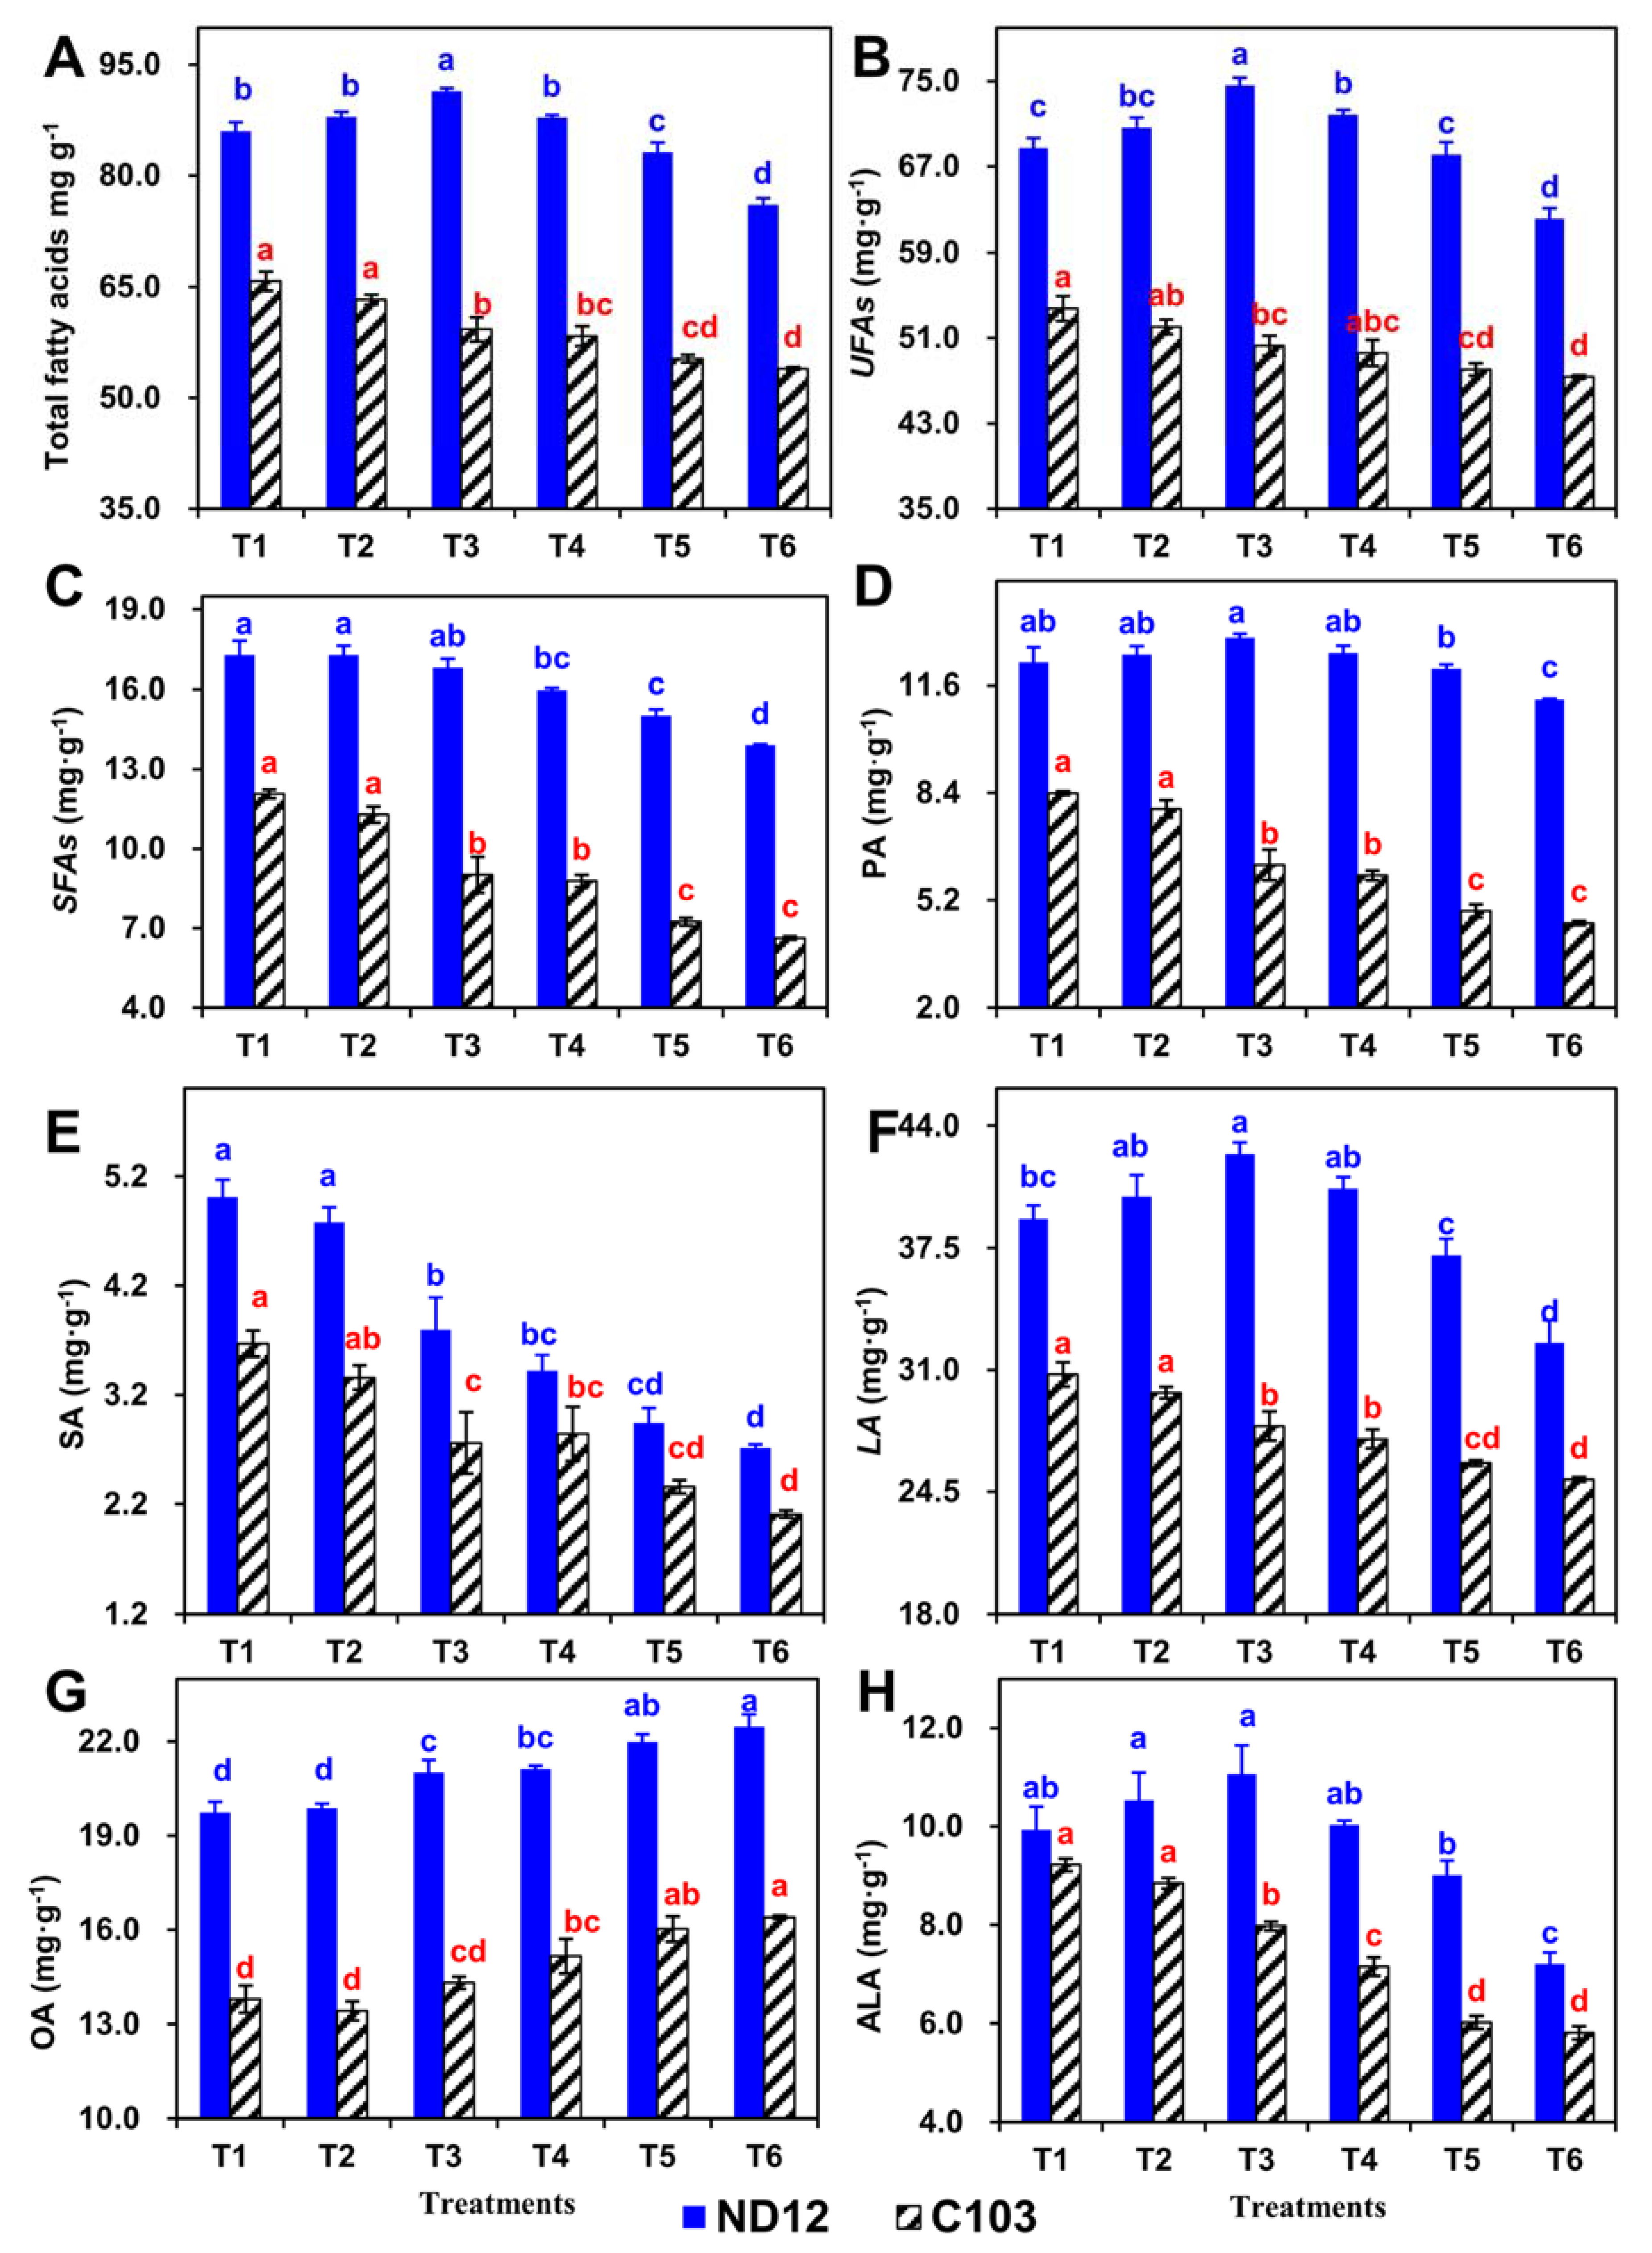
3.8. Effect of Different Split-Root Water Imbalance Treatments on Fatty Acids of Soybean Genotypes

We determined five important fatty acids including three unsaturated fatty acids [oleic acid (OA), linoleic acid (LA), and a-linolenic acid (ALA)] and two saturated fatty acids [palmitic acid (PA) and stearic acid (SA)] to evaluate the effects of different split root-zone irrigation treatments on soybean genotypes. In this experiment, all the split root-zone irrigation treatments significantly (p < 0.05) altered the fatty acids concentrations in the seed of soybean genotypes. The highest concentrations of PA (12.26 mg·g−1), SA (3.77 mg·g−1), LA (38.68 mg·g−1), OA (21.03 mg·g−1) and ALA (9.62 mg·g−1) were determined with drought resistant genotype ND12, whereas lowest concentrations of PA (6.32 mg·g−1), SA (2.84 mg·g−1), LA (27.83 mg·g−1), OA (14.18 mg·g−1) and ALA (7.50 mg·g−1) were observed in drought susceptible genotype C103.
Among split root-zone irrigation treatments, the highest (75.91 mg·g−1) total fatty acids were measured with treatment T1 which was statically at par with T2 and T3 treatments. The maximum concentrations of PA (10.33 mg·g−1), SA (4.34 mg·g−1) and ALA (9.68 mg·g−1), and LA (35.28 mg·g−1) were noticed under treatment T1 and T3, respectively, while minimum concentrations of PA (7.85 mg·g−1), SA (2.40 mg·g−1), ALA (6.50 mg·g−1) and LA (28.79 mg·g−1) were measured in T6. Importantly, the highest accumulation of OA (19.43 mg·g−1) was observed in treatments T6 (water stressed-conditions) and lowest accumulation of OA (16.64 mg·g−1) was recorded under T2 (optimum water conditions). The interactive effect of different split root-zone irrigation treatments and soybean genotypes for OA, LA, ALA, PA, and SA were found to be significant (Figure 7).

4. Discussion

4.1. Effect of Split-Root Water Imbalance Treatments on Agro-Morphological Traits of Soybean

In this experiment, the results provide an initial controlled environment assessment of soybean plant response to split-root water imbalance treatments. As a major field crop, the agro-morphological traits of soybean are significantly affected by drought stress, mainly when it occurs during the reproductive stage [20]. The yield loss is generally associated with an increased rate of flower and pod abortion [21]. In this study, our results regarding the agro-morphological traits of soybean confirm previous studies [22] in that most of the traits were affected by water deficit. However, it is reported that genotypes and duration of stress also determined the severity of the effects of a water deficit [23,24]. Growth traits such as plant height, stem diameter, number of nodes per plant and number of branches per plant did not show significant results. A possible reason could be the duration of the split-root water imbalance treatments. These results were similar to earlier findings that drought applications at the flowering stage could not affect plant height [25].
Split-root water imbalances during reproductive stage had a significant effect on the pod length. Pod length was reduced 15% in the drought-resistant genotype (ND12) and 16% in the drought-susceptible genotype (C103) under treatment T6. These results are consistent with a previous study obtained by [26]. In addition, yield and yield-related characteristics also showed significant results in this study. Yield per plant was assessed in terms of the total seeds produced on one plant at maturity stage. Results of this study showed that the yield per plant was found to be similar in ND12 under the T1 and T2 treatments. This observation is mainly important in attaining higher water productivity in crop production. In fact, the amount of water that was used in treatment T2 was 34% less than the treatment T1. This agrees with Sarai Tabrizi et al., (2012) who optimized the soybean crop production in a semi-arid region using partial root-drying techniques [27].
In addition, yield per plant was reduced 74% in the drought-resistant genotype (ND12) and 126% in the drought-susceptible genotype (C103) under treatment T6. These results are consistent with those of [21,28]. The reduction in yield per plant is mainly due to a decreased number of infertile pods, number of grains, 100 seed weight and number of pods per plant in this study. The result of an early experiment conducted by Heatherly, (1993) also showed that the thousand seed weight is positively associated with seed yield [29]. Split-root water imbalance treatments significantly decreased the number of infertile pods, number of grains and number of pods per plant. The decrease in yield and yield related characteristics in soybean varieties due to water shortage has also been documented by other researchers [30,31].

4.2. Effect of Split-Root Drought on Soybean Biomass Accumulation and Distribution

The amount of plant biomass has a direct relationship with the amount of radiation intercepted by the plant canopy and partitioning of the photosynthetic product [32]. It is directly linked with the duration of the crop growth. This study demonstrated that split-root drought stress occurring at R4 stage resulted in biomass decrease in soybean. A possible reason could be accelerated leaf senescence that is responsible for reduced radiation interception. The total biomass of treatment T6 was reduced 66% for C-103 and 47% for ND-12 compared with treatment T1. Our results obtained here, are consistent with Jamieson et al. (1995) and Grinnan et al. (2013) who studied the reduction in biomass production under drought caused by a decreased amount of radiation intercepted [33,34]. Other studies also confirm the decrease in biomass under partial root-drying irrigation [35].
Drought exerts strong impacts on biomass allocation. Earlier studies suggested that drought stress generally decreased the leaf mass fraction and stem mass fraction [36]. Biomass accumulation and partitioning is different among different plant organs. Usually it takes place towards the developing seeds which is a key physiological factor in drought adaptation. In this study, the maximum allocation of biomass was observed in seeds followed by stems, leaves, and pods at the maturity stage of soybean. It shows that both genotypes had better ability to mobilize photosynthates to seeds. Our results are similar with a previous study where partial root drying significantly increased biomass allocation to roots and tubers while decreasing it into leaves and stems [37].

4.3. Effect of Split-Root Water Imbalance Treatments on Soybean Osmoprotectant

Starch and sucrose are considered principal end products of photosynthesis in soybean leaves. Starch is known to be major storage form of carbohydrate [38]. Soybean leaves usually contain a lower amount of sucrose concentration because an inherently high activity of acid invertase present in the vacuole rapidly hydrolyze the sucrose [39]. Drought-stressed plants have been shown to accumulate less starch, sucrose and soluble polysaccharide in leaves that contribute to the host plant tolerance under drought conditions [40]. In this study, as the water availability decreased, water imbalance induced by split-root drought treatments significantly reduced the concentration of starch, sucrose and soluble polysaccharide in the leaves of both soybean genotypes at the R5 stage. These results are in context with earlier published studies in soybean [40] and other plants [41]. This reduction might be attributed to low photosynthetic rates or high rates of starch, sucrose and soluble polysaccharide degradations [42].
In addition, the drought-resistant genotype ND12 was less strained till treatment T3 whereas, significant difference appeared early in drought susceptible genotype C103. Non-significant accumulation of starch, sucrose and soluble polysaccharide indicates that the ND12 successfully avoided the imbalanced water deficit. Our results are similar to those previously reported where drought-resistance genotypes showed high resistance against water deficit conditions [43]. Furthermore, and more importantly, treatment T3 and T4 (with same amounts of water) showed that ND12 decreased the starch, sucrose and soluble polysaccharide contents (the same results for metabolism) in T4. This shows that split-root soybean exposed to 100% and 0% field capacity (T3) fulfilled the need by absorbing soil moisture from water applied side. This fits the predictions of risk sensitivity theory as reported in an early study [44]. In addition, the split-root approach is a useful tool for the discrimination of local and systemic regulation mechanisms in plants [45]. In our study, this regulation seems local, but the mechanism at play is still not clear. Our results are in context with the previous report where regulation is mostly local under drought and heavy metal stress [45].
Accumulation of free proline was observed by decreasing moisture contents in split-root water imbalance treatments. Results regarding free proline are in line with previous reports, where high concentration of free proline played its role to adjust intercellular osmotic potential [43]. Reduction in protein biosynthesis could be a possible reason for increased free proline in plants [46]. In fact, the free proline also accumulated less in C103 (drought susceptible) than ND12 (drought resistant). Results support the above hypothesis that the more accumulation of free proline in C103 than ND12 showed the strong osmotic mechanism to maintain a favorable potential gradient for water retention [47].

4.4. Soybean Metabolism and Split-Root Water Imbalance Treatments

Soybean is a highly consumable oilseed and protein crop which contains high contents of phytochemicals. Phytochemicals are considered beneficial to human health, and have a variety of physiological activities [6]. Earlier studies suggested that these phytochemicals are highly affected by drought stress. The increase in total protein and decrease in seed isoflavones and fatty acids has been reported in soybean cultivars growing in non-irrigated versus irrigated fields [7,10,48]. However, the split-root approach has been shown to increase plant tolerance to water deficit but the exact mechanisms involved are still a matter of debate. Our experiment explored the effect of imbalance water deficit induced by split-root on the chemical constitutes such as protein, fatty acids and isoflavones. Total protein showed significant differences between soybean genotypes and with the increase in drought level, the rate of protein accumulation also increased. Similarly, in an earlier study, plants have been shown to accumulate protein under drought stress [49]. This could be a response of soybeans to drought conditions by changing the source–sink relationship [50]. This result is in agreement with earlier reports, where drought and genotypes showed significant difference in protein [6,49].
Isoflavone is a group of antioxidant compositions in soybean which participates in a series of important physiological processes. Isoflavone biosynthesis and accumulation depends on multiple factors such as genotypes, growth conditions and irrigation levels [48,51]. In the present study, isoflavone concentrations showed differences in both soybean genotypes. Relatively higher concentrations were detected in C103, which showed the susceptibility of isoflavone metabolism to imbalance water deficit. Susceptible plants have been shown to accumulate high isoflavones. This result is in line with earlier studies in soybean [52]. In addition, the groups of isoflavone and total isoflavone contents showed significant reduction with an increased water deficit level in C103.
Interestingly, imbalanced water deficit with well soil moisture induced slight increase in the aglycone, β-Glucoside, malonyl glycosides and acetyl glycosides production. However, split-root imbalanced water deficit with less soil moisture decreased the isoflavone contents in ND12. Possible reasons could be an initiation of water stress signals and greater resistance potential of this genotype. The result is similar to previous reports, where small changes in soil moisture did not affect the isoflavones concentration but severe water deficit decreased the isoflavones concentration in soybean [53]. Furthermore, the isoflavones are considered undesirable components of soy-based food products because they are the primary cause of astringent aftertastes [54]; however, the soybean glucosides (glycosides, malonyl glucosides and acetyl glycosides) contribute less astringent aftertastes than aglycones [55]. In this study, the contents of glucosides were significantly higher with imbalanced water deficits having well soil moisture that produce less undesirable aftertastes. However, the clear mechanisms underlying the effects of imbalanced water deficit on isoflavone accumulation are not well understood and need further investigation.
Water deficit alters soy fatty acid composition which affects oil stability and composition, especially during seed developmental stages (R5–R6) [10]. In the present study, imbalanced water deficit altered the fatty acids composition in both soybean genotypes. The concentrations of total fatty acids and unsaturated fatty acids in ND12 were significantly higher than those observed in C103 that reflect genetic differences. The difference in fatty acids concentrations may be due to the limited availability of sugars in the soybean plants and translocation from leaves to seeds. Another possible reason could be a split-root imbalance water deficit altering the rate of fatty acids’ accumulation by affecting the desaturase fatty acids enzymes [10]. This result is in line with earlier studies, where drought significantly altered the fatty acids composition in soybean [56,57].
It is widely accepted that UFAs, particularly OA-rich foods, have many beneficial health effects on humans [58]. Earlier studies found that ALA and other UFAs in soybeans are important compounds that prevent cardiovascular disease and cancer in humans [59]. In addition, by selecting the appropriate and area-specific genotype we can improve crop yield and quality under rainfed conditions [60]. Based on the results of this study, imbalanced water deficit with moderate soil moisture induced a slight increase in the total fatty acids and UFA concentrations in ND12 (drought resistant). Water stress signal produced in soybean roots may induced these changes; however, the clear mechanisms are not well understood and need further investigation.

5. Conclusions

In this study, water imbalance induced by split-root treatments exhibited a negative effect on growth, biomass accumulation, yield and yield components of soybean plants. However, the water imbalance treatment T2 (saved 34% of water) did not affect the yield of the drought-resistant variety (ND12) as compared to the drought-susceptible variety (C 103). In addition, the decreases water content reduced the concentration of starch, sucrose and soluble polysaccharide in soybean leaves, while opposite trends were observed for free proline content. Meanwhile, our treatments from T1 to T3 significantly increased the protein, isoflavones (e.g., glucosides that produce fewer undesirable aftertastes) and fatty acid (especially unsaturated fatty acids) concentrations in soybean seeds. However, excessive water deficit conditions (in T4, T5, and T6) significantly reduced the isoflavone and fatty acid concentrations in seed. In conclusion, these results indicate that by selecting area-specific and appropriate genotypes we can produce optimum soybean seed yield with better quality under rain-fed and intercropping conditions.

Author Contributions

Data curation, N.I. and J.-C.D.; Formal analysis, S.H. and M.A.R.; Funding acquisition, W.Y.; Methodology, N.I. and J.L.; Resources, J.Z.; Software, X.-W.Z. and C.-Q.Y; Supervision, W.Y. and J.L.; Validation, S.A.; Writing—original draft, N.I.; Writing—review & editing, S.H., X.-W.Z., C.-Q.Y. and M.A.A.

Acknowledgments

This study was financially supported by the National Key Research and Development Program of China (2016YFD0300209), the National Natural Science Foundation of China (31301277 & 31401329) and the China Postdoctoral Science Foundation (2014 M560724).

Conflicts of Interest

The authors declare no conflict of interest.

References

  1. Yan, Y.; Gong, W.; Yang, W.; Wan, Y.; Chen, X.; Chen, Z.; Wang, L. Seed treatment with uniconazole powder improves soybean seedling growth under shading by corn in relay strip intercropping system. Plant Prod. Sci. 2010, 13, 367–374. [Google Scholar] [CrossRef]
  2. Rahman, T.; Ye, L.; Liu, X.; Iqbal, N.; Du, J.; Gao, R.; Liu, W.; Yang, F.; Yang, W. Water use efficiency and water distribution response to different planting patterns in maize–soybean relay strip intercropping systems. Exp. Agric. 2017, 53, 159–177. [Google Scholar] [CrossRef]
  3. Yang, F.; Cui, L.; Huang, S.; Liu, W.; Yong, T.; Yang, W. Soybean growth environment and group yield in soybean relay intercropped with different leaf type maize. Soybean Sci. 2015, 34, 402–407. [Google Scholar]
  4. Liu, X.; Rahman, T.; Song, C.; Su, B.; Yang, F.; Yong, T.; Wu, Y.; Zhang, C.; Yang, W. Changes in light environment, morphology, growth and yield of soybean in maize-soybean intercropping systems. Field Crops Res. 2017, 200, 38–46. [Google Scholar] [CrossRef]
  5. Lin, Y.; Feng, Y.; Ying, S.B.; Jing, Z.; Guo, L.W.; Wen, Y.Y. Effects of different field patterns on water distribution and water use efficiency in maize-soybean relay strip intercropping systems. Agric. Res. Arid Areas 2015, 33, 41–48. [Google Scholar]
  6. Bellaloui, N.; Mengistu, A. Seed composition is influenced by irrigation regimes and cultivar differences in soybean. Irrig. Sci. 2008, 26, 261–268. [Google Scholar] [CrossRef]
  7. Devi, M.A.; Giridhar, P. Variations in physiological response, lipid peroxidation, antioxidant enzyme activities, proline and isoflavones content in soybean varieties subjected to drought stress. PNAS India Sect. B Biol. Sci. 2015, 85, 35–44. [Google Scholar] [CrossRef]
  8. Gutierrez-Gonzalez, J.J.; Guttikonda, S.K.; Tran, L.-S.P.; Aldrich, D.L.; Zhong, R.; Yu, O.; Nguyen, H.T.; Sleper, D.A. Differential expression of isoflavone biosynthetic genes in soybean during water deficits. Plant Cell Physiol. 2010, 51, 936–948. [Google Scholar] [CrossRef] [PubMed]
  9. Lozovaya, V.V.; Lygin, A.V.; Ulanov, A.V.; Nelson, R.L.; Daydé, J.; Widholm, J.M. Effect of temperature and soil moisture status during seed development on soybean seed isoflavone concentration and composition. Crop Sci. 2005, 45, 1934–1940. [Google Scholar] [CrossRef]
  10. Bellaloui, N.; Mengistu, A.; Kassem, M.A. Effects of genetics and environment on fatty acid stability in soybean seed. Food Nutr. Sci. 2013, 4, 165. [Google Scholar] [CrossRef]
  11. Specht, J.; Chase, K.; Macrander, M.; Graef, G.; Chung, J.; Markwell, J.; Germann, M.; Orf, J.; Lark, K. Soybean response to water. Crop Sci. 2001, 41, 493–509. [Google Scholar] [CrossRef]
  12. Lee, J.; Oliva, M.; Sleper, D.; Shannon, J. Irrigation has little effect on unsaturated fatty acid content in soya bean seed oil within genotypes differing in fatty acid profile. J. Agron. Crop Sci. 2008, 194, 320–324. [Google Scholar] [CrossRef]
  13. Desclaux, D.; Huynh, T.-T.; Roumet, P. Identification of soybean plant characteristics that indicate the timing of drought stress. Crop Sci. 2000, 40, 716–722. [Google Scholar] [CrossRef]
  14. Stolf-Moreira, R.; Medri, M.; Neumaier, N.; Lemos, N.; Pimenta, J.; Tobita, S.; Brogin, R.; Marcelino-Guimarães, F.; Oliveira, M.; Farias, J. Soybean physiology and gene expression during drought. Genet. Mol. Res. 2010, 9, 1946–1956. [Google Scholar] [CrossRef] [PubMed]
  15. Sadeghipour, O.; Abbasi, S. Soybean response to drought and seed inoculation. World Appl. Sci. J 2012, 17, 55–60. [Google Scholar]
  16. Bates, L.; Waldren, R.; Teare, I. Rapid determination of free proline for water-stress studies. Plant Soil 1973, 39, 205–207. [Google Scholar] [CrossRef]
  17. Riazi, A.; Matsuda, K.; Arslan, A. Water-stress induced changes in concentrations of proline and other solutes in growing regions of young barley leaves. J. Exp. Bot. 1985, 36, 1716–1725. [Google Scholar] [CrossRef]
  18. Liu, J.; Qin, W.-T.; Wu, H.-J.; Yang, C.-Q.; Deng, J.-C.; Iqbal, N.; Liu, W.-G.; Du, J.-B.; Shu, K.; Yang, F. Metabolism variation and better storability of dark-versus light-coloured soybean (Glycine max L. Merr.) seeds. Food Chem. 2017, 223, 104–113. [Google Scholar] [CrossRef] [PubMed]
  19. Yang, C.-Q.; Iqbal, N.; Hu, B.-Y.; Zhang, Q.-H.; Wu, H.-J.; Liu, X.; Zhang, J.; Liu, W.-G.; Yang, W.-Y.; Liu, J. Targeted metabolomics analysis of fatty acids in soybean seeds using GC-MS to reveal the metabolic manipulation of shading in the intercropping system. Anal. Methods 2017, 9, 2144–2152. [Google Scholar] [CrossRef]
  20. Desclaux, D.; Roumet, P. Impact of drought stress on the phenology of two soybean (Glycine max L. Merr) cultivars. Field Crops Res. 1996, 46, 61–70. [Google Scholar] [CrossRef]
  21. Liu, F.; Andersen, M.N.; Jensen, C.R. Loss of pod set caused by drought stress is associated with water status and aba content of reproductive structures in soybean. Funct. Plant Biol. 2003, 30, 271–280. [Google Scholar] [CrossRef]
  22. Zhang, M.; Zhai, Z.; Tian, X.; Duan, L.; Li, Z. Brassinolide alleviated the adverse effect of water deficits on photosynthesis and the antioxidant of soybean (Glycine max L.). Plant Growth Regul. 2008, 56, 257–264. [Google Scholar] [CrossRef]
  23. Farooq, M.; Hussain, M.; Siddique, K.H. Drought stress in wheat during flowering and grain-filling periods. Crit. Rev. Plant Sci. 2014, 33, 331–349. [Google Scholar] [CrossRef]
  24. Senapati, N.; Stratonovitch, P.; Paul, M.J.; Semenov, M.A. Drought Tolerance during Reproductive Development Is Important for Increasing Wheat Yield Potential under Climate Change in Europe. J. Exp. Bot. 2018. Available online: https://academic.oup.com/jxb/advance-article/doi/10.1093/jxb/ery226/5036557?searchresult=1 (accessed on 20 July 2018). [CrossRef] [PubMed]
  25. Witt, S.; Galicia, L.; Lisec, J.; Cairns, J.; Tiessen, A.; Araus, J.L.; Palacios-Rojas, N.; Fernie, A.R. Metabolic and phenotypic responses of greenhouse-grown maize hybrids to experimentally controlled drought stress. Mol. Plant 2012, 5, 401–417. [Google Scholar] [CrossRef] [PubMed]
  26. Son, C.; Park, S.; Kim, C.; Choi, B. Effects of Water Stress on Growth Characteristics and Grain Yield of Soybean. RDA J. Agric. Sci. 1996. Available online: http://agris.fao.org/agris-search/search.do?recordID=KR9603781 (accessed on 20 July 2018).
  27. Sarai Tabrizi, M.; Parsinejad, M.; Babazadeh, H. Efficacy of partial root drying technique for optimizing soybean crop production in semi-arid regions. Irrig. Drain. 2012, 61, 80–88. [Google Scholar] [CrossRef]
  28. Masoumi, H.; Darvish, F.; Daneshian, J.; Normohammadi, G.; Habibi, D. Effects of water deficit stress on seed yield and antioxidants content in soybean (Glycine max L.) cultivars. Afr. J. Agric. Res. 2011, 6, 1209–1218. [Google Scholar]
  29. Heatherly, L.G. Drought stress and irrigation effects on germination of harvested soybean seed. Crop Sci. 1993, 33, 777–781. [Google Scholar] [CrossRef]
  30. Hufstetler, E.V.; Boerma, H.R.; Carter, T.E.; Earl, H.J. Genotypic variation for three physiological traits affecting drought tolerance in soybean. Crop Sci. 2007, 47, 25–35. [Google Scholar] [CrossRef]
  31. Masoumi, H.; Masoumi, M.; Darvish, F.; Daneshian, J.; Nourmohammadi, G.; Habibi, D. Change in several antioxidant enzymes activity and seed yield by water deficit stress in soybean (Glycine max L.) cultivars. Not. Bot. Horti Agrobot. Cluj-Napoca 2010, 38, 86–94. [Google Scholar]
  32. Mayers, J.; Lawn, R.; Byth, D. Agronomic studies on soybean (Glycine max (L.) Merrill) in the dry seasons of the tropics. I. Limits to yield imposed by phenology. Aust. J. Agric. Res. 1991, 42, 1075–1092. [Google Scholar] [CrossRef]
  33. Jamieson, P.; Martin, R.; Francis, G.; Wilson, D. Drought effects on biomass production and radiation-use efficiency in barley. Field Crops Res. 1995, 43, 77–86. [Google Scholar] [CrossRef]
  34. Grinnan, R.; Carter, T.E.; Johnson, M.T. Effects of drought, temperature, herbivory, and genotype on plant–insect interactions in soybean (Glycine max). Arthropod-Plant Interact. 2013, 7, 201–215. [Google Scholar] [CrossRef]
  35. Li, F.; Wei, C.; Zhang, F.; Zhang, J.; Nong, M.; Kang, S. Water-use efficiency and physiological responses of maize under partial root-zone irrigation. Agric. Water Manag. 2010, 97, 1156–1164. [Google Scholar] [CrossRef]
  36. Poorter, H.; Niklas, K.J.; Reich, P.B.; Oleksyn, J.; Poot, P.; Mommer, L. Biomass allocation to leaves, stems and roots: Meta-analyses of interspecific variation and environmental control. New Phytol. 2012, 193, 30–50. [Google Scholar] [CrossRef] [PubMed]
  37. Liu, F.; Shahnazari, A.; Andersen, M.N.; Jacobsen, S.-E.; Jensen, C.R. Effects of deficit irrigation (DI) and partial root drying (PRD) on gas exchange, biomass partitioning, and water use efficiency in potato. Sci. Hortic. 2006, 109, 113–117. [Google Scholar] [CrossRef]
  38. Huber, S.C.; Rogers, H.H.; Mowry, F.L. Effects of water stress on photosynthesis and carbon partitioning in soybean (Glycine max [L.] Merr.) plants grown in the field at different CO2 levels. Plant Physiol. 1984, 76, 244–249. [Google Scholar] [CrossRef] [PubMed]
  39. Goldschmidt, E.E.; Huber, S.C. Regulation of photosynthesis by end-product accumulation in leaves of plants storing starch, sucrose, and hexose sugars. Plant Physiol. 1992, 99, 1443–1448. [Google Scholar] [CrossRef] [PubMed]
  40. Liu, F.; Jensen, C.R.; Andersen, M.N. Drought stress effect on carbohydrate concentration in soybean leaves and pods during early reproductive development: Its implication in altering pod set. Field Crops Res. 2004, 86, 1–13. [Google Scholar] [CrossRef]
  41. Lee, B.R.; Jin, Y.L.; Jung, W.J.; Avice, J.C.; Morvan-Bertrand, A.; Ourry, A.; Park, C.W.; Kim, T.H. Water-deficit accumulates sugars by starch degradation—Not by de novo synthesis—In white clover leaves (Trifolium repens). Physiol. Plant. 2008, 134, 403–411. [Google Scholar] [CrossRef] [PubMed]
  42. Villadsen, D.; Rung, J.H.; Nielsen, T.H. Osmotic stress changes carbohydrate partitioning and fructose-2, 6-bisphosphate metabolism in barley leaves. Funct. Plant Biol. 2005, 32, 1033–1043. [Google Scholar] [CrossRef]
  43. Ahmed, Z.; Waraich, E.A.; Rashid, A.; Shahbaz, M. Morpho-physiological and biochemical responses of camelina (Camelina sativa crantz) genotypes under drought stress. Int. Agric. Biol. 2017, 19. [Google Scholar] [CrossRef]
  44. Dener, E.; Kacelnik, A.; Shemesh, H. Pea plants show risk sensitivity. Curr. Biol. 2016, 26, 1763–1767. [Google Scholar] [CrossRef] [PubMed]
  45. Larrainzar, E.; Gil-Quintana, E.; Arrese-Igor, C.; González, E.M.; Marino, D. Split-root systems applied to the study of the legume-rhizobial symbiosis: What have we learned? J. Integr. Plant Biol. 2014, 56, 1118–1124. [Google Scholar] [CrossRef] [PubMed] [Green Version]
  46. Cechin, I.; Corniani, N.; de Fátima Fumis, T.; Cataneo, A.C. Ultraviolet-b and water stress effects on growth, gas exchange and oxidative stress in sunflower plants. Radiat. Environ. Biophys. 2008, 47, 405–413. [Google Scholar] [CrossRef] [PubMed]
  47. Shen, X.; Zhou, Y.; Duan, L.; Li, Z.; Eneji, A.E.; Li, J. Silicon effects on photosynthesis and antioxidant parameters of soybean seedlings under drought and ultraviolet-b radiation. J. Plant Physiol. 2010, 167, 1248–1252. [Google Scholar] [CrossRef] [PubMed]
  48. Al-Tawaha, A.; Seguin, P.; Smith, D.; Bonnell, R. Irrigation level affects isoflavone concentrations of early maturing soya bean cultivars. J. Agron. Crop Sci. 2007, 193, 238–246. [Google Scholar] [CrossRef]
  49. Raza, M.A.; Feng, L.Y.; Manaf, A.; Wasaya, A.; Ansar, M.; Hussain, A.; Khalid, M.H.B.; Iqbal, N.; Xi, Z.J.; Chen, Y.K. Sulphur application increases seed yield and oil content in sesame seeds under rainfed conditions. Field Crops Res. 2018, 218, 51–58. [Google Scholar] [CrossRef]
  50. Motzo, R.; Fois, S.; Giunta, F. Protein content and gluten quality of durum wheat (Triticum turgidum subsp. Durum) as affected by sowing date. J. Sci. Food Agric. 2007, 87, 1480–1488. [Google Scholar] [CrossRef]
  51. Iqbal, N.; Zhang, Q.; Wu, H.; Yang, C.; Deng, J.; Qin, W.; Zhang, J.; Yang, W.; Liu, J. Soybean (Glycine max L.) germplasm screening and geographical determination based on targeted isoflavone metabolomics. Appl. Ecol. Env. Res. 2018, 16, 3933–3953. [Google Scholar]
  52. Bennett, J.O.; Yu, O.; Heatherly, L.G.; Krishnan, H.B. Accumulation of genistein and daidzein, soybean isoflavones implicated in promoting human health, is significantly elevated by irrigation. J. Agric. food Chem. 2004, 52, 7574–7579. [Google Scholar] [CrossRef] [PubMed]
  53. Gutierrez-Gonzalez, J.J.; Wu, X.; Gillman, J.D.; Lee, J.-D.; Zhong, R.; Yu, O.; Shannon, G.; Ellersieck, M.; Nguyen, H.T.; Sleper, D.A. Intricate environment-modulated genetic networks control isoflavone accumulation in soybean seeds. BMC Plant Biol. 2010, 10, 105. [Google Scholar] [CrossRef] [PubMed]
  54. Dhaubhadel, S.; Farhangkhoee, M.; Chapman, R. Identification and characterization of isoflavonoid specific glycosyltransferase and malonyltransferase from soybean seeds. J. Exp. Bot. 2008, 59, 981–994. [Google Scholar] [CrossRef] [PubMed] [Green Version]
  55. Okubo, K.; Iijima, M.; Kobayashi, Y.; Yoshikoshi, M.; Uchida, T.; Kudou, S. Components responsible for the undesirable taste of soybean seeds. Biosci. Biotechnol. Biochem. 1992, 56, 99–103. [Google Scholar] [CrossRef]
  56. Gao, J.; Hao, X.; Thelen, K.D.; Robertson, G.P. Agronomic management system and precipitation effects on soybean oil and fatty acid profiles. Crop Sci. 2009, 49, 1049–1057. [Google Scholar] [CrossRef]
  57. Carrera, C.S.; Dardanelli, J.L. Water deficit modulates the relationship between temperature and unsaturated fatty acid profile in soybean seed oil. Crop Sci. 2017, 57, 3179–3189. [Google Scholar] [CrossRef]
  58. Dhakal, K.H.; Jung, K.-H.; Chae, J.-H.; Shannon, J.G.; Lee, J.-D. Variation of unsaturated fatty acids in soybean sprout of high oleic acid accessions. Food Chem. 2014, 164, 70–73. [Google Scholar] [CrossRef] [PubMed]
  59. Bin, Q.; Rao, H.; Hu, J.N.; Liu, R.; Fan, Y.W.; Li, J.; Deng, Z.Y.; Zhong, X.; Du, F.L. The caspase pathway of linoelaidic acid (9t, 12t-c18: 2)-induced apoptosis in human umbilical vein endothelial cells. Lipids 2013, 48, 115–126. [Google Scholar] [CrossRef] [PubMed]
  60. Raza, M.A.; Feng, L.Y.; Iqbal, N.; Manaf, A.; Khalid, M.H.B.; ur Rehman, S.; Wasaya, A.; Ansar, M.; Billah, M.; Yang, F.; et al. Effect of Sulphur Application on Photosynthesis and Biomass Accumulation of Sesame Varieties under Rainfed Conditions. Agronomy 2018, 8, 149. [Google Scholar] [CrossRef]
Figure 1. (I) Schematic representation of maize soybean inter cropping and water imbalance site. (II) Soil water contents of different spatial position in maize-soybean relay intercropping system. A stands for narrow maize rows, B stands for between maize and soybean, C represents the soybean lines while D shows the soybean sole crop. (III) Split-root approach as a tool to study the effects of imbalance water deficits. (IV) Schematic representation of soybean experiment design.
Agronomy 08 00168 g001
Figure 2. The total water consumption under different split-root water imbalance treatments (mL). ND12 (drought resistant) (A) and C103 (drought susceptible) (B). T1, 100/100; T2, 100/50; T3, 100/20; T4, 50/50; T5, 50/20; T6, 20/20.
Agronomy 08 00168 g002
Figure 3. Moisture status of both sides of soybean roots subjected to different split-root water imbalance treatments. (A,C) = before water application, (B,D) = after 2 h of water application. (A,B) = ND12 (drought resistant), (C,D) = C103 (drought susceptible). T1, 100/100; T2, 100/50; T3, 100/20; T4, 50/50; T5, 50/20; T6, 20/20.
Agronomy 08 00168 g003
Figure 4. Biomass of different plant parts (stem, leave, pod and seed) (A) and biomass allocation (Percentage of total plant mass) (B) for the different plant parts. T1, 100/100; T2, 100/50; T3, 100/20; T4, 50/50; T5, 50/20; T6, 20/20.
Agronomy 08 00168 g004
Figure 5. Effect of split-root water imbalance treatments on osmoprotectant of two soybean genotypes ND12 (drought resistant) and C103 (drought susceptible). (A) Starch mg·g−1, (B) sucrose mg·g−1, (C) soluble polysaccharide mg·g−1, (D) proline µg·g−1. (Means ± SE), same small letters are not significantly different at p < 0.05. T1, 100/100; T2, 100/50; T3, 100/20; T4, 50/50; T5, 50/20; T6, 20/20.
Agronomy 08 00168 g005
Figure 6. Effect of split-root water imbalance treatments on protein and isoflavones of two soybean genotypes ND12 (drought resistant) and C103 (drought susceptible). (A) Protein %, (B) total isoflavone mg·g−1, (C) aglycone mg·g−1, (D) β-glucoside mg·g−1, (E) malonyl glycoside mg·g−1, (F) acetyle glycoside mg·g−1. (Means ± SE), same small letters are not significantly different at p < 0.05. T1, 100/100; T2, 100/50; T3, 100/20; T4, 50/50; T5, 50/20; T6, 20/20.
Agronomy 08 00168 g006
Figure 7. Fatty acids content (mg·g−1) of two soybean genotypes ND12 (drought resistant) and C103 (drought susceptible) as influenced by different split-root water imbalance treatments. (A) Total fatty acids mg·g−1, (B) unsaturated fatty acids mg·g−1 (UFAs), (C) saturated fatty acids mg·g−1 (SFAs), (D) palmitic acid mg·g−1 (PA), (E) stearic acid mg·g−1 (SA), (F) linoleic acid mg·g−1 (LA), (G) oleic acid mg·g−1 (OA), (H) a-linolenic acid mg·g−1 (ALA). (Means ± SE), same small letters are not significantly different at p < 0.05. T1, 100/100; T2, 100/50; T3, 100/20; T4, 50/50; T5, 50/20; T6, 20/20.
Agronomy 08 00168 g007
Table 1. Soybean morphological characters under different split-root water imbalance treatments.
Plant Height (cm)Stem Diameter (mm)Number of Node (Plant−1)Number of Branch (Plant−1)Pod Length (cm)
GenotypeND1258.22 b6.02 b14.22 b5.55 b4.59 a
C10386.11 a6.39 a16.66 a7.22 a3.96 b
LSD (0.05) 2.120.320.631.090.09
Treatment (T)T172.50 a6.35 a15.83 a6.83 a4.45 a
T272.16 a6.31 a15.50 abc6.50 ab4.43 b
T373.33 a6.44 a15.83 a6.50 ab4.30 c
T473.00 a6.30 a15.66 ab6.33 ab4.23 cd
T572.67 a6.06 ab15.00 bc6.33 ab4.17 d
T669.33 b5.76 b14.83 c5.83 b3.95 e
LSD (0.05) 2.230.470.800.510.07
Interaction (G × T) *****
Means with same small letters are not significantly different at p < 0.05 with in the same column. ND12 (drought resistant) and C103 (drought susceptible). T1, 100/100; T2, 100/50; T3, 100/20; T4, 50/50; T5, 50/20; T6, 20/20. Values are means of three replicates for each treatment. * = Significant.
Table 2. Soybean yields and yield components, and total biomass accumulation under different split-root water imbalance treatments.
TB (g)SYP (g)SW (g)NGPNPPNIPP
GenotypeND1243.99 a16.88 a19.57 a102.89 b52.16 b4.50 a
C10344.57 a15.24 b12.53 b129.78 a60.67 a4.44 a
LSD (0.05) 0.920.640.8013.922.891.26
Treatment (T)T154.18 a21.22 a16.80 a142.17 a69.16 a2.00 d
T251.12 b19.74 b16.79 a129.83 b62.50 b3.66 c
T346.12 c17.24 c16.48 a115.33 c56.16 c4.00 c
T441.34 d14.42 d16.25 ab112.33 cd54.33 c5.00 b
T538.31 e12.86 e15.57 b104.83 d51.16 c5.50 b
T634.59 f10.88 f14.39 c93.50 e45.16 d6.67 a
LSD (0.05) 2.001.220.688.315.090.88
Interaction (G × T) ******
Means with same small letters are not significantly different at p < 0.05 with in the same column. ND12 (drought resistant) and C103 (drought susceptible). T1, 100/100; T2, 100/50; T3, 100/20; T4, 50/50; T5, 50/20; T6, 20/20. Values are means of three replicates for each treatment. TB, total biomass; SYP, seed yield per plant; SW, 100-seed weight; NGP, number of grains per plant; NPP, number of pods per plant; NIPP, number of infertile pods per plant. * = Significant.

