Article

Neurohypophysial Hormones Associated with Osmotic Challenges in the Brain and Pituitary of the Euryhaline Black Porgy, Acanthopagrus schlegelii

1
Department of Aquaculture, National Taiwan Ocean University, Keelung 20224, Taiwan
2
Department of Aquaculture, National Pingtung University of Science and Technology, Pingtung 91230, Taiwan
3
Department of Basic Sciences, PYD, King Faisal University, Al Hofuf 31982, Saudi Arabia
4
Center of Excellence for the Oceans, National Taiwan Ocean University, Keelung 20224, Taiwan
*
Authors to whom correspondence should be addressed.
Cells 2021, 10(11), 3086; https://doi.org/10.3390/cells10113086
Submission received: 19 August 2021 / Revised: 31 October 2021 / Accepted: 2 November 2021 / Published: 9 November 2021
(This article belongs to the Special Issue Fish: A Model for Endocrine Research)

Abstract

:
Our study showed differential expression of the arginine vasotocin (avt)/isotocin (it) in the brain and pituitary gland of the euryhaline black porgy (Acanthopagrus schlegelii) during osmotic stress. A decrease in serum osmolality and increased cortisol levels were observed after acute transfer from seawater (SW) to freshwater (FW). The increased expressions of avt, avt receptor (avtr: v1a), and isotocin receptor (itr: itr1) transcripts on day 1 and it and itr transcripts on days 7 and 30 were found in the brains and pituitary glands of FW fish. Increased levels of avt mRNA in the diencephalon and avtr mRNA in the pituitary together with serum cortisol on day 1 of FW exposure indicated activation of the hypothalamic–pituitary–interrenal (HPI) axis. The expression levels of avtr and itr after FW transfer were increased in the pituitary on days 7 and 30. Furthermore, in situ hybridization demonstrated spatially differential expression of avt and itr transcripts in nucleus preopticus parvocellularis of pars gigantocellularis (PMgc), magnocellularis (PMmc), and parvocellularis (PMpc) of the preoptic area (POA). Positive signals for avt and it were highly abundant in PMpc after FW exposure. The data suggest involvement of neurohypophysial hormones in the brain (telencephalon and diencephalon) and pituitary for osmotic stress.

1. Introduction

The neurohypophysial peptides (nonapeptides) arginine vasotocin (avt) and isotocin (it) are hormones that regulate homeostasis in teleosteans [1]. They belong to the arginine vasopressin-oxytocin family of peptides [2,3]. The neurohypophysial hormones are active neuromodulators in the central nervous system [4,5,6]. The avt and it hormones play versatile roles in teleosts, including the maintenance of the equilibrium of salt, fluid balance, endocrine secretion, reproduction, cardiovascular function, vocalization, and social behaviors [4,7,8,9,10]. Many of the physiological actions of avt and arginine vasopressin (AVP) are common throughout the vertebrate series [11]. The avt and it genes are produced in the magnocellular and parvocellular neurons of the preoptic nucleus [10,12,13], and their axons extend to the posterior neurohypophysis of the pituitary gland [6,14,15,16]. The functionality of these extra-hypothalamic projections was confirmed by the presence of avt receptors (avtr: v1a, v1b, v2) and/or it receptors (itr: itr1, itr2) in the pituitary of teleosts [6,14,15,17,18].
The synthesis and release of avt and it in responding to the stressors of the environment, osmoregulation, and biology were demonstrated in teleosts [19,20,21,22,23,24,25,26,27,28]. Changes in Avt and It concentrations in the hypothalamus, pituitary, and circulation blood have been observed in some teleosts under different stressors, such as confinement, disturbance, high density, food deprivation, or osmotic change. However, the production of Avt and It depends on the kind of stress stimulation [29].
In addition, avt and it are assumed to be important in immediate and long-term acclimation/adaptation to the changes of environmental salinity [29,30,31]. Goodson and Bass (2001) [10] found that brain avt acts on avtr to regulate behaviors associated with sociality and reproduction. These in vitro studies showed that the neurohypophysial hormones Avt and It exert their effects through specific receptors [32,33].
In this study, type 1 (v1a) avtr was concentrated to study expression in the brain and pituitary gland during osmotic stress. Of course, future studies should analyze avtrv1b and avtrv2 as well. Interestingly, Avt could also activate itr [14]. Expression of itr in the brain, intestine, bladder, skeletal muscle, lateral line, gill, and kidney seems to imply that these receptors may act as mediators for a variety of physiological functions [14]. There are few studies related to the acclimation of freshwater (FW) and seawater (SW), and the specific roles and localization of avt, avtr, it, and itr in the brain during SW and FW acclimation in fish [15,16,34,35,36,37].
Black porgy (Acanthopagrus schlegelii) is a marine hermaphroditic protandrous fish with a male phase in the first two years after hatching. It then switches to a female phase after three years, or later [38,39]. Black porgy is an euryhaline marine teleost, and it can live in a wide range of water salinities. This makes black porgy an attractive aquatic animal model for physiological and endocrine studies during osmotice challenge [40,41]. In this study, we investigated the time-dependent expression levels of avt, it, and their receptors (avtr: v1a; itr: itr1) during transfer of fish into FW in juvenile male black porgy. We thus measured the serum osmolality and cortisol levels in black porgy on day 1, day 7, and day 30 to monitor the osmoregulatory stress. Neurohypophysial hormones and their receptors were cloned, and phylogenetic analyses of these receptors were conducted. We further used mRNA expression to localize avt and it in the brain. Quantitative real-time PCR analysis (Q-PCR) was used to assess the avtr (v1a) and itr (itr1) transcripts in the pituitary during SW and FW acclimation on day 1. In situ hybridization confirmed these Q-PCR day 1 results.

2. Materials and Methods

2.1. Experimental Fish

Black porgy (all male, 6 to 7 months old; n = 72; body mass = 17.69 ± 0.59 g, body length = 9.96 ± 0.37 cm) were kept in seawater (SW) with a natural light system in the university’s aquarium (month: October; longitude: 25.08′58.8″ N, latitude: 121.46′25.5″ E; water temperatures ranged from 23 to 27 °C). The black porgy is a marine euryhaline teleost. The fish can survive in a diluted seawater environment even in freshwater (FW). This is why we selected black porgy as an experimental model fish. The fish were given pelleted dry feed ad libitum. Black porgies were decapitated after being sedated with 2-phenoxyethanol for sample collection. Samples of the pituitary gland and other brain tissues (telencephalon and diencephalon) were taken and quickly frozen in liquid N2. The experiments were performed out according to the principles and procedures approved by the National Taiwan Ocean University’s Institutional Animal Care and Use Committee (# 99026).

2.2. Experimental Design

Fish (n = 72) were randomly divided into two groups and maintained in SW (n = 36) or FW (n = 36) to further characterize the endocrine alterations in the brain and pituitary in response to an acute osmotic stress. Fish (n = 12 per group) were transferred to the three distinct FW-containing tanks after an initial acclimatization period of 60 days (SW–FW transfer, FW fish). SW fish (n = 12 per group) were also transferred to a separate three SW tanks as a control (SW–SW transfer, SW fish).
Samples were collected on day 1, day 7, and day 30 (n = 8 in each group) after the transfer: These samples included blood; telencephalon (prosencephalon, including the olfactory bulb, telencephalon, and part of the preoptic area located between the anterior commissure and the optic chiasm); diencephalon (mostly the diencephalon, including the thalamus, epithalamus, subthalamus, and hypothalamus, as described previously [42]); and the pituitary gland. RNA extraction was conducted after the samples were frozen in liquid nitrogen and kept at −80 °C. For in situ hybridization, brain tissue with preoptic area (POA) was collected on day 1 (n = 4 in each group) and fixed in 4% paraformaldehyde in phosphate buffered saline. The PBS used 8 g of NaCl, 200 mg of KCl, 1.44 g of Na2HPO4, and 245 mg of KH2PO4 in 800 mL of distilled water at pH 7.4.

2.3. Analysis of Serum Cortisol by Enzyme Immunoassay (EIA)

A plastic syringe was used to collect blood from the caudal vasculature of the SW and FW groups (day 1, day 7 and day 30, n = 8 in each group) in Eppendorf tubes. Centrifugation at 8000× g for 5 min at 4 °C yielded serum that was then stored in a freezer until further use. The cortisol EIA kit (Cayman Chemical, Ann Arbor, MI, USA) was used to measure cortisol levels. Three milliliters of diethyl ether was used to extract the serum samples. The supernatant was maintained at 40 °C in a water bath for evaporation of ether after extraction and then stored at a freezer until further analysis. Then, cortisol extracts were re-suspended in PBS buffer. We established a parallelism between the standard curve and a serial dilution of the extracted solution. The cortisol concentrations (ng/mL) in the blood could then be calculated.

2.4. Analysis of Serum Osmolality with a Vapor Pressure Osmometer

We examined serum osmolality with a vapor pressure osmometer (Wescor Inc., Logan, UT, USA). The serum osmolality values of the SW and FW fish on days 1, 7, and 30 (n = 8 in each group) are expressed as mOsm/kg.

2.5. RNA Extraction, First Strand cDNA Synthesis, and Cloning

TRIzol® (Gibco BRL, Grand Island, NY, USA) was used to isolate RNA from the telencephalon, diencephalon, and pituitary according to the manufacturer’s protocol. RNA pellets were dissolved in RNase-free water after total RNA was precipitated in ethanol. The RNA was examined by spectrophotometry and electrophoresis on an agarose gel to check the quantity and integrity. Single-stranded cDNA was constructed using Invitrogen reagents (Invitrogen, Carlsbad, CA, USA). In a 20 µL reaction volume, 4 µg of total RNA was reverse transcribed into first-strand cDNA using oligo (dT)12–18 primers and SuperScript II reverse transcriptase (Gibco BRL) under the following incubation conditions: 42 °C for 60 min, 37 °C for 15 min, and 70 °C for 15 min. The resulting cDNA was a template for PCR amplification of the gene investigation.
The genes avt, avtr, it, and itr were cloned from the cDNA of the black porgy brain. The CLUSTAL X program (version 1.81; Conway Institute UCD, Dublin, Ireland) was used to create several alignments of the published sequences of the target genes to obtain the conserved regions: These were then used to generate the primers (Table 1). PCR reactions were performed with 10X reaction buffer (2.5 µL in 200 mM Tris-HCl, pH 8.4), 500 mM KCl, 10 mM dNTP (1 μL), 2 mM MgCl2 (1 µL), 0.5 μL of each 10 µM forward and reverse primer (Mission Biotech Co., Ltd., Taipei, Taiwan), cDNA (1 μL), and superscript enzyme (0.2 μL) (Invitrogen) in a 25 µL final volume. The PCR used 94 °C (5 min), 35 cycles of 94 °C (30 s), 50 °C (30 s), 72 °C (30 s), and 72 °C (10 min) (Applied Biosystems, Walthan, MA, USA). The PCR products were examined by electrophoresis on an agarose gel visualized by staining with ethidium bromide. A Gel-MTM Gel Extraction System Kit (Bio 101; Viogene, La Jolla, CA, USA) cloned DNA fragments into the pGEM®-T Easy Vector (Promega, Madison, WI, USA) and transformed into Escherichia coli competent cells. The culture was grown using X-Gal/IPTG ampicillin agar plates. After 15–20 h, white colonies were chosen from the plates and cultured in LB/ampicillin liquid media. Plasmids with the inserts were sequenced by a dye-terminator cycle-sequencing kit (Perkin Elmer, Foster City, CA, USA) and applied to BLAST to compare the sequences accessible in the NCBI database.

2.6. Phylogenetic Analysis of itr and avtr

The encoding sequences of itr and avtr cloned from black porgy were aligned with related neurohypophysial hormone receptor amino acid sequences of other fishes which were retrieved from NCBI database. Multiple sequence alignments of nonapeptide receptors amino acid sequences were generated using MUSCLE, included in MEGA version 5.05. Phylogenetic analyses were conducted based on neighbor-joining (NJ) method with a best-fit Jones–Taylor–Thornton+Gamma (JTT+G) amino acid substitutions model in MEGA5.05 software (Pennsylvania, State University, PA, USA). Statistical support for the NJ tree was evaluated by 1000 bootstrapping replicates.

2.7. Quantification of avt, avtr, it, and itr by Quantitative Real-Time PCR Analysis

The mRNA levels of avt (GenBank accession number: MZ816922), avtr (GenBank accession number: MZ816921), it (GenBank accession number: MZ816923), and itr (GenBank accession number: MZ816924) were analyzed by quantitative PCR (Q-PCR) using a iQTM Multicolor Real Time-PCR Detection system (Bio-Rad Co., Hercules, CA, USA). The primers of Q-PCR for avt, avtr, it, and itr were designed according to the primer expression software (Applied Biosystems) (Table 1). Meanwhile, beta actin and glyceraldehyde-3-phosphate dehydrogenase (gapdh, GenBank no. DQ399798) were employed as control genes. There was a significant difference in beta actin between SW and FW groups. There were no significant differences in the gapdh transcripts in response to the salinity treatment (Supplementary Materials Figure S1). Thus, gapdh was used as an internal control. A serial dilution of plasmid DNA containing amplified fragments of the target genes was generated (1 µg, 10−1 µg, 10−2 µg up to 10−10 µg). This used a Q-PCR machine (iQTM Multicolor Real Time-PCR Detection System; Bio-Rad Co.) for gene quantification of the standards, samples, and control using iQTM SYBR green (Bio-Rad) as a dsDNA minor-groove binding dye. The primers included a forward primer and a reverse primer (3 µM of avt and it, 5 µM of avtr and itr) from Mission Biotech Co., Ltd. Each sample was run twice, and a control PCR experiment was performed for each gene. The standard curve and a log (transcript concentration) versus CT curve were generated. Here, CT is the calculated fractional cycle number at which the PCR-fluorescence product was detectable above a threshold. The standard correlations for avt, avtr, it, and itr were −0.997, −0.995, −0.999, and −0.990, respectively.

2.8. In Situ Hybridization

The avt, avtr, it, and itr transcripts were located in the black porgy’s brain using in situ hybridization. The neuroanatomic sections focused on the nucleus of the preoptic area: nucleus preopticus parvocellularis pars gigantocellularis, PMgc; nucleus preopticus parvocellularis pars magnocellularis, PMmc; and nucleus preopticus parvocellularis pars parvocellularis, PMpc. The tissues were embedded in paraffin after being fixed in 4% paraformaldehyde in PBS for 15–20 h at 4 °C. The paraffin sections (5 µm) of the preoptic area (POA) and sagittal sections of the pituitary were on TESPA-treated slides (3-aminopropyltriethoxysilane, Sigma, St. Louis, MO, USA).
The specific PCR product of the target gene from the plasmid DNA carrying the interest genes in the vector (pGEM-T Easy) was generated with 50 U DNA polymerase (New England Biolabs, Ipswich, MA, USA) for DNA amplification with in situ hybridization primers (Table 1). A kit (PCR-Advanced Clean Up Kit, Viogene) was used to purify the PCR products. This purified DNA was applied as a template for in vitro transcription. T7 and T3 polymerase (Promega, Madison, WI, USA) were used to prepare respective sense and anti-sense riboprobes of avt, avtr, it, and itr. DNA templates (1 µg) were incubated (37 °C for 3 h) in a thermocycler (Applied Biosystems) for in vitro transcription. The reaction solution contained transcription buffer (5×), 0.1 M dithiothreitol (DTT), a DIG-rNTP mix (10×) (Roche, Penzberg, Germany), RNase inhibitor (40 U/µL) (Promega), and T7 or T3 RNA polymerase (20 U/µL). This samples were then each added to sterile DEPC H2O to make a final volume of 20 µL. The extra template was removed by digesting with 4 µL of DNase I (10 U/µL) at 37 °C for 30 min. After incubation, the RNA probes were precipitated overnight with 2.5 µL of LiCl (4 M) and 75 µL of isopropanol at −80 °C. The pellets were collected after centrifugation (10,000× g, 4 °C for 30 min) and then re-suspended in RNase inhibitor (2 µL) and sterile DEPC H2O (98 µL). We prepared an RNA probe according to previous studies [43,44].
The sections were rehydrated (from 100% to 50% ethanol) and rinsed with PBS for multiple times. The sections were then added to proteinase K (10 µg/mL in PBS) for 8–10 min at about 25 °C before being rinsed with 0.1% Tween-20 in PBS (PBT). The sections were prehybridized (68 °C for 1 h) in prehybridization buffer and then hybridized overnight in a hybridization buffer (50% formamide, 5× SSC, 500 µg/mL tRNA, 50 µg/mL heparin and 0.1% Tween-20) with digoxigenin-labeled RNA sense or antisense probes (1 µg/mL). The sections were warmed to about 25 °C (10 min), rinsed twice with buffer containing 25% formamide, 1× SCC, and 0.1% Tween-20 (60 °C, 15 min); they were then blocked with 2% blocking reagent (Roche); 2% normal goat serum in PBT) at about 25 °C (1 h). The sections were then reacted with an alkaline phosphatase-conjugated sheep anti-digoxigenin antibody (Roche) (diluted 1:2000 in 2% blocking reagent) for 15–20 h (4 °C). The hybridization signals were visualized via NTMT (100 mM NaCl, 100 mM Tris-HCl, 50 mM Mg2Cl, and 0.1% Tween-20) and NBT/BCIP (nitro blue tetrazolium/5-bromo-4-chloro-indolyl-phosphate) staining. The neuroanatomical structures of the brain area in black porgy (Figure 1) were identified using the brain atlas of gilthead sea bream [45] and our previous study in black porgy [46].

2.9. Data Analysis

To examine the difference between the control (SW) and experimental groups (FW) on different time courses (day 1, day 7, and day 30), two-way analysis of variance (ANOVA) was conducted and followed by a Tukey’s post hoc test using a statistical tool for the social sciences (SPSS). A statistically significant value of p < 0.05 was used.

3. Results

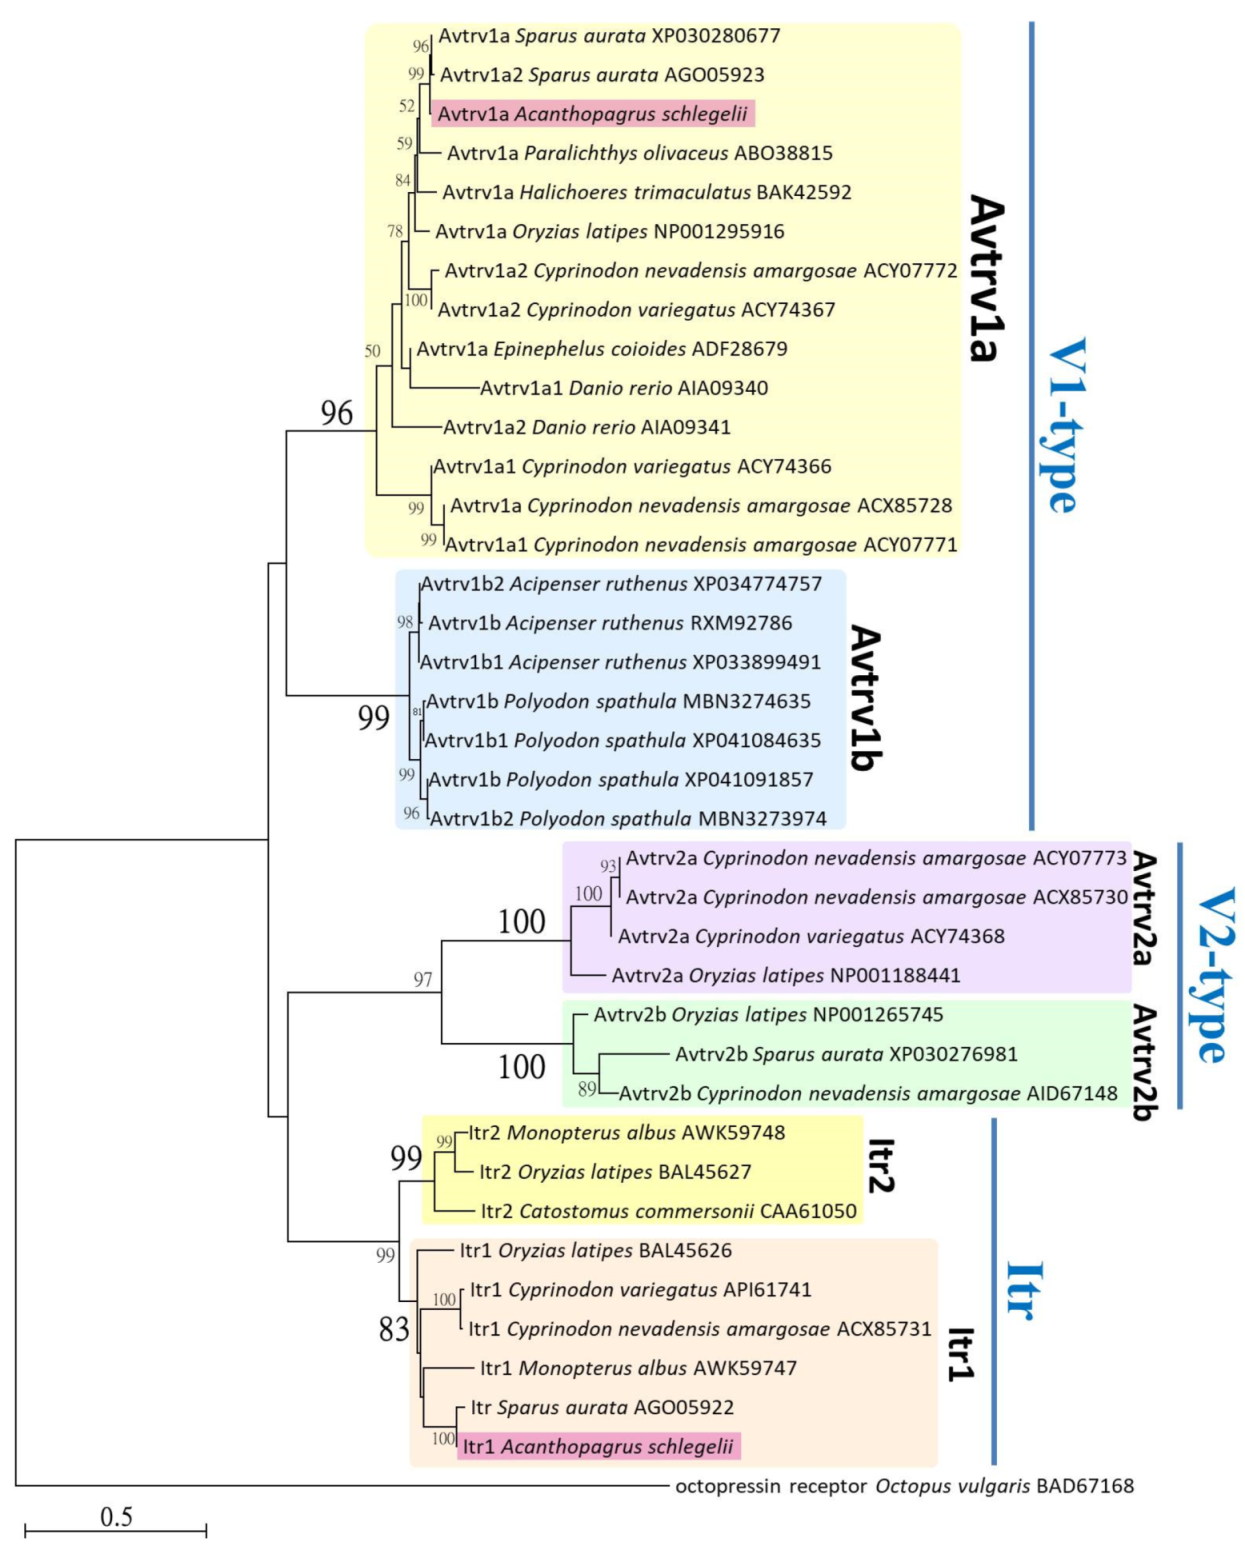
3.1. Sequence Analysis of it, itr, avt, and avtr, and Phylogenetic Tree of Neurohypophysial Hormone Receptors

Multiple sequence alignments of it, itr, avt, and avtr of black porgy and other fish species are shown in the Supplementary Materials figures (Figures S2–S5). The percentages of identity for black porgy genes compared to those of other fish species are 88.58–96.33% for it, 95.36–96.50% for itr, 87.23–96.54% for avt, and 89.05–92.51% for avtr (Figures S2–S5). A total of 38 amino acid sequences of representative species were used for phylogenetic analysis. The bootstrapping values below 50% are not shown in the Figure 2. Phylogenetic analyses were used to estimate the evolutionary relationship between the Avtr and Itr sequences of black porgy from other noanpeptide receptor sequences in fishes. Based on alignment of partial amino acid sequences, and by taking the sequence of octopressin receptor from octopus (Octopus vulgaris) as an outgroup, an NJ phylogenetic tree was constructed. The noanpeptide receptor sequences clustered into major branches of two V1-type receptors (Avtrv1a and Avtrv1b), two V2-type receptors (Avtrv2a and Avtrv2b), and two It receptors (Itr1 and Itr2). The encoding Avtr and Itr sequences of black porgy cloned and used in this study were clustered with the clad of Avtrv1a and Itr1, respectively. Tree topology and sequences of black porgy are illustrated in Figure 2.

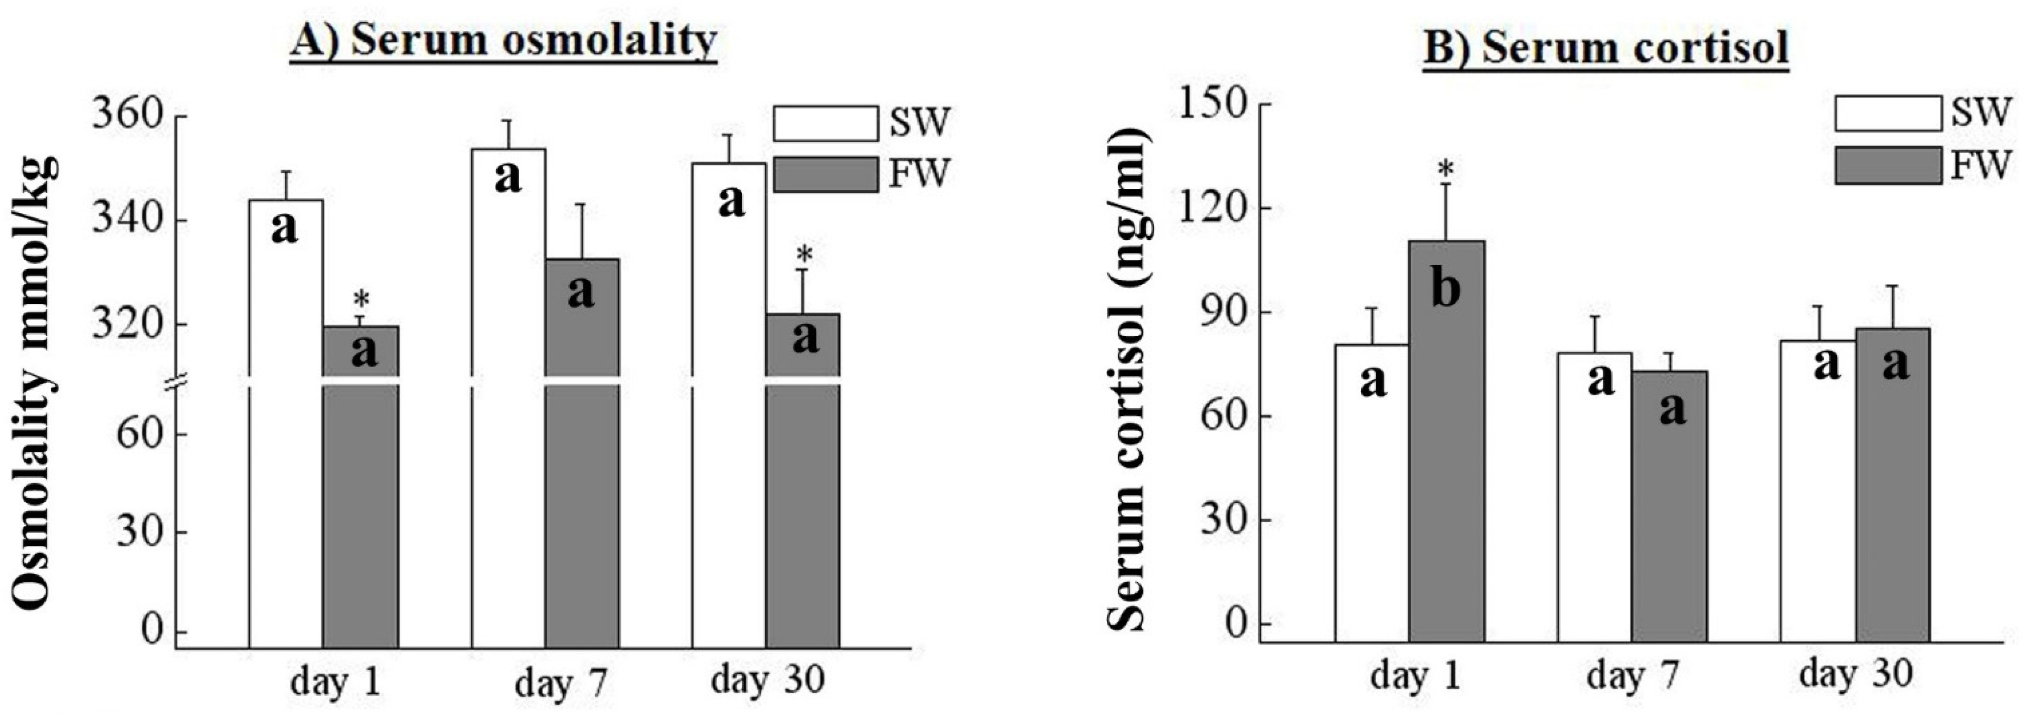
3.2. Serum Osmolality and Cortisol

The serum osmolality levels were significantly decreased on day 1 and 30 in the FW fish compared to the SW control (Figure 3A). The osmolality was not statistically different between SW and FW (Figure 3A). The serum cortisol levels were significantly increased in the FW fish on day 1 compared to the SW control (Figure 3B); there were no differences in serum cortisol levels on day 7 and day 30 in the FW fish compared to the SW control (Figure 3B).

3.3. The Expression of avt Transcripts in the Brain

The avt transcripts in the telencephalon (increased by 3.6-fold; Figure 4A) and diencephalon (increased by 15-fold; Figure 4B) were significantly increased in the FW fish on day 1 compared to SW fish. The avt transcripts in the telencephalon (Figure 4A) were significantly decreased on day 7 (15-fold) and 30 (10-fold) in the FW compared to the SW fish. The diencephalon did not have a difference between the SW and FW fish on day 7 (Figure 4B). Among the FW fish groups, the avt mRNA was significantly decreased on day 7 and day 30 compared to day 1 in the telencephalon and diencephalon (Figure 4A,B).

3.4. Localization of avt Transcripts in the SW and FW Black Porgies’ Preoptic Areas

In situ hybridization was performed to localize the avt transcripts (Figure 4C–F) in the SW and FW black porgies’ POAs. Transcripts from avt were detected in the POAs of both SW and FW black porgies. Furthermore, the levels of the avt transcripts were increased in the preopticus parvocellularis of pars magnocellularis (PMmc) (Figure 4F) and the preopticus parvocellularis of pars parvocellularis (PMpc) (Figure 4F) of the FW fish on day 1 compared to the SW fish (Figure 4D). The preopticus parvocellularis of pars gigantocellularis (PMgc) revealed no differences between the SW (Figure 4D) and FW fish (Figure 4F) on day 1. There were no signals in the SW and FW fish when using the respective control sense probes of avt on day 1 (Figure 4C,E).

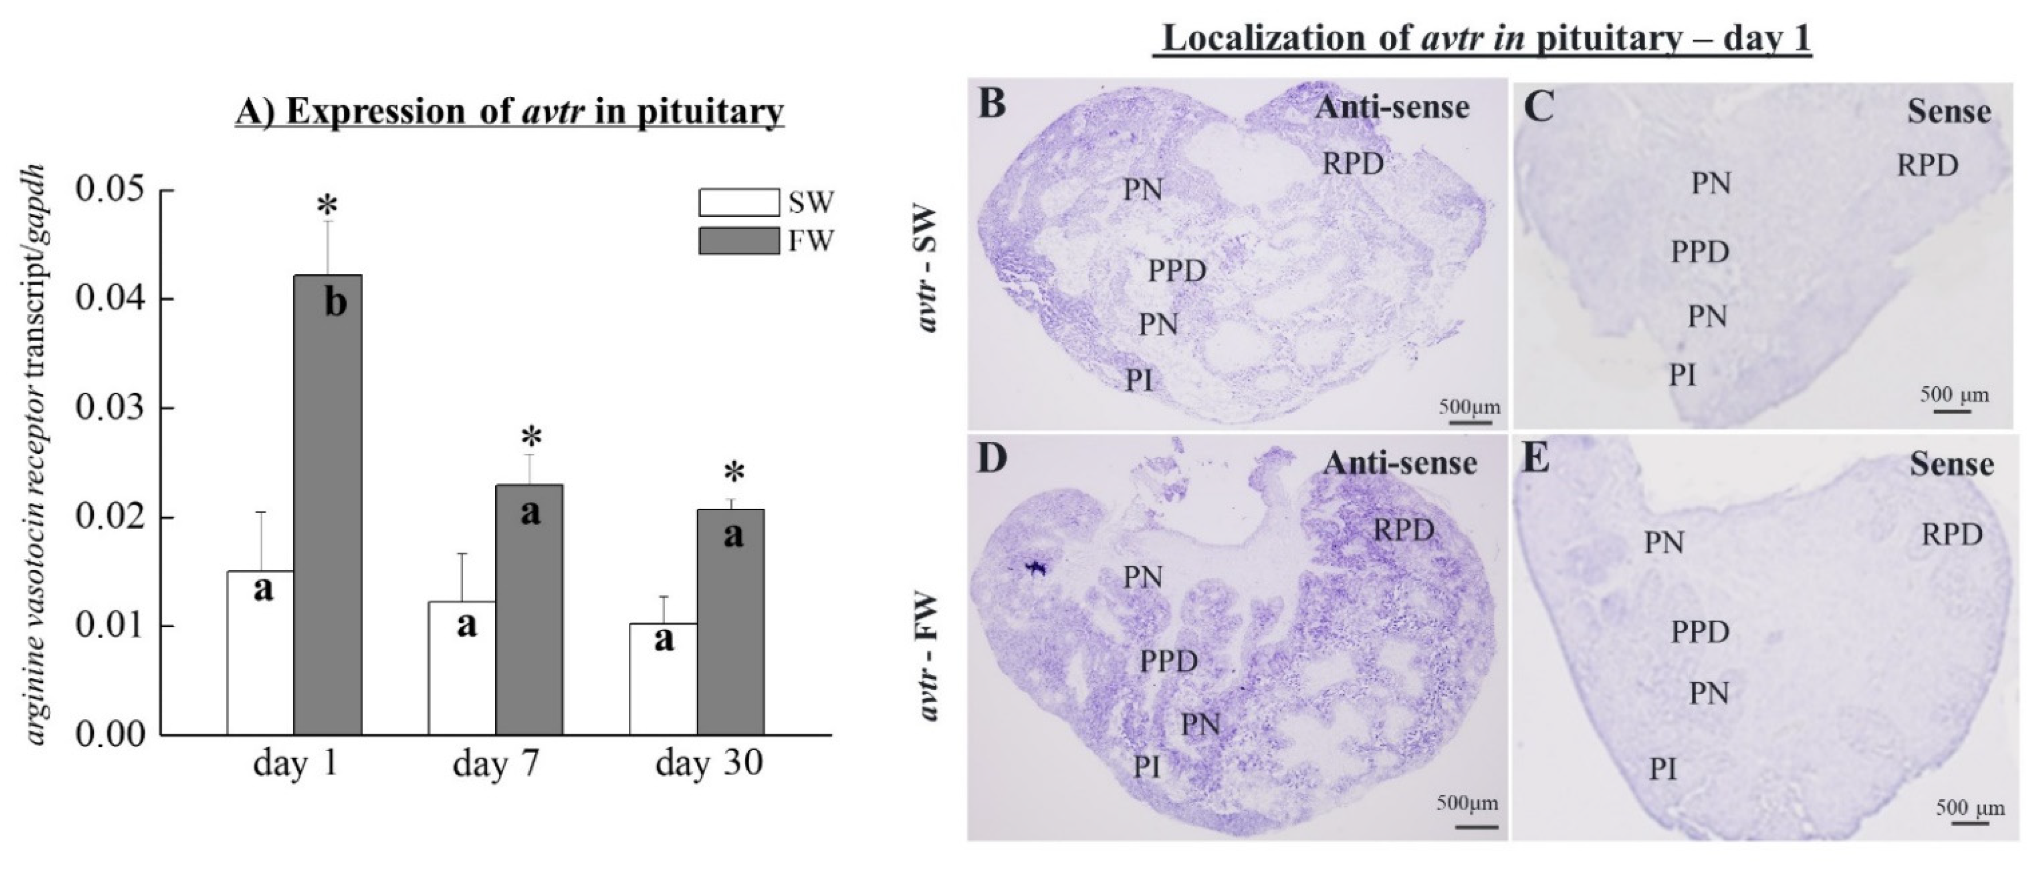
3.5. The Expression of avtr Transcripts in the Pituitary

The transcripts of avtr were detected in the pituitary (Figure 5A). The avtr transcripts were significantly increased on days 1, 7, and 30 in the pituitary of the FW fish when compared to the SW controls (increased by 4.2-fold, 2.2-fold, and 1.8-fold on days 1, 7, and 30, respectively; Figure 5A). Among the FW fish groups, the avtr mRNA was significantly decreased on day 7 and day 30 compared to the FW fish on day 1 (Figure 5A).

3.6. Localization of avtr Transcripts in Black Porgy Pituitary Glands

The avtr transcripts were detected via in situ hybridization in the RPD at both SW (Figure 5B) and FW (Figure 5D) fish. The avtr transcripts were notably increased in RPD in FW fish (Figure 5D) compared to the SW fish (Figure 5B). There were no signals detected for the control sense probes of avtr (Figure 5C,E).

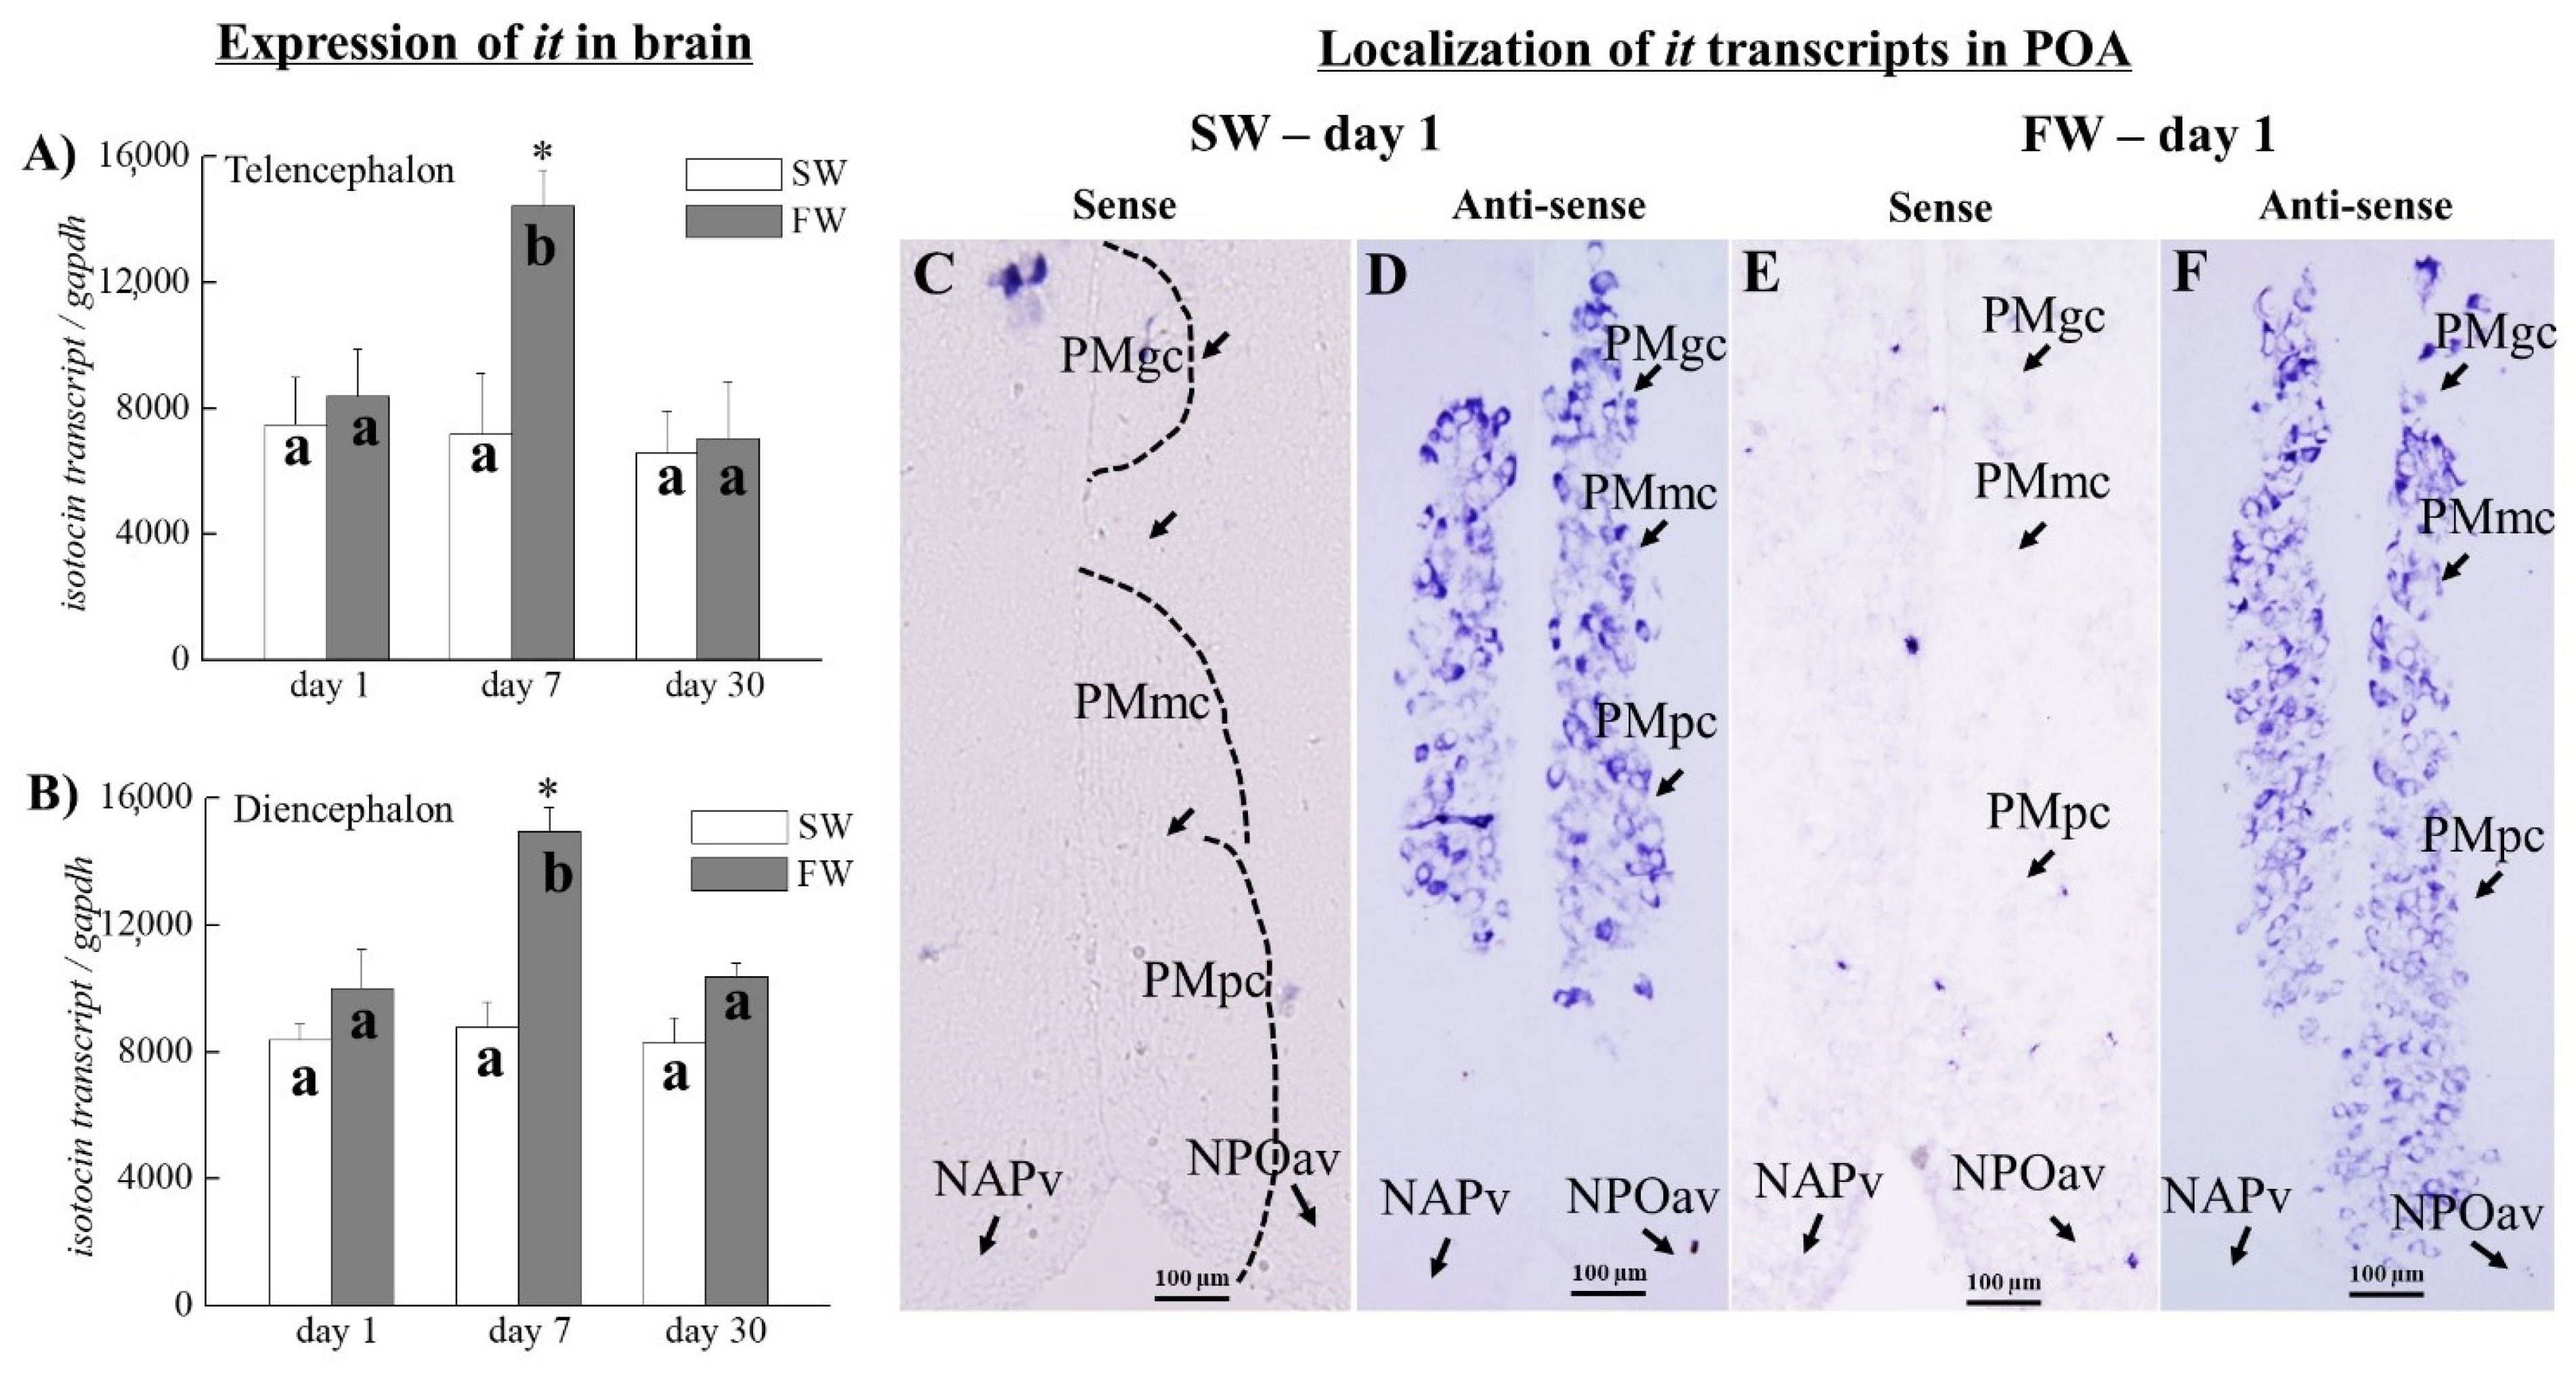
3.7. The Expression of it Transcripts in the Brain

There were no significant differences in the transcripts of it in the telencephalon and diencephalon between the SW and FW fish on days 1 and 30 (Figure 6A,B). However, the it transcripts in the telencephalon (increased by 2-fold) and diencephalon (increased by 1.71-fold) were significantly increased in the FW fish on day 7 compared to the SW fish (Figure 6A,B). Among the FW groups, it mRNA expression was significantly increased on day 7 compared to the FW fish on day 1 and day 30 in the telencephalon and diencephalon; there were no differences in the it transcripts among the SW fish on day 1, day 7, and day 30 (Figure 6A,B).

3.8. Localization of it Transcripts in the SW and FW Black Porgies’ Preoptic Areas

Transcripts of it (Figure 6D,F) were detected in the preoptic areas of the SW and FW black porgies on day 1 (Figure 6D,F). There were no differences in the intensity of it transcripts in the PMgc and PMmc, but they slightly increased in the PMpc of the FW fish on day 1 (Figure 6F) compared to the PMpc of the SW fish (Figure 6D). There were no signals in the SW and FW fish when using the it control sense probes on day 1 (Figure 6C,E).

3.9. The Expression of itr Transcripts in the Pituitary

The transcripts of itr in the pituitary were increased by the osmotic stress on day 1, day 7, and day 30 (by 6.6-fold, 4-fold, and 9-fold, respectively; Figure 7A) compared to control SW fish. The itr mRNA increased significantly on day 1 and day 30 in FW fish compared to FW fish on day 7 in the pituitary (Figure 7A).

3.10. Localization of itr Transcripts in the SW and FW Black Porgies’ Pituitary Glands

The in situ hybridization showed that transcripts of itr were detected in the pituitary of the SW (Figure 7B) and FW (Figure 7D) black porgy on day 1. The itr transcripts were increased in the RPD on day 1 of the FW fish (Figure 7D) compared to SW fish (Figure 7B). There were no signals detected in the SW and FW fish when using itr control sense probes on day 1 (Figure 7C,E).

4. Discussion

We developed an experimental system to understand the molecular and cell level associations of neurohypophysial peptides (avt, it) and their receptors (avtr: v1a, itr: itr1) in the brains and pituitaries of black porgies during SW and FW acclimation by Q-PCR and in situ hybridization analysis. There is limited information on the localization of avt, it, and their receptors in the brain (telencephalon and diencephalon) and pituitary over a serial time course exposure to osmotic stress (e.g., day 1 [acute], day 7 [acclimation], and day 30 [chronic]).
A single cDNA encoding avt, avtr, it, and itr was cloned and sequenced in the brain of a black porgy in this study. The nucleotide sequences of avt, avtr, it, and itr showed homology at multiple nucleotide locations that are linked to the Sparus aurata sequence [47]. According to the comparatively phylogenetic analysis, Avtr and Itr sequences clustered into two V1-type receptors (Avtrv1a and Avtrv1b) and two V2-type receptors (Avtrv2a and Avtrv2b), and two Itr (Itr1 and Itr 2) (Figure 2). Our black porgy Avtr and Itr were clustered with the clad of Avtrv1a and Itr1 (Figure 2). Our data clearly provided a more specific phylogenetic tree among various fish species as compared to previous studies [15,48,49].
The serum osmolality levels were significantly decreased within the FW black porgy on day 1 and 30. In the SW fish, serum osmolality was significantly higher than in the FW fish, as reported in previous studies of rabbitfish (Siganus rivulants) [50], black porgy [40], and spotted tail goby (Synechogobius ommaturus) [51]. The study by Kammerer et al. (2010) [52] showed that plasma cortisol increased rapidly within 3 h of SW transfer and remained elevated for three days. They then returned to basal levels similar to gilthead sea bream (Sparus aurata) in FW [37]. Studies of Oreochromis mossambicus suggested that serum cortisol levels increased when the tilapia were transferred from SW to FW [52,53]. The level of serum cortisol significantly increased on day 1 and returned to normal on days 7 and 30, suggesting that the black porgy only needs a brief time interval (less than 7 days) to acclimate osmotic stress.
At various time points following FW transfer, we characterized the avt and it mRNA in the brain and the avtr (v1a) and itr mRNA (itr1) in the pituitary. We found increased levels of avt mRNA in the diencephalon and telencephalon and avtr and itr mRNA in the pituitary, together with an increased serum cortisol level on day 1 in the FW fish. This implies that brain avt undergoes action through the pituitary avtr or itr and releases the final product of the HPI axis, i.e., cortisol. This suggests that avt could trigger the HPI axis during osmoregulatory stress in black porgy. Avt triggers the stress response in gilthead seabream after a low dose of cortisol [35,36]. Few studies have looked at avt and it in the teleost diencephalon, telencephalon, preoptic area, and other regions outside of the preoptic nuclei and hypothalamus by Q-PCR and in situ hybridization in association with the social behavior or diurnal profiles [54,55,56]. Importantly, the avt preprohormone mRNA was found in multiple regions of the brain, such as the olfactory bulb, preoptic area, hypothalamus, and also dorsomedial, ventral, and central regions of the telencephalon, suggesting the possible involvement in the behavioral regulation in African cichlid fish (Astatotilapia burtoni) [56].
Endogenous cortisol influences Avt and It secretion from pituitary cells in gilthead sea bream [57]. Cadiz et al. (2015) [37] reported that the avt and it levels were progressively elevated in the pituitary collaterally with high hypothalamic avt and it expression at 24 h post-injection in a cortisol-treated group of gilthead sea bream. Elevated plasma Avt levels were found in gilthead sea bream [29] and flounder [58] exposed to a rapid osmotic challenge. Hypothalamic avt transcripts increased two days after transferring dogfish (Triakis scyllium) to high salinity water (45.5‰), [59]. The decreased avt mRNA expression in FW fish at days 7 and 30 may result from negative feedback of the HPI axis or an increase in cortisol content that de-sensitizes the telencephalon avt mRNAs in black porgy. In teleosts, corticotropin-releasing hormone (crh) and avt are synergized to stimulate acth release from the anterior pituitary [60]. The final product of the stress axis, cortisol, is suggested to stimulate both glucocorticoid and mineralocorticoid receptors in fish [43,44,53].
The it mRNA from the telencephalon and diencephalon increased on day 7 in the FW group compared to their respective baseline groups. These results revealed that the it mRNA may also be involved in triggering the HPI axis in black porgies after initial acclimation. This compensation may allow fish to stay in homeostasis during prolonged osmotic stress. The HPI axis’s negative feedback may have contributed to the lower serum cortisol levels. Exogenous Avt decreased the storage of pituitary It in gilthead sea bream, and itr expression was enhanced [48]. Compared to the corresponding controls, avtr and itr transcripts were consistently increased in the pituitary on day 1, day 7, and day 30 upon FW transfer in the current investigation. The itr in the pituitary could interact with glucocorticoid receptors for maintenance of homeostasis in black porgies under various osmotic stress conditions.
We found that the hybridization signals for avt and it transcripts were in the PMgc, PMmc, and PMpc of the POA in the SW and FW groups. Interestingly, the intensities of the avt and it mRNA hybridization signals were strong in the PMmc and PMpc of the black porgy POAs during FW acclimation compared to the respective SW fish on day 1. Our data suggest that the PMmc and PMpc neurons (especially the PMpc) are involved in coping with the external osmotic stress in the FW-acclimated fish. In contrast, avt and it mRNAs were expressed similarly in the PMgc during SW and FW acclimation.
A number of previous studies have reported that these nuclei are associated with distinct physiological functions. The PMgc responds to acute stress [61]; the PMmc is involved in blood pressure, osmoregulation, and also the response to acute stress [22,61]; and the PMpc nuclei are involved in stress and the release of the stress hormones [19,62]. In rainbow trout, acute confinement stress was associated with enhanced Avt production in the parvocellular neurons of the preoptic nucleus [21]. Following water deprivation, increased expression of avt transcripts and Avt in the paraventricular nucleus suggests that osmotic stress induces transcription of the avt gene in hypothalamic neurons in the quail brain [63]. A recent study found that acute air exposure stress changes avt and it expression in the hypothalamus and their receptors in the pituitary gland in gilthead sea bream [36]. Overall, our data confirm that avt and it expressed in the teleost brain indicate that these neuropeptides are modulated under multiple physiological processes [13,64].
The avtr and itr mRNA hybridization signals were detected at rostral pars distalis of the black porgy pituitary. The Avt binding sites in white suckers (Catostomus commersoni) have been discovered in the area occupied by corticotrope cells [65]. The V1a-type receptors were highly expressed in the RPD of the pituitary [66]. The V1b-type receptor is also found in the anterior pituitary glands of mammals [67] and avian species [68], which is where ACTH cells are found. The V1a-type receptor mRNA has been found in the anterior pituitary glands of bullfrogs [69] similar to our findings. The expression of V1 and V2-type receptors is species-specific, time-dependent, and changes based on the type of stress. There are only limited studies about the expression and localization of itr in the pituitary. The itr1 and itr2 mRNA and proteins are also expressed in rice field eels [8]. The it may regulate osmoregulation via itr1, but not itr2 in eels [70]. The itr1 and itr2 immunoreactive cells are localized in different areas of the eel’s pituitary [70]. Based on the current interesting data, in the future, we should further extend the studies of osmotic stress to other types of itr and avtr in black porgy.

5. Conclusions

In summary, we report here the differential expression and localization of avt, avtr, it, and itr after FW transfer at different time points. We showed changes in the expression of avt and it and their receptors (avtr: v1a, itr: itr1). We also evaluated mRNA expression and localization in the brain together with serum cortisol levels during various times after exposure to osmotic stress. Expression levels of the avt and it transcripts were differentially sensitive to the external salinity and different exposure times. Furthermore, the avt and it positive neurons and the intensity of the hybridization signals increased in the PMpc of the preoptic area after FW transfer. The avt and avtr/itr (day 1) responded at the time of initial exposure, but only after it (day 7) and avtr/itr (day 7 and day 30) took over to respond to the osmotic stress. Our data confirm that these neurohypophysial peptides are necessary during osmotic stress and are important for homeostasis in black porgy.

Supplementary Materials

The following are available online at https://www.mdpi.com/article/10.3390/cells10113086/s1, Figure S1: The expression (n = 8 in each data) of internal control gene gapdh (glyceraldehyde 3-phosphate dehydrogenase, GenBank accession no: DQ399798) in black porgy acclimated to seawater (SW) and freshwater (FW). No significant difference (denoted with a) of gapdh transcripts was found between SW and FW fish. No significant changes (denoted with a) of gapdh transcripts were observed on day 1, 7, and 30. Figure S2: Multiple alignments of the nucleotide sequences of it (black porgy, Acanthopagrus schlegelii) with other teleosts. GenBank accession numbers for the nucleotide sequences are follows: gilthead sea bream (Sparus aurata, FR851925 it), European flounder (Platichthys flesus, AB036518 it), sebase clownfish (Amphipirion sebar, KP260906 it), cichlid fish (Haplochromis burtoni, GQ288466 it), multicolour rainbowfish (Parajulis poecilepterus, DQ073095 it), spotty warsse (Notolabrus celidotus, MK252281 it). The boxes represent the ATG start codon and underlines represent the stop codon. The symbols “*”, “.”, and “:” denote the identity, single nucleotide variation, and more than one nucleotide variation among fish species, respectively. Figure S3: Multiple alignments of the nucleotide sequences of itr (black porgy, Acanthopagrus schlegelii) with other teleosts. GenBank accession numbers for the nucleotide sequences are follows: gilthead sea bream (Sparus aurata, KC195973 itr), Asian swamp eel (Monoppterus albus, MF996357 itr), sheepshead minnow (Cyprinodon variegatus, KX061748 itr), amargosa pupfish (Cyprinodon nevadensis, GQ981415 itr), medaka (Oryzias latipes, AB646240 itr). The boxes represent the ATG start codon and underlines represent the stop codon. The symbols “*”, “:”, and “:” denote the identity, single nucleotide variation, and more than one nucleotide variation among fish species, respectively. Figure S4: Multiple alignments of the nucleotide sequences of avt (black porgy, Acanthopagrus schlegelii) with other teleosts. GenBank accession numbers for the nucleotide sequences are follows: gilthead sea bream (Sparus aurata, FR851924), orange spotted grouper (Epinephelus coioides, GU831571), European flounder (Platichthys fleus, AB036517), Chinese warasse (Halichoeres tenuispinis, GU212654), olive flunder (Paralicthys olivaceus, AB856411). The boxes represent the ATG start codon and underlines represent the stop codon. The symbols “*”, “.”, and “:” denote the identity, single nucleotide variation, and more than one nucleotide variation among fish species, respectively. Figure S5: Multiple alignments of the nucleotide sequences of avtr (black porgy, Acanthopagrus schlegelii) with other teleosts. GenBank accession numbers for the nucleotide sequences are follows: orange spotted grouper (Epinephelus coioides, GU929704), clown anemonefish (Amphiprion ocellaris, AB597955), olive flounder (Paralicthys olivaeus, EF451960), threespot wrasse (Halichores trimaculatus, AB642257), medaka (Oryzias latipes, NM001308987). The boxes represent the ATG start codon and underlines represent the stop codon. The symbols “*”, “.”, and “:” denote the identity, single nucleotide variation, and more than one nucleotide variation among fish species, respectively.

Author Contributions

A.A., G.N. and C.-F.C. conceived and designed experiments. A.A., C.-J.L., G.N. and C.-F.C. wrote the manuscript. A.A. and G.N. collected samples. A.A., G.N. and C.-J.L. performed the experiments and data analysis. A.A., C.-J.L., G.N. and C.-F.C. provided intellectual input for the paper. All authors have read and agreed to the published version of the manuscript.

Funding

This research was partially supported by the Academia Sinica Project (AS-99-TP-B05, AS-101-TP-B01), Taiwan.

Institutional Review Board Statement

All procedures and investigations were approved by the College of Life Science of the National Taiwan Ocean University Institutional Animal Care and Use Committee, and performed in accordance with standard guiding principles (#99026).

Informed Consent Statement

Not applicable.

Data Availability Statement

Data are contained within this article. Raw data are available on request from the corresponding authors.

Conflicts of Interest

The authors declare no conflict of interest.

References

  1. Kulczykowska, E.; Gozdowska, M.; Martos-Sitcha, J.; Kalamarz, H.; Nietrzeba, M.; Mancera, J.; Martínez-Rodríguez, G. Melatonin, vasotocin and isotocin as biomarkers of the condition of fish. Comp. Biochem. Physiol. Part A Mol. Integr. Physiol. 2010, 157, S18. [Google Scholar] [CrossRef]
  2. Du Vigneaud, V. Hormones of the posterior pituitary gland: Oxytocin and vasopressin. Harvey Lect. 1954, 50, 1–26. [Google Scholar]
  3. Du Vigneaud, V.; Ressler, C.; Swan, C.J.M.; Roberts, C.W.; Katsoyannis, P.G.; Gordon, S. The synthesis of an octapeptide amide with the hormonal activity of oxytocin. J. Am. Chem. Soc. 1953, 75, 4879–4880. [Google Scholar] [CrossRef]
  4. Balment, R.; Lu, W.; Weybourne, E.; Warne, J. Arginine vasotocin a key hormone in fish physiology and behaviour: A review with insights from mammalian models. Gen. Comp. Endocrinol. 2006, 147, 9–16. [Google Scholar] [CrossRef]
  5. Goodson, J.L. Nonapeptides and the evolutionary patterning of sociality. Prog. Brain Res. 2008, 170, 3–15. [Google Scholar] [CrossRef] [Green Version]
  6. Kline, R.J.; O’Connell, L.; Hofmann, H.; Holt, G.J.; Khan, I.A. The distribution of an AVT V1a receptor in the brain of a sex changing fish, Epinephelus adscensionis. J. Chem. Neuroanat. 2011, 42, 72–88. [Google Scholar] [CrossRef]
  7. Acher, R. Neurohypophysial peptide systems: Processing machinery, hydroosmotic regulation, adaptation and evolution. Regul. Pept. 1993, 45, 1–13. [Google Scholar] [CrossRef]
  8. Babiker, M.M.; Rankin, J.C. Neurohypophysial hormonal control of kidney function in the European eel (Anguilla anguilla L.) adapted to sea-water or fresh water. J. Endocrinol. 1978, 76, 347–358. [Google Scholar] [CrossRef]
  9. Bentley, P.J. Endocrines and osmoregulation: A comparative account of the regulation of water and salt in vertebrates. In Zoophysiology and Ecology; Hoar, W.S., Jacobs, J., Langer, H., Lindauer, M., Eds.; Springer: New York, NY, USA, 1971; Volume 1, pp. 199–254. [Google Scholar]
  10. Goodson, J.L.; Bass, A.H. Social behavior functions and related anatomical characteristics of vasotocin/vasopressin systems in vertebrates. Brain Res. Rev. 2001, 35, 246–265. [Google Scholar] [CrossRef]
  11. Warne, J.; Harding, K.; Balment, R. Neurohypophysial hormones and renal function in fish and mammals. Comp. Biochem. Physiol. Part B Biochem. Mol. Biol. 2002, 132, 231–237. [Google Scholar] [CrossRef]
  12. Bentley, P.J. Endocrines and Osmoregulation: A Comparative Account in Vertebrates, 2nd ed.; Bradshaw, S.D., Burggren, W., Heller, H.C., Ishii, S., Langer, H., Neuweiler, G., Randall, D.J., Eds.; Springer: Berlin/Heidelberg, Germany; New York, NY, USA, 2002; Volume 1. [Google Scholar]
  13. Holmgvist, B.I.; Ekström, P. Hypophysiotrophic systems in the brain of the Atlantic salmon. Neuronal innervation of the pituitary and the origin of pituitary dopamine and nonapeptides identified by means of combined carbocyanine tract tracing and immunocytochemistry. J. Chem. Neuroanat. 1995, 8, 125–145. [Google Scholar] [CrossRef]
  14. Hausmann, H.; Meyerhof, W.; Zwiers, H.; Lederis, K.; Richter, D. Teleost isotocin receptor: Structure, functional expression, mRNA distribution and phylogeny. FEBS Lett. 1995, 370, 227–230. [Google Scholar] [CrossRef] [Green Version]
  15. Lema, S.C. Identification of multiple vasotocin receptor cDNAs in teleost fish: Sequences, phylogenetic analysis, sites of expression, and regulation in the hypothalamus and gill in response to hyperosmotic challenge. Mol. Cell. Endocrinol. 2010, 321, 215–230. [Google Scholar] [CrossRef] [Green Version]
  16. Almeida, O.; Gozdowska, M.; Kulczykowska, E.; Oliveira, R. Brain levels of arginine-vasotocin and isotocin in dominant and subordinate males of a cichlid fish. Horm. Behav. 2012, 61, 212–217. [Google Scholar] [CrossRef] [Green Version]
  17. Lema, S.C.; Sanders, K.E.; Walti, K.A. Arginine Vasotocin, Isotocin and Nonapeptide Receptor Gene Expression Link to Social Status and Aggression in Sex-Dependent Patterns. J. Neuroendocr. 2015, 27, 142–157. [Google Scholar] [CrossRef]
  18. Lema, S.C.; Wagstaff, L.J.; Gardner, N.M. Diurnal rhythms of behavior and brain mRNA expression for arginine vasotocin, isotocin, and their receptors in wild Amargosa pupfish (Cyprinodon nevadensis amargosae). Mar. Freshw. Behav. Physiol. 2010, 43, 257–281. [Google Scholar] [CrossRef] [Green Version]
  19. Acher, R. Molecular Evolution of Fish Neurohypophysial hormones: Neutral and selective evolutionary mechanisms. Gen. Comp. Endocrinol. 1996, 102, 157–172. [Google Scholar] [CrossRef]
  20. Balment, R.J.; Warne, J.M.; Tierney, M.; Hazon, N. Arginine vasotocin and fish osmoregulation. Fish Physiol. Biochem. 1993, 11, 189–194. [Google Scholar] [CrossRef]
  21. Gilchriest, B.J.; Tipping, D.R.; Hake, L.; Levy, A.; Baker, B.I. The effects of acute and chronic stresses on vasotocin gene transcripts in the brain of the rainbow trout (Oncorhynchus mykiss). J. Neuroendocr. 2001, 12, 795–801. [Google Scholar] [CrossRef]
  22. Godwin, J.; Sawby, R.; Warner, R.; Crews, D.; Grober, M.S. Hypothalamic arginine vasotocin mRNA abundance variation across sexes and with sex change in a coral reef fish. Brain Behav. Evol. 2000, 55, 77–84. [Google Scholar] [CrossRef]
  23. Haruta, K.; Yamashita, T.; Kawashima, S. Changes in arginine vasotocin content in the pituitary of the medaka (Oryzia latipes) during osmotic stress. Gen. Comp. Endocrinol. 1991, 83, 327–336. [Google Scholar] [CrossRef]
  24. Hyodo, S.; Urano, A. Changes in expression of provasotocin and proisotocin genes during adaptation to hyper- and hypo-osmotic environments in rainbow trout. J. Comp. Physiol. B 1991, 161, 549–556. [Google Scholar] [CrossRef]
  25. Maetz, J.; Lahlou, B. Actions of neurohypophysial hormones in fishes. In Handbook of Physiology-Section 7 Endocrinology; American Physiology Society: Washington, DC, USA, 1974; Volume 4, pp. 521–544. [Google Scholar]
  26. Perrott, M.; Carrick, S.; Balment, R. Pituitary and plasma arginine vasotocin levels in teleost fish. Gen. Comp. Endocrinol. 1991, 83, 68–74. [Google Scholar] [CrossRef]
  27. Warne, J.; Balment, R. Changes in Plasma Arginine Vasotocin (AVT) Concentration and dorsal aortic blood pressure following AVT injection in the teleost Platichthys flesus. Gen. Comp. Endocrinol. 1997, 105, 358–364. [Google Scholar] [CrossRef]
  28. Warne, J.; Hyodo, S.; Harding, K.; Balment, R. Cloning of pro-vasotocin and pro-isotocin cDNAs from the flounder Platichthys flesus; Levels of hypothalamic mRNA following acute osmotic challenge. Gen. Comp. Endocrinol. 2000, 119, 77–84. [Google Scholar] [CrossRef]
  29. Kulczykowska, E. Responses of circulating arginine vasotocin, isotocin, and melatonin to osmotic and disturbance stress in rainbow trout (Oncorhynchus mykiss). Fish Physiol. Biochem. 2001, 24, 201–206. [Google Scholar] [CrossRef]
  30. Kulczykowska, E. Response of circulating arginine vasotocin and isotocin to rapid osmotic challenge in rainbow trout. Comp. Biochem. Physiol. Part A Physiol. 1997, 118, 773–778. [Google Scholar] [CrossRef]
  31. Warne, J.; Bond, H.; Weybourne, E.; Sahajpal, V.; Lu, W.; Balment, R. Altered plasma and pituitary arginine vasotocin and hypothalamic provasotocin expression in flounder (Platichthys flesus) following hypertonic challenge and distribution of vasotocin receptors within the kidney. Gen. Comp. Endocrinol. 2005, 144, 240–247. [Google Scholar] [CrossRef]
  32. Guibbolini, M.E.; Henderson, I.W.; Mosley, W.; Lahlou, B. Arginine vasotocin binding to isolated branchial cells of the eel: Effect of salinity. J. Mol. Endocrinol. 1988, 1, 125–130. [Google Scholar] [CrossRef]
  33. Guibbolini, M.E.; Avella, M. Neurohypophysial hormone regulation of Cl-secretion: Physiological evidence for V1-type receptors in sea bass gill respiratory cells in culture. J. Endocrinol. 2003, 176, 111–119. [Google Scholar] [CrossRef] [Green Version]
  34. Chou, M.-Y.; Hung, J.-C.; Wu, L.-C.; Hwang, S.-P.L.; Hwang, P.-P. Isotocin controls ion regulation through regulating ionocyte progenitor differentiation and proliferation. Cell. Mol. Life Sci. 2010, 68, 2797–2809. [Google Scholar] [CrossRef] [PubMed] [Green Version]
  35. Martos-Sitcha, J.A.; Cádiz, L.; Gozdowska, M.; Kulczykowska, E.; Martinez-Rodriguez, G.; Mancera, J.M. Arginine vasotocin and cortisol co-regulate vasotocinergic, isotocinergic, stress, and thyroid pathways in the gilthead sea bream (Sparus aurata). Front. Physiol. 2019, 10, 261. [Google Scholar] [CrossRef] [PubMed] [Green Version]
  36. Skrzyńska, A.K.; Maiorano, E.; Bastaroli, M.; Naderi, F.; Míguez, J.M.; Martinez-Rodriguez, G.; Mancera, J.M.; Martos-Sitcha, J.A. Impact of air exposure on vasotocinergic and isotocinergic systems in gilthead sea bream (Sparus aurata): New insights on fish stress response. Front. Physiol. 2018, 9, 96. [Google Scholar] [CrossRef] [PubMed] [Green Version]
  37. Cadiz, L.; Roman-Padilla, J.; Gozdowska, M.; Kulczykowska, E.; Martinez-Rodriguez, G.; Mancera, J.M.; Martos-Sitcha, J.A. Cortisol modulates vasotocinergic and isotocinergic pathways in the gilthead sea bream (Sparus aurata, Linnaeus 1758). J. Exp. Biol. 2015, 218, 316–325. [Google Scholar] [CrossRef] [Green Version]
  38. Wu, G.-C.; Chang, C.-F. Primary males guide the femaleness through the regulation of testicular Dmrt1 and ovarian Cyp19a1a in protandrous black porgy. Gen. Comp. Endocrinol. 2018, 261, 198–202. [Google Scholar] [CrossRef]
  39. Wu, G.-C.; Dufour, S.; Chang, C.-F. Molecular and cellular regulation on sex change in hermaphroditic fish, with a special focus on protandrous black porgy, Acanthopagrus schlegelii. Mol. Cell. Endocrinol. 2021, 520, 111069. [Google Scholar] [CrossRef] [PubMed]
  40. Tomy, S.; Chang, Y.-M.; Chen, Y.-H.; Cao, J.-C.; Wang, T.-P.; Chang, C.-F. Salinity effects on the expression of osmoregulatory genes in the euryhaline black porgy Acanthopagrus schlegeli. Gen. Comp. Endocrinol. 2009, 161, 123–132. [Google Scholar] [CrossRef] [PubMed]
  41. Aruna, A.; Wang, T.S.; Cao, J.C.; Lan, D.S.; Nagarajan, G.; Chang, C.F. Differntiation expresssion of hypothalamic- and gill-crh system with osmotic stress in the erythaline black porgy, Acanthopagrus schlegeli. Front. Physiol. 2021, in press. [Google Scholar] [CrossRef]
  42. Nagarajan, G.; Aruna, A.; Chang, C.-F. Neuropeptide arginine vasotocin positively affects neurosteroidogenesis in the early brain of grouper, Epinephelus coioides. J. Neuroendocr. 2015, 27, 718–736. [Google Scholar] [CrossRef]
  43. Aruna, A.; Nagarajan, G.; Chang, C.-F. Involvement of corticotrophin-releasing hormone and corticosteroid receptors in the brain-pituitary-gill of tilapia during the course of seawater acclimation. J. Neuroendocr. 2012, 24, 818–830. [Google Scholar] [CrossRef]
  44. Aruna, A.; Nagarajan, G.; Chang, C.-F. Differential expression patterns and localization of glucocorticoid and mineralocorticoid receptor transcripts in the osmoregulatory organs of tilapia during salinity stress. Gen. Comp. Endocrinol. 2012, 179, 465–476. [Google Scholar] [CrossRef] [PubMed]
  45. Muñoz-Cueto, J.A.; Sarasquete, C.; Zohar, Y.; Kah, O. An Atlas of the Brain of the Gilthead Seabream (Sparus aurata); Maryland Sea Grant: College Park, MD, USA, 2001. [Google Scholar]
  46. Lin, C.-J.; Fan-Chiang, Y.-C.; Dufour, S.; Chang, C.-F. Activation of brain steroidogenesis and neurogenesis during the gonadal differentiation in protandrous black porgy, Acanthopagrus schlegelii. Dev. Neurobiol. 2016, 76, 121–136. [Google Scholar] [CrossRef] [PubMed]
  47. Martos-Sitcha, J.A.; Martinez-Rodriguez, G.; Mancera, J.M.; Fuentes, J. AVT and IT regulate ion transport across the opercular epithelium of killifish (Fundulus heteroclitus) and gilthead sea bream (Sparus aurata). Comp. Biochem. Physiol. Part A Mol. Integr. Physiol. 2015, 182, 93–101. [Google Scholar] [CrossRef] [Green Version]
  48. Martos-Sitcha, J.; Fuentes, J.; Mancera, J.; Martinez-Rodriguez, G. Variations in the expression of vasotocin and isotocin receptor genes in the gilthead sea bream Sparus aurata during different osmotic challenges. Gen. Comp. Endocrinol. 2014, 197, 5–17. [Google Scholar] [CrossRef] [PubMed] [Green Version]
  49. An, K.W.; Na Kim, N.; Choi, C.Y. Cloning and expression of aquaporin 1 and arginine vasotocin receptor mRNA from the black porgy, Acanthopagrus schlegeli: Effect of freshwater acclimation. Fish Physiol. Biochem. 2007, 34, 185–194. [Google Scholar] [CrossRef]
  50. Saoud, I.P.; Kreydiyyeh, S.; Chalfoun, A.; Fakih, M. Influence of salinity on survival, growth, plasma osmolality and gill Na+–K+–ATPase activity in the rabbitfish Siganus rivulatus. J. Exp. Mar. Biol. Ecol. 2007, 348, 183–190. [Google Scholar] [CrossRef]
  51. Shui, C.; Shi, Y.; Hua, X.; Zhang, Z.; Zhang, H.; Lu, G.; Xie, Y. Serum osmolality and ions, and gill Na+/K+-ATPase of spottedtail goby Synechogobius ommaturus (R.) in response to acute salinity changes. Aquac. Fish. 2018, 3, 79–83. [Google Scholar] [CrossRef]
  52. Kammerer, B.D.; Cech, J.J.; Kültz, D. Rapid changes in plasma cortisol, osmolality, and respiration in response to salinity stress in tilapia (Oreochromis mossambicus). Comp. Biochem. Physiol. Part A Mol. Integr. Physiol. 2010, 157, 260–265. [Google Scholar] [CrossRef]
  53. Aruna, A.; Nagarajan, G.; Chang, C.-F. The acute salinity changes activate the dual pathways of endocrine responses in the brain and pituitary of tilapia. Gen. Comp. Endocrinol. 2015, 211, 154–164. [Google Scholar] [CrossRef]
  54. Greenwood, A.K.; Wark, A.R.; Fernald, R.D.; Hofmann, H.A. Expression of arginine vasotocin in distinct preoptic regions is associated with dominant and subordinate behaviour in an African cichlid fish. Proc. R. Soc. B Boil. Sci. 2008, 275, 2393–2402. [Google Scholar] [CrossRef] [Green Version]
  55. Hur, S.-P.; Takeuchi, Y.; Esaka, Y.; Nina, W.; Park, Y.-J.; Kang, H.-C.; Jeong, H.-B.; Lee, Y.-D.; Kim, S.-J.; Takemura, A. Diurnal expression patterns of neurohypophysial hormone genes in the brain of the threespot wrasse Halichoeres trimaculatus. Comp. Biochem. Physiol. Part A Mol. Integr. Physiol. 2011, 158, 490–497. [Google Scholar] [CrossRef]
  56. Rodriguez-Santiago, M.; Nguyen, J.; Winton, L.S.; Weitekamp, C.; Hofmann, H.A. Arginine vasotocin preprohormone is expressed in surprising regions of the teleost forebrain. Front. Endocrinol. 2017, 8, 195. [Google Scholar] [CrossRef] [PubMed]
  57. Kalamarz-Kubiak, H.; Meiri-Ashkenazi, I.; Kleszczyńska, A.; Rosenfeld, H. In vitro effect of cortisol and urotensin I on arginine vasotocin and isotocin secretion from pituitary cells of gilthead sea bream Sparus aurata. J. Fish Biol. 2014, 84, 448–458. [Google Scholar] [CrossRef] [PubMed]
  58. Harding, K.; Warne, J.; Hyodo, S.; Balment, R. Pituitary and plasma AVT content in the flounder (Platichthys flesus). Fish Physiol. Biochem. 1997, 17, 357–362. [Google Scholar] [CrossRef]
  59. Hyodo, S.; Tsukada, T.; Takei, Y. Neurohypophysial hormones of dogfish, Triakis scyllium: Structures and salinity-dependent secretion. Gen. Comp. Endocrinol. 2004, 138, 97–104. [Google Scholar] [CrossRef]
  60. Baker, B.I.; Bird, D.J.; Buckingham, J.C. In the trout, CRH and AVT synergize to stimulate ACTH release. Regul. Pept. 1996, 67, 207–210. [Google Scholar] [CrossRef]
  61. Bond, H.; Warne, J.; Balment, R. Effect of acute restraint on hypothalamic pro-vasotocin mRNA expression in flounder, Platichthys flesus. Gen. Comp. Endocrinol. 2007, 153, 221–227. [Google Scholar] [CrossRef]
  62. Olivereau, M.; Olivereau, J. Effect of pharmacological adrenalectomy on corticotropin-releasing factor-like and arginine vasotocin immunoreactivities in the brain and pituitary of the eel: Immunocytochemical study. Gen. Comp. Endocrinol. 1990, 80, 199–215. [Google Scholar] [CrossRef]
  63. Seth, R.; Köhler, A.; Grossmann, R.; Chaturvedi, C.M. Expression of hypothalamic arginine vasotocin gene in response to water deprivation and sex steroid administration in female Japanese quail. J. Exp. Biol. 2004, 207, 3025–3033. [Google Scholar] [CrossRef] [Green Version]
  64. Batten, T.F.; Moons, L.; Vandesande, F. Innervation and control of the adenohypophysis by hypothalamic peptidergic neurons in teleost fishes: EM immunohistochemical evidence. Microsc. Res. Tech. 1999, 44, 19–35. [Google Scholar] [CrossRef]
  65. Yulis, C.; Lederis, K. Co-localization of the immunoreactivities of corticotropin-releasing factor and arginine vasotocin in the brain and pituitary system of the teleost Catostomus commersoni. Cell Tissue Res. 1987, 247, 267–273. [Google Scholar] [CrossRef] [PubMed]
  66. Rawat, A.; Chaube, R.; Joy, K.P. In situ localization of vasotocin receptor gene transcripts in the brain-pituitary-gonadal axis of the catfish Heteropneustes fossilis: A morpho-functional study. Fish Physiol. Biochem. 2018, 45, 885–905. [Google Scholar] [CrossRef] [PubMed]
  67. Antoni, F.A. Hypothalamic Control of adrenocorticotropin secretion: Advances since the discovery of 41-residue corticotropin-releasing factor. Endocr. Rev. 1986, 7, 351–378. [Google Scholar] [CrossRef] [PubMed]
  68. Jurkevich, A.; Berghman, L.R.; Cornett, L.E.; Kuenzel, W.J. Immunohistochemical characterization of chicken pituitary cells containing the vasotocin VT2 receptor. Cell Tissue Res. 2008, 333, 253–262. [Google Scholar] [CrossRef] [PubMed]
  69. Acharjee, S.; Do-Rego, J.; Oh, D.; Moon, J.; Ahn, R.; Lee, K.; Bai, D.; Vaudry, H.; Kwon, H.; Seong, J. Molecular cloning, pharmacological characterization, and histochemical distribution of frog vasotocin and mesotocin receptors. J. Mol. Endocrinol. 2004, 33, 293–313. [Google Scholar] [CrossRef] [PubMed] [Green Version]
  70. Yang, W.; Zhang, N.; Shi, B.; Zhang, S.; Zhang, L.; Zhang, W. Isotocin Regulates growth hormone but not prolactin release from the pituitary of ricefield eels. Front. Endocrinol. 2018, 9, 166. [Google Scholar] [CrossRef] [Green Version]
Figure 1. A schematic diagram showing the lateral view of a black porgy brain. DE, diencephalon; HB, hindbrain; HYP, hypothalamus; ME, mesencephalon; MO, medulla oblongata; OB, olfactory bulb; OC, optic chiasm; POA, preoptic area; and TE, telencephalon.
Cells 10 03086 g001
Figure 2. A neighbor-joining (NJ) phylogenetic tree of neurohypophysial hormone receptor amino acids. The phylogenetic tree was constructed based on the alignment of 38 partial amino acid sequences of Avtr and Itr from selected fishes using the neighbor-joining method with pairwise deletion and 1000 bootstrap replicates. The number shown at each branch node indicates the bootstrap value (%); only values and branching above 50% are shown. This tree was rooted using the sequence of octopressin receptor from an octopus and shows major branches of two V1-type receptors (Avtrv1a and Avtrv1b), two V2-type receptors (Avtrv2a and Avtrv2b), and two It receptors (Itr1 and Itr2). The cloned sequences from black porgy were grouped into Avtrv1a and Itr1, and are illustrated. Scientific names of fishes and GenBank accession numbers of sequences are shown in figure.
Cells 10 03086 g002
Figure 3. (A) Analysis of the serum osmolality and (B) serum cortisol in FW and SW black porgy on days 1, 7, and 30 (n = 8, in each group). The results are expressed as mean ± SEM (standard error of mean). Different letters indicate significant a difference between sampling points with the same treatment; asterisks (*) show differences between groups at the same time points (two-way ANOVA followed by Tukey’s test, p < 0.05).
Cells 10 03086 g003
Figure 4. Q-PCR was performed to analyze the transcripts of avt in the telencephalon (A) and diencephalon (B) of SW and FW black porgies on day 1, day 7, and day 30 (n = 8 in each group). Gene expression was normalized to the control (gapdh) gene. The results are expressed as mean ± SEM. Different letters indicate a significant difference between sampling points with the same treatment; asterisks (*) show differences between groups at the same time point (two-way ANOVA followed by Tukey’s test, p < 0.05). (CF) Localization of avt transcripts in SW and FW black porgies’ preoptic areas (POA) on day 1 (n = 4 in each group). The transcripts of avt (D,F) were detected in both SW and FW fish. Furthermore, the avt transcripts were increased in PMmc and PMpc of the FW fish (F) compared to the SW fish (D). No difference was found between SW (D) and FW (F) fish in PMgc on day 1. One of the representative fish from each group was used for the histological data. There were no signals detected in the SW (C) and FW (E) fish when using the respective control sense probes of avt on day 1. PMgc: preopticus parvocellularis of pars gigantocellularis; PMmc: preopticus parvocellularis of pars magnocellularis; PMpc: preopticus parvocellularis of pars parvocellularis; NAPv: nucleus anterioris periventricularis; and NPOav: anteroventralis nucleus preopticus.
Cells 10 03086 g004
Figure 5. (A) Q-PCR analyzed the transcripts of avtr in the pituitaries of SW and FW black porgies on day 1, day 7, and day 30 (n = 8 in each group). Gene expression was normalized to the control (gapdh) gene. The results are expressed as mean ± SEM. Different letters indicate a significant difference between sampling points with the same treatment; asterisks (*) show differences between groups at the same time point; (two-way ANOVA followed by Tukey’s test, p < 0.05). (BE) In situ hybridization of avtr in black porgy pituitary (n = 4). The avtr transcripts were detected in the RPD of the FW (D) pituitary compared to the SW fish (B). There were no signals detected in the SW and FW fish when using the respective control sense probes of avtr on day 1 (C,E). RPD: rostral pars distalis; PPD: proximal pars distalis; PI: pars intermedia; and PN: pars nervosa.
Cells 10 03086 g005
Figure 6. (A,B) Q-PCR was performed to analyze the transcripts of it in telencephalon (A) and diencephalon (B) of SW and FW black porgies on day 1, day 7, and day 30 (n = 8 in each group). Gene expression was normalized to the control (gapdh) gene. The results are expressed as mean ± SEM. Different letters indicate a significant difference between sampling points with the same treatment; asterisks (*) show differences between groups at the same time point (two-way ANOVA followed by Tukey’s test, p < 0.05). (CF) The localization study (n = 4 in each group) of it transcripts revealed them in the preoptic areas (POAs) of the SW (D) and FW (F) black porgies on day 1. There were no differences in the it transcripts in PMgc and PMmc, but these increased in PMpc on day 1 of FW (F) compared to the SW control (D). One of the representative fish from each group is presented for histological data. There were no signals detected in the SW and FW fish when using the it respective control sense probes on day 1 (C,E). PMgc: preopticus parvocellularis of pars gigantocellularis; PMmc: preopticus parvocellularis of pars magnocellularis; and PMpc: preopticus parvocellularis of pars parvocellularis. NAPv: nucleus anterioris periventrcularis; and NPOav: anteroventralis nucleus preopticus.
Cells 10 03086 g006
Figure 7. (A) Q-PCR analyzed the transcripts of itr (A) in the pituitary glands of SW and FW black porgies on day 1, day 7, and day 30 (n = 8, in each group). Gene expression was normalized to the control (gapdh) gene. The results are expressed as mean ± SEM. Different letters indicate a significant difference between sampling points with the same treatment; asterisks (*) show differences between groups at the same time point (two-way ANOVA followed by Tukey’s test, p < 0.05). (BE) The localization study of itr transcripts (n = 4 in each group; revealed them in the pituitary glands of the SW (B) and FW (D) black porgies on day 1. There were no signals detected in the SW and FW fish when using the respective control sense probes of itr on day 1 (C,E). RPD: rostral pars distalis; PPD: proximal pars distalis; aNH: anterior neurohypophysis; pNH: posterior neurohypophysis.
Cells 10 03086 g007
Table 1. Oligonucleotide primers used for specific primers for reverse transcription PCR (RT-PCR), quantitative real-time PCR (Q-PCR) analysis, and in situ hybridization. S: sense primer, AS: anti-sense primer, F: forward primer, and R: reverse primer.
GeneOrientation UsageNucleotide Sequence (5′–3′)Amplicon Size
avtRT-PCR-FATGCCTCACTCCATGTTC450 bp
RT-PCR-RCTGTCCTCTGGTGGCCACATGTAG
Q-PCR-FCCCCCTGTGCGTCCTGGGACTCATC378 bp
Q-PCR-RCCTCCCCGAGACAGTCAGAGTC
in situ-SCCTGTGCGTCCTGGGACTCATC344 bp
in situ-ASCACCCCACAGAGCTGT
avtrRT-PCR-FGAGGTGGCCCAAATCGAGATC896 bp
RT-PCR-RGGCGCCCAGCAGATAATGTAC
Q-PCR-FCCTGCTGGCAATGTACAACAC561 bp
Q-PCR-RGCAGCGCCGGCCATCGTTTTC
in situ-SGTCGCGGATGCACCTCTTCATC463 bp
in situ-ASCCCGTAGCACATCATGAGAATG
itRT-PCR-FGCTGGGGGGACTTTGTGC342 bp
RT-PCR-RCTGCAGGGTCCCATA
Q-PCR-FCCGTGGGGAGCCAAAGCTTAC307 bp
Q-PCR-RCAGACCACATCTGGACAAAGAA
in situ-SCACATGGATGAGCCTCAGC262 bp
in situ-ASGATGGGAGTCCAGCACATTATG
itrRT-PCR-FGCGTGTTACATCTCCAACTGT393 bp
RT-PCR-RGGTGTGG CCGGCCAGAT
Q-PCR-FCGGAGGGAAGAGATCCATCATG316 bp
Q-PCR-RGCCTTCGGATTGGCTGCTTTG
in situ-SGCACCGCTGCGCAAGTGCATGTG325
in situ-ASGCAGTAGCCTGAGGATGATGTC
gapdhRT-PCR-FGGCCCCCCTGGCCAAAGT523 bp
RT-PCR-RTGGGTGTCACCGATGAAG
Q-PCR-FAGGCTTCCTTAATCTCAGCATAAGAT490 bp
Q-PCR-RGGTGCCTGTGGCTGATGTG
Publisher’s Note: MDPI stays neutral with regard to jurisdictional claims in published maps and institutional affiliations.

