
A De Novo Sequence Variant in Barrier-to-Autointegration Factor Is Associated with Dominant Motor Neuronopathy
 , , and
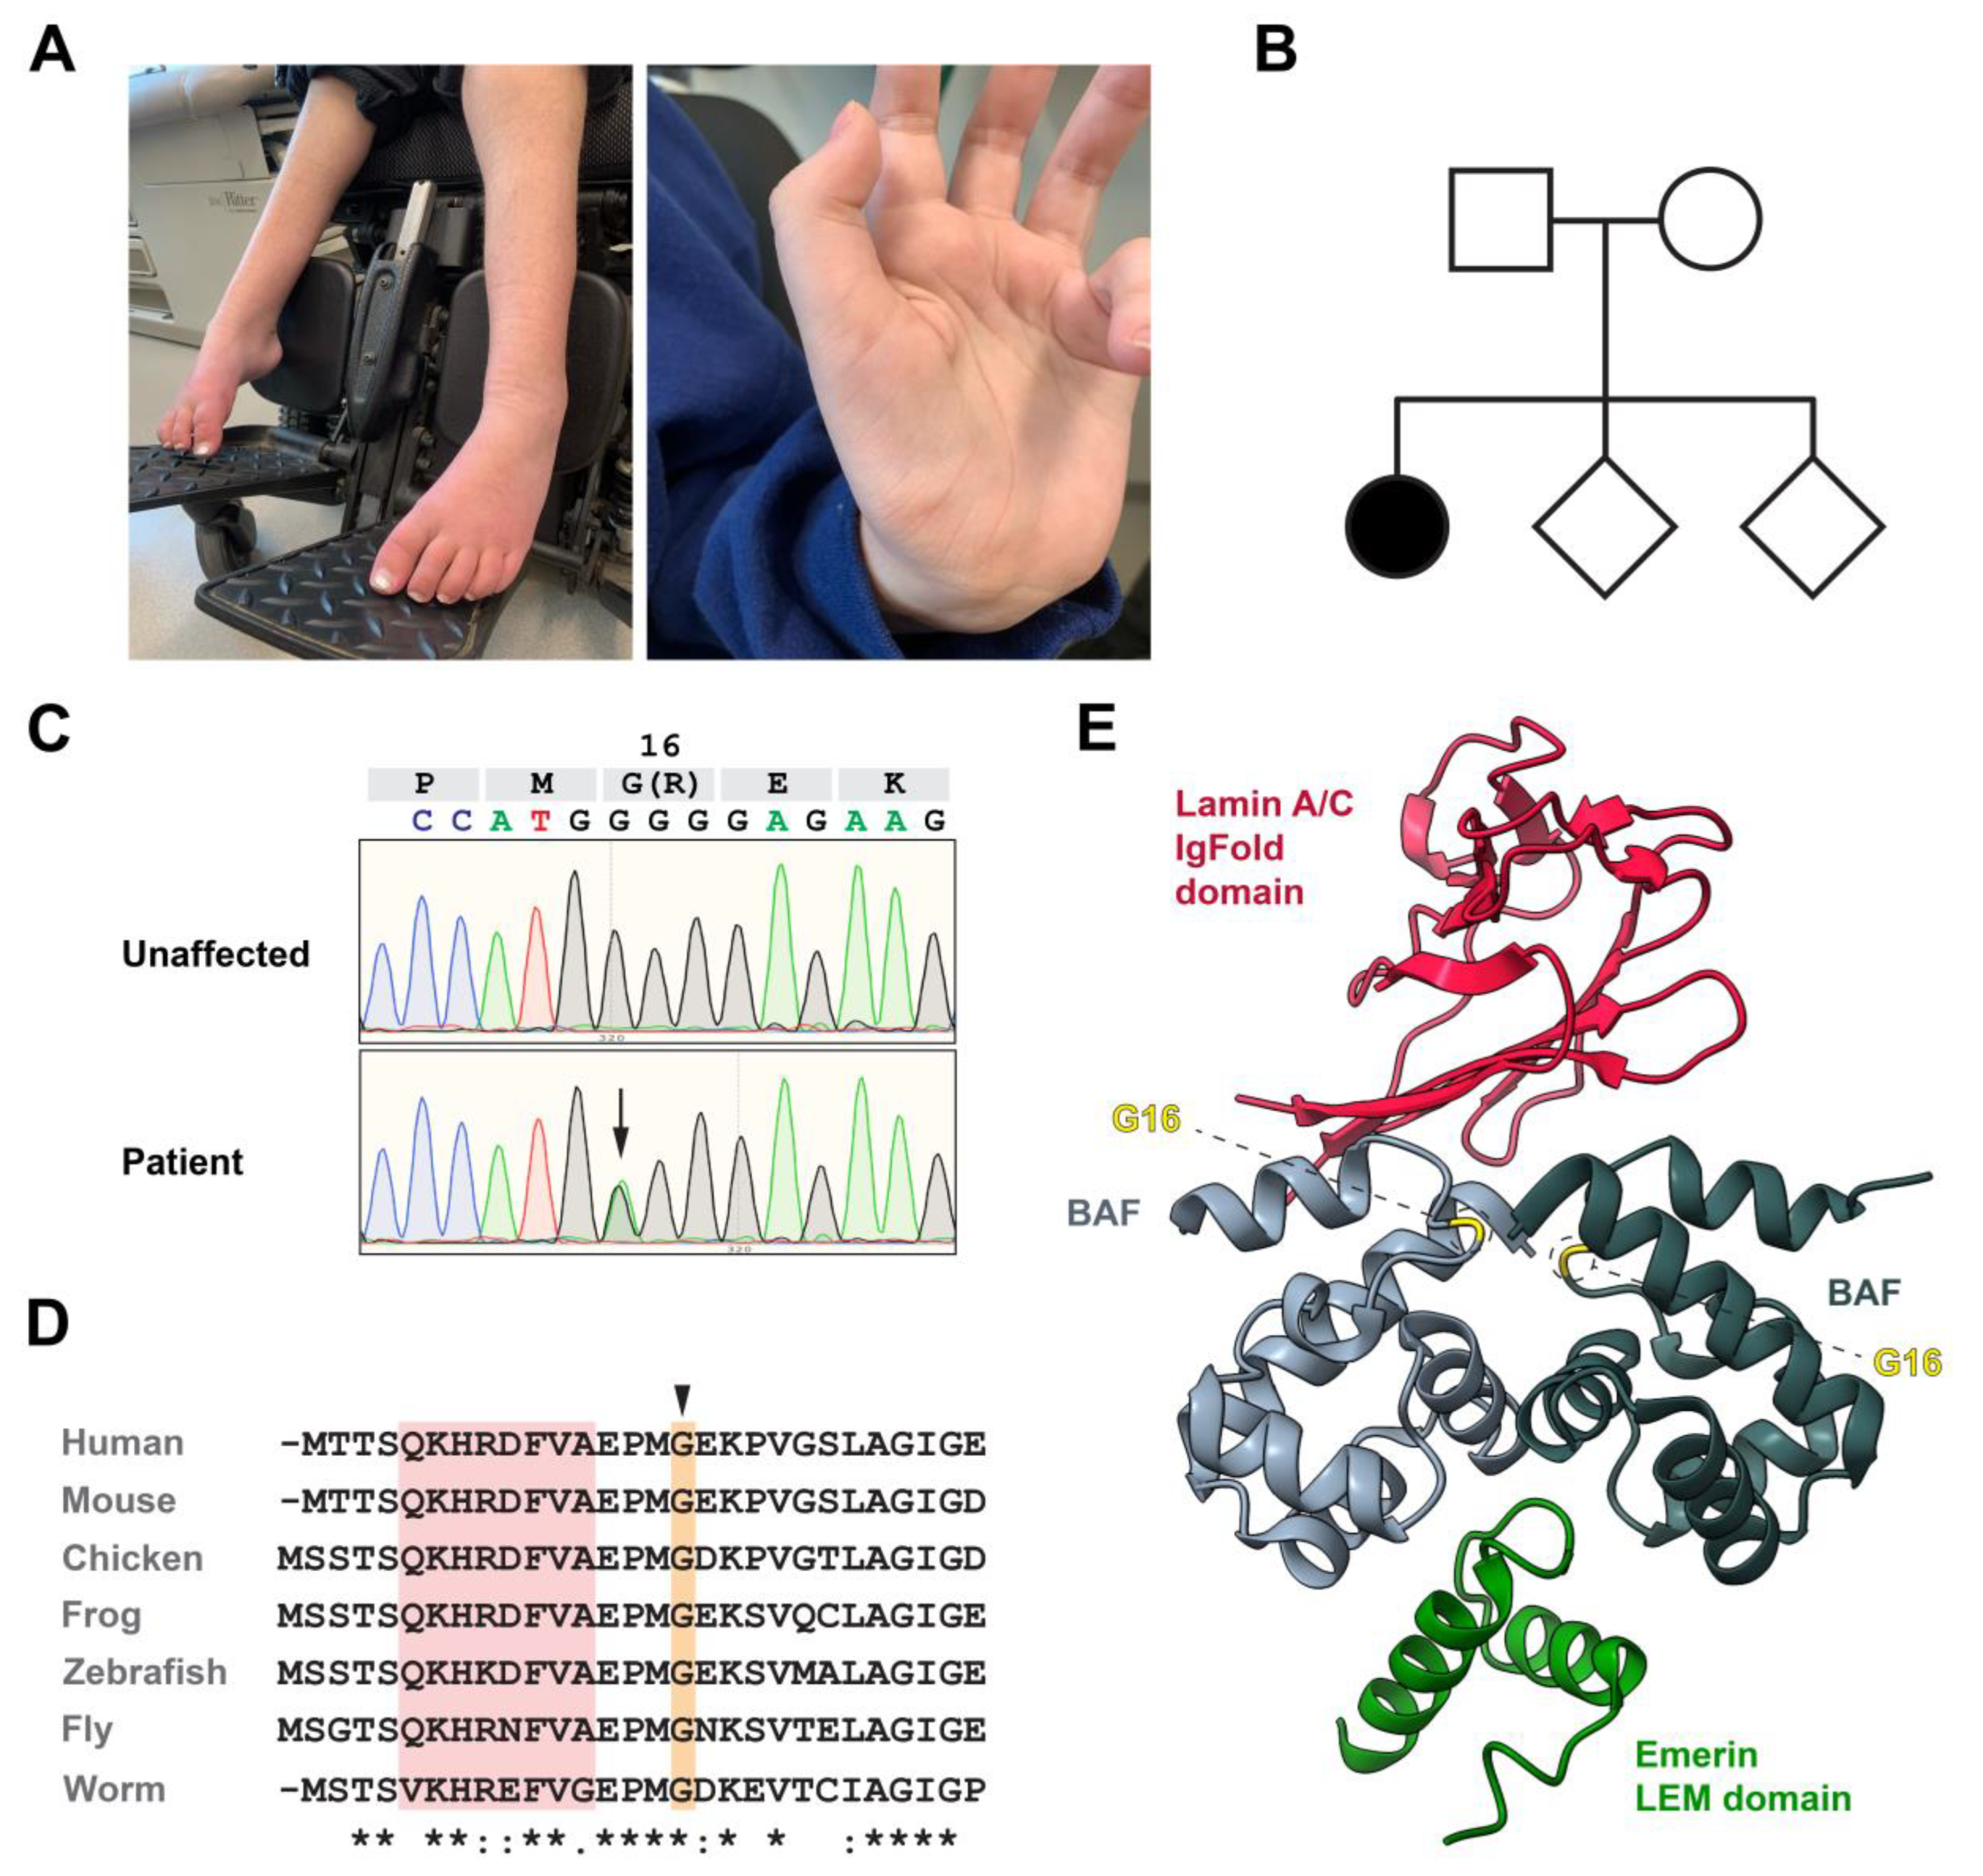
Abstract
:1. Introduction
2. Materials and Methods
2.1. Cell Culture and Immunohistochemical Analysis
2.2. Image Quantification
2.3. Western Blots
2.4. Protein Constructs and Expression Vectors
2.5. BAF WT and BAF Gly16Arg Protein Expression
2.6. Protein Purification
2.7. Liquid-State NMR Spectroscopy
2.8. ITC Binding Assays
2.9. Molecular Dynamics (MD) Simulation
3. Results
3.1. Identification of a De Novo BANF1 Mutation in a Patient with Motor Neuronopathy
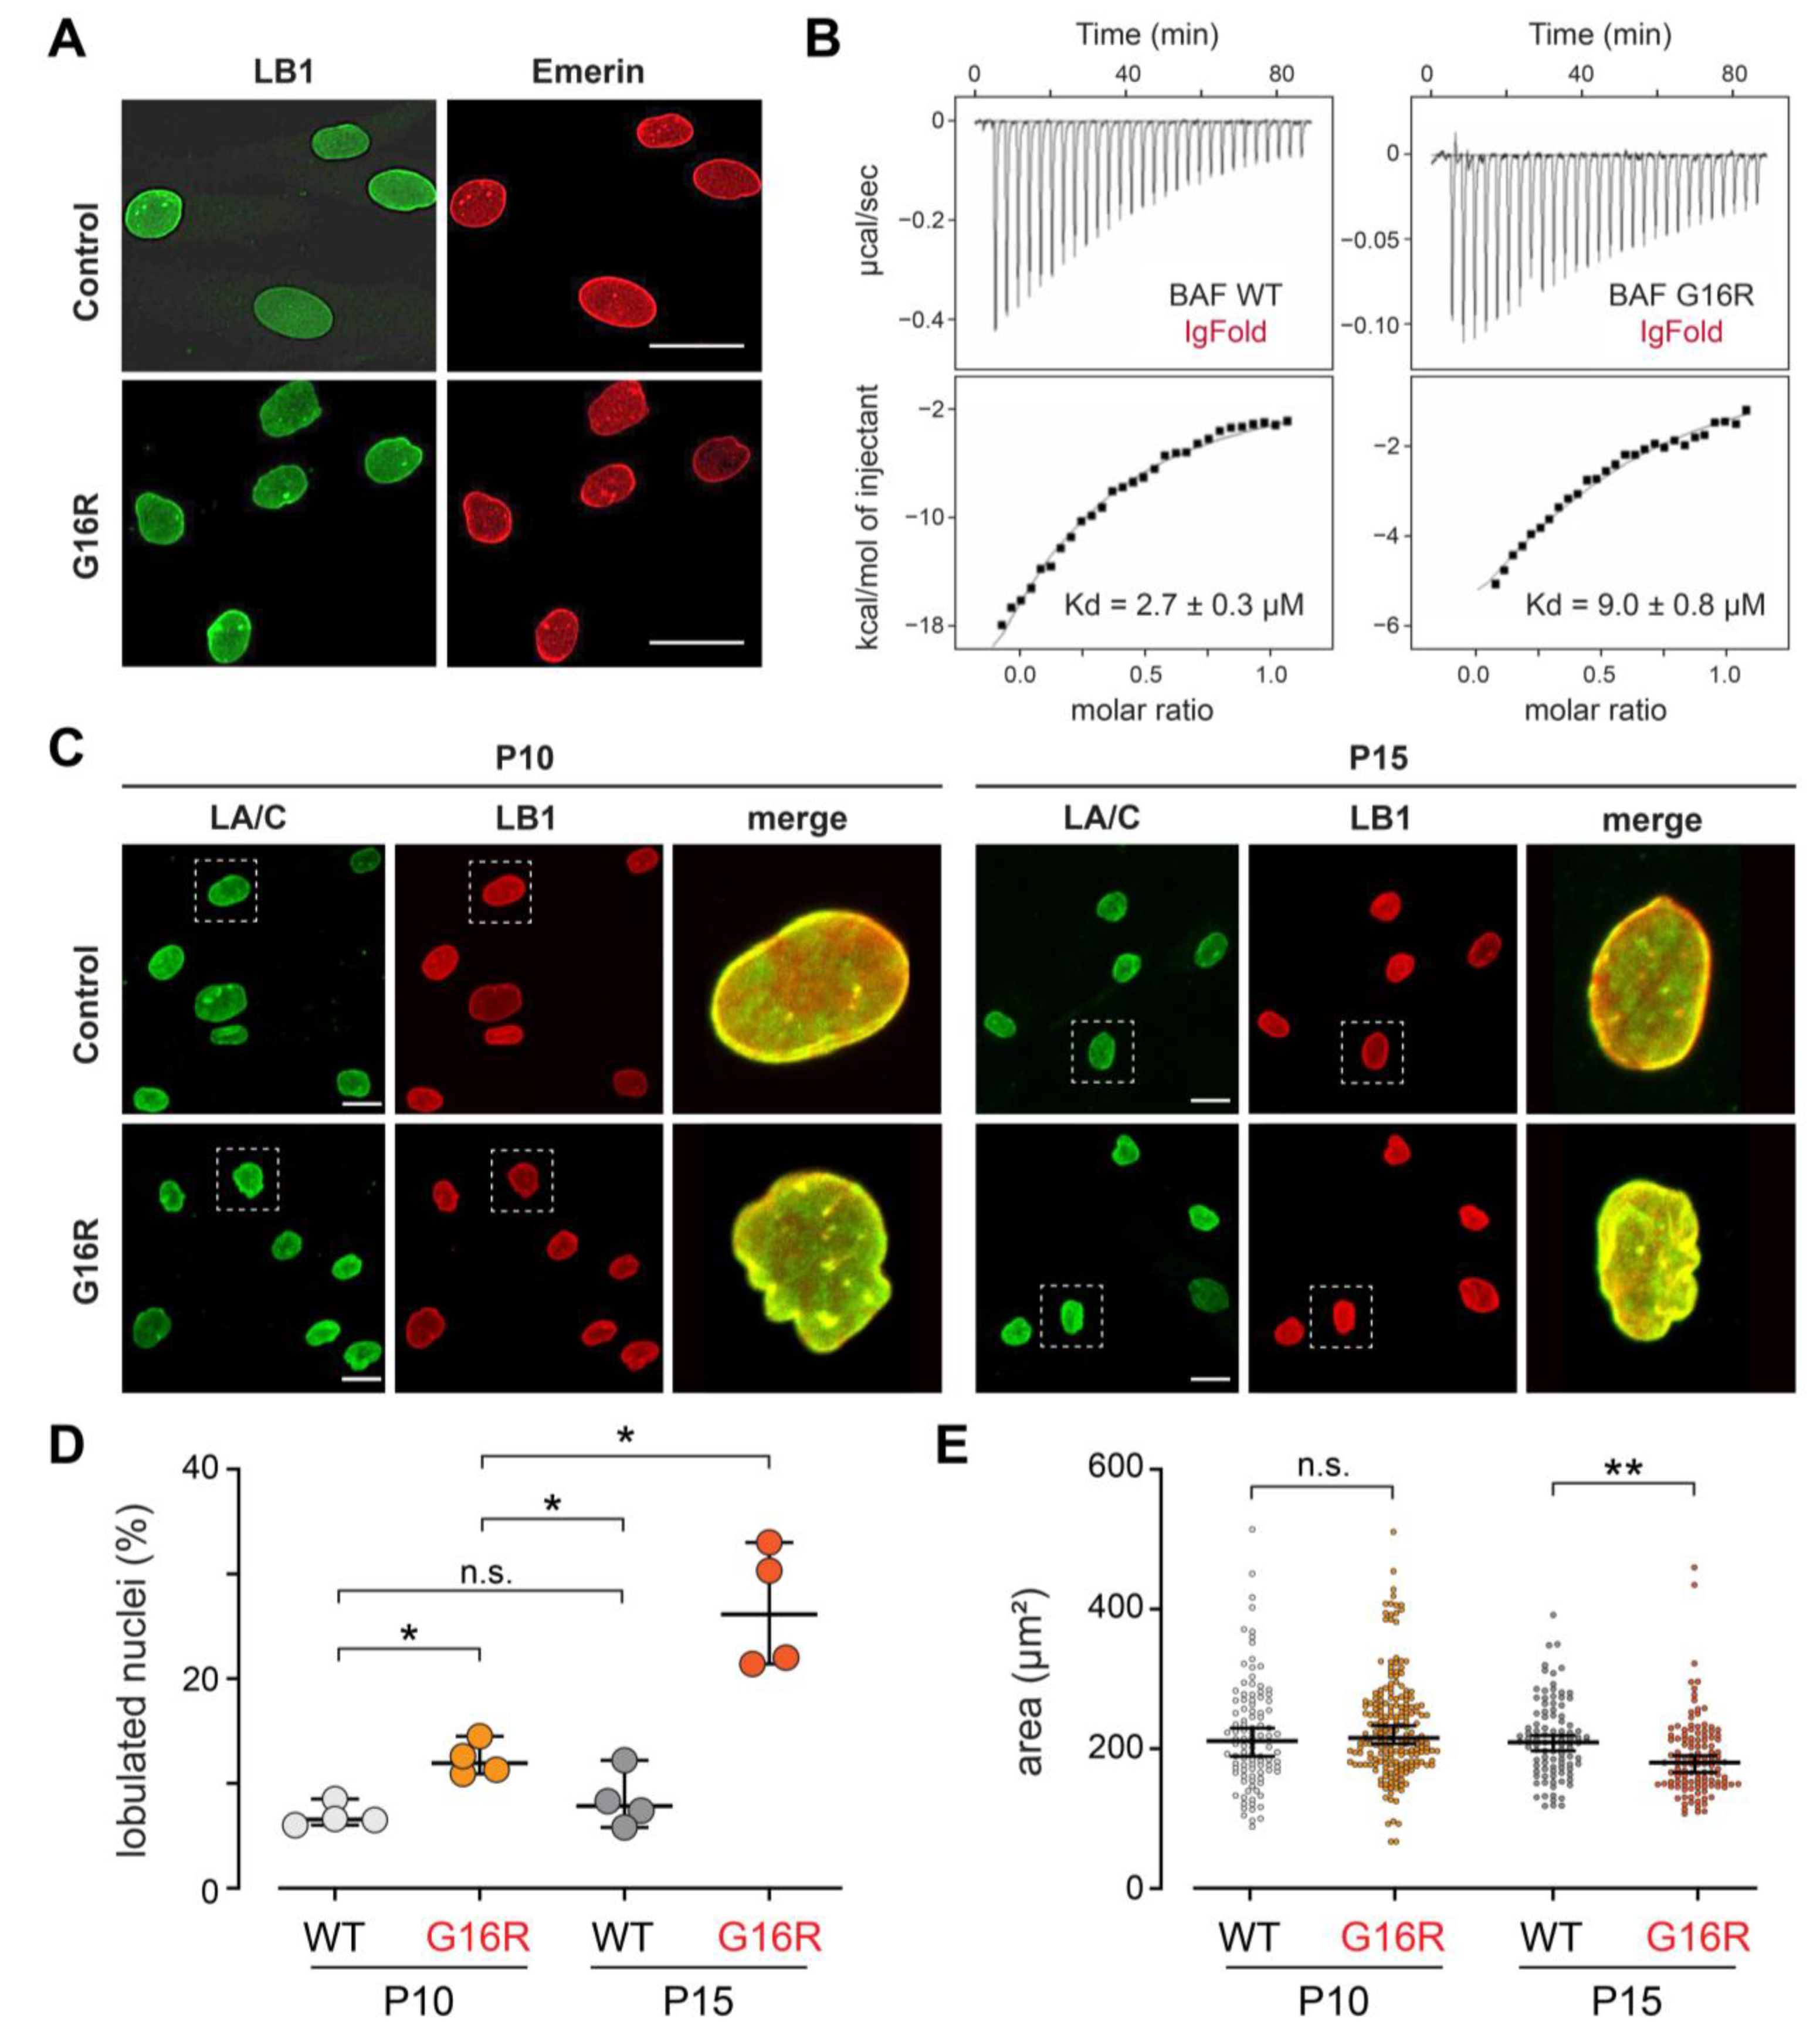
3.2. The Gly16Arg Variant Confers Modest Changes to Nuclear Lamina Structure
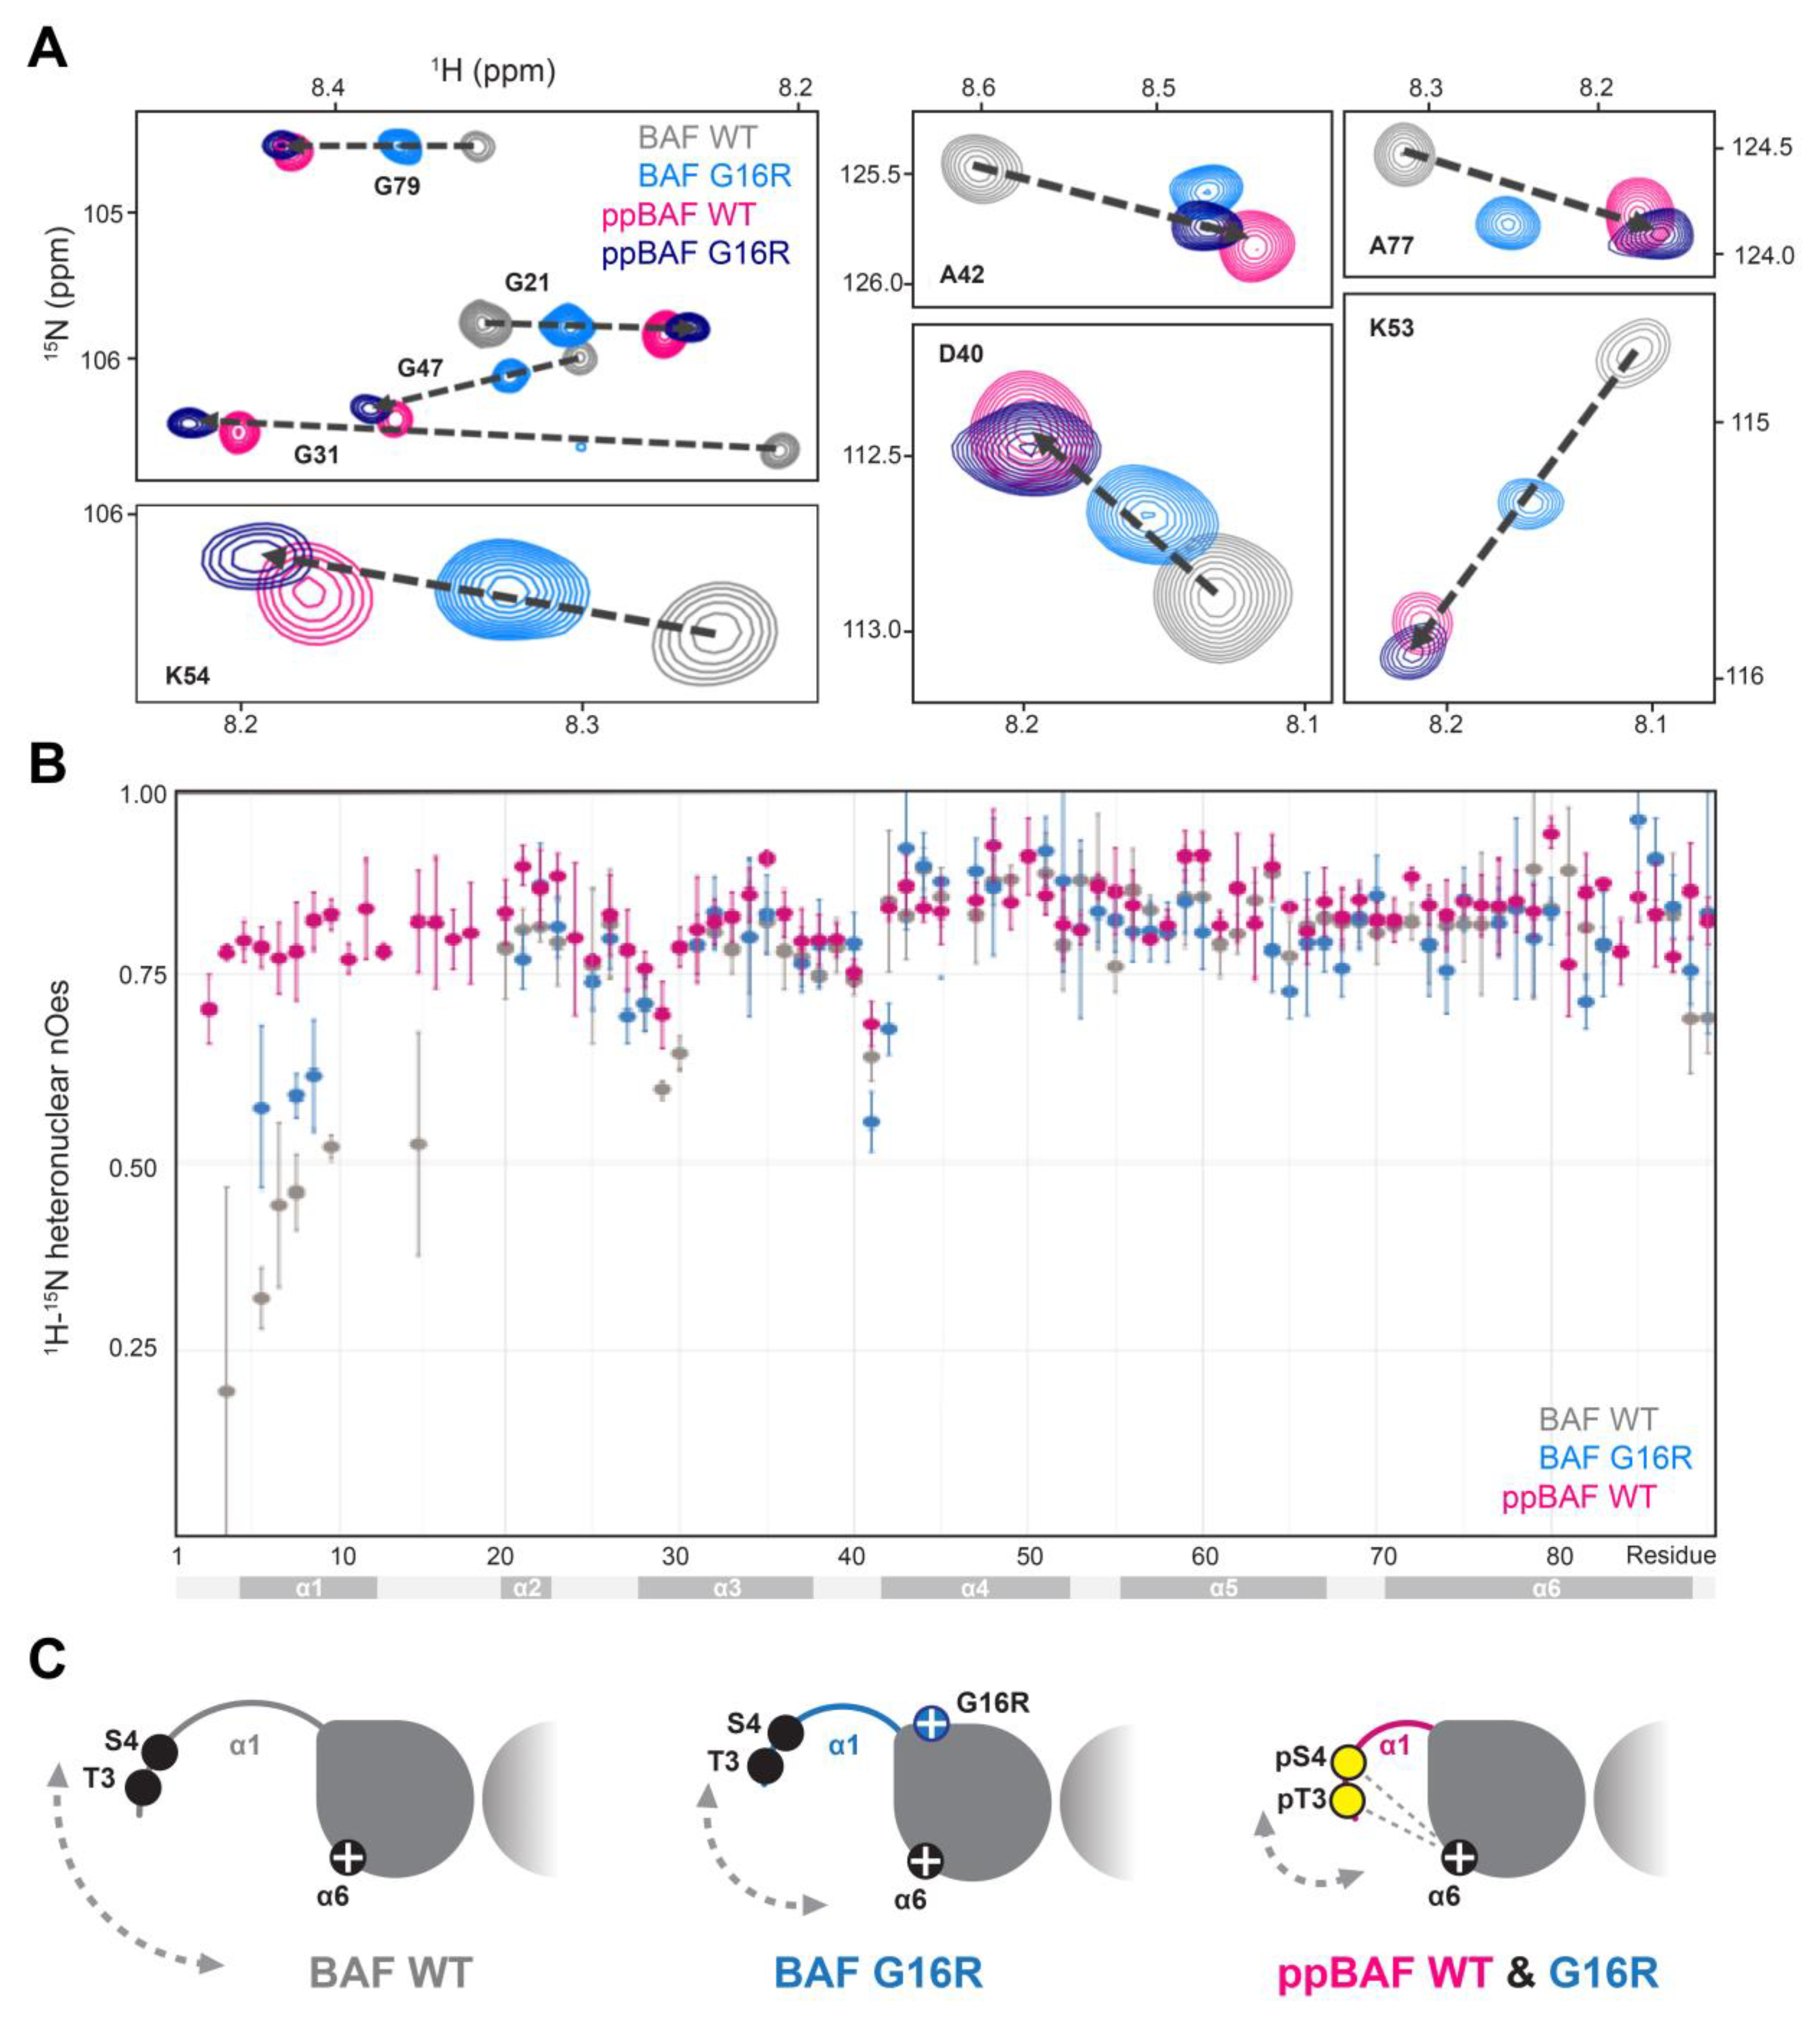
3.3. The BAF Gly16Arg Structure Is Intermediate to Un- and Di-Phosphorylated BAF WT
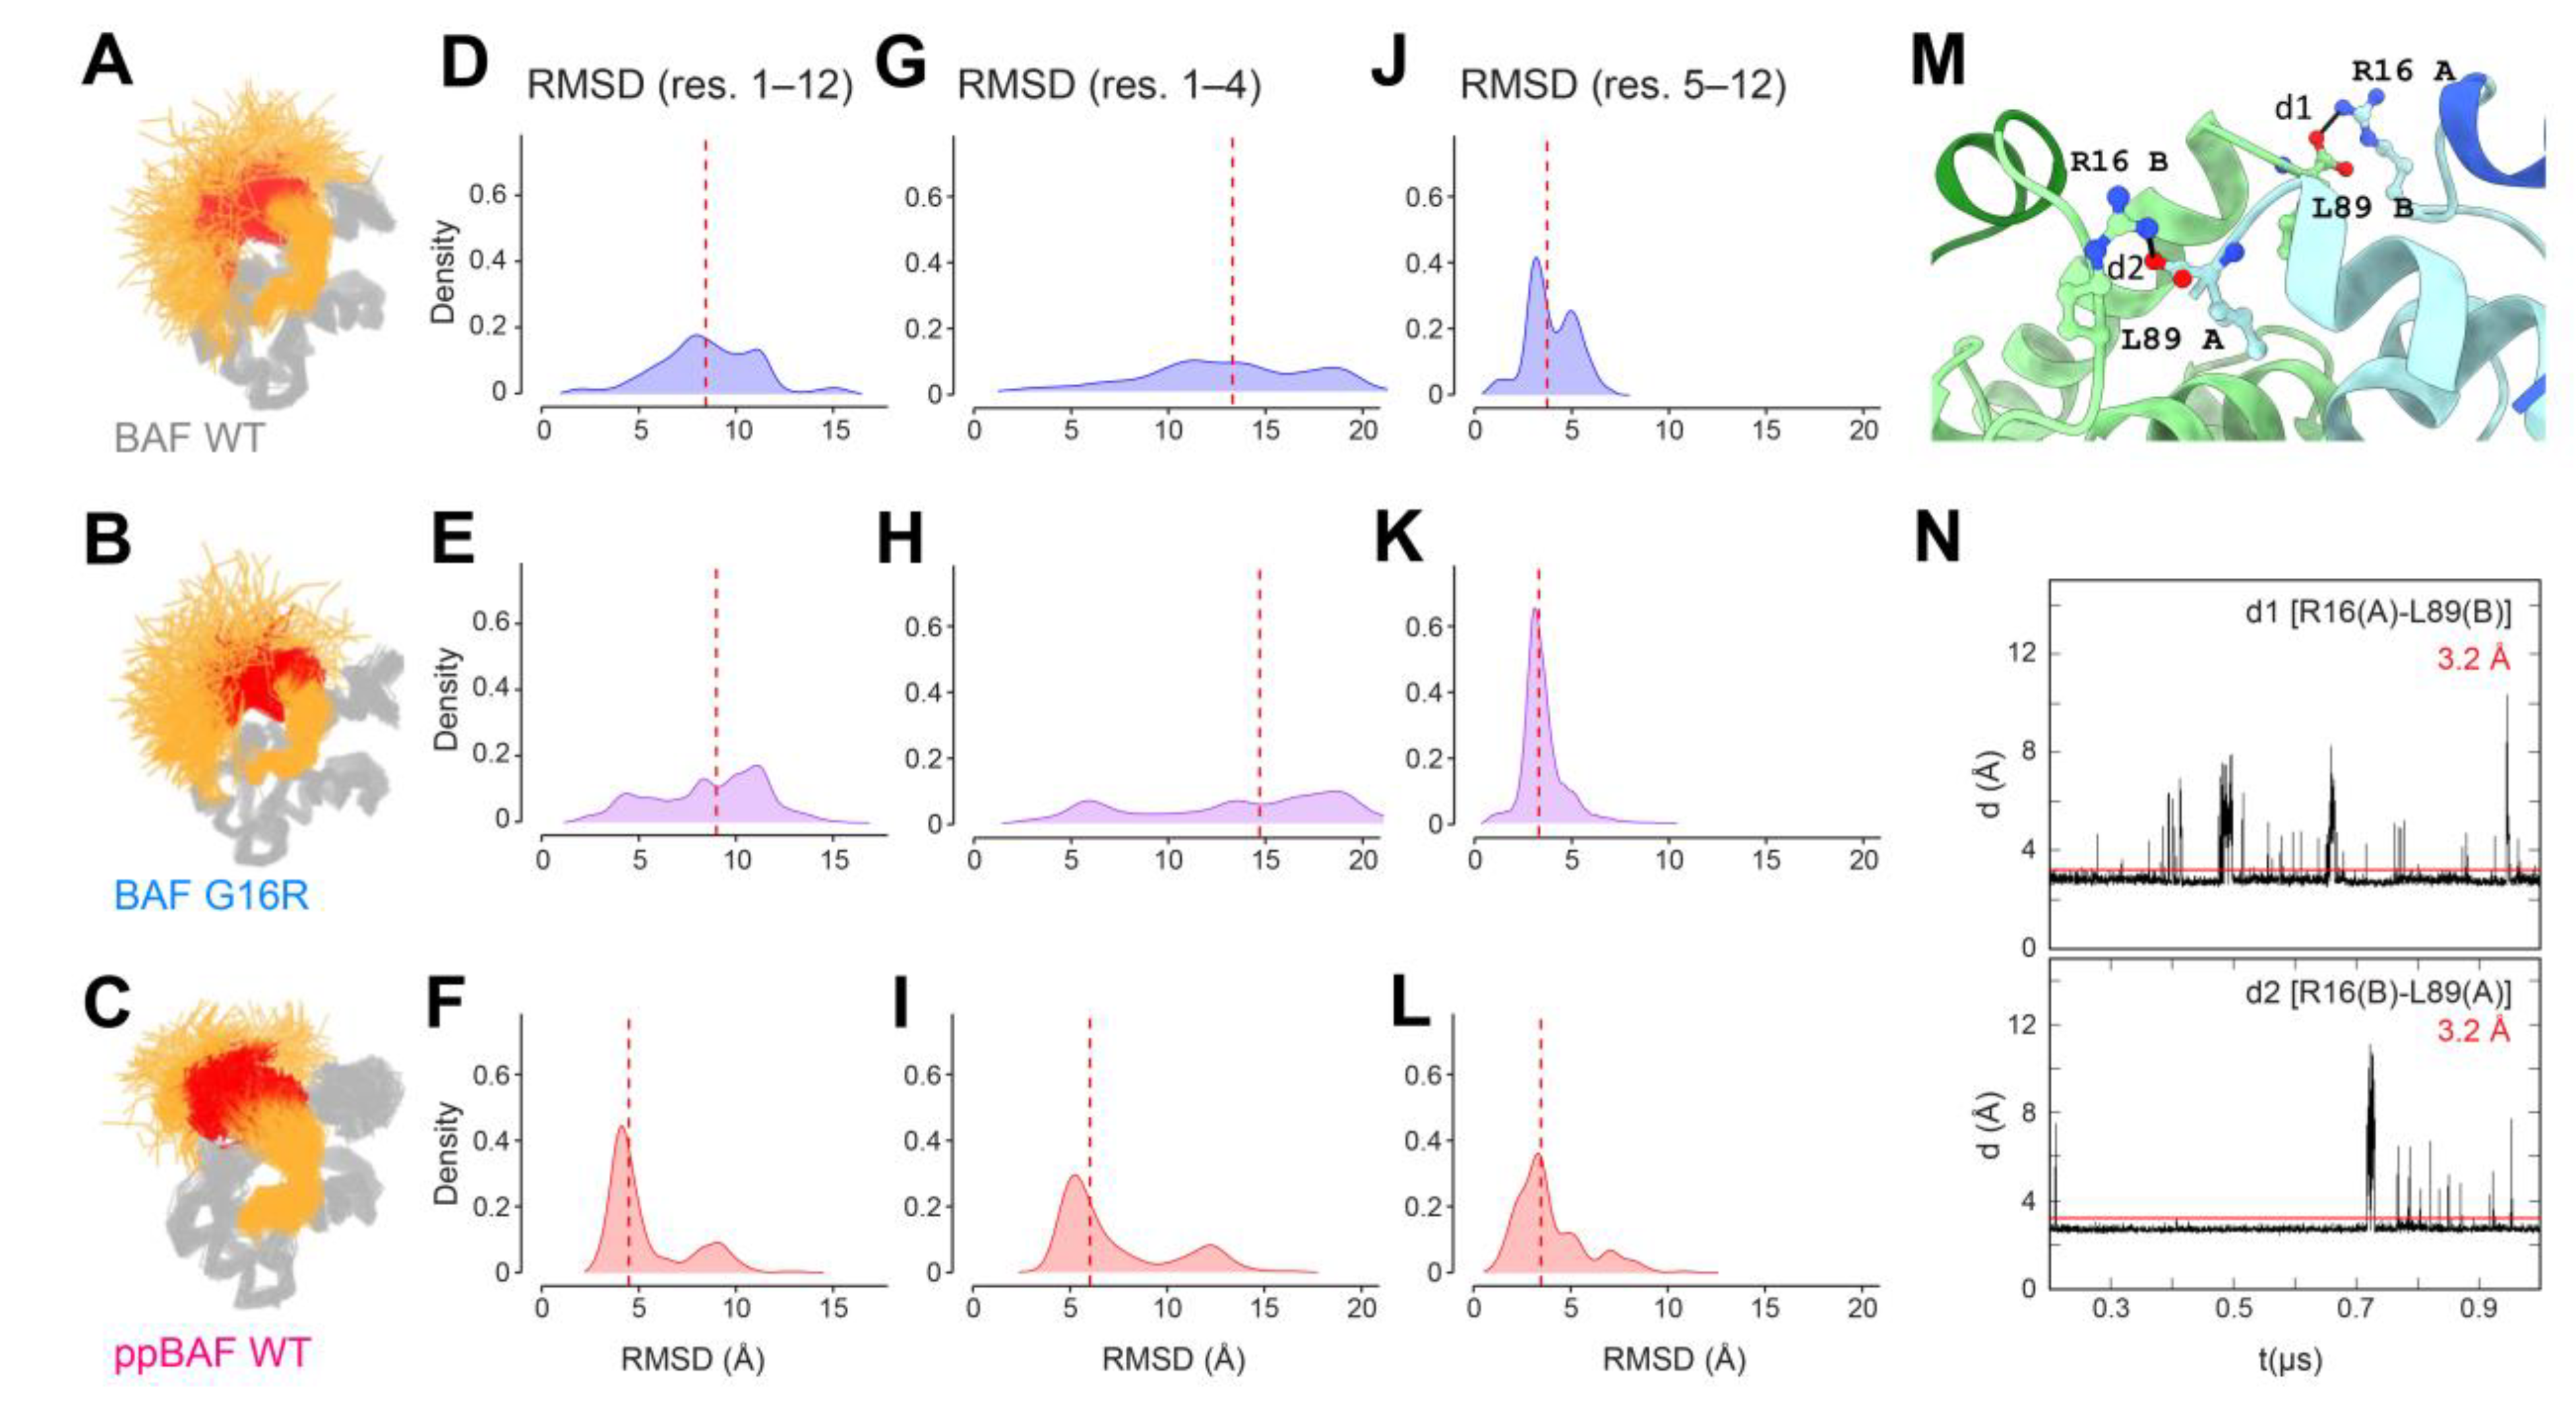
3.4. Detection of an Inter-Monomeric Salt-Bridge Involving Arg16 Using In Silico Analyses
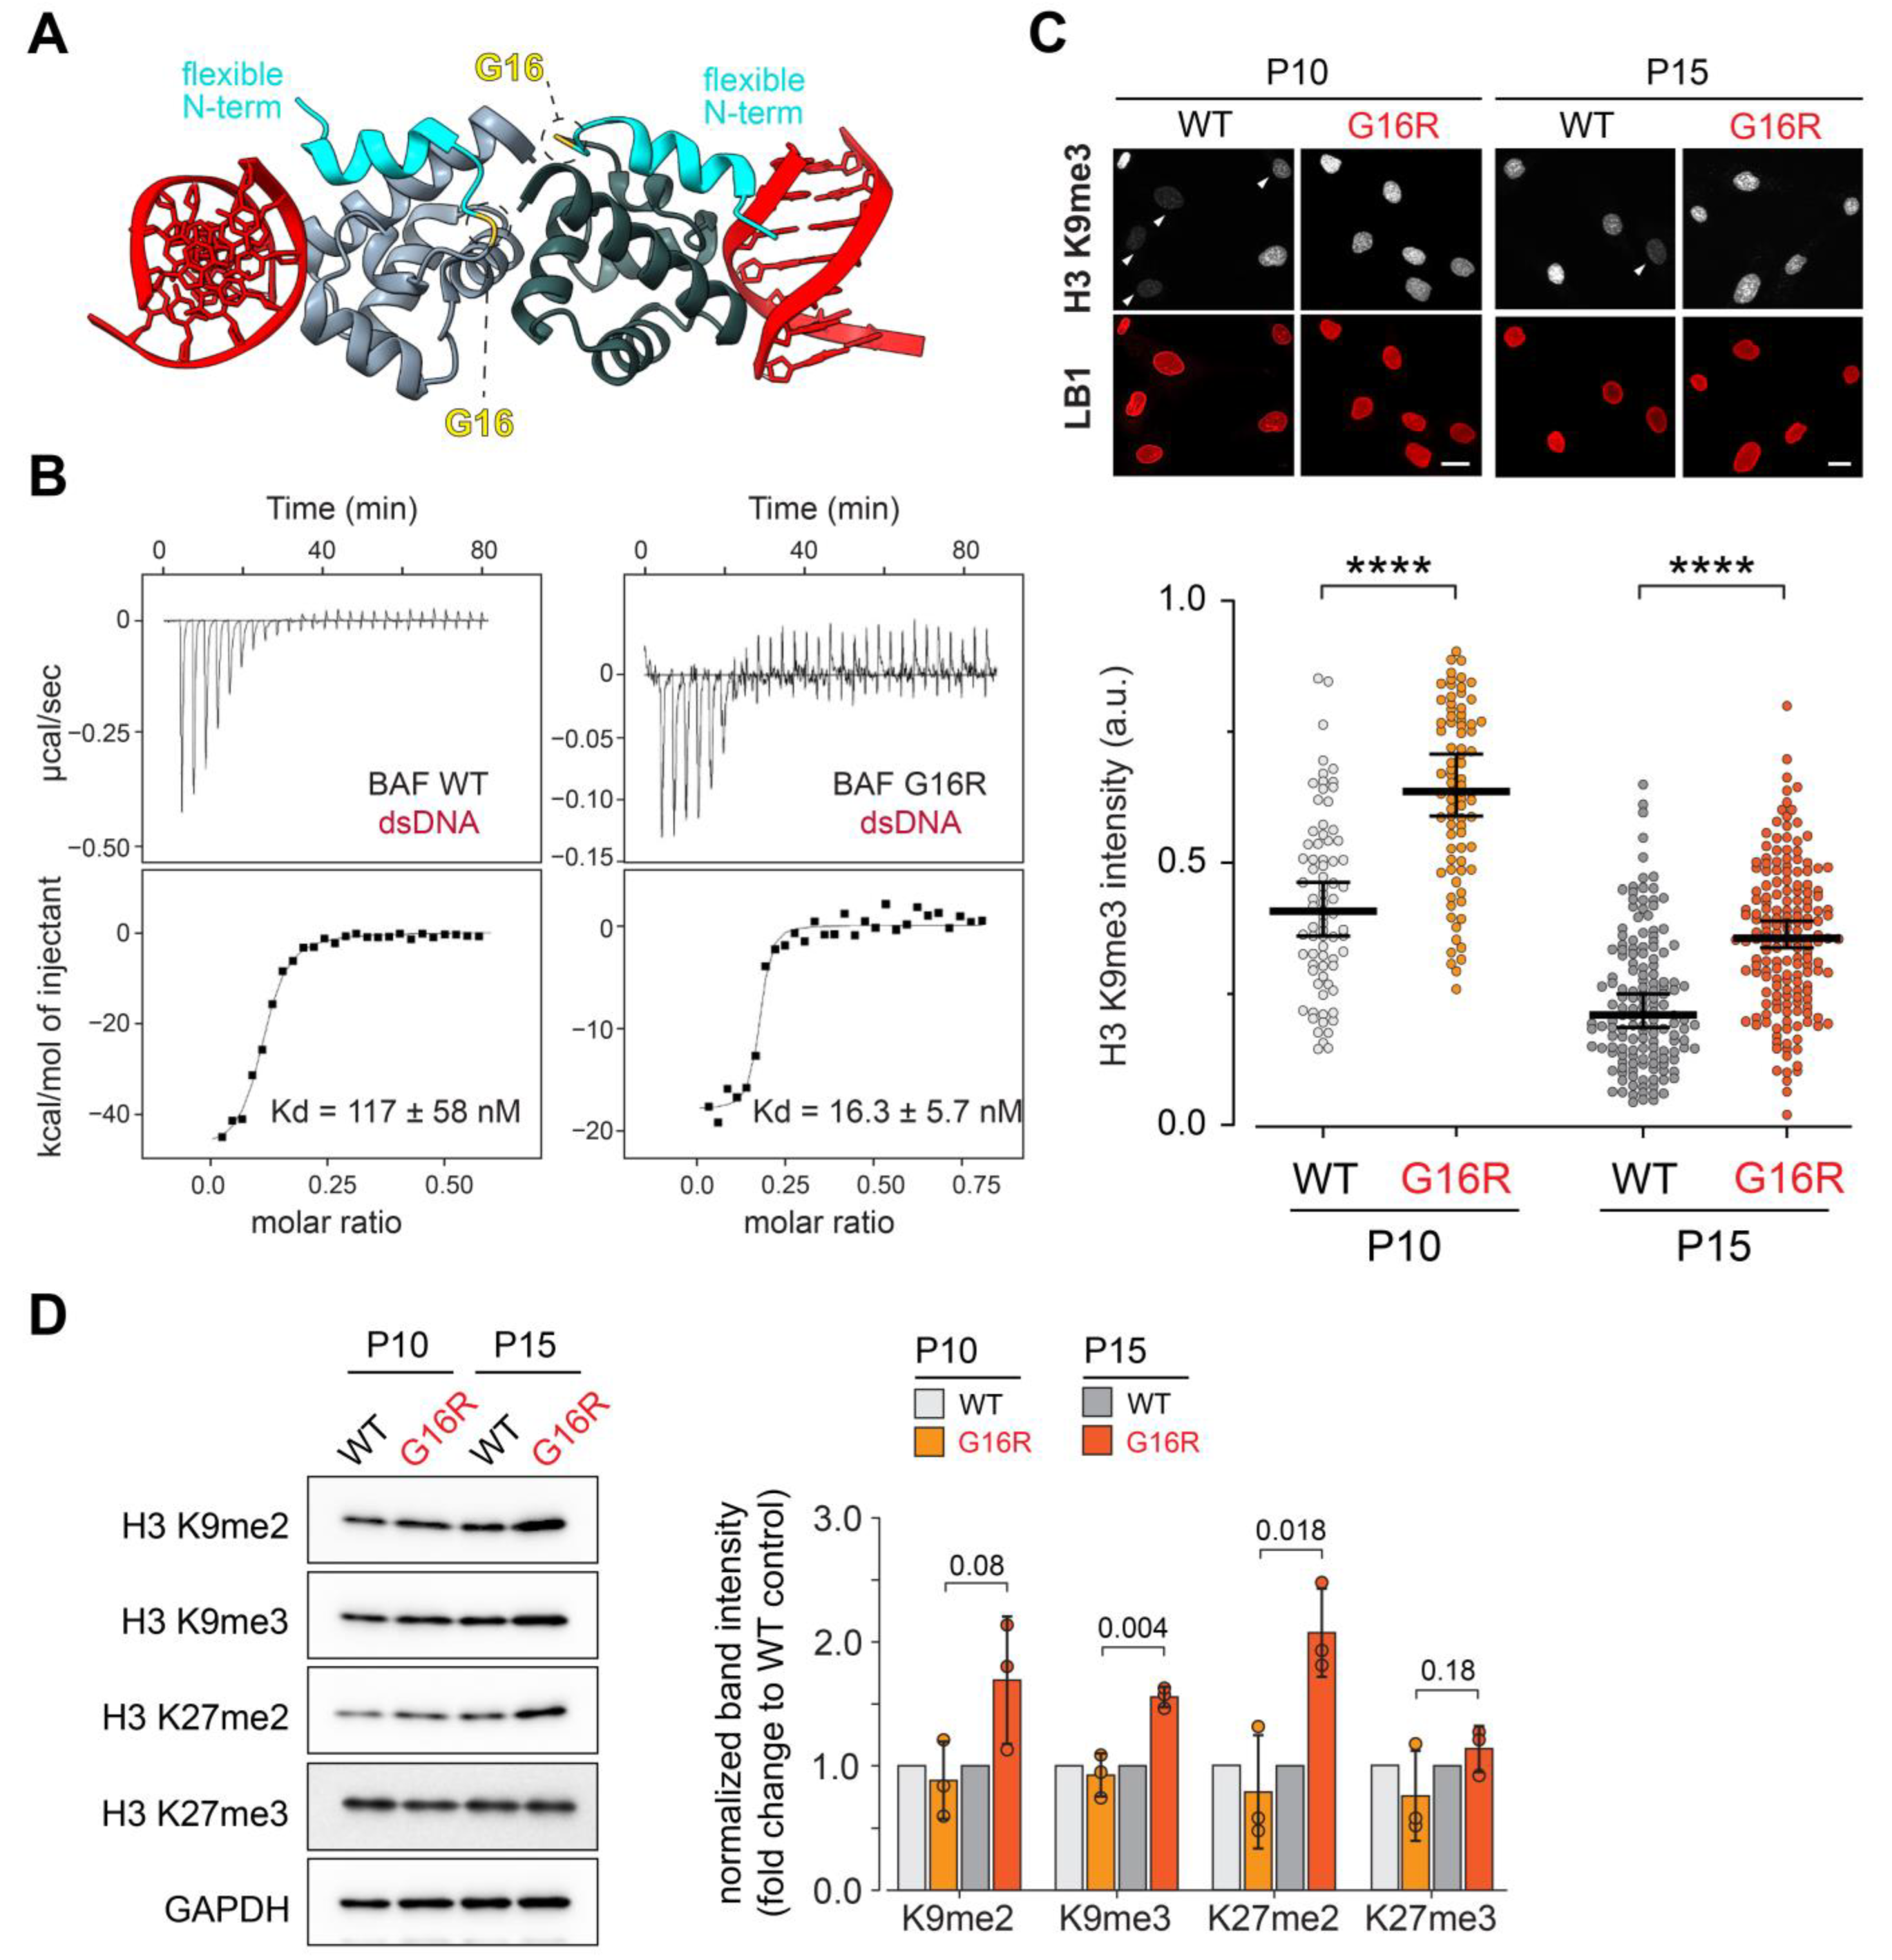
3.5. BAF Gly16Arg Shows Increased DNA Binding Affinity
4. Discussion
Supplementary Materials
Author Contributions
Funding
Institutional Review Board Statement
Informed Consent Statement
Data Availability Statement
Acknowledgments
Conflicts of Interest
References
- Geyer, P.K.; Vitalini, M.W.; Wallrath, L.L. Nuclear organization: Taking a position on gene expression. Curr. Opin. Cell Biol. 2011, 23, 354–359. [Google Scholar] [CrossRef] [PubMed] [Green Version]
- Goldman, R.D.; Gruenbaum, Y.; Moir, R.D.; Shumaker, D.K.; Spann, T.P. Nuclear lamins: Building blocks of nuclear architecture. Genes Dev. 2002, 16, 533–547. [Google Scholar] [CrossRef] [PubMed] [Green Version]
- Gonzalo, S. DNA damage and lamins. Adv. Exp. Med. Biol. 2014, 773, 377–399. [Google Scholar] [CrossRef] [PubMed] [Green Version]
- Furukawa, K. LAP2 binding protein 1 (L2BP1/BAF) is a candidate mediator of LAP2-chromatin interaction. J. Cell Sci. 1999, 112 Pt 15, 2485–2492. [Google Scholar] [CrossRef] [PubMed]
- Jamin, A.; Wiebe, M.S. Barrier to Autointegration Factor (BANF1): Interwoven roles in nuclear structure, genome integrity, innate immunity, stress responses and progeria. Curr. Opin. Cell Biol. 2015, 34, 61–68. [Google Scholar] [CrossRef] [PubMed] [Green Version]
- Montes de Oca, R.; Shoemaker, C.J.; Gucek, M.; Cole, R.N.; Wilson, K.L. Barrier-to-autointegration factor proteome reveals chromatin-regulatory partners. PLoS ONE 2009, 4, e7050. [Google Scholar] [CrossRef] [Green Version]
- Brachner, A.; Foisner, R. Evolvement of LEM proteins as chromatin tethers at the nuclear periphery. Biochem. Soc. Trans. 2011, 39, 1735–1741. [Google Scholar] [CrossRef] [Green Version]
- Barton, L.J.; Soshnev, A.A.; Geyer, P.K. Networking in the nucleus: A spotlight on LEM-domain proteins. Curr. Opin. Cell Biol. 2015, 34, 1–8. [Google Scholar] [CrossRef] [Green Version]
- Wiebe, M.S.; Jamin, A. The Barrier to Autointegration Factor: Interlocking Antiviral Defense with Genome Maintenance. J. Virol. 2016, 90, 3806–3809. [Google Scholar] [CrossRef] [Green Version]
- Lusk, C.P.; Ader, N.R. CHMPions of repair: Emerging perspectives on sensing and repairing the nuclear envelope barrier. Curr. Opin. Cell Biol. 2020, 64, 25–33. [Google Scholar] [CrossRef]
- Sears, R.M.; Roux, K.J. Diverse cellular functions of barrier-to-autointegration factor and its roles in disease. J. Cell Sci. 2020, 133, jcs246546. [Google Scholar] [CrossRef]
- Margalit, A.; Segura-Totten, M.; Gruenbaum, Y.; Wilson, K.L. Barrier-to-autointegration factor is required to segregate and enclose chromosomes within the nuclear envelope and assemble the nuclear lamina. Proc. Natl. Acad. Sci. USA 2005, 102, 3290–3295. [Google Scholar] [CrossRef] [PubMed] [Green Version]
- Furukawa, K.; Sugiyama, S.; Osouda, S.; Goto, H.; Inagaki, M.; Horigome, T.; Omata, S.; McConnell, M.; Fisher, P.A.; Nishida, Y. Barrier-to-autointegration factor plays crucial roles in cell cycle progression and nuclear organization in Drosophila. J. Cell Sci. 2003, 116, 3811–3823. [Google Scholar] [CrossRef] [PubMed] [Green Version]
- Zheng, R.; Ghirlando, R.; Lee, M.S.; Mizuuchi, K.; Krause, M.; Craigie, R. Barrier-to-autointegration factor (BAF) bridges DNA in a discrete, higher-order nucleoprotein complex. Proc. Natl. Acad. Sci. USA 2000, 97, 8997–9002. [Google Scholar] [CrossRef] [Green Version]
- Duan, T.; Kitzman, S.C.; Geyer, P.K. Survival of Drosophila germline stem cells requires the chromatin-binding protein Barrier-to-autointegration factor. Development 2020, 147, dev186171. [Google Scholar] [CrossRef]
- Puente, X.S.; Quesada, V.; Osorio, F.G.; Cabanillas, R.; Cadinanos, J.; Fraile, J.M.; Ordonez, G.R.; Puente, D.A.; Gutierrez-Fernandez, A.; Fanjul-Fernandez, M.; et al. Exome sequencing and functional analysis identifies BANF1 mutation as the cause of a hereditary progeroid syndrome. Am. J. Hum. Genet. 2011, 88, 650–656. [Google Scholar] [CrossRef] [Green Version]
- Bengtsson, L.; Wilson, K.L. Barrier-to-autointegration factor phosphorylation on Ser-4 regulates emerin binding to lamin A in vitro and emerin localization in vivo. Mol. Biol. Cell 2006, 17, 1154–1163. [Google Scholar] [CrossRef] [PubMed] [Green Version]
- Nichols, R.J.; Wiebe, M.S.; Traktman, P. The vaccinia-related kinases phosphorylate the N’ terminus of BAF, regulating its interaction with DNA and its retention in the nucleus. Mol. Biol. Cell 2006, 17, 2451–2464. [Google Scholar] [CrossRef] [PubMed] [Green Version]
- Molitor, T.P.; Traktman, P. Depletion of the protein kinase VRK1 disrupts nuclear envelope morphology and leads to BAF retention on mitotic chromosomes. Mol. Biol. Cell 2014, 25, 891–903. [Google Scholar] [CrossRef]
- Lancaster, O.M.; Cullen, C.F.; Ohkura, H. NHK-1 phosphorylates BAF to allow karyosome formation in the Drosophila oocyte nucleus. J. Cell Biol. 2007, 179, 817–824. [Google Scholar] [CrossRef] [Green Version]
- Gorjanacz, M.; Klerkx, E.P.; Galy, V.; Santarella, R.; Lopez-Iglesias, C.; Askjaer, P.; Mattaj, I.W. Caenorhabditis elegans BAF-1 and its kinase VRK-1 participate directly in post-mitotic nuclear envelope assembly. EMBO J. 2007, 26, 132–143. [Google Scholar] [CrossRef] [PubMed] [Green Version]
- Marcelot, A.; Petitalot, A.; Ropars, V.; Le Du, M.H.; Samson, C.; Dubois, S.; Hoffmann, G.; Miron, S.; Cuniasse, P.; Marquez, J.A.; et al. Di-phosphorylated BAF shows altered structural dynamics and binding to DNA, but interacts with its nuclear envelope partners. Nucleic Acids Res. 2021, 49, 3841–3855. [Google Scholar] [CrossRef]
- Margalit, A.; Brachner, A.; Gotzmann, J.; Foisner, R.; Gruenbaum, Y. Barrier-to-autointegration factor—A BAFfling little protein. Trends Cell Biol. 2007, 17, 202–208. [Google Scholar] [CrossRef] [PubMed]
- Skoko, D.; Li, M.; Huang, Y.; Mizuuchi, M.; Cai, M.; Bradley, C.M.; Pease, P.J.; Xiao, B.; Marko, J.F.; Craigie, R.; et al. Barrier-to-autointegration factor (BAF) condenses DNA by looping. Proc. Natl. Acad. Sci. USA 2009, 106, 16610–16615. [Google Scholar] [CrossRef] [PubMed] [Green Version]
- Samwer, M.; Schneider, M.W.G.; Hoefler, R.; Schmalhorst, P.S.; Jude, J.G.; Zuber, J.; Gerlich, D.W. DNA Cross-Bridging Shapes a Single Nucleus from a Set of Mitotic Chromosomes. Cell 2017, 170, 956–972. [Google Scholar] [CrossRef] [Green Version]
- Armstrong, J.A.; Bieker, J.J.; Emerson, B.M. A SWI/SNF-related chromatin remodeling complex, E-RC1, is required for tissue-specific transcriptional regulation by EKLF in vitro. Cell 1998, 95, 93–104. [Google Scholar] [CrossRef] [Green Version]
- Asencio, C.; Davidson, I.F.; Santarella-Mellwig, R.; Ly-Hartig, T.B.; Mall, M.; Wallenfang, M.R.; Mattaj, I.W.; Gorjanacz, M. Coordination of kinase and phosphatase activities by Lem4 enables nuclear envelope reassembly during mitosis. Cell 2012, 150, 122–135. [Google Scholar] [CrossRef] [Green Version]
- Mehsen, H.; Boudreau, V.; Garrido, D.; Bourouh, M.; Larouche, M.; Maddox, P.S.; Swan, A.; Archambault, V. PP2A-B55 promotes nuclear envelope reformation after mitosis in Drosophila. J. Cell Biol. 2018, 217, 4106–4123. [Google Scholar] [CrossRef] [Green Version]
- Zhuang, X.; Semenova, E.; Maric, D.; Craigie, R. Dephosphorylation of barrier-to-autointegration factor by protein phosphatase 4 and its role in cell mitosis. J. Biol. Chem. 2014, 289, 1119–1127. [Google Scholar] [CrossRef] [Green Version]
- Torras-Llort, M.; Medina-Giro, S.; Escudero-Ferruz, P.; Lipinszki, Z.; Moreno-Moreno, O.; Karman, Z.; Przewloka, M.R.; Azorin, F. A fraction of barrier-to-autointegration factor (BAF) associates with centromeres and controls mitosis progression. Commun. Biol. 2020, 3, 454. [Google Scholar] [CrossRef]
- Karman, Z.; Rethi-Nagy, Z.; Abraham, E.; Fabri-Ordogh, L.; Csonka, A.; Vilmos, P.; Debski, J.; Dadlez, M.; Glover, D.M.; Lipinszki, Z. Novel perspectives of target-binding by the evolutionarily conserved PP4 phosphatase. Open Biol. 2020, 10, 200343. [Google Scholar] [CrossRef]
- Marcelot, A.; Zinn-Justin, S.; Cuniasse, P. The Conformation of the Intrinsically Disordered N-Terminal Region of Barrier-to-Autointegration Factor (BAF) is Regulated by pH and Phosphorylation. J. Mol. Biol. 2023, 435, 167888. [Google Scholar] [CrossRef] [PubMed]
- Montes de Oca, R.; Lee, K.K.; Wilson, K.L. Binding of barrier to autointegration factor (BAF) to histone H3 and selected linker histones including H1.1. J. Biol. Chem. 2005, 280, 42252–42262. [Google Scholar] [CrossRef] [PubMed] [Green Version]
- Montes de Oca, R.; Andreassen, P.R.; Wilson, K.L. Barrier-to-Autointegration Factor influences specific histone modifications. Nucleus 2011, 2, 580–590. [Google Scholar] [CrossRef] [PubMed] [Green Version]
- Paquet, N.; Box, J.K.; Ashton, N.W.; Suraweera, A.; Croft, L.V.; Urquhart, A.J.; Bolderson, E.; Zhang, S.D.; O’Byrne, K.J.; Richard, D.J. Nestor-Guillermo Progeria Syndrome: A biochemical insight into Barrier-to-Autointegration Factor 1, alanine 12 threonine mutation. BMC Mol. Biol. 2014, 15, 27. [Google Scholar] [CrossRef] [Green Version]
- Rose, M.; Bai, B.; Tang, M.; Cheong, C.M.; Beard, S.; Burgess, J.T.; Adams, M.N.; O’Byrne, K.J.; Richard, D.J.; Gandhi, N.S.; et al. The Impact of Rare Human Variants on Barrier-To-Auto-Integration Factor 1 (Banf1) Structure and Function. Front. Cell Dev. Biol. 2021, 9, 775441. [Google Scholar] [CrossRef]
- Dharmaraj, T.; Guan, Y.; Liu, J.; Badens, C.; Gaborit, B.; Wilson, K.L. Rare BANF1 Alleles and Relatively Frequent EMD Alleles Including ‘Healthy Lipid’ Emerin p.D149H in the ExAC Cohort. Front. Cell Dev. Biol. 2019, 7, 48. [Google Scholar] [CrossRef] [Green Version]
- Karczewski, K.J.; Francioli, L.C.; Tiao, G.; Cummings, B.B.; Alfoldi, J.; Wang, Q.; Collins, R.L.; Laricchia, K.M.; Ganna, A.; Birnbaum, D.P.; et al. The mutational constraint spectrum quantified from variation in 141,456 humans. Nature 2020, 581, 434–443. [Google Scholar] [CrossRef]
- Fisher, H.G.; Patni, N.; Scheuerle, A.E. An additional case of Nestor-Guillermo progeria syndrome diagnosed in early childhood. Am. J. Med. Genet. A 2020, 182, 2399–2402. [Google Scholar] [CrossRef]
- Janssen, A.; Marcelot, A.; Breusegem, S.; Legrand, P.; Zinn-Justin, S.; Larrieu, D. The BAF A12T mutation disrupts lamin A/C interaction, impairing robust repair of nuclear envelope ruptures in Nestor-Guillermo progeria syndrome cells. Nucleic Acids Res. 2022, 50, 9260–9278. [Google Scholar] [CrossRef]
- Carpenter, A.E.; Jones, T.R.; Lamprecht, M.R.; Clarke, C.; Kang, I.H.; Friman, O.; Guertin, D.A.; Chang, J.H.; Lindquist, R.A.; Moffat, J.; et al. CellProfiler: Image analysis software for identifying and quantifying cell phenotypes. Genome. Biol. 2006, 7, R100. [Google Scholar] [CrossRef] [PubMed] [Green Version]
- Goldman, R.D.; Shumaker, D.K.; Erdos, M.R.; Eriksson, M.; Goldman, A.E.; Gordon, L.B.; Gruenbaum, Y.; Khuon, S.; Mendez, M.; Varga, R.; et al. Accumulation of mutant lamin A causes progressive changes in nuclear architecture in Hutchinson-Gilford progeria syndrome. Proc. Natl. Acad. Sci. USA 2004, 101, 8963–8968. [Google Scholar] [CrossRef] [PubMed] [Green Version]
- Yusufova, N.; Kloetgen, A.; Teater, M.; Osunsade, A.; Camarillo, J.M.; Chin, C.R.; Doane, A.S.; Venters, B.J.; Portillo-Ledesma, S.; Conway, J.; et al. Histone H1 loss drives lymphoma by disrupting 3D chromatin architecture. Nature 2021, 589, 299–305. [Google Scholar] [CrossRef] [PubMed]
- Samson, C.; Petitalot, A.; Celli, F.; Herrada, I.; Ropars, V.; Le Du, M.H.; Nhiri, N.; Jacquet, E.; Arteni, A.A.; Buendia, B.; et al. Structural analysis of the ternary complex between lamin A/C, BAF and emerin identifies an interface disrupted in autosomal recessive progeroid diseases. Nucleic Acids Res. 2018, 46, 10460–10473. [Google Scholar] [CrossRef] [PubMed] [Green Version]
- Vranken, W.F.; Boucher, W.; Stevens, T.J.; Fogh, R.H.; Pajon, A.; Llinas, M.; Ulrich, E.L.; Markley, J.L.; Ionides, J.; Laue, E.D. The CCPN data model for NMR spectroscopy: Development of a software pipeline. Proteins 2005, 59, 687–696. [Google Scholar] [CrossRef] [PubMed]
- Umland, T.C.; Wei, S.Q.; Craigie, R.; Davies, D.R. Structural basis of DNA bridging by barrier-to-autointegration factor. Biochemistry 2000, 39, 9130–9138. [Google Scholar] [CrossRef]
- Andricioaei, I.; Karplus, M. On the calculation of entropy from covariance matrices of the atomic fluctuations. J. Chem. Phys. 2001, 115, 6289–6292. [Google Scholar] [CrossRef]
- Phillips, J.C.; Braun, R.; Wang, W.; Gumbart, J.; Tajkhorshid, E.; Villa, E.; Chipot, C.; Skeel, R.D.; Kale, L.; Schulten, K. Scalable molecular dynamics with NAMD. J. Comput. Chem. 2005, 26, 1781–1802. [Google Scholar] [CrossRef] [Green Version]
- Huang, J.; MacKerell, A.D., Jr. CHARMM36 all-atom additive protein force field: Validation based on comparison to NMR data. J. Comput. Chem. 2013, 34, 2135–2145. [Google Scholar] [CrossRef] [Green Version]
- Humphrey, W.; Dalke, A.; Schulten, K. VMD: Visual molecular dynamics. J. Mol. Graph. 1996, 14, 33–38. [Google Scholar] [CrossRef]
- Stavrou, M.; Sargiannidou, I.; Christofi, T.; Kleopa, K.A. Genetic mechanisms of peripheral nerve disease. Neurosci. Lett. 2021, 742, 135357. [Google Scholar] [CrossRef] [PubMed]
- Moreira-Pais, A.; Ferreira, R.; Oliveira, P.A.; Duarte, J.A. A neuromuscular perspective of sarcopenia pathogenesis: Deciphering the signaling pathways involved. Geroscience 2022, 44, 1199–1213. [Google Scholar] [CrossRef] [PubMed]
- Shumaker, D.K.; Dechat, T.; Kohlmaier, A.; Adam, S.A.; Bozovsky, M.R.; Erdos, M.R.; Eriksson, M.; Goldman, A.E.; Khuon, S.; Collins, F.S.; et al. Mutant nuclear lamin A leads to progressive alterations of epigenetic control in premature aging. Proc. Natl. Acad. Sci. USA 2006, 103, 8703–8708. [Google Scholar] [CrossRef] [Green Version]
- Renbaum, P.; Kellerman, E.; Jaron, R.; Geiger, D.; Segel, R.; Lee, M.; King, M.C.; Levy-Lahad, E. Spinal muscular atrophy with pontocerebellar hypoplasia is caused by a mutation in the VRK1 gene. Am. J. Hum. Genet. 2009, 85, 281–289. [Google Scholar] [CrossRef] [Green Version]
- Sung, A.; Moretti, P.; Shaibani, A. Adult-Onset Spinal Muscular Atrophy due to Mutations in the VRK1 Gene. Neurol. Genet. 2021, 7, e599. [Google Scholar] [CrossRef] [PubMed]
- Li, M.; Yue, W. VRK2, a Candidate Gene for Psychiatric and Neurological Disorders. Mol. Neuropsychiatry 2018, 4, 119–133. [Google Scholar] [CrossRef]


Disclaimer/Publisher’s Note: The statements, opinions and data contained in all publications are solely those of the individual author(s) and contributor(s) and not of MDPI and/or the editor(s). MDPI and/or the editor(s) disclaim responsibility for any injury to people or property resulting from any ideas, methods, instructions or products referred to in the content. |
© 2023 by the authors. Licensee MDPI, Basel, Switzerland. This article is an open access article distributed under the terms and conditions of the Creative Commons Attribution (CC BY) license (https://creativecommons.org/licenses/by/4.0/).
Share and Cite
Marcelot, A.; Rodriguez-Tirado, F.; Cuniasse, P.; Joiner, M.-l.; Miron, S.; Soshnev, A.A.; Fang, M.; Pufall, M.A.; Mathews, K.D.; Moore, S.A.; et al. A De Novo Sequence Variant in Barrier-to-Autointegration Factor Is Associated with Dominant Motor Neuronopathy. Cells 2023, 12, 847. https://doi.org/10.3390/cells12060847
Marcelot A, Rodriguez-Tirado F, Cuniasse P, Joiner M-l, Miron S, Soshnev AA, Fang M, Pufall MA, Mathews KD, Moore SA, et al. A De Novo Sequence Variant in Barrier-to-Autointegration Factor Is Associated with Dominant Motor Neuronopathy. Cells. 2023; 12(6):847. https://doi.org/10.3390/cells12060847
Chicago/Turabian StyleMarcelot, Agathe, Felipe Rodriguez-Tirado, Philippe Cuniasse, Mei-ling Joiner, Simona Miron, Alexey A. Soshnev, Mimi Fang, Miles A. Pufall, Katherine D. Mathews, Steven A. Moore, and et al. 2023. "A De Novo Sequence Variant in Barrier-to-Autointegration Factor Is Associated with Dominant Motor Neuronopathy" Cells 12, no. 6: 847. https://doi.org/10.3390/cells12060847