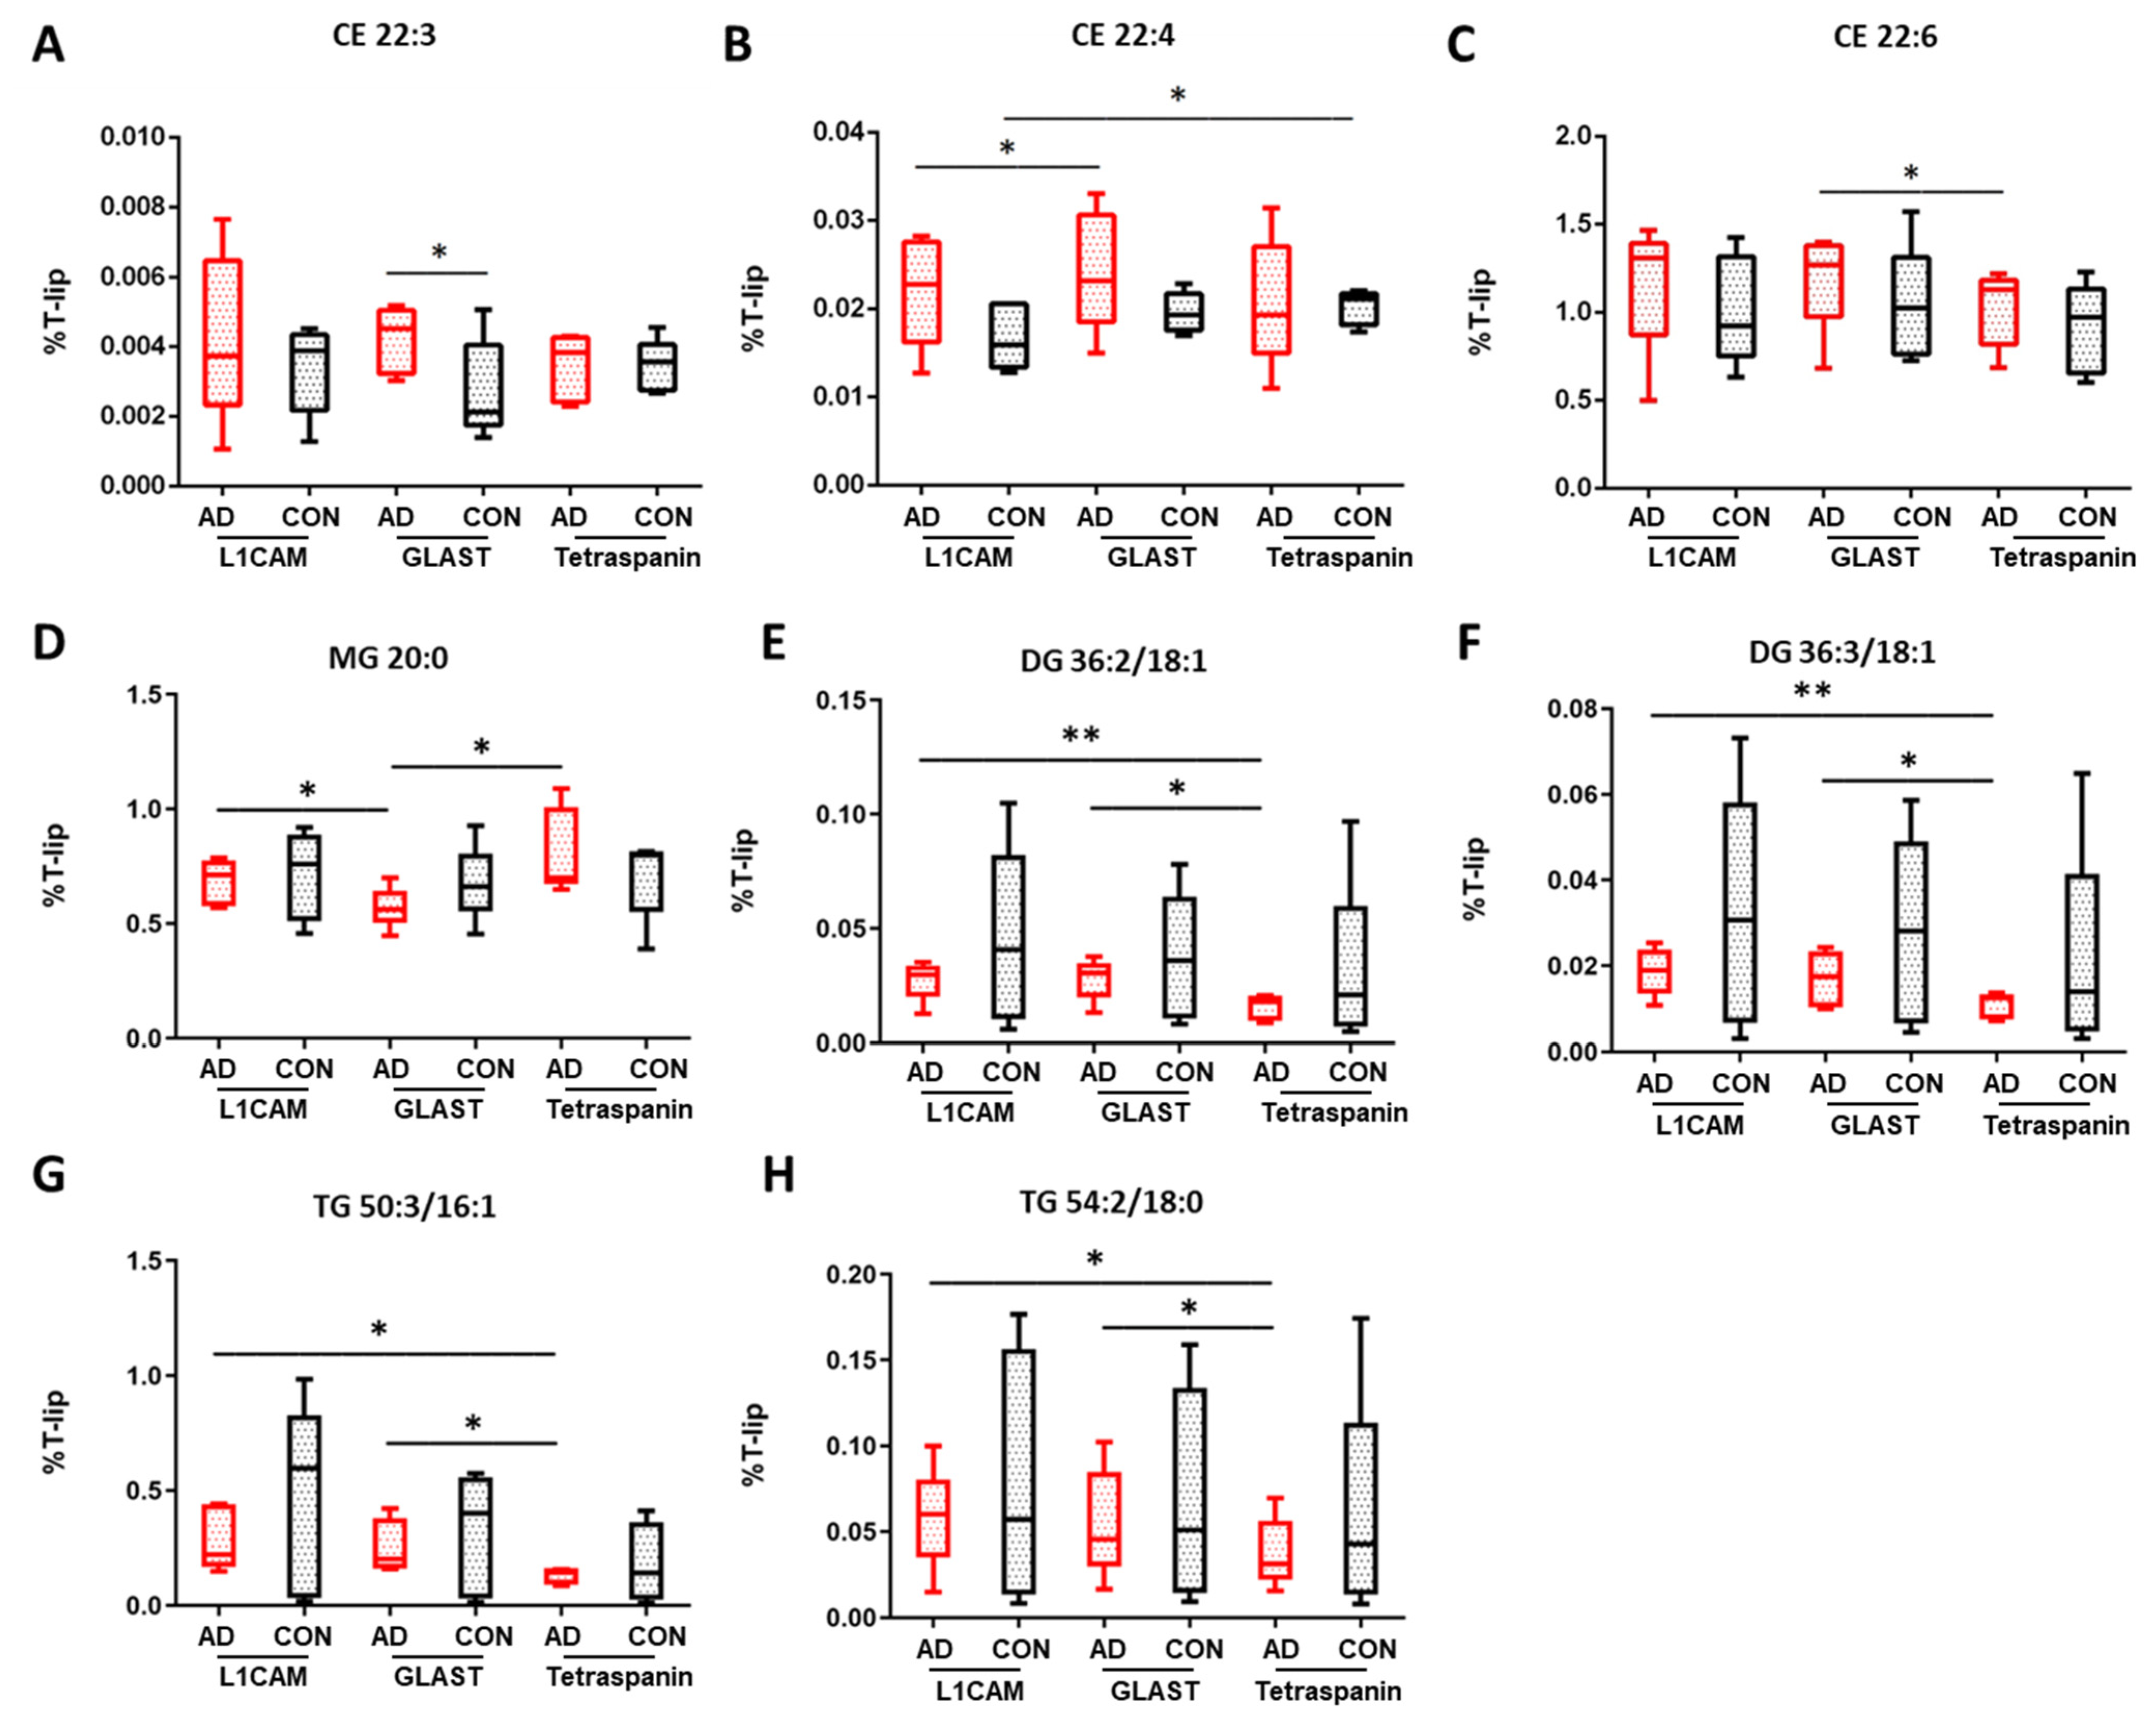
3.4. Cholesterol Ester and Glycerolipid Levels in EV Cargo
Τhe most highly abundant lipid class detected was cholesterol esters (CE), with some of their groups presenting significant differences between EV types (
Table S3). As shown in
Figure 2, an increase in CE 22:3 was observed in AEVs derived from AD patients compared to multi-origin EVs (
p = 0.027), in CE 22:4 between AD AEVs and NEVs (
p = 0.042), as well as in CE 22:6 abundance between AEVs and multi-origin EVs in AD samples (
p = 0.041). A diminution of CE 20:3 was found in control multi-origin EVs compared to control AEVs (
p = 0.001), as well as in control NEVs compared to multi-origin EVs for CE 22:4 species (
p = 0.028). CE 18:2 and CE 20:4 were the most abundant among CE lipids (
Table S3).
Comparing individual glycerolipid classes in EVs, important insights were generated. Of the detected monoacylglycerol species, there was a larger proportion of saturated fatty acids (SFA) compared to monounsaturated fatty acids or polyunsaturated fatty acids (PUFA). The three detected SFA species MG 16:0, MG 18:0 and MG 20:0 presented the highest overall relative abundance in all EV types (
Table S3). MG 20:0 was decreased in AD AEVs compared to NEVs (
p = 0.024) and multi-origin EVs (
p = 0.033), as
Figure 2 shows. MG 20:3 and MG 22:2 levels were significantly higher in multi-origin EVs in AD compared to control samples (
p = 0.013 and
p = 0.020, respectively,
Table S3). Significant differences were also found in MG 18:0, MG 18:2 and MG 20:1 levels between control NEV and multi-origin EV samples (
p = 0.047,
p = 0.044 and
p = 0.048), as well as in MG 18:2, MG 20:1, MG 20:2 and MG 22:1 between control AEV and multi-origin EVs (
p = 0.001,
p = 0.030,
p = 0.041,
p = 0.007). Focusing on diacylglycerol lipids, significantly altered species were detected for AD NEVs and AEVs compared to multi-origin EVs, such as DG 36:2/18:1 (
p = 0.009 and
p = 0.012,
Figure 2E) and DG 36:3/18:1 (
p = 0.006 and
p = 0.021,
Figure 2F). Significant changes in the contents of DG species were also observed for these EV types when comparing AD and control samples (34:2/16:0, 34:2/16:1, 36:1/18:0, 38:2/18:1, 38:4/18:1, 40:5/18:1 and 40:6/18:1). Lower levels of DG 40:5/18:0 were found in AEVs of AD compared to control samples (
p = 0.044). In triacylglycerol lipids, significant alterations were detected in neuronal and astrocytic EVs compared to multi-origin EVs, such as TG 50:3/16:1 (
p = 0.042 and
p = 0.045, respectively) and TG 54:2/18:0 (
p = 0.024 and
p = 0.034, respectively), as shown in
Figure 2G,H. Similar trends were observed in TG species containing MUFA (52:5, 54:6, 54:7, 56:3) and omega-6 PUFA (54:5, 54:6, 54:7, 56:4, 56:7, 56:8, 56:9, 58:5, 58:6,
Table S3) while significant differences were noted for lipid species incorporating omega-6 PUFA such as TG 60:7/22:6 and TG 60:9/22:6 between neuronal AD and control samples (
p = 0.009 and
p = 0.036, respectively).
3.5. Sphingolipid, Glycerophospholipid and Lysophosholipid Levels in EVs
Shingomyelin (SM) species were the most enriched class of sphingolipids detected in EVs, with SM d18:1/16:0 and SM d18:1/16:1 being significantly reduced in neuronal EVs compared to multi-origin EVs in AD samples (
p = 0.030 and
p = 0.009,
Table S3). Dihydrosphingomyelin (dhSM) species also followed suit, with diminished levels of dhSMd18:0/16:0 found in neuronal EVs compared to multi-origin EVs in AD samples (
p = 0.024), while most of dhSM lipids were significantly altered between astrocytic EVs and multi-origin EVs of control samples (
Table S3). Similarly, lower levels of Cer d18:1/16:1, Cer d18:1/20:1 and Cer d18:1/24:1 were observed between NEVs compared to multi-origin EVs of AD samples (
p = 0.012,
p = 0.046,
p = 0.074,
Table S3), as well as for Cer d18:1/16:0 levels in neuronal and astrocytic EVs compared to multi-origin EVs of control samples (
p = 0.010 and
p = 0.007, respectively). Moreover, significant changes in the contents of dihydroceramide (dhCer) molecular species were observed when comparing neuronal and astrocytic EVs in AD (d18:0/20:0,
p = 0.036; d18:0/22:1,
p = 0.048 and d18:0/24:0,
p = 0.005), as well as neuronal EVs, astrocytic EVs and multi-origin EVs, respectively (d18:0/22:0,
p = 0.024 and d18:0/18:1,
p = 0.047), as presented in
Table S3. Focusing on sulfatide lipids, significantly altered species were identified among AD neuronal and astrocytic EVs compared to CD subfamilies (
Table S3) such as d18:0/22:0 (
p = 0.010 and
p = 0.027), d18:1/16:1 (
p = 0.020 and
p = 0.030) and d18:1/20:0 (
p = 0.015 and
p = 0.030). Sulf d18:1/18:0 was decreased in neuronal EVs compared to multi-origin EVs of AD samples (
p = 0.010), along with d18:1/24:0 (
p = 0.004) and d18:1/24:1 (
p = 0.015). Both species were also significantly altered in control samples (
p = 0.010 and 0.013, respectively).
Focusing on individual glycerophospholipids (GLPs) classes in EVs, important differences were observed between AD and control samples, as
Figure 3 shows. Phosphatidylcholine (PC) and phosphatidylethanolamine (PE) species were the most enriched classes of GLPs detected in EVs (
Figure S4, Supplementary Materials). Specifically, significant changes in the contents of PC species were seen when comparing AD neuronal and astrocytic EVs (32:1,
p = 0.025; 38:0,
p = 0.015; 40:7,
p = 0.016; 42:7,
p = 0.039), AD neuronal Evs and multi-origin Evs (38:1,
p = 0.038; 40:7,
p = 0.040; 42:7,
p = 0.043) and multi-origin Evs between AD and control samples (34:0,
p = 0.033; 34:1,
p = 0.041; 36:0,
p = 0.044, 36:1,
p = 0.036; 389:3,
p = 0.040), as shown in
Table S3. We also proceeded with the exploration of ether PC species (
Table S3). Reduced levels of PCe 38:1 and PCe 40:7 in neuronal compared to astrocytic EVs in AD samples (
p = 0.049 and
p = 0.018, respectively), in AD neuronal EVs compared to multi-origin EVs (PCe 36:0,
p = 0.042 and PCe 36:3,
p = 0.049) and in AD astrocytes EVs compared to multi-origin EVs (PCe 32:0,
p = 0.016 and PCe 36:0,
p = 0.024).
In terms of PE lipids, significant alterations were found in astrocytic EVs between AD and control samples (36:0,
p = 0.026 and 38:0,
p = 0.030,
Table S3), as well as in AD samples comparing (i) neuronal and astrocytic EVs (36:0,
p = 0.050; 36:1,
p = 0.008; 38:1,
p = 0.041), (ii) neuronal and multi-origin EVs (34:2,
p = 0.014; 36:0,
p = 0.001; 36:1,
p = 0.020; 36:3,
p = 0.007; 38:0,
p = 0.006; 38:1,
p = 0.010, 38:3,
p = 0.039; 38:4,
p = 0.010) and (iii) astrocytic and multi-origin EVs (32:,
p = 0.026). In control samples, increased levels of PE 32:0 and PE 36:4 were found between neuronal and astrocytic EVs (
p = 0.041 and
p = 0.020, respectively), an enhancement of PE 38:1 when comparing neuronal and multi-origin EVs (
p = 0.005) and a diminution of PE 32:0, PE 40:5 and PE 42:6 when comparing astrocytic and multi-origin EVs (
p = 0.026,
p = 0.008 and
p = 0.027, respectively,
Table S3). The analysis of plasmalogen phosphatidylethanolaminelipids (Pep), an important class of GLPs, which contain a characteristic vinyl ether double bond, showed significant alterations in AD samples when comparing neuronal and astrocytic EVs (34:1,
p = 0.005; 38:6,
p = 0.013, 40:7,
p = 0.040) as well as neuronal and multi-origin EVs (34:1,
p = 0.027, 34:2,
p = 0.036, 38:4,
p = 0.0004, 38:5,
p = 0.019, 38:6,
p = 0.002, 40:6,
p = 0.004;
Table S3). Focusing on phosphatidic acid (PA) contents (
Table S3), raised levels of PA 30:0 were seen when comparing AD neuronal and astrocytic EVs (
p = 0.008), as well as in multi-origin EVs compared to neuronal (
p = 0.004) and astrocytic EVs (
p = 0.006). Moreover, a diminution in PA 40:6 was observed when comparing neuronal and astrocytic EVs (
p = 0.044) and astrocytic EVs and multi-origin EVs (
p = 0.010) in AD samples. Significant differences were also found between AD and control multi-origin EVs (
Table S3). On the other hand, regarding phoshatidylserine (PS) lipids (
Table S3), an enhancement of 36:2 and 38:2 species was seen when comparing AD neuronal EVs compared to controls (
p = 0.038 and
p = 0.029, respectively). Furthermore, differences were also seen for astrocytic EVs derived from AD samples compared to controls (36:0,
p = 0.041; 36:1,
p = 0.038; 36:2,
p = 0.024; 38:1,
p = 0.032; 38:2,
p = 0.039, 42:7,
p = 0.017), as well as when comparing multi-origin EVs between AD and control samples, such as 36:2 (
p = 0.039), 38:45 (
p = 0.003) and 40:6 (
p = 0.014). Limited alterations were found in the contents of phoshatidylinositol (PI) molecular species (
Table S3), such as a difference in PI 40:4 in neuronal EVs when comparing AD and controls samples (
p = 0.027,
Figure 3G) and PI 36:2 when comparing neuronal EVs and multi-origin EVs in AD samples (
p = 0.032). Regarding phoshatidyglycerol (PG) lipids, significant alterations were observed in the levels of PG 30:0 and PG 36:0 when comparing AD and control samples of astrocytic EVs (
p = 0.0001 and
p = 0.045, respectively), as well as when comparing AD and control samples of neuronal EVs (
p = 0.005) for PG 30:0 species. The observed changes in AD samples should also be stressed here when comparing (i) neuronal and astrocytic EVs (PG 30:0,
p = 0.001; PG 36:3,
p = 0.036; PG 38:1,
p = 0.049), (ii) neuronal EVs and multi-origin EVs (PG 36:1,
p = 0.010, PG 36:4,
p = 0.012, PG 38:3,
p = 0.022, PG 40:6,
p = 0.033) and (iii) astrocytic EVs and multi-origin EVs (PG 34:2,
p = 0.013, PG 38:0,
p = 0.045, PG 40:6,
p = 0.013), as presented in
Figure 3 and shown in
Table S3.
Lastly, important differences were observed for lysophospholipids (LPLs), such as fold differences in individual LPC, LPE, LPI and LPS species. Significant changes were found in lysophosphatidylethanolamine (LPE) molecular species when comparing AD and control neuronal (20:2,
p = 0.015) and astrocytic (20:1,
p = 0.011) EVs (
Table S3). Furthermore, reduced levels of 20:3 were observed in AD neuronal EVs compared to astrocytic ones (
p = 0.045), as well as for 18:0 in AD astrocytic EVs compared to multi-origin EVs (
p = 0.080,
Figure 4A). Most lysophosphatidylcholine (LPC) lipids were significantly altered when comparing astrocytic EVs and to multi-origin EVs in AD and control samples (16:1, 18:0, 18:1, 20:1, 20:2), as well as 20:3 and 20:4 when comparing AD neuronal EVs and multi-origin EVs (
p = 0.044 and
p = 0.029, respectively), as shown in
Figure 4 and summarized in
Table S3. An enhancement of lysophosphatidylinositol (LPI) 18:1 was found when comparing AD and control neuronal EVs (
p = 0.047,
Table S3), whereas a decrease in LPI 16:0, LPI 18:0 and LPI 18:1 was found when comparing either neuronal EVs and multi-origin EVs (
p = 0.013,
p = 0.002,
p = 0.003, respectively) or astrocyte EVs and multi-origin EVs of AD samples (
p = 0.003,
p = 0.003,
p = 0.014, respectively). Some of lysophosphatidylserine (LPS) lipids were also significantly changed, such as LPS 18:0 when comparing AD neuronal and astrocytic EVs (
p = 0.034,
Figure 4E), LPS 20:4 when comparing astrocytic AD and control samples (
p = 0.037,
Figure 4F) and LPS 16:0 when comparing neuronal and astrocytic EVs of control samples (
p = 0.025), as shown in
Table S3.
3.6. Multivariate PCA
The multivariate analysis provided a holistic view of the variability between EVs isolated from AD patients and healthy controls. In the multi-origin EV samples, the first three PCs accounted for 57% of the sample variability. Clustering of AD and control samples along PC3 is significant, with free cholesterol (FC), PA, LPI, PC, AC and PS lipid species contributing to this separation (
Figure 5a,b). Influential individual factors for PC3 include PA with 42:7, 42:5, 30:0, 40:7 and 38:4 fatty acid chains; PI with 38:5, 40:7 and 36:3 fatty acid chains; CE with 18:2, 22:5 and 20:2 fatty acid chains; and LPI with 18:0 and 16:0 fatty acid chains, all with a higher presence in AD all-cell-origin EV samples (negative loadings) (
Figure 5f). FC was highly enriched in control samples (positive loadings) (
Figure 5f). Additionally, the impact of PA and PS species in driving separation of AD samples from control patients via enrichment in AD samples aligns with univariate comparisons in
Figure 1c,e. No significant separation was seen along PC1 or PC2 (
Figure 5a). Of the unique lipids in multi-origin EV samples with significantly different concentrations between AD and control subjects, PA species (30:0, 34:0, 38:4, 40:4, 40:7) and PS species (36:0, 36:2, 38:1, 38:2, 38:3, 38:4, 38:5, 40:5, 40:6) were the most abundant and all enriched in AD subjects (
Figure 8a). Cer d18:1/18:0, LacCer d18:0/20:0, PCe 36:0, 36:1, PI 42:6 and LPS 20:1, 24:1 were also enriched in the AD group (
Figure 9a). BMP 32:1, PG 36:0, and AcylPG 16:0/36:0 were significantly depleted in AD samples (
Figure 8a). Given the low N, no individual lipid species remained significant after multiple-testing (Bonferroni) correction.
Figure 5.
Multivariate analysis was conducted on individual lipid molecules that were detected via MS in EV samples isolated with a pan-Tetraspanin IP. Crosses indicate the center of the subject-group cluster, with the vertical and horizontal components representing the standard deviation of a group along the corresponding PC (a–c). Asterisks indicate a significant difference (p < 0.05) between AD and control groups along a PC. Black lines represent the magnitude and direction of the pooled lipid species’ relative contribution to any separation between AD and control clusters. The top 10 most influential lipid species are depicted. The 25 largest individual lipid contributions to variability along principal components 1, 2 and 3 are depicted through loadings plots (d–f).
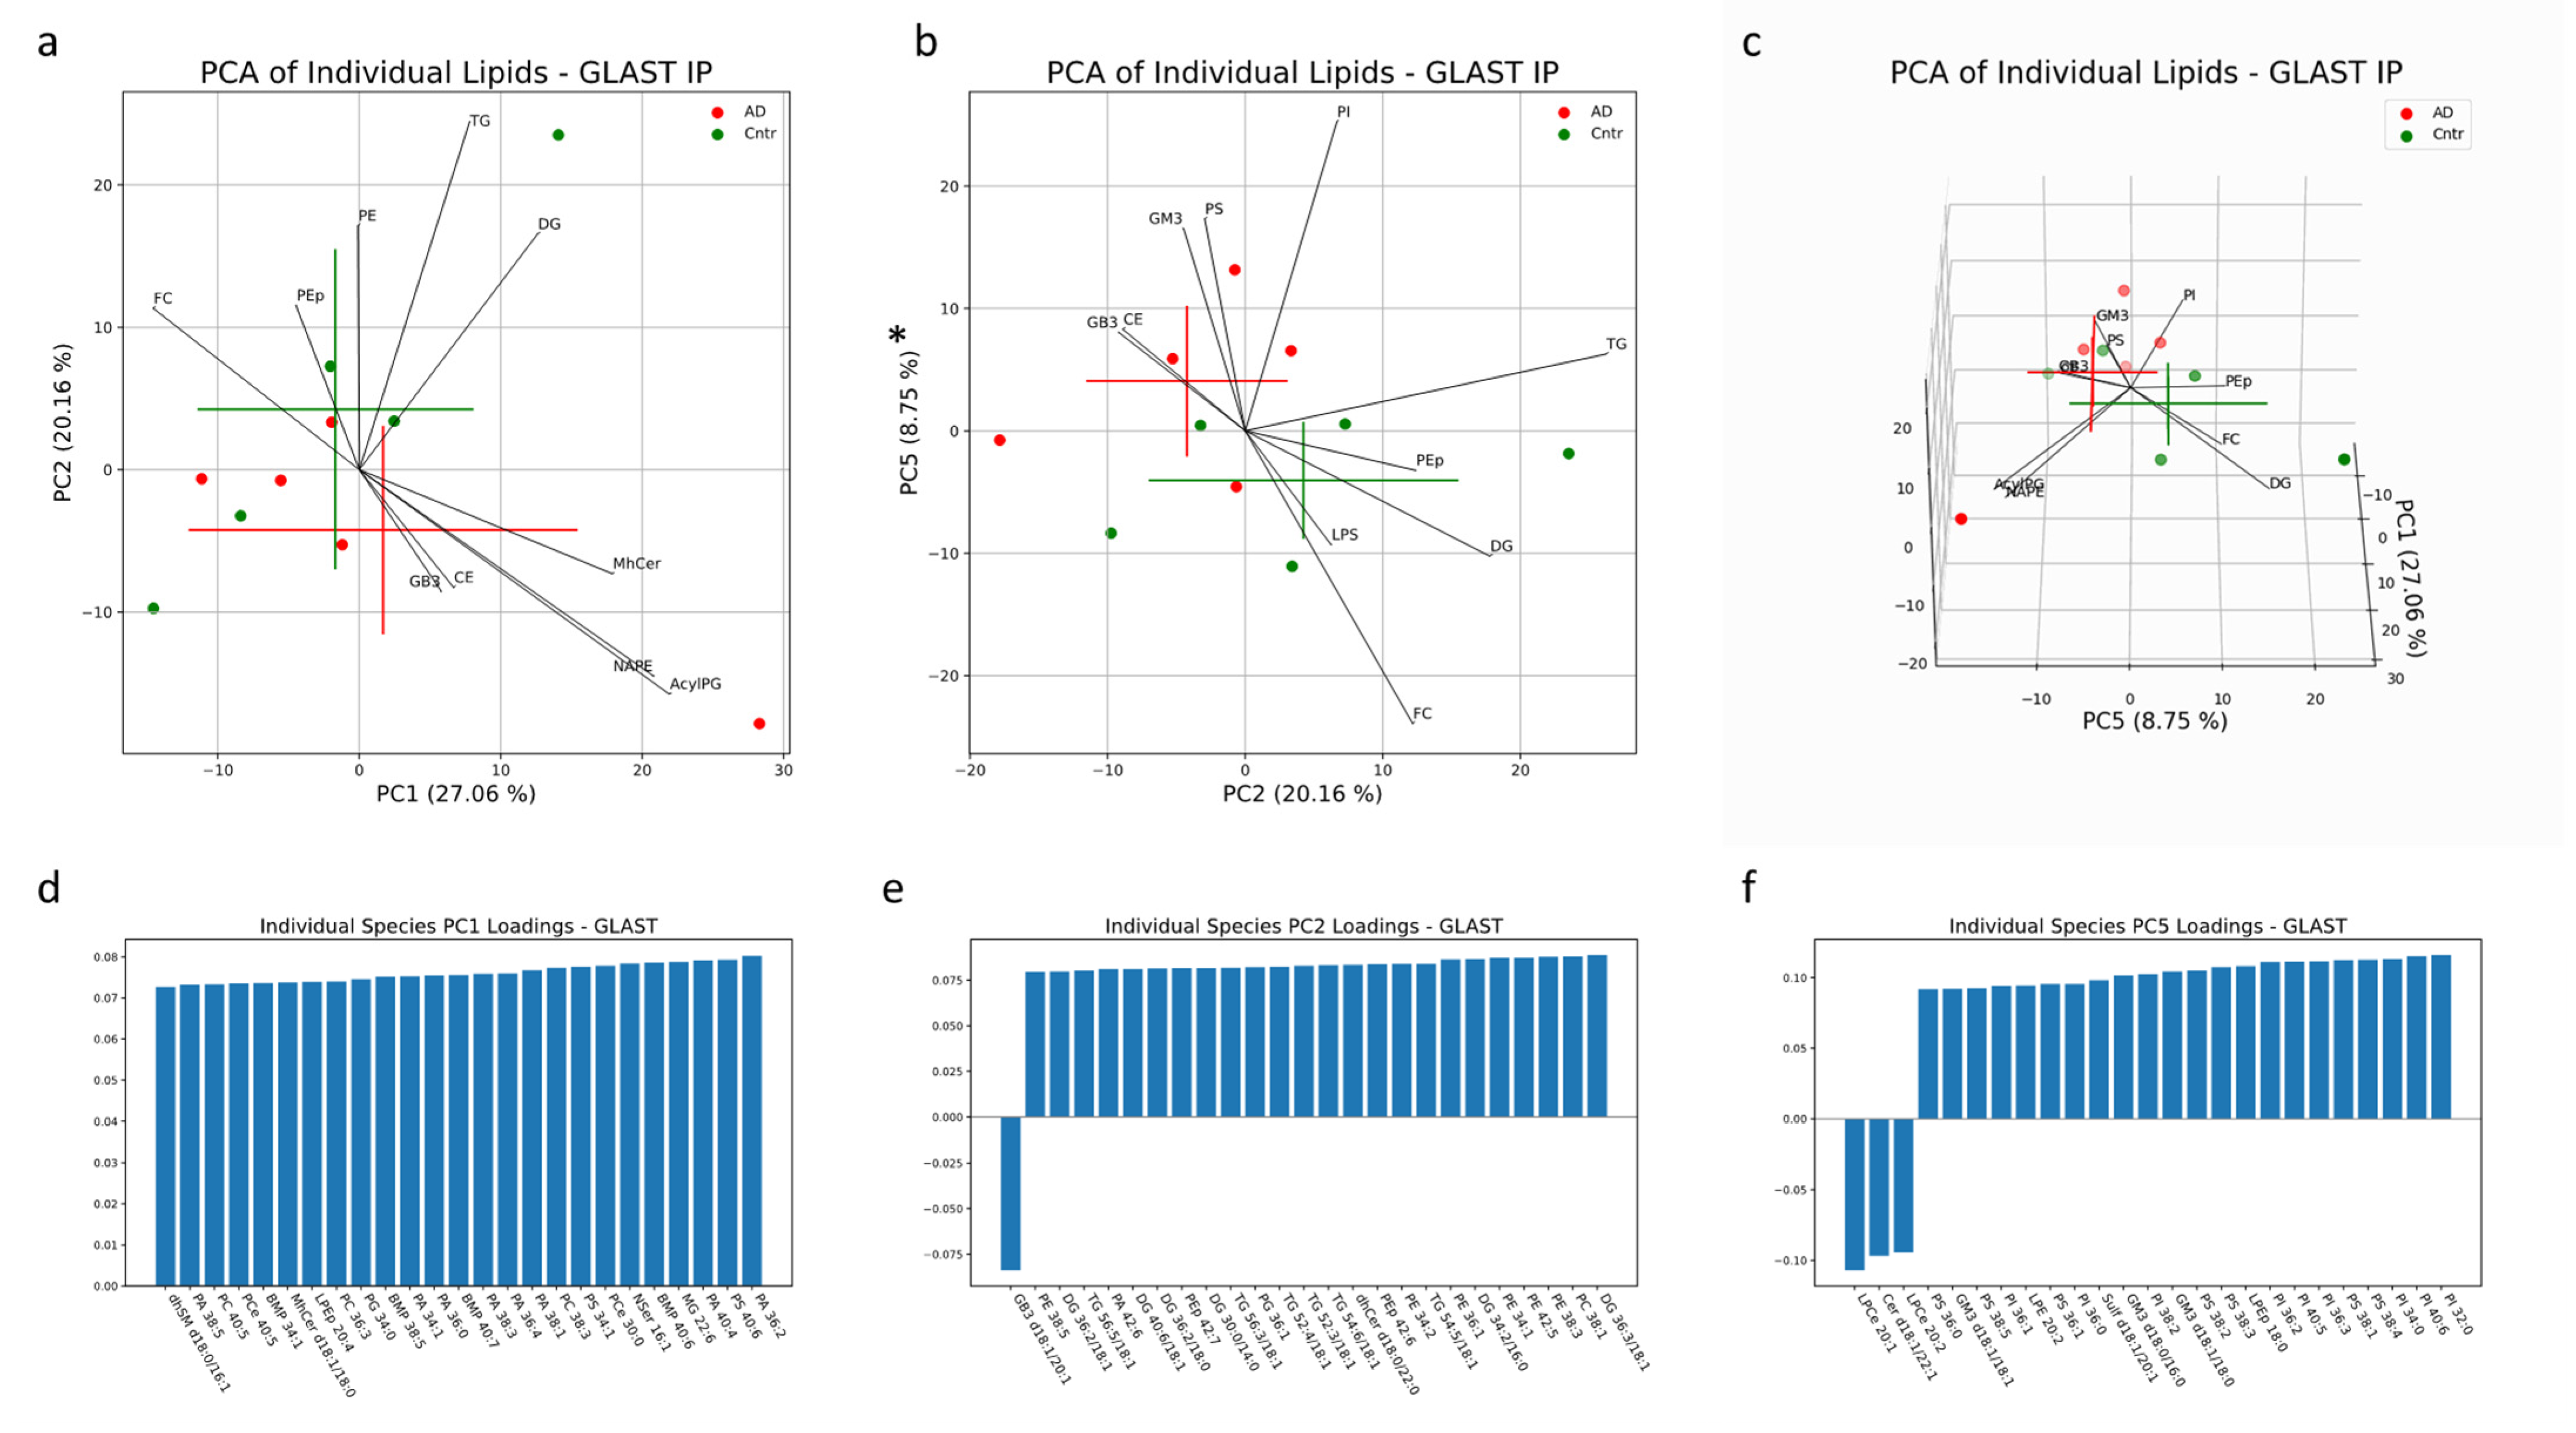
In AEVs, 56% of the variation was explained in PC1, PC2 and PC5 collectively. Significant separation between AD and control AEV samples was only seen in PC5, with the PI, PS and GM3 mainly contributing to group separation in the positive direction along this component and mainly FC, DG and LPS contributing to separation in the negative direction (
Figure 6b). Individual lipids with large, positive loadings include PI with 32:0, 40:6, 34:0, 36:3, 40:5, 36:2, 38:2, 36:0 and 36:1 fatty acid chains; PS with 38:4, 38:1, 38:3, 38:2, 36:1, 38:5 and 36:0 fatty acid chains; and GM3 with d18:1/18:0, d18:0/16:0 and d18:1/18:1 fatty acid chain pairs (
Figure 6f). LPCe with 20:2 and 20:1 fatty acid chains and Cer d18:1/22:1 had large loadings in the negative direction of PC5 (
Figure 6f). No significant separation was seen along PC1 or PC2 (
Figure 6a). The lipid profiles of AEV samples from AD and control subjects contained significant differences in concentrations of PS species (36:1, 36:2, 38:1, 38:4), all enriched in AD patients (
Figure 8b). These findings align with univariate analysis comparing AD and control groups in AEVs (
Figure 1e). PI 38:5, dhCer d18:0/20:0, PG 30:0, BMP 38:1, 38:4 and LPE 20:1 were also enriched in AEVs from AD subjects, while PE 36:0, PEp 38:6, 40:7 and DG 40:5/18:0 were depleted (
Figure 8b). Of these species, PG 30:0 remained significant after multiple-testing (Bonferroni) correction.
Figure 6.
Multivariate analysis was conducted on individual lipid molecules that were detected via MS in EV samples isolated with a GLAST IP. Crosses indicate the center of the subject-group cluster, with the vertical and horizontal components representing the standard deviation of a group along the corresponding PC (a–c). Asterisks indicate a significant difference (p < 0.05) between AD and control groups along a PC. Black lines represent the magnitude and direction of the pooled lipid species’ relative contribution to any separation between AD and control clusters. The top 10 most influential lipid species are depicted. The 25 largest individual lipid contributions to variability along principal components 1, 2 and 5 are depicted through loadings plots (d–f).
In the PCA for NEVs, 59% of the variation is explained by the first three PCs (
Figure 7a–c). No significant clustering between AD and control NEV samples was observed in any of the PCs. The largest distinction between the two groups is seen along PC3 (
p = 0.06) (
Figure 8a–c). The GM3, NSer and NAPE classes of lipids on average contribute most to the variability along PC3 (
Figure 7a–c). Of the individual species with large absolute loadings, PCe with 38:6, 38:1, 38:2 and 38:0 fatty acid chains and MG with 22:0, 20:1, 22:2 and 20:3 fatty acid chains had positive loadings (in the direction of the control NEV samples) and PC with 42:7 and 42:6 fatty acid chains; AcylPG with 16:0/36:4, 16:0/38:4 and 16:0/36:0 fatty acid chain pairs; and NAPE with p18:1/20:4/20:4 and p18:1/22:4/20:4 fatty acid chains had negative loadings (in the direction of the AD NEV samples) (
Figure 7d–f).
Figure 7.
Multivariate analysis was conducted on individual lipid molecules that were detected via MS in EV samples isolated with an L1CAM IP. Crosses indicate the center of the subject-group cluster, with the vertical and horizontal components representing the standard deviation of a group along the corresponding PC (a–c). Black lines represent the magnitude and direction of the pooled lipid species’ relative contribution to any separation between AD and control clusters. The top 10 most influential lipid species are depicted. The 25 largest individual lipid contributions to variability along principal components 1, 2 and 3 are depicted through loadings plots (d–f).
Of the individual lipids that are significantly enriched in NEVs from AD subjects, GM3 (d18:0/18:0, d18:0/20:0, d18:1/18:0, d18:1/18:1, d18:1/20:0, d18:1/20:1) is the most represented. Additionally, dhSM d18:0/20:1, MhCer d18:0/26:1, Sulf d18:1/20:1, AcylPG 16:0-38:5 and NAPE p18:0/22:4/20:4 are also enriched in NEVs from AD subjects. Only PG 30:0 is significantly depleted in NEVs from AD subjects (
Figure 8c). However, none of these lipids remained significant post multiple-testing (Bonferroni) correction. Enrichments for all other individual lipids are outlined in
Table S4.
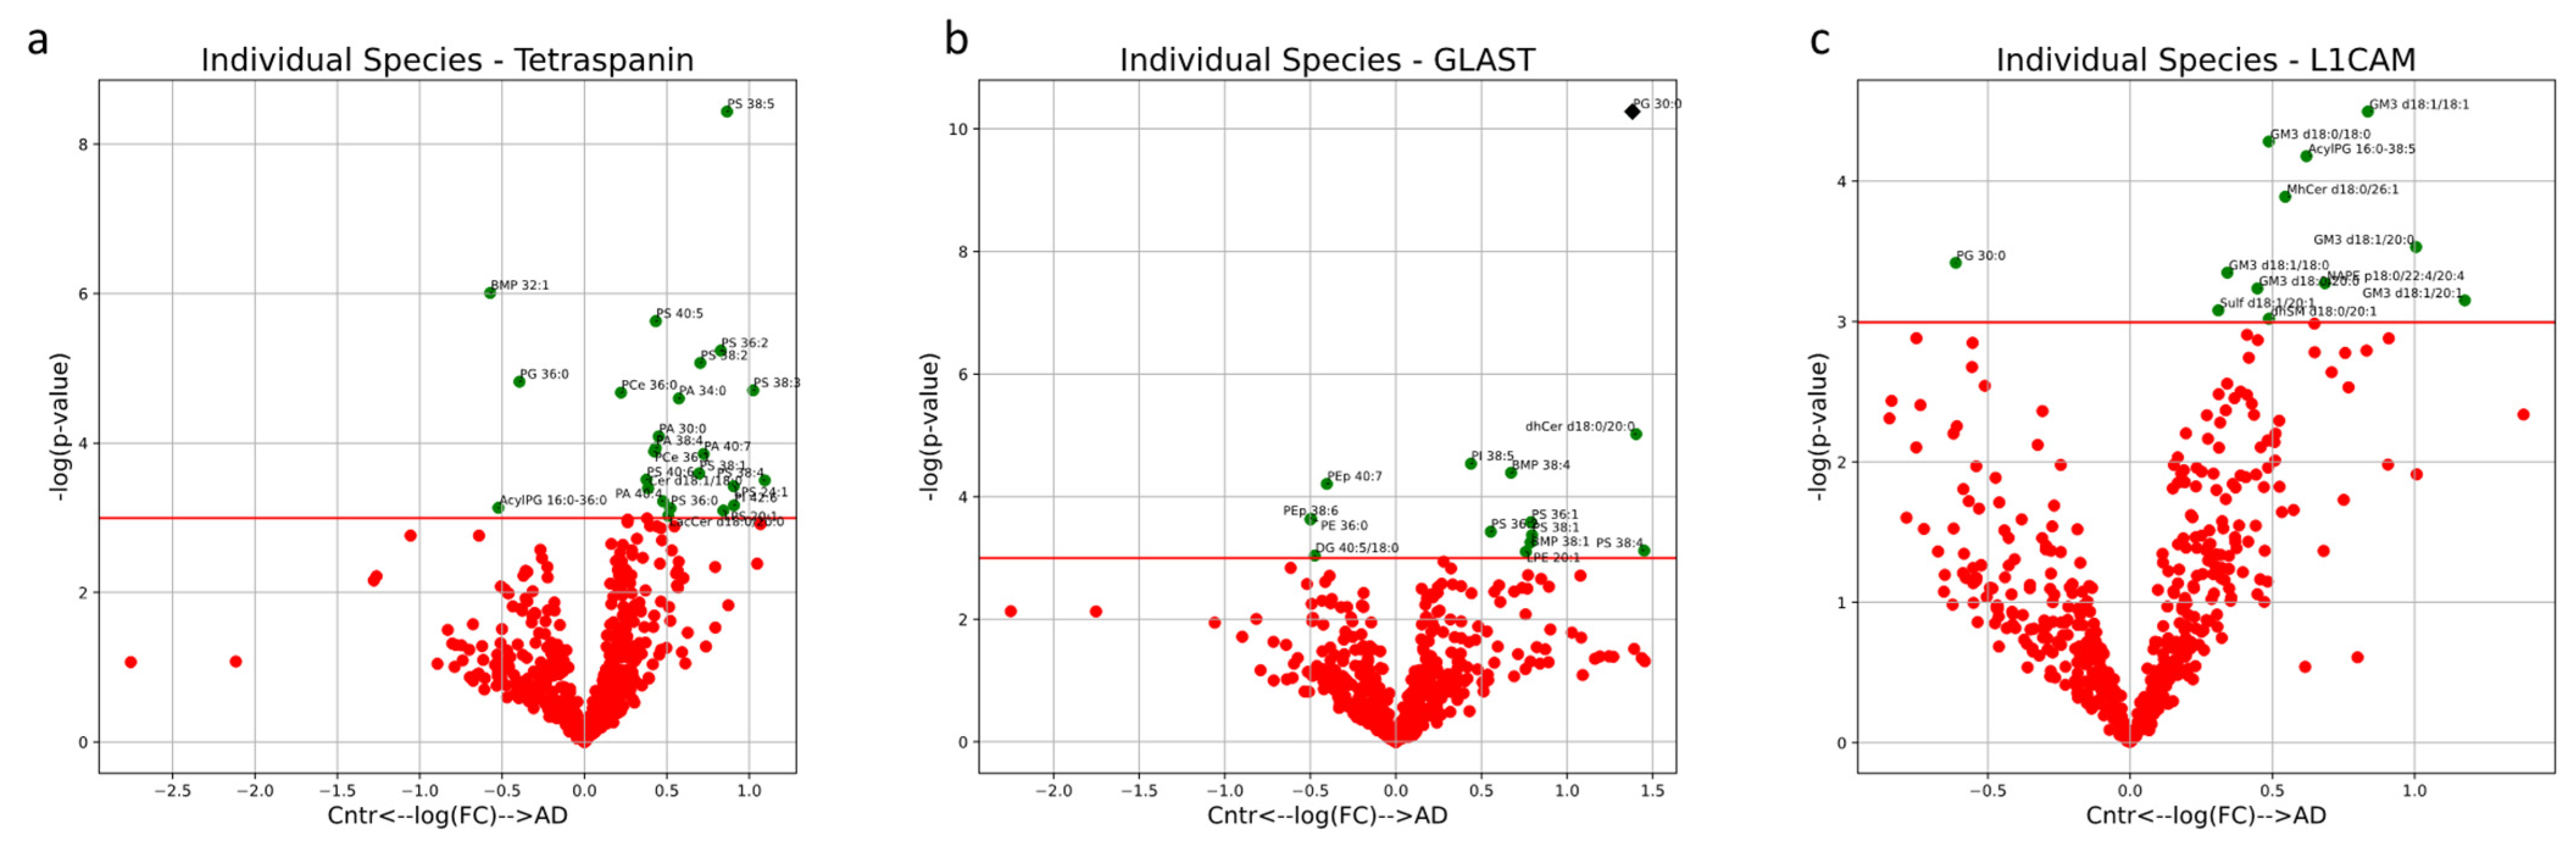
Figure 8.
Volcano plots describe the magnitude and significance of differences in individual lipid concentrations between AD and control EV samples. EVs were isolated with pan-Tetraspanin (a), GLAST (b) or L1CAM (c) IP. Green points above the horizontal red line depict lipids with concentrations significantly different (p < 0.05) between AD and control samples. Black diamonds above the horizontal red line depict lipids with concentrations significantly different (p < 0.05) after multiple-testing (Bonferroni) correction between AD and control samples. Positive values on the horizontal axis indicate enrichment in AD samples and vice versa.
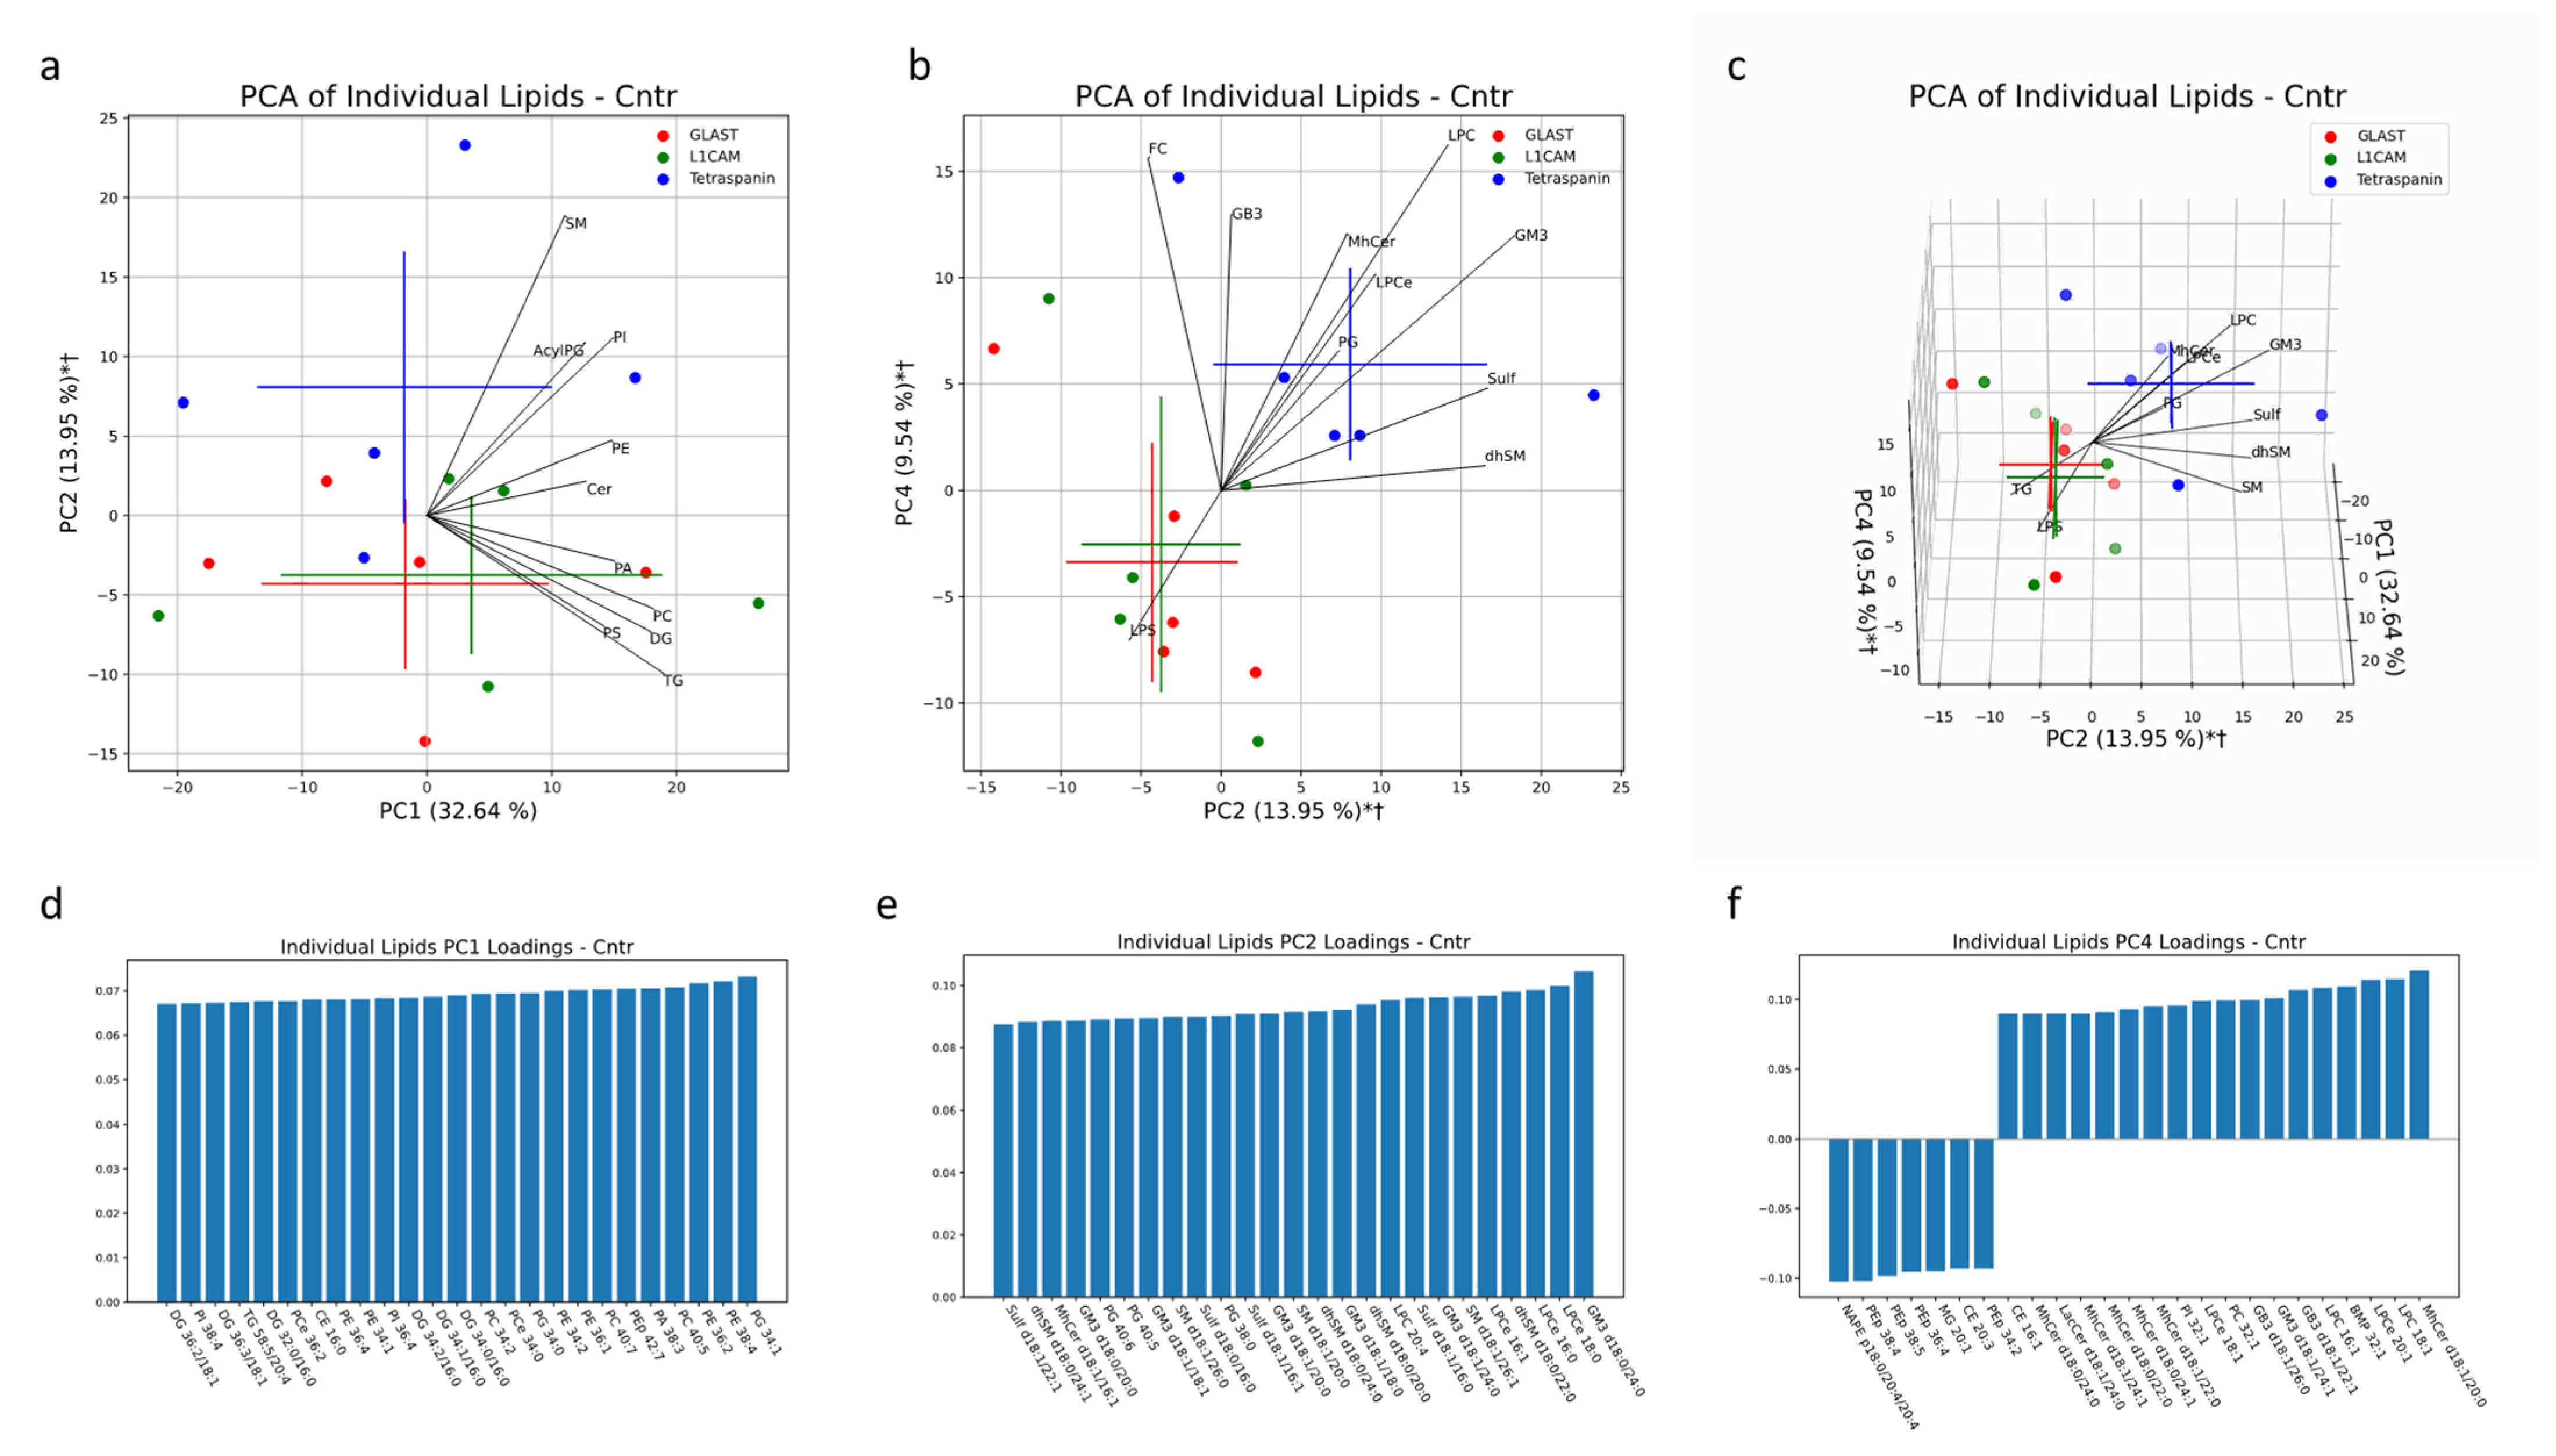
Multivariate analysis was also conducted in AD and healthy controls to characterize the lipid profiles of NEVs and AEVs in comparison to the multi-origin EV population (marked as Tetraspanin-EVs). Together, PC1, PC2 and PC4 accounted for 56% of the variability in EV samples from healthy controls. Both the NEV and AEV subsets separated significantly in the same direction from multi-origin EVs along PC2 and PC4 (
Figure 9b,c). Lipid species that heavily contributed to this separation include LPC, LPCe, MhCer and GM3, enriched in multi-origin EVSs, and LPS, enriched in NEVs and AEVs (
Figure 9b,c). Additionally the significant impact of LPC species in differentiating multi-origin EVs from brain-derived EVs lines up with the univariate comparisons depicted in
Figure 1G. Along PC2, GM3 d18:0/24:0, d18:1/24:0, d18:0/18:0, d18:1/20:0. 818:1/18/1 and d18:0/20:0 and LPCe 18:0, 16:0 and 16:1 had large loadings in the direction of the multi-origin EV cluster (
Figure 9e). Along PC4, PEp lipids (38:4, 38:5, 36:4, 34:2) had large loadings in the direction of the NEV clusters, while MhCer lipids (d18:1/20:0, d18:1/22:0, d18:0/24:1, d18:0/22:0, d18:1/24:1, d18:0/24:0) and GB3 lipids (d18:1/22:1, d18:1/24:1, d18:1/26:0) had large loadings in the direction of the Tetraspanin-EV cluster (
Figure 9f).
Figure 9.
Multivariate analysis was conducted on individual lipid molecules that were detected via MS in EV samples from healthy human subjects. Crosses indicate the center of an EV subset cluster, with the vertical and horizontal components representing the standard deviation of a group along the corresponding PC (a–c). * indicates a significant difference (p < 0.05) between Tetraspanin IP EVs and L1CAM IP EVs along a PC. † indicates a significant difference (p < 0.05) between Tetraspanin IP EVs and GLAST IP EVs along a PC. Black lines represent the magnitude and direction of the pooled lipid species’ relative contribution to any separation between pan-EV (Tetraspanin IP EVs) and brain-associated EVs (L1CAM and GLAST IP EVs). The top 10 most influential lipid species are depicted. The 25 largest individual lipid contributions to variability along principal components 1, 2 and 4 are depicted through loadings plots (d–f).
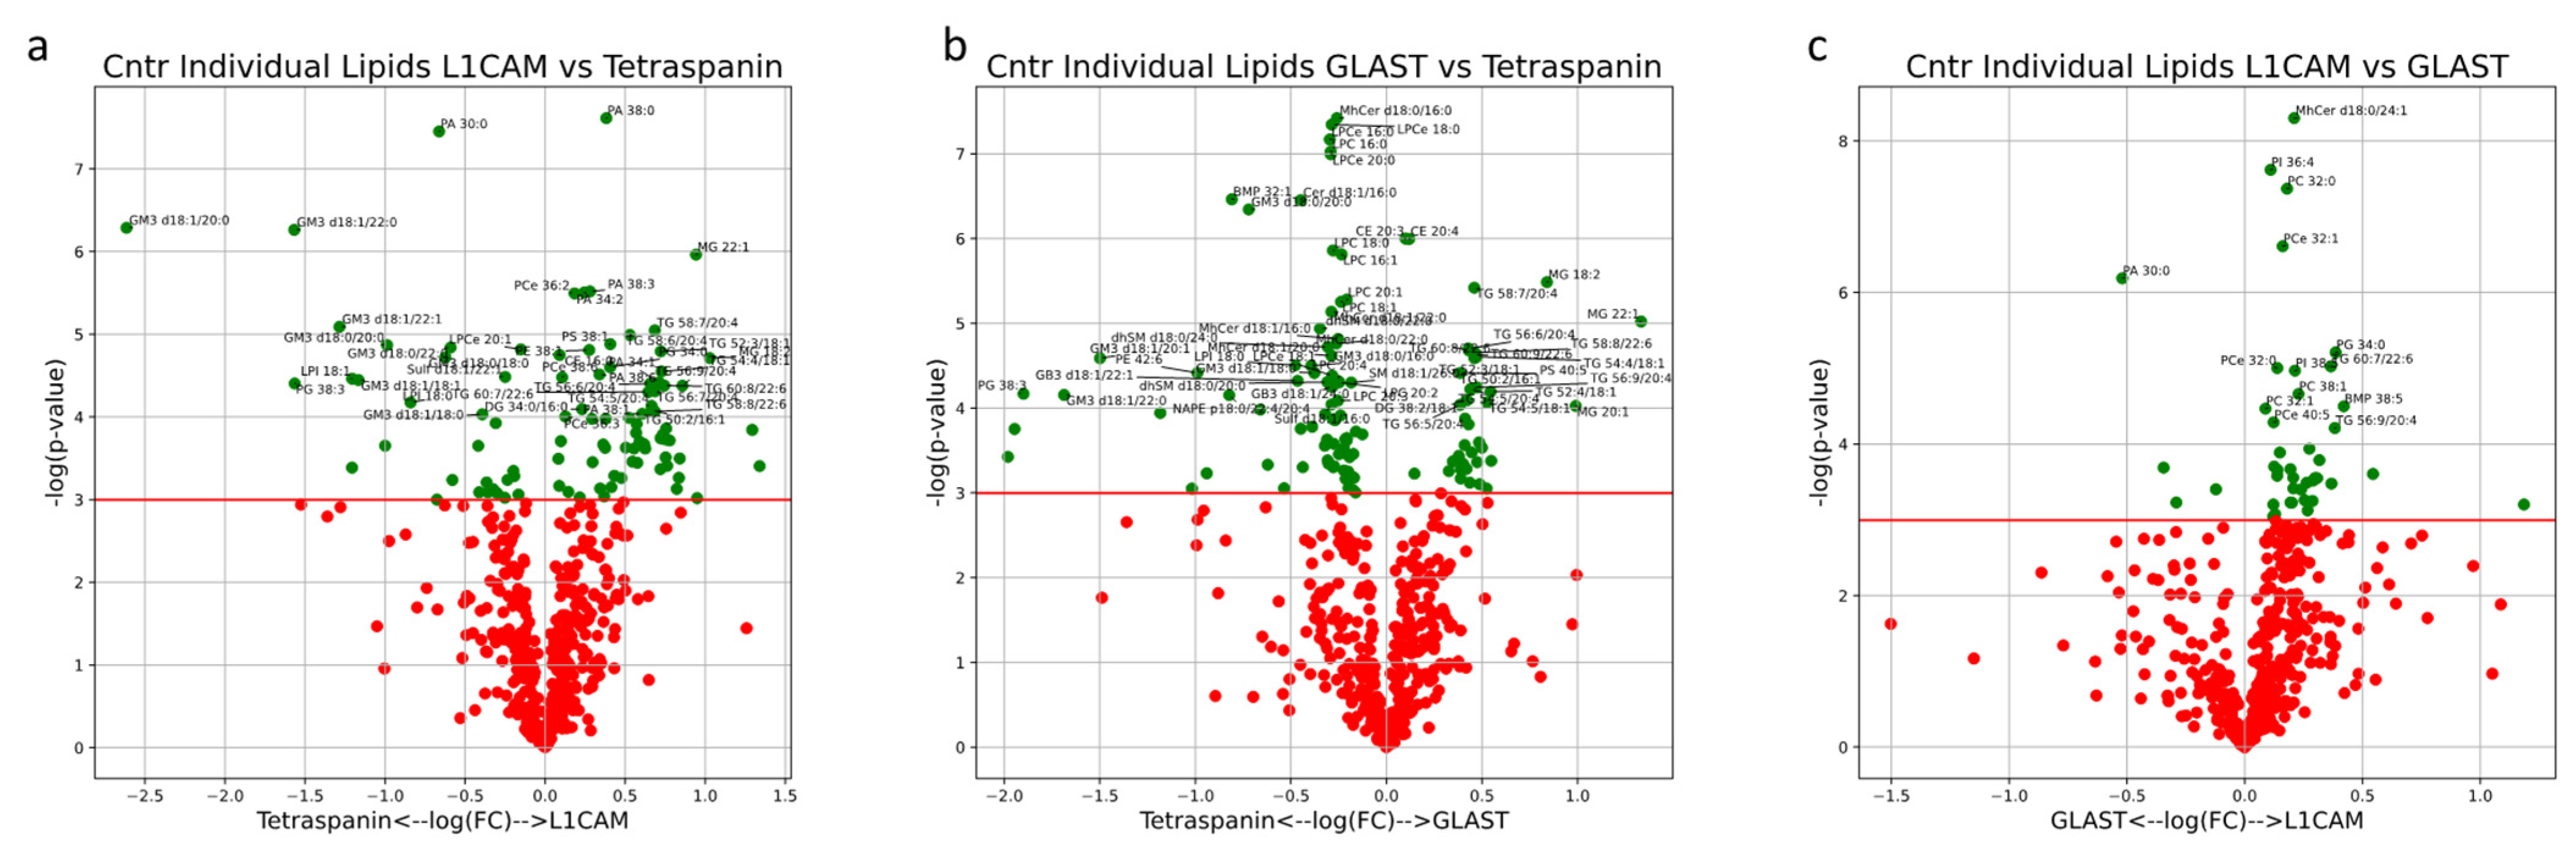
Univariate analysis comparing lipid compositions between EV subsets was also performed. MG lipids (18:2, 20:1, 20:2 and 22:1), DG lipids (32:2/16:1, 36:3/18:1, 38:2/18:1, 38:4/18:1 and 40:5/18:1) and 30 individual TG lipids were significantly enriched in both L1CAM+ and GLAST+ EVs (
Figure 10a,b). Of the lipids uniquely enriched in L1CAM+ NEVs when compared to Tetraspanin-EVs, PA lipids (34:1, 34:2, 36:0, 36:1, 36:2, 38:0, 38:1, 38:3, 38:5 and 38:6) and PCe lipids (34:1, 34:2, 36:2, 36:3, 38:5 and 38:6) were highly represented (
Figure 10a). Lipid species that were broadly depleted in both NEV subtypes EVs included Sulf (d18:0/16:0, d18:0/18:0, d18:0/24:0, d18:1/16:0, d18:1/16:1, d18:1/18:1, d18:1/20:1, d18:1/22:0, d18:1/22:1, d18:1/24:0 and d18:1/24:1), GM3 (d18:0/16:0, d18:1/16:0, d18:0/18:0, d18:0/20:0, d18:0/22:0, d18:1/18:0, d18:1/18:1, d18:1/20:0, d18:1/20:1, d18:1/22:0 and d18:1/22:1), PG (34:2, 38:0, 38:2, 38:3 and 38:5) and LPI (16:0, 18:0 and 18:1) (
Figure 1,
Figure 2,
Figure 3,
Figure 4,
Figure 5 and
Figure 6a,b). Lipid species that were uniquely depleted in GLAST+ AEVs included MhCer (d18:0/16:0, d18:0/22:0, d18:0/22:1, d18:0/24:0, d18:0/24:1, d18:1/16:0, d18:1/16:1, d18:1/20:0, d18:1/22:0 and d18:1/24:0), dhSM (d18:0/18:0, d18:0/18:1, d18:0/20:0, d18:0/22:0, d18:0/22:1, d18:0/24:0 and d18:0/24:1), LPC (16:0, 16:1, 18:0, 18:1, 20:0, 20:1, 20:2, 20:3 and 20:4) and LPCe (16:0, 16:1, 18:0, 18:1, 20:0 and 21:0) (
Figure 6b). When comparing NEVs and AEVs, MhCer lipids (d18:0/24:0, d18:0/24:1, d18:1/20:0, d18:1/22:0 and d18:1/24:1), PC (30:0, 32:0, 32:1, 38:1, 40:7 and 42:7), PCe (30:0, 32:0, 32:1, 40:5 and 42:6) and 11 unique TG lipids were enriched in NEVs, while relatively few lipids were enriched in AEVs (
Figure 10c). However, multiple testing-adjusted lipid compositions were not significantly different between EV subtypes. Overall, both univariate differences and holistic multivariate analysis show similarities between AEVs and NEVs that are not present in multi-origin EVs. Enrichments for all other individual lipids are outlined in
Table S5.
Figure 10.
Volcano plots describe the magnitude and significance of differences in individual lipid concentrations between EV subsets in healthy control subjects (L1CAM vs. Tetraspanin (a), GLAST vs. Tetraspanin (b), L1CAM vs. GLAST (c)). EVs were isolated with L1CAM, GLAST or pan-Tetraspanin IP. Green points above the horizontal red line depict lipids with concentrations significantly different (p < 0.05) between AD and control samples. Black diamonds above the horizontal red line depict lipids with concentrations significantly different (p < 0.05) after multiple-testing (Bonferroni) correction between AD and control samples.
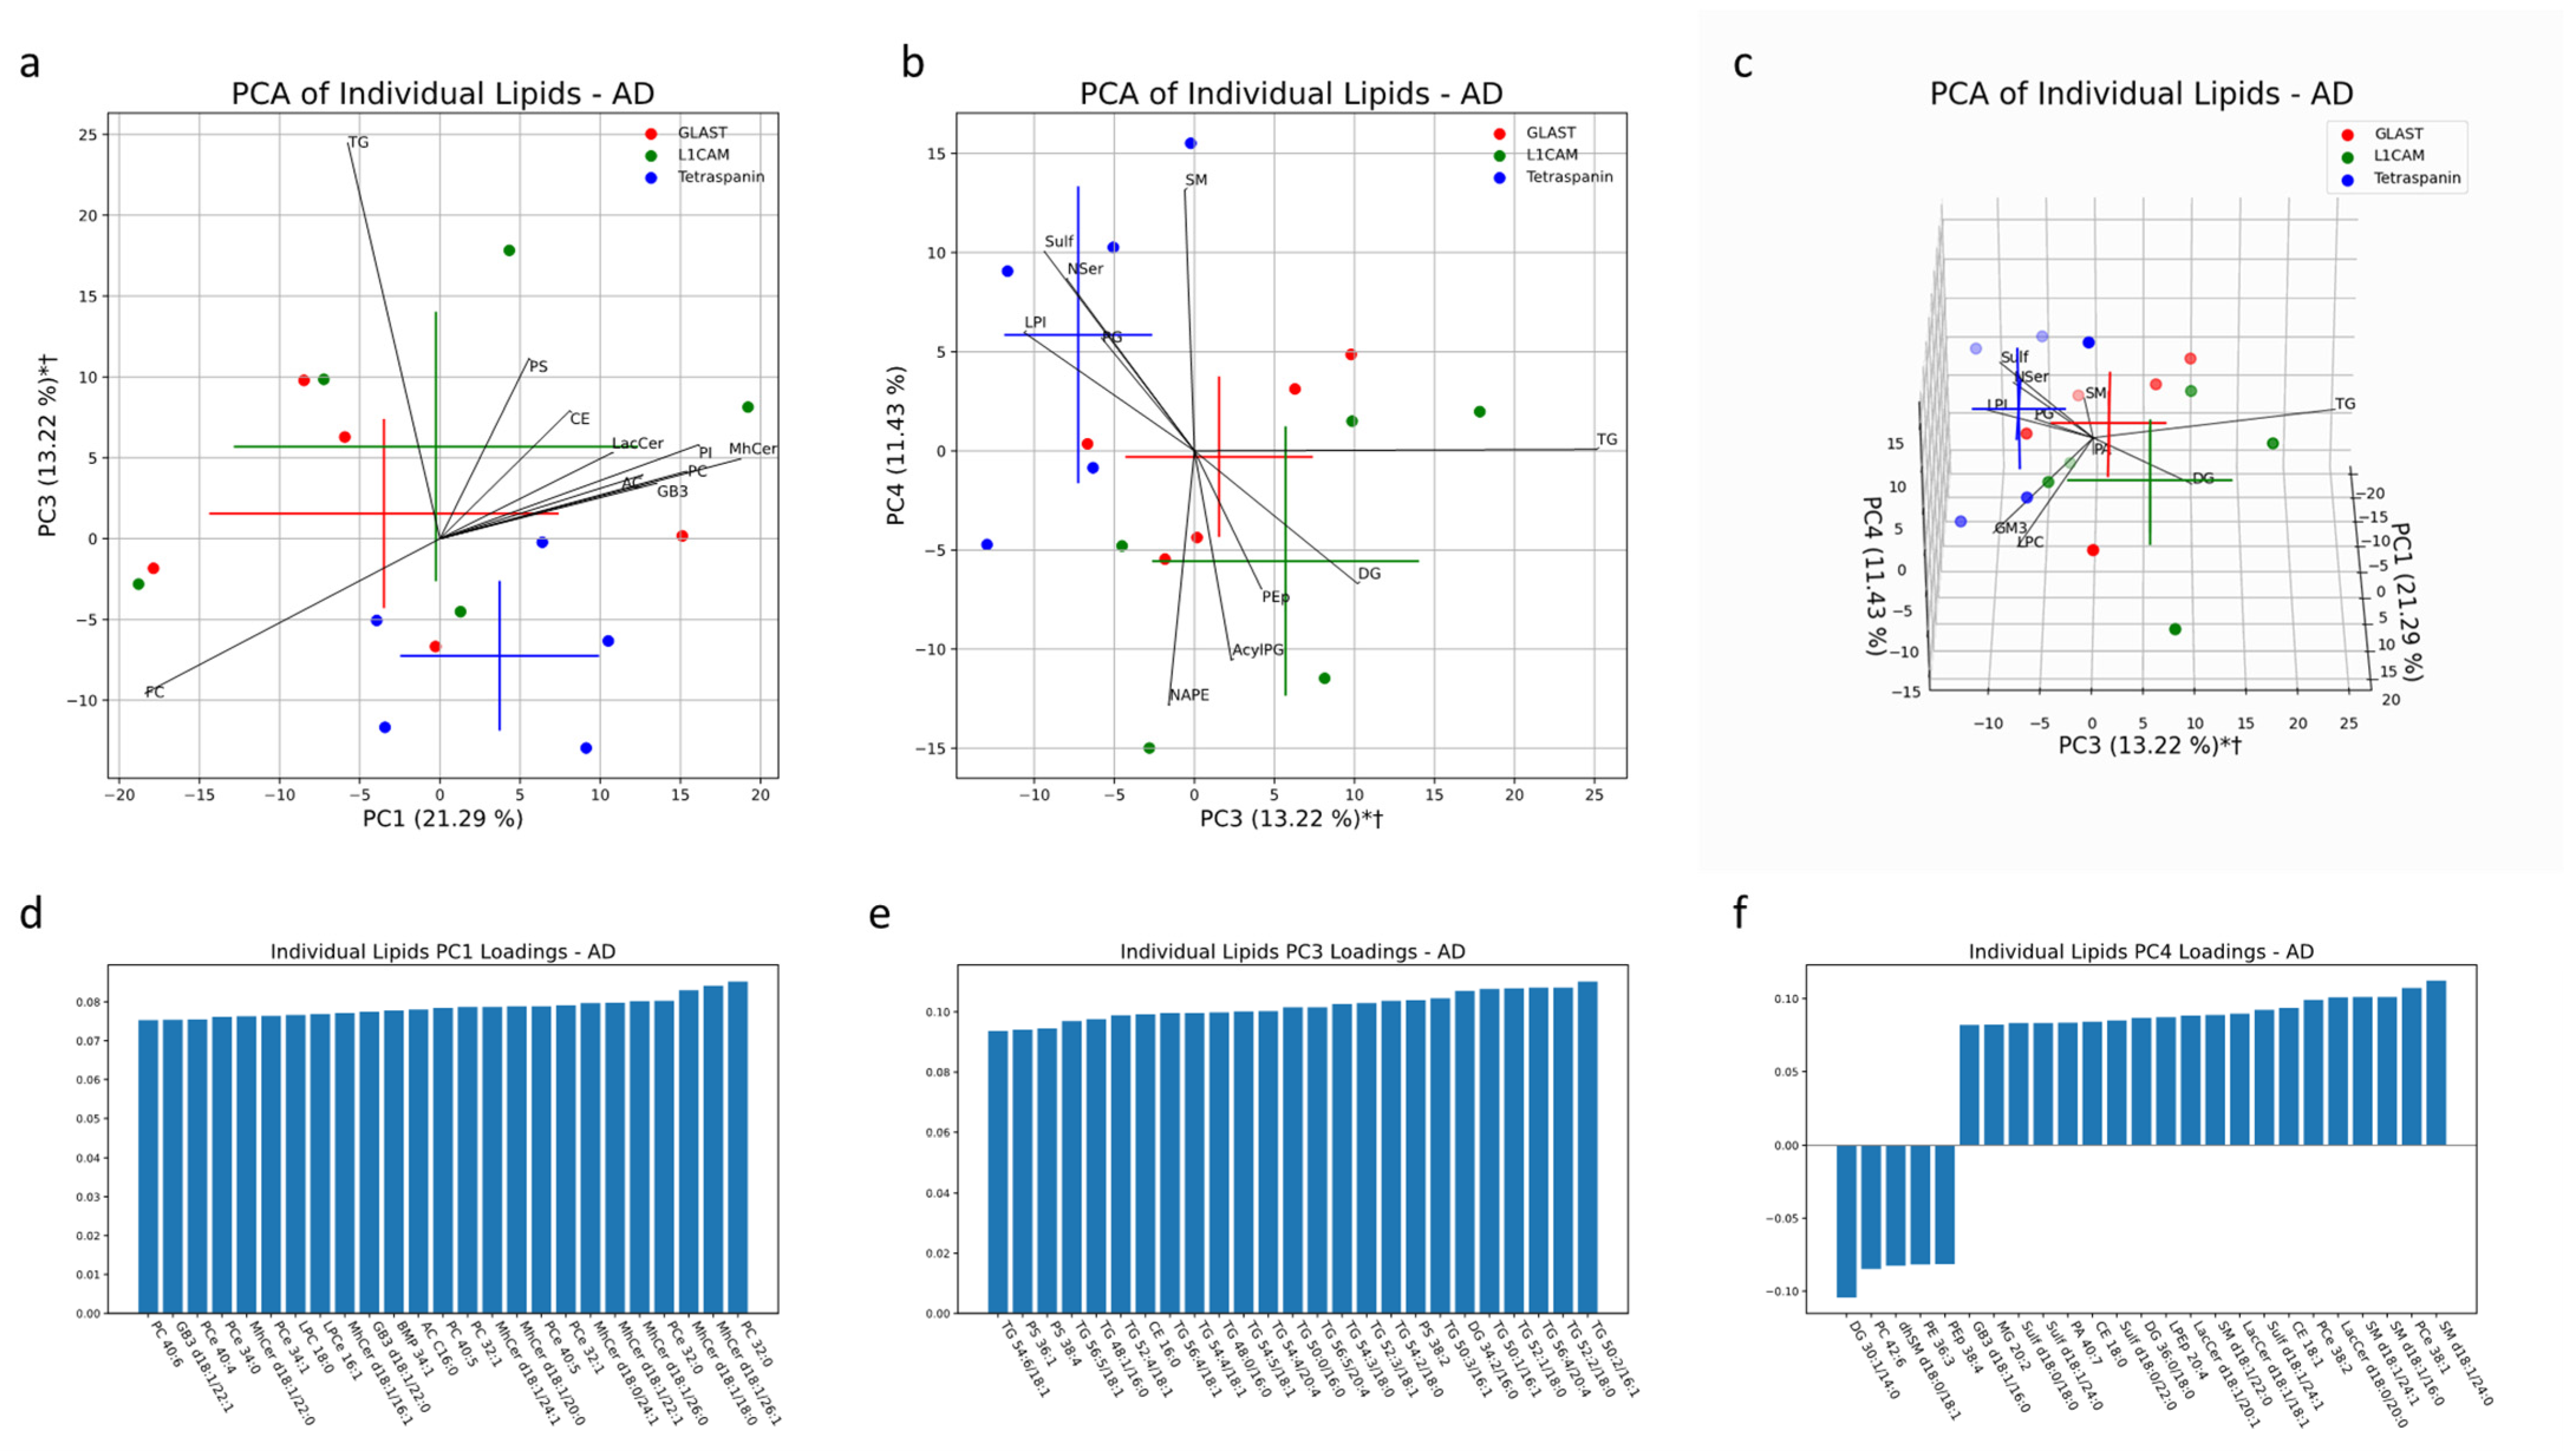
Analysis of EV subtypes in AD patients depicted lipid profiles distinct from that of healthy controls. Together, PC1, PC3 and PC4 accounted for 46% of the variability in EV samples from AD patients. Multivariate analysis demonstrated significant separation of both NDEV and ADEV subtypes from Tetraspanin-EVs in the same direction along PC3. TG, PS and DG lipid species heavily contributed to this separation, both in the direction of NEV and AEV clusters (
Figure 11a,b). Enrichment of DG species in AEVs and NEVs and enrichment of PG in multi-origin EVs from AD patients also aligns with the significant univariate difference in the percent of total lipids, depicted in
Figure 11b,f. When looking at the top 25 individual lipids with the largest absolute loadings along PC3, 20 of them are TG species. We also see multiple PS lipids (38:2, 38:4 and 36:1) and DG 34:2/16:0 driving this separation (
Figure 11e).
Figure 11.
Multivariate analysis was conducted on individual lipid molecules that were detected via MS in EV samples from AD patients. Crosses indicate the center of an EV subset cluster, with the vertical and horizontal components representing the standard deviation of a group along the corresponding PC (a–c). * indicates a significant difference (p < 0.05) between Tetraspanin IP EVs and L1CAM IP EVs along a PC. † indicates a significant difference (p < 0.05) between Tetraspanin IP EVs and GLAST IP EVs along a PC. Black lines represent the magnitude and direction of the pooled lipid species’ relative contribution to any separation between pan-EV (Tetraspanin IP EVs) and brain-associated EVs (L1CAM and GLAST IP EVs). The top 10 most influential lipid species are depicted. The 25 largest individual lipid contributions to variability along principal components 1, 3 and 4 are depicted through loadings plots (d–f).
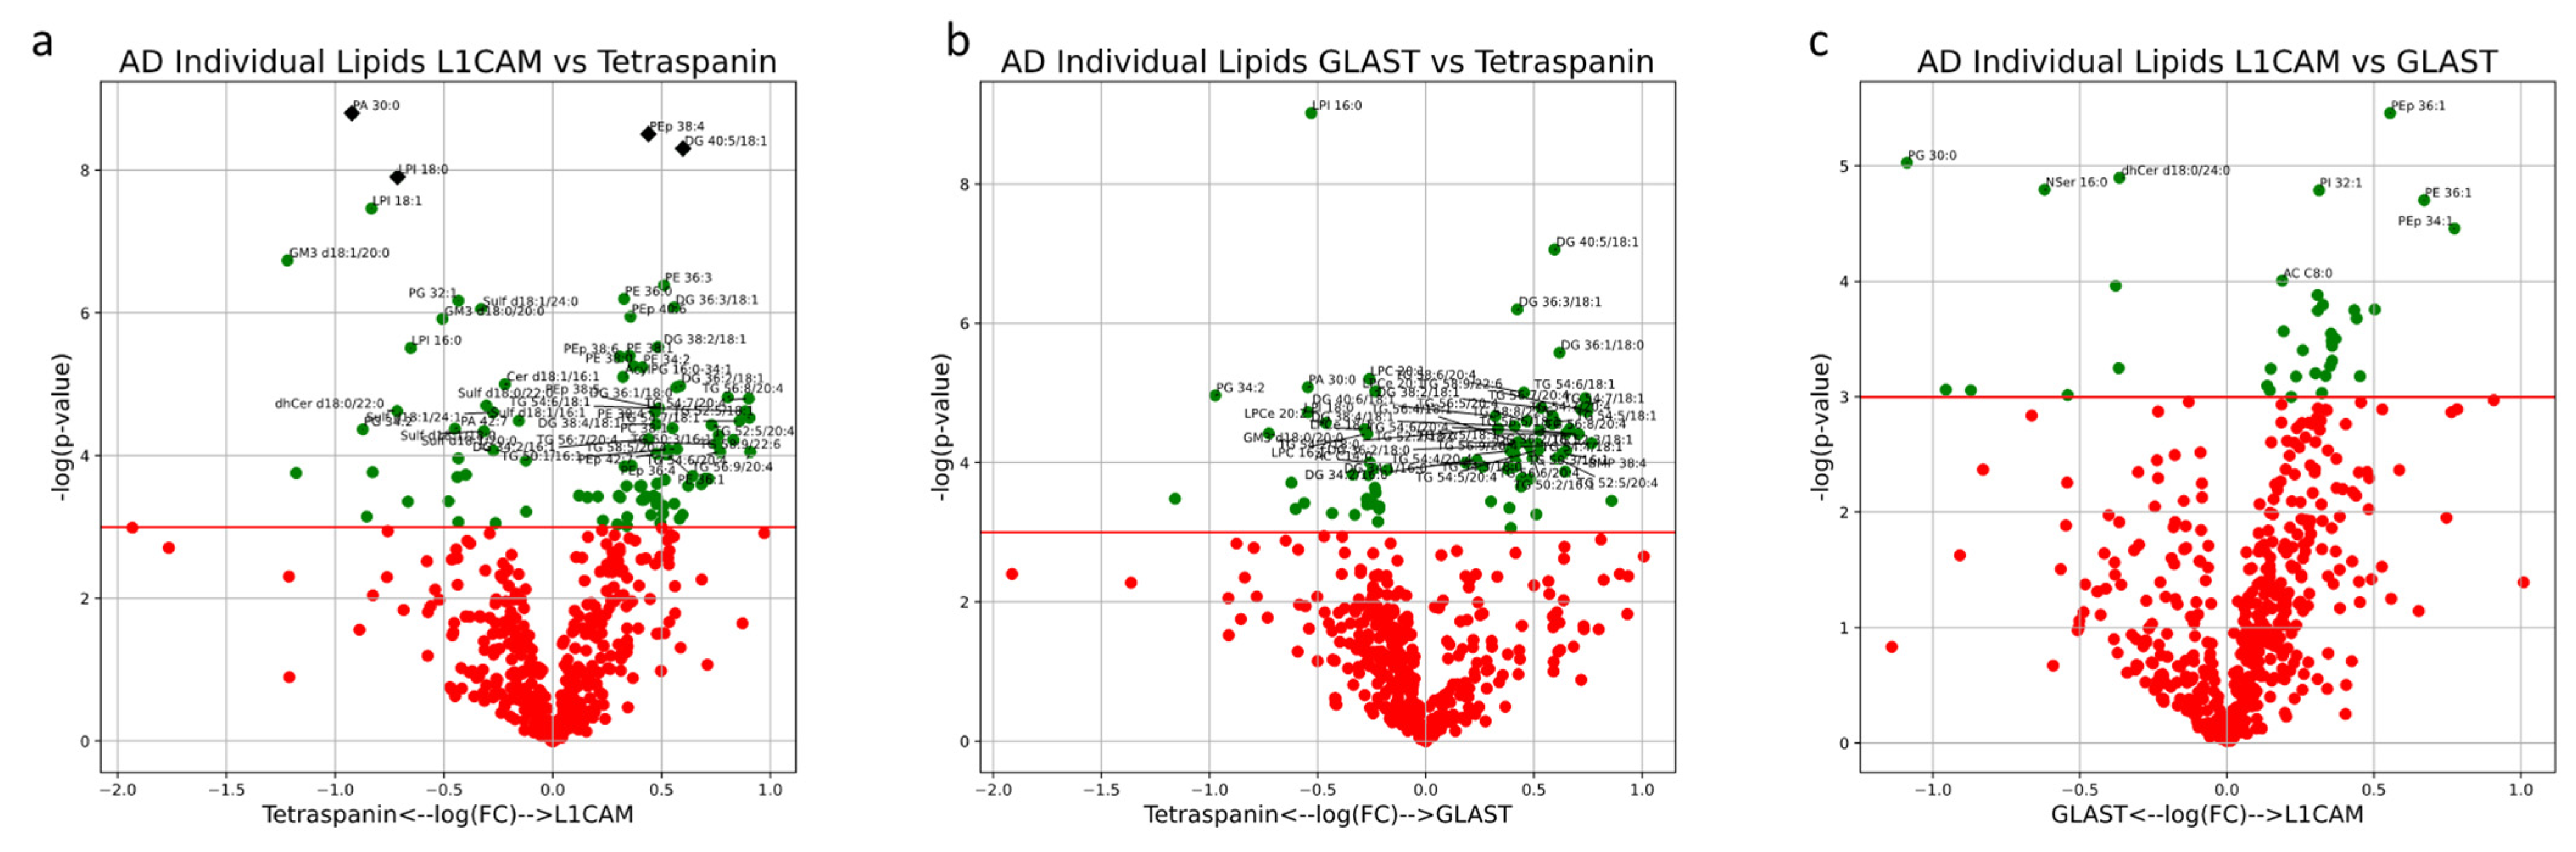
The results from univariate analysis of EVs from AD patients highlighted significant differences in individual lipid concentrations between EV subtypes. Though the lipid composition of EV subtypes varied significantly, only PA 30:0 and LPI 18:0 were significantly enriched in multi-origin Tetraspanin-EVs compared to L1CAM+ NEVs after correction for multiple testing, while PEp 38:4 and DG 40:5/18:1 were significantly enriched in L1CAM+ NEVs compared to multi-origin Tetraspanin-EVs after correction for multiple testing (
Figure 12a). Enrichments for all other individual lipids are outlined in
Table S5.
Figure 12.
Volcano plots describe the magnitude and significance of differences in individual lipid concentrations between EV subsets in AD patients (L1CAM vs. Tetraspanin (a), GLAST vs. Tetraspanin (b), L1CAM vs. GLAST (c)). EVs were isolated with L1CAM, GLAST or pan-Tetraspanin IP. Green points above the horizontal red line depict lipids with concentrations significantly different (p < 0.05) between AD and control samples. Black diamonds above the horizontal red line depict lipids with concentrations significantly different (p < 0.05) after multiple-testing (Bonferroni) correction between AD and control samples.


 and
and 


