Article

Systematic Identification of Housekeeping Genes Possibly Used as References in Caenorhabditis elegans by Large-Scale Data Integration

1
College of Life Sciences, Chongqing Normal University, Chongqing 401331, China
2
Scientific Research Office, Chongqing Normal University, Chongqing 401331, China
*
Author to whom correspondence should be addressed.
These authors contributed equally to this work.
Cells 2020, 9(3), 786; https://doi.org/10.3390/cells9030786
Submission received: 24 January 2020 / Revised: 11 March 2020 / Accepted: 11 March 2020 / Published: 24 March 2020
(This article belongs to the Special Issue Biocomputing and Synthetic Biology in Cells)

Abstract

:
For accurate gene expression quantification, normalization of gene expression data against reliable reference genes is required. It is known that the expression levels of commonly used reference genes vary considerably under different experimental conditions, and therefore, their use for data normalization is limited. In this study, an unbiased identification of reference genes in Caenorhabditis elegans was performed based on 145 microarray datasets (2296 gene array samples) covering different developmental stages, different tissues, drug treatments, lifestyle, and various stresses. As a result, thirteen housekeeping genes (rps-23, rps-26, rps-27, rps-16, rps-2, rps-4, rps-17, rpl-24.1, rpl-27, rpl-33, rpl-36, rpl-35, and rpl-15) with enhanced stability were comprehensively identified by using six popular normalization algorithms and RankAggreg method. Functional enrichment analysis revealed that these genes were significantly overrepresented in GO terms or KEGG pathways related to ribosomes. Validation analysis using recently published datasets revealed that the expressions of newly identified candidate reference genes were more stable than the commonly used reference genes. Based on the results, we recommended using rpl-33 and rps-26 as the optimal reference genes for microarray and rps-2 and rps-4 for RNA-sequencing data validation. More importantly, the most stable rps-23 should be a promising reference gene for both data types. This study, for the first time, successfully displays a large-scale microarray data driven genome-wide identification of stable reference genes for normalizing gene expression data and provides a potential guideline on the selection of universal internal reference genes in C. elegans, for quantitative gene expression analysis.

1. Introduction

Genome-wide expression analysis has always played a crucial role in the field of the functional genome. However, the data generated by high-throughput RNA-sequencing (RNA-seq) and microarray requires an authentic tool for validation [1]. Quantitative real-time PCR (qPCR) has been widely used for validating gene expression data due to its high sensitivity, rapid execution and specificity [2,3]. However, the reliability of qPCR reactions is inevitably affected by the quality and integrity of RNAs, the efficiency of cDNA synthesis, and PCR efficiency [4,5,6]. To accurately quantify gene expressions in different spatial-temporal conditions, reference genes are widely used as internal controls to minimize the misinterpretation of expression data.
The free-living nematode Caenorhabditis elegans has been widely used as a model organism for a range of studies, spanning from development to drug discovery. Gene expression analysis in this model organism constitutes a powerful tool to discover new roles for different types of molecules. Traditionally, a set of housekeeping genes encoding actin (act-1) [7,8], tubulin (tba-1) [9,10,11], glyceraldehyde-3-phosphate dehydrogenase (gpd-2) [12,13], translation initiation factor 3C (eif-3.C) [14,15], calsequestrin (csq-1) [13,16], Rho GTPase (cdc-42) [17,18,19,20], and peroxisomal membrane protein related (pmp-3) [18,21] were thought to be appropriate reference genes for the normalization of gene expression in C. elegans. However, some reports indicated that the transcription levels of these conserved reference genes may be changed under different conditions, such as developmental stages, drug treatments, and hypoxia [22,23]. Therefore, selecting such biased reference genes can lead to misinterpreting qPCR results, and consequently, output misleading expression data.
With the development of sequencing and microarray technology, analyzing RNA-seq and microarray data allows to identify reliable reference genes in diverse organisms such as Homo sapiens [24], Setaria viridis [25], Malus × domestica Borkh [26], Mizuhopecten yessoensis [27], Gossypium hirsutum [28], Ciona savignyi [29], Streptomyces coelicolor [30], Arabidopsis thaliana [31], and so on. However, the main focus of these studies was to evaluate a set of known reference gene candidates for the stability of expression using several bioinformatics algorithms: geNorm [32], RefFinder (http://www.leonxie.com/referencegene.php), NormFinder [33], BestKeeper [34], and delta-Ct method [35]. Additionally, in all the above studies, the identification of suitable reference genes was based on tightly controlled experimental conditions, whereas it is supported that the expression of these genes can vary in different tissues under different experimentally controlled conditions. Indeed, strictly speaking, an ideal reference gene should be expressed universally among different tissues and stably under different conditions.
Despite the availability of extensive microarray and RNA-seq data in C. elegans, an unbiased genome-wide search from the large-scale datasets to identify reliable reference genes is still lacking. For this reason, to obtain accurate results for systematic gene expression analysis, 145 publicly available microarray datasets encompassing a wide range of biological and experimental conditions, including different developmental stages, different tissues, drug treatments, lifestyles, and various stresses (microwave and toxic chemicals exposure, pathogen infection, hypoxia, starvation, and so on), were systematically analyzed to identify stable reference genes. Subsequently, the stability of 13 newly identified and 13 commonly used reference genes was further validated using six independent gene expression datasets. The validated genes here are expected to serve as potential resources for further investigating molecular mechanisms under diverse experimental conditions using the qPCR method.

2. Materials and Methods

2.1. Data Collection and Filtration

Theoretically, an ideal housekeeping gene (HKG) or reference gene should be expressed constantly in all cell types and under various experimental conditions. To obtain universal, robust and reliable HKG candidates possibly used as reference genes in C. elegans, datasets obtained under various experimental conditions were retrieved from Gene Expression Omnibus (GEO) (http://www.ncbi.nlm.nih.gov/geo/). Considering the consistency of experimental results, only the published microarray datasets from GPL200 [Celegans] Affymetrix C. elegans Genome Array were used for further analysis. Annotation information of microarray used in matching probes with corresponding genes was also downloaded from GEO database. To describe genes in detail, more annotation data from Wormbase database (https://wormbase.org/), Gene Ontology Consortium (http://geneontology.org/), and Interpro (https://www.ebi.ac.uk/interpro/) were mapped to probe sets in Genome Array.
All downloaded microarray datasets were filtrated according to the following criteria: (1) the total number of samples is more than three in an individual microarray dataset; (2) no duplicated samples in other datasets; and (3) the raw data in *.CEL format is available in GEO.

2.2. Methodology

2.2.1. Normalization of Microarray Data

Figure 1 shows the methodology used in this study. Raw signal intensities for each probe set in the CEL files were analyzed using a series of algorithms implemented in R and Bioconductor package, including Robust Multiarray Analysis (RMA) [36], Affymetrix Microarray Suite version 5 (MAS5) [37], Cheng Li and Wing Hung Wong’s method (Li–Wong) [38], GeneChip RMA (GCRMA) [39], Probe Logarithmic Intensity Error (PLIER) [40], and Variance Stabilization Normalization (VSN) [41].
(1) Robust Multiarray Analysis (RMA). RMA is the most widely used preprocessing algorithm for Affymetrix and Nimblegen gene expression microarray [42]. For RMA normalization, the raw intensity values of microarray are background corrected, log2-transformed, and then quantile-normalized in order. Then a linear model is fitted to the normalized data to obtain an expression measure for each probe set in each array.
(2) Affymetrix Microarray Suite version 5 (MAS5). MAS5 is a sensitive algorithm to normalize and summarize the standard probe level [37], which offers a robust and non-logarithmic mean value generated by subtracting the MisMatch (MM) value from their Perfect-Match (PM) values. Thus, the increased variation is easily observed at low signal strength.
(3) Cheng Li and Wing Hung Wong’s method (Li–Wong). Li–Wong is a commonly used algorithm to compute gene expression levels of microarray data [38], which normalizes microarrays using an invariant set of genes and then fits a parametric model to the probe set data, without background correction in data preprocessing.
(4) GeneChip RMA (GCRMA). As an improved RMA algorithm, GCRMA is popular for preprocessing microarray data [39]. This normalization strategy is achieved by calculating a background adjustment that ignores the MisMatch (MM) intensities but incorporates sequence information from the probes (GC content).
(5) Probe Logarithmic Intensity Error (PLIER). This method can improve signal value by accounting for experimentally observed patterns in probe behavior and handling error at the appropriately low and high signal values. It is assumed that the error is proportional to the PM intensity without background correction and log-transformation.
(6) Variance Stabilization Normalization (VSN). VSN is a non-linear method that aims to keep the variance constant over the entire data range. It comprises data calibration, the quantification of differential expression, and the quantification of measurement error. The VSN normalized data is not logged again for comparisons based on logarithmic intensities of the data.

2.2.2. First-Round Ranking of Gene Expression Stability

After the data normalization using the specific algorithm, top 5000 robustly expressed genes with the lowest standard deviations were chosen according to the following three criteria derived from the improved Eli’s approach: (1) gene expressions must be detected in all tissues and under various conditions; (2) genes were sorted based on the increased variance across various tissues and experimental conditions; and (3) no exceptional expression in any single tissue or experimental conditions for each gene. It means that log2-expression value is not significantly different from the averaged log2-normalized expression level by two-fold or more.

2.2.3. Second-Round Ranking of Gene Expression Stability

To obtain more stable reference genes, the first-round ranked gene lists (GLs) derived from normalized data using the specific algorithm (such as RMA) were integrated into a corresponding second-round ranked gene list (such as SGLR) by RankAggreg, which is the most popular algorithm to perform aggregation of ordered lists based on the ranks via the Cross-Entropy Monte Carlo algorithm or the Genetic Algorithm [43]. Similarly, five SGLs (SGLM, SGLL, SGLG, SGLP, and SGLV) were obtained.

2.2.4. Identification of HKG Candidates Used as Reference Genes

After data normalizing and gene ranking, six second-round ranked gene lists, including SGLR, SGLM, SGLL, SGLG, SGLP, and SGLV, were intersected to identify the most reliable HKG candidates. A gene is considered as a reliable HKG candidate when it appears in at least three SGLs.

2.3. Functional Annotation and Enrichment Analysis

Functional annotation is crucial for understanding the biological functions and mechanisms, and therefore Gene Ontology (GO) was used for this purpose in this study. It arranges annotation terms in a hierarchical manner and thus makes annotations in a gene list amenable to automated analysis. Moreover, the gene enrichment analysis was performed to explore the biological processes and signal pathways in which housekeeping genes may participate, for the union of the six groups (top 50 of SGLR, SGLM, SGLL, SGLG, SGLP, and SGLV). All gene function annotations in this study were performed by Bioconductor package org.Ce.eg.db and biomaRt [44,45], enriched and visualized by Metascape [46] and Cytoscape (v3.7) [47], respectively.

2.4. Evaluation of HKG Candidates

2.4.1. Evaluation of HKG Candidates Using Newly Published Datasets

The Gini coefficient (GC) has been used to quantify the inequality of gene expression levels across different and experimental conditions [48] and is very helpful for identifying housekeeping genes [49]. To investigate the stability of gene expression, two independent indexes, Gini coefficient (GC) and standard deviation (SD) were adopted in this study. The GC is calculated as follows:
G C = 2 i = 1 n i x i n i = 1 n x i n + 1 n
where
GC: Gini coefficient;
x i : the gene expression value in the i-th sample;
n: sample numbers.
The SD is analyzed as follows:
σ = 1 n i = 1 n ( x i x ¯ ) 2
where
σ : standard deviation of gene expression values;
x i : the gene expression value in the i-th sample;
n: sample numbers.

2.4.2. Comparison of Newly Identified HKG Candidates and Commonly Used Reference Genes

To compare the reliability of HKG candidates identified in this study with commonly used reference genes (CRGs), the expression levels of 13 genes (cyc-1, tba-1, atp-3, mdh-1, gpd-2, eif-3.C, act-1, cdc-42, pmp-3, act-2, csq-1, ama-1, and rbd-1) were validated using the independent microarray and RNA-seq datasets. The microarray datasets from Affymetrix Inc. and Agilent Inc. were normalized using RMA and log-quantile, respectively. For RNA-seq datasets, the log2(CPM+1) was used to normalize read counts for gene expression level comparison [50].

3. Results

3.1. Large-Scale Microarray Datasets Collection

By the end of 2018, 171 GEO series from microarray GPL200 platform had been released in GEO database. Among them, 26 datasets were excluded because of sample duplication, no raw data or a smaller sample size (n < 3). Finally, 145 datasets containing 2296 high-quality samples were used for further analysis. The detailed information is listed in Supplementary Material Figures S1–S3.

3.2. Data Normalization and Gene Probe Matching

All 145 microarray datasets were normalized to gene expression matrices using the rma (for RMA), mas5 (for MAS5), expresso (for Li–Wong), gcrma (for GCRMA), justPlier (for PLIER), and vsnrma (for VSN) from R packages as affy, gcrma, plier, and vsn, respectively. After data normalization, each gene expression matrix (GEM) contained 22,652 probes (rows in GEM) which correspond to 23,556 genes (rows in GEM). After the filtration of missing values, a total of 21,112 rows were kept in GEM. When one probe was matched to multiple genes, it was deleted. If a gene was matched by more than one probe, its expression level was measured by the median of gene expression values. Finally, 16,724 genes and their expression values were obtained.

3.3. First-Round Ranking Based on Gene Expression Stability

For each GEM, 16,724 genes were ranked based on parameter SD. Considering the feasibility of datasets and the computing power, the top 5000 genes in each ranked gene list (GL) were used for the subsequent analysis. Detailed information of all GLs containing top 5000 genes obtained by six normalization algorithms is shown in Supplementary Material Figure S4.

3.4. Second-Round Ranking Using RankAggreg

To get a more reliable gene list, all 145 first-round ranked gene lists were aggregated into a single ranked gene list using the RankAggreg algorithm. Top 50 genes from this single ranked gene list were selected to generate the second-round ranked gene list (SGL). All SGLs are shown in Supplementary Material Figure S5.

3.5. Overlapping for Determining the HKG Candidates Used as Reference Genes

Due to the inconsistency of gene ranking analysis, a reliable HKG candidate is considered when it is included in at least three SGLs. In total, 13 HKG candidates were identified and are listed in Table 1, of which rps-23 was shared by SGLR, SGLM, SGLL, and SGLP, while rps-27, rps-16, rps-26, rps-4, rps-2, rps-17, rpl-24.1, rpl-15, rpl-35, rpl-36, rpl-27, and rpl-33 were shared by SGLR, SGLL, and SGLP (Figure 2). These results also show that 32 genes were shared by two SGLs. However, the majority of genes are specific to one SGL.

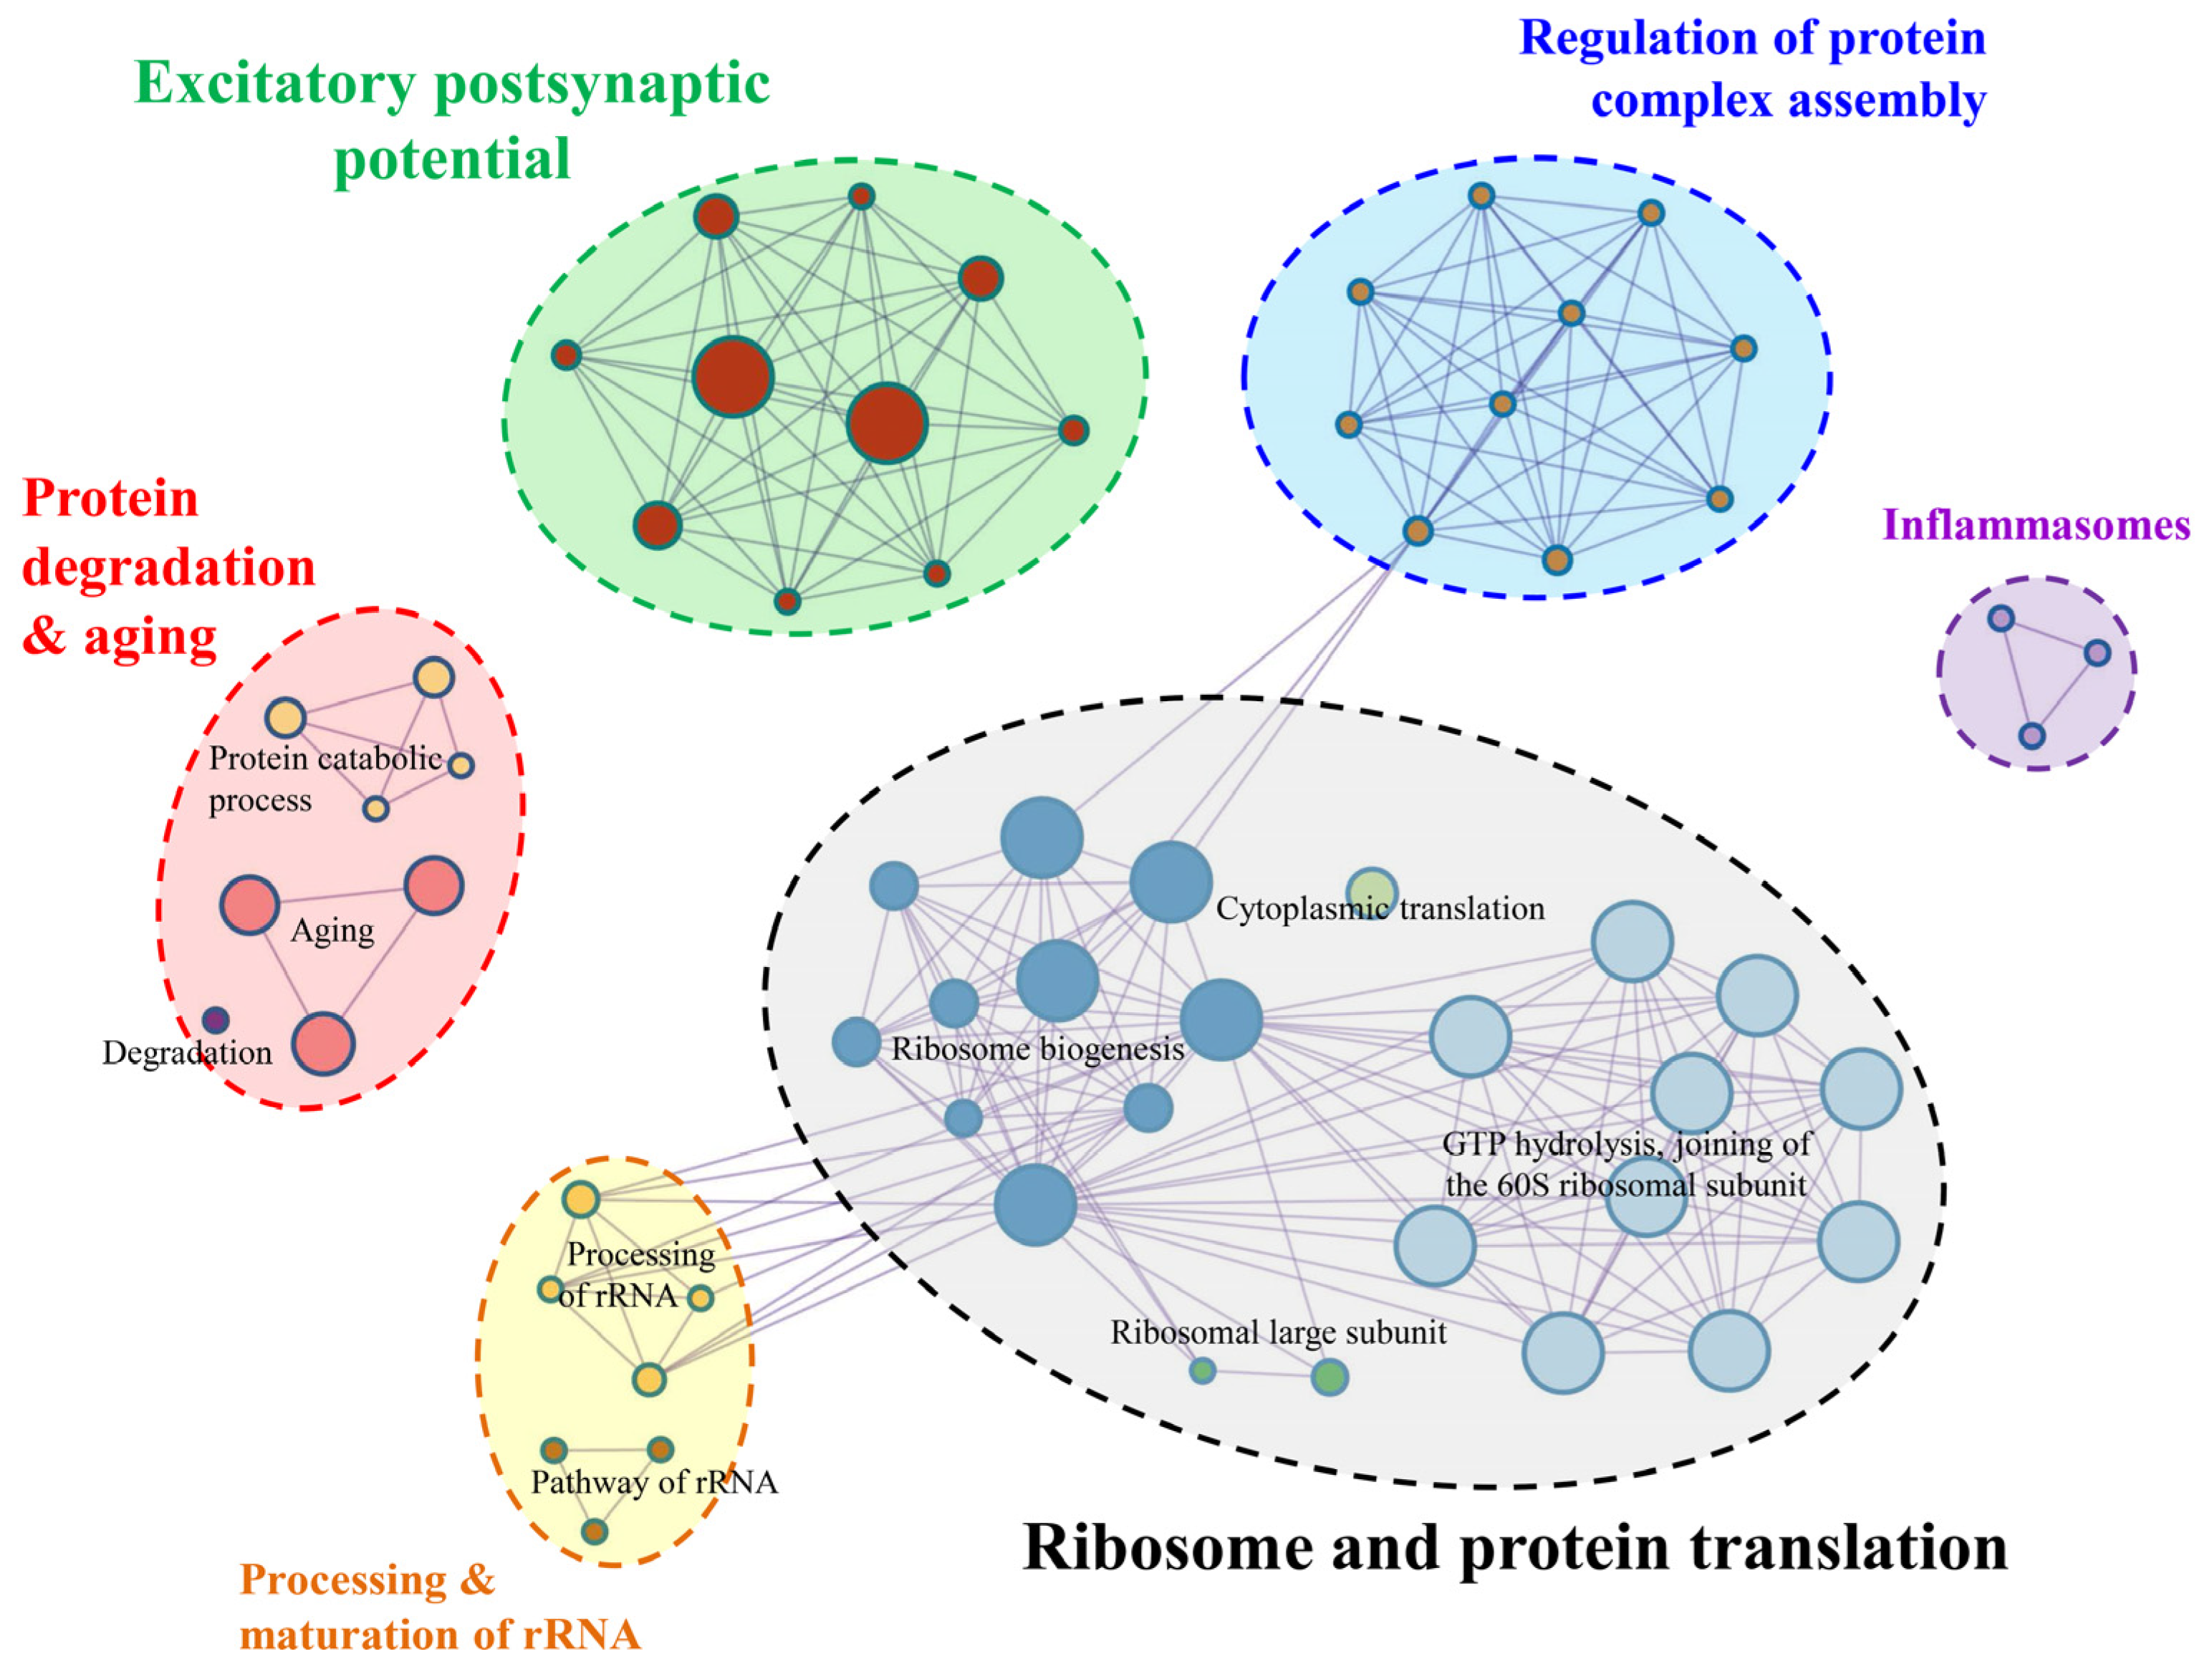
3.6. Gene Annotation and Enrichment

After merging, 241 genes were obtained from six SGLs (50 genes/each). Among them, 13 HKG candidates were identified as the most reliable reference genes, including seven genes encoding small ribosomal proteins (rps-23, rps-27, rps-16, rps-26, rps-4, rps-2, and rps-17) and six genes encoding large ribosomal proteins (rpl-24.1, rpl-15, rpl-35, rpl-36, rpl-27, and rpl-33).
Annotation analysis shows that the majority of genes are associated with ribosome, protein synthesis, protein degradation, protein processing and transporting, and neuronal synapses and signal transmission. Enrichment analysis of KEGG pathway, GO biological process, and Reactome Gene Sets generated 12 clusters with an enrichment factor ≥ 1.5, gene count ≥ 3 and the p-value < 0.01. Membership similarity analysis reveals that these genes are mainly involved in GTP hydrolysis and assembly of the 60S ribosomal subunit, ribosome biogenesis and aging (Supplementary Material Figure S6). To better show their functional relations, statistically significant terms were selected to represent the corresponding clusters (Figure 3).
By a manual literature survey, these enriched terms were grouped into six main categories: ribosome and protein translation, excitatory postsynaptic potential, protein degradation and aging, regulation of protein complex assembly, processing and maturation of rRNA, and inflammasomes (Figure 3).

3.7. Validation of HKG Candidates Used as Reference Genes

To confirm the reliability of 13 HKG candidates identified in this study, the validation was performed using three newly published microarray datasets (GSE118294 [51], GSE108968 [52], and GSE76380 [53]) and three RNA-seq datasets (GSE63528 [54], GSE60755 [55], and GSE98919 [56]) (Table 2). The validation result of dataset GSE118294 revealed that the variation of standard deviation (SD) of 13 newly identified reference genes (NRGs) (dark green boxplot in Figure 4A) was much lower than that of commonly used reference genes (CRGs) (orange boxplot in Figure 4A). Similar results were also obtained for dataset GSE108968 (Figure 4B), GSE76380 (Figure 4C), GSE60755 (Figure 4D), and GSE98919 (Figure 4F). It is worth noting that SD variations of CRGs and NRGs were not statistically different, but the former was slightly more unstable than the latter for dataset GSE63528 (Figure 4E). In summary, gene expression levels of the 13 HKG candidates potentially used as reference genes are stable.

3.8. Comparison between HKG Candidates Identified in This Study and Commonly Used Reference Gene

To further confirm the availability of 13 HKG candidates used as reference genes, gene expression profiles of 13 NRGs and another 13 CRGs were compared (Table 2 and Figure 4). To better show the comparison results, the top 10 genes among all 26 genes (13 NRGs + 13 CRGs) were selected for further analysis. As shown in Table 2, the frequency of occurrence of NRGs in the top 10 genes is higher (≥ 60%) than that of CRGs based on SD value and GC ranking. Additionally, their expression levels are more stable than those of CRGs (Figure 4). For one given test dataset (such as GSE118294 in Figure 4A), the variations of expression levels for 13 NRGs (dark green violins and boxplot) are generally lower than another 13 CRGs. Similar results were also found in the other five test datasets (Figure 4B–F), although the pattern is not very obvious in the GSE63528 (Figure 4E).

4. Discussion

Despite the availability of extensive transcriptome data in C. elegans, to our best knowledge, the systematic analysis of large-scale gene expression datasets for the identification of stable reference genes has not been conducted. This work aims to identify housekeeping gene candidates potentially used as reference genes for quantitative gene expression analysis. Theoretically, HKGs are constitutively expressed in all tissues and experimental conditions to maintain the basal cellular functions. They are characterized by wide distribution and constant and high expression. In this study, 13 HKG candidates potentially used as reference genes for gene expression analysis in C. elegans were identified by large-scale data integration and systematic analysis.

4.1. Data Integration and Its Advantages

Data integration has been widely used in omics studies, which can facilitate information mining from large-scale omics data [57]. For transcriptome data, there are two methods widely used for data integration: direct data merging and result combining after the analysis. In this study, the latter was applied to screen HKG candidates used as reliable reference genes. For the direct data merging method, batch effects cannot be avoided. To remove batch effects, the real biological differences may also be removed, which can compromise the integration and interpretation of the data [58,59].
The integration of multiple transcriptome datasets has been advocated to increase the sample size and maximize the statistics power, such as reducing the probability of false-negative results [60]. Therefore, 145 microarray datasets obtained from diverse developmental stages, tissues or experimental conditions were selected to identify reliable reference genes from HKG candidates for quantitative gene expression analysis in C. elegans.

4.2. Why Microarray Datasets Were Adopted?

With the development of high throughput expression technologies (microarray and RNA-seq), massive gene expression datasets are produced daily. There is a good agreement between RNA-seq and microarray relative to gene expression, despite some data variability in low-expression genes that may be due to the difference in expression platform and data analysis [61,62]. Microarray data were used in this study by considering the following reasons: (1) microarray is a mature genomic platform with a well-established data analysis pipeline; (2) microarray is reliable in model organisms [63] and we just focus on well-annotated genes in model organism C. elegans; and (3) despite the fact that RNA-seq enables to identify non-coding differentially expressed genes or not well-annotated genes that offer a potential for improved mechanistic clarity, we do not consider those genes. Therefore, DNA microarray datasets in GEO database were used for the identification of reliable reference genes for gene expression analysis in C. elegans. Additionally, to reduce the heterogeneity, only the datasets from GPL200 (Celegans) Affymetrix C. elegans Genome Array were selected, which is the most popular microarray platform used by thousands of studies of C. elegans worldwide [64].

4.3. Importance of Normalization Methods

For omics data analysis, the normalization of raw data is one of the most pivotal steps [65], which significantly affects the reproducibility of data and the reliability of experimental results [66]. Similarly, for microarray data, the normalization is helpful for removing biases and increasing the accuracy of the analysis [67]. Available normalization methods for microarray data generally assume a similar global expression pattern among samples being studied. Currently, there are many algorithms used for microarray data normalization, such as RMA, MAS5, Li–Wong, GCRMA, and so on. However, data normalized by diverse methods shows distinct shapes of statistical distributions and even leads to totally different analysis conclusions. To obtain more credible and pervasive conclusions, six widely used algorithms (RMA, MAS5, Li–Wong, GCRMA, PLIER, and VSN) for microarray data were applied in this study.

4.4. Reliability of Newly Identified HKG Candidates Possibly Used as Reference Genes

An ideal reference gene should be stably, highly, and universally expressed in tissues or cells regardless of the histology, pathological conditions, or cellular physiological-metabolic states [57,68]. Therefore, the large-scale transcriptome datasets under various kinds of conditions were integrated to identify HKG candidates, which will be potentially used as reliable reference genes for quantitative gene expression studies in C. elegans. The systematic analysis revealed that 13 HKG candidates could be used as reference genes, including seven genes encoding small ribosomal proteins (rps-23, rps-27, rps-16, rps-26, rps-4, rps-2, and rps-17), and six genes encoding large ribosomal proteins (rpl-24.1, rpl-15, rpl-35, rpl-36, rpl-27, and rpl-33).
Previous studies suggested that the structure of ribosomes is highly conserved and its composition is constant within a species [69]. Correspondingly, genes encoding ribosomal proteins were considered as housekeeping genes [70]. In Homo sapiens, 79 ribosomal and mitoribosomal genes were regarded as housekeeping genes [71,72]. Hence, in this context, 13 housekeeping gene candidates identified in this study are quite credible.
Among 13 HKG candidates, rps-23 was present in four SGLs, and also widely used as a reference gene for qPCR in many species, such as Bos indicus [73], Homo sapiens [74], and Harmonia axyridis [75]. Additionally, our results strongly support that rpl-33 and rps-26 are stable and reliable reference genes in microarray data. Likely, rps-26 has been widely used as a reference gene to normalize gene expression in Homo sapiens [76], Bovine corpus [77], Monotropa hypopitys [78], and Millerozyma (Pichia) farinose [79]. Housekeeping genes rps-2 and rps-4 were also identified as stable reference genes in RNA-seq data of C. elegans. They were validated and used as suitable references for quantifying gene expressions in Monotropa hypopitys [78]. It is worth noting that the most stable gene rps-23 should be a promising reference gene for both microarray and RNA-seq data. None of the commonly used reference genes in C. elegans presented in the top 10 HKG candidates identified in this study. Although some studies confirmed that the orthologous of housekeeping genes identified in this study were reliable and feasible in many species, the utilization of these 13 HKG as reference genes for gene expression quantification in C. elegans is quite limited.
It is worth noting that a gene included in at least three second-round ranked gene lists (SGLs) was considered a reliable HKG candidate in this study. Based on this rigorous standard, 13 reliable HKGs were obtained. When we used a more relaxed standard (i.e., the gene included in at least two SGLs is defined as the HKG candidate), another 32 HKGs were also obtained. Among them, several non-ribosomal protein-coding genes, such as eef-1A.1, ubl-1, rack-1, srh-174, ZK721.4, and Y116A8C.33, were included. Some of them were also used as reference genes in some studies where the ribosomal genes would be inappropriate to use as reference genes.

5. Conclusions

In this study, 145 microarray datasets generated from 2296 gene array samples of different developmental stages and under various experimental conditions were used to identify stable reference genes for gene expression quantification in C. elegans. Based on data normalization, ranking, and integration, our systematic analysis identified and strongly supported 13 HKGs could be used as reliable reference genes, including seven genes encoding small ribosomal proteins (rps-23, rps-27, rps-16, rps-26, rps-4, rps-2, and rps-17) and six genes encoding large ribosomal proteins (rpl-24.1, rpl-15, rpl-35, rpl-36, rpl-27 and rpl-33). Taken together, our results provide useful guidelines for reference gene(s) selection under different experimental conditions and a possible resource for more accurate and widespread use of qPCR in C. elegans and other nematode species.

Supplementary Materials

The following are available online at https://www.mdpi.com/2073-4409/9/3/786/s1, Supplementary Material Figure S1: All samples collected in this study; Supplementary Material Figure S2: All published datasets in GPL200 platform used in this study; Supplementary Material Figure S3: Dataset filtering in this study; Supplementary Material Figure S4: Top 5000 genes for first-round ranked gene lists; Supplementary Material Figure S5: Six second-round ranked gene lists; Supplementary Material Figure S6: Result of gene enrichment analysis using Metascape.

Author Contributions

Conceptualization, B.L. and Y.H.; methodology, B.L. and J.T.; software, J.T.; validation, J.T., X.L. and H.Y.; formal analysis, J.T. and B.L.; investigation, X.L., H.Y., and X.N.,; data curation, J.T., J.Z. and Q.C.; writing—original draft preparation, B.L. and Y.H.; writing—review and editing, Y.H.; visualization, B.X. and X.N.; supervision, B.L. and Y.H.; project administration, B.L.; funding acquisition, B.L. and Y.H. All authors have read and agreed to the published version of the manuscript.

Funding

This work was sponsored by Natural Science Foundation of Chongqing, China (No. CSTC2019JCYJ-MSXMX0527), the Science and Technology Research Program of Chongqing Municipal Education Commission (No. KJQN201800523), Chongqing Research Program of Basic Research and Frontier Technology (No. cstc2015jcyjBX0142, cstc2016jcyjA0375), and Scientific Research Staring Foundation of Chongqing Normal University (No. 17XLB017).

Conflicts of Interest

The authors declare no conflict of interest.

Data Availability

Source code for the project is provided at https://github.com/libcell/CE-HKGFinder/under the GNU GPL3.0 License. All data are free to use for non-commercial purpose, and are available at https://drive.google.com/open?id=1zesh6xKr_Hobc6pseqUjC42JtpeGGERq.

References

  1. Jameson, P.E. Selection of reference genes for flowering pathway analysis in the masting plants, Celmisia lyallii and Chionochloa pallens, under variable environmental conditions. Sci. Rep. 2019, 9, 1–16. [Google Scholar]
  2. Czechowski, T.; Bari, R.P.; Stitt, M.; Scheible, W.R.; Udvardi, M.K. Real-time RT-PCR profiling of over 1400 Arabidopsis transcription factors: Unprecedented sensitivity reveals novel root-and shoot-specific genes. Plant J. 2004, 38, 366–379. [Google Scholar] [CrossRef]
  3. Nolan, T.; Hands, R.E.; Bustin, S.A. Quantification of mRNA using real-time RT-PCR. Nat. Protoc. 2006, 1, 1559. [Google Scholar] [CrossRef]
  4. Derveaux, S.; Vandesompele, J.; Hellemans, J. How to do successful gene expression analysis using real-time PCR. Methods 2010, 50, 227–230. [Google Scholar] [CrossRef]
  5. Bustin, S.A.; Nolan, T. Pitfalls of quantitative real-time reverse-transcription polymerase chain reaction. J. Biomol. Tech. JBT 2004, 15, 155. [Google Scholar]
  6. Huggett, J.; Dheda, K.; Bustin, S.; Zumla, A. Real-time RT-PCR normalisation; strategies and considerations. Genes Immun. 2005, 6, 279. [Google Scholar] [CrossRef] [Green Version]
  7. Su, L.; Li, H.; Huang, C.; Zhao, T.; Zhang, Y.; Ba, X.; Li, Z.; Zhang, Y.; Huang, B.; Lu, J. Muscle-specific histone H3K36 dimethyltransferase SET-18 shortens lifespan of Caenorhabditis elegans by repressing daf-16a expression. Cell Rep. 2018, 22, 2716–2729. [Google Scholar] [CrossRef] [PubMed]
  8. Han, S.; Schroeder, E.A.; Silva-García, C.G.; Hebestreit, K.; Mair, W.B.; Brunet, A. Mono-unsaturated fatty acids link H3K4me3 modifiers to C. elegans lifespan. Nature 2017, 544, 185. [Google Scholar] [CrossRef] [PubMed]
  9. Rajan, M.; Anderson, C.P.; Rindler, P.M.; Romney, S.J.; dos Santos, M.C.F.; Gertz, J.; Leibold, E.A. NHR-14 loss of function couples intestinal iron uptake with innate immunity in C. elegans through PQM-1 signaling. eLife 2019, 8. [Google Scholar] [CrossRef]
  10. Almeida, M.V.; Dietz, S.; Redl, S.; Karaulanov, E.; Hildebrandt, A.; Renz, C.; Ulrich, H.D.; König, J.; Butter, F.; Ketting, R.F. GTSF-1 is required for formation of a functional RNA-dependent RNA Polymerase complex in Caenorhabditis elegans. EMBO J. 2018, 37, e99325. [Google Scholar] [CrossRef] [PubMed]
  11. Kim, H.; Perentis, R.J.; Caldwell, G.A.; Caldwell, K.A. Gene-by-environment interactions that disrupt mitochondrial homeostasis cause neurodegeneration in C. elegans Parkinson’s models. Cell Death Dis. 2018, 9, 555. [Google Scholar] [CrossRef] [Green Version]
  12. Sinclair, J.; Pinter, K.; Samuel, T.; Beardsley, S.; Yuan, X.; Zhang, J.; Meng, K.; Yun, S.; Krause, M.; Hamza, I. Inter-organ signalling by HRG-7 promotes systemic haem homeostasis. Nat. Cell Biol. 2017, 19, 799. [Google Scholar] [CrossRef] [PubMed]
  13. Bilal, B.; Azim, M.K. Nematicidal activity of ‘major royal jelly protein’-containing glycoproteins from Acacia honey. Exp. Parasitol. 2018, 192, 52–59. [Google Scholar] [CrossRef] [PubMed]
  14. Kurshan, P.T.; Merrill, S.A.; Dong, Y.; Ding, C.; Hammarlund, M.; Bai, J.; Jorgensen, E.M.; Shen, K. γ-neurexin and frizzled mediate parallel synapse assembly pathways antagonized by receptor endocytosis. Neuron 2018, 100, 150–166.e4. [Google Scholar] [CrossRef] [PubMed]
  15. Liu, Y.J.; Janssens, G.E.; McIntyre, R.L.; Molenaars, M.; Kamble, R.; Gao, A.W.; Jongejan, A.; van Weeghel, M.; MacInnes, A.W.; Houtkooper, R.H. Glycine promotes longevity in Caenorhabditis elegans in a methionine cycle-dependent fashion. PLoS Genet. 2019, 15, e1007633. [Google Scholar] [CrossRef] [Green Version]
  16. Tang, J.; Wang, Y.; Fu, J.; Zhou, Y.; Luo, Y.; Zhang, Y.; Li, B.; Yang, Q.; Xue, W.; Lou, Y. A critical assessment of the feature selection methods used for biomarker discovery in current metaproteomics studies. Brief. Bioinform. 2019, bbz061. [Google Scholar] [CrossRef]
  17. Köhnlein, K.; Urban, N.; Guerrero-Gómez, D.; Steinbrenner, H.; Urbánek, P.; Priebs, J.; Koch, P.; Kaether, C.; Miranda-Vizuete, A.; Klotz, L.-O. A Caenorhabditis elegans ortholog of human selenium-binding protein 1 is a pro-aging factor protecting against selenite toxicity. Redox Biol. 2020, 28, 101323. [Google Scholar] [CrossRef]
  18. Kumsta, C.; Chang, J.T.; Schmalz, J.; Hansen, M. Hormetic heat stress and HSF-1 induce autophagy to improve survival and proteostasis in C. elegans. Nat. Commun. 2017, 8, 14337. [Google Scholar] [CrossRef] [Green Version]
  19. Yang, J.; Huang, X.-B.; Wan, Q.-L.; Ding, A.-J.; Yang, Z.-L.; Qiu, M.-H.; Sun, H.-Y.; Qi, S.-H.; Luo, H.-R. Otophylloside B protects against Aβ toxicity in Caenorhabditis elegans models of Alzheimer’s Disease. Nat. Prod. Bioprospect. 2017, 7, 207–214. [Google Scholar] [CrossRef] [Green Version]
  20. Klosin, A.; Casas, E.; Hidalgo-Carcedo, C.; Vavouri, T.; Lehner, B. Transgenerational transmission of environmental information in C. elegans. Science 2017, 356, 320–323. [Google Scholar] [CrossRef] [Green Version]
  21. Osman, G.A.; Fasseas, M.K.; Koneru, S.L.; Essmann, C.L.; Kyrou, K.; Srinivasan, M.A.; Zhang, G.; Sarkies, P.; Félix, M.-A.; Barkoulas, M. Natural infection of C. elegans by an oomycete reveals a new pathogen-specific immune response. Curr. Biol. 2018, 28, 640–648.e5. [Google Scholar] [CrossRef] [Green Version]
  22. Thellin, O.; Zorzi, W.; Lakaye, B.; De Borman, B.; Coumans, B.; Hennen, G.; Grisar, T.; Igout, A.; Heinen, E. Housekeeping genes as internal standards: Use and limits. J. Biotechnol. 1999, 75, 291–295. [Google Scholar] [CrossRef] [Green Version]
  23. Hoogewijs, D.; Houthoofd, K.; Matthijssens, F.; Vandesompele, J.; Vanfleteren, J.R. Selection and validation of a set of reliable reference genes for quantitative sod gene expression analysis in C. elegans. BMC Mol. Biol. 2008, 9, 9. [Google Scholar] [CrossRef] [PubMed] [Green Version]
  24. MacRae, T.; Sargeant, T.; Lemieux, S.; Hébert, J.; Deneault, É.; Sauvageau, G. RNA-Seq reveals spliceosome and proteasome genes as most consistent transcripts in human cancer cells. PLoS ONE 2013, 8, e72884. [Google Scholar] [CrossRef] [PubMed] [Green Version]
  25. Martins, P.K.; Mafra, V.; De Souza, W.R.; Ribeiro, A.P.; Vinecky, F.; Basso, M.F.; Da Cunha, B.A.D.B.; Kobayashi, A.K.; Molinari, H.B.C. Selection of reliable reference genes for RT-qPCR analysis during developmental stages and abiotic stress in Setaria viridis. Sci. Rep. 2016, 6, 28348. [Google Scholar] [CrossRef] [Green Version]
  26. Zhou, Z.; Cong, P.; Tian, Y.; Zhu, Y. Using RNA-seq data to select reference genes for normalizing gene expression in apple roots. PLoS ONE 2017, 12, e0185288. [Google Scholar] [CrossRef]
  27. Li, Y.; Zhang, L.; Li, R.; Zhang, M.; Li, Y.; Wang, H.; Wang, S.; Bao, Z. Systematic identification and validation of the reference genes from 60 RNA-Seq libraries in the scallop Mizuhopecten yessoensis. BMC Genom. 2019, 20, 288. [Google Scholar] [CrossRef]
  28. Smitha, P.; Vishnupriyan, K.; Kar, A.S.; Kumar, M.A.; Bathula, C.; Chandrashekara, K.; Dhar, S.K.; Das, M. Genome wide search to identify reference genes candidates for gene expression analysis in Gossypium hirsutum. BMC Plant Biol. 2019, 19, 1–11. [Google Scholar] [CrossRef] [Green Version]
  29. Zhan, A.; Huang, X.; Li, S. Genome-wide identification and evaluation of new reference genes for gene expression analysis under temperature and salinity stresses in Ciona savignyi. Front. Genet. 2019, 10, 71. [Google Scholar]
  30. Li, S.; Wang, W.; Li, X.; Fan, K.; Yang, K. Genome-wide identification and characterization of reference genes with different transcript abundances for Streptomyces coelicolor. Sci. Rep. 2015, 5, 15840. [Google Scholar] [CrossRef] [Green Version]
  31. Czechowski, T.; Stitt, M.; Altmann, T.; Udvardi, M.K.; Scheible, W.-R. Genome-wide identification and testing of superior reference genes for transcript normalization in Arabidopsis. Plant Physiol. 2005, 139, 5–17. [Google Scholar] [CrossRef] [Green Version]
  32. Vandesompele, J.; De Preter, K.; Pattyn, F.; Poppe, B.; Van Roy, N.; De Paepe, A.; Speleman, F. Accurate normalization of real-time quantitative RT-PCR data by geometric averaging of multiple internal control genes. Genome Biol. 2002, 3, research0034.1. [Google Scholar]
  33. Andersen, C.L.; Jensen, J.L.; Ørntoft, T.F. Normalization of real-time quantitative reverse transcription-PCR data: A model-based variance estimation approach to identify genes suited for normalization, applied to bladder and colon cancer data sets. Cancer Res. 2004, 64, 5245–5250. [Google Scholar] [CrossRef] [PubMed] [Green Version]
  34. Pfaffl, M.W.; Tichopad, A.; Prgomet, C.; Neuvians, T.P. Determination of stable housekeeping genes, differentially regulated target genes and sample integrity: BestKeeper–Excel-based tool using pair-wise correlations. Biotechnol. Lett. 2004, 26, 509–515. [Google Scholar] [CrossRef]
  35. Schmittgen, T.D.; Livak, K.J. Analyzing real-time PCR data by the comparative C T method. Nat. Protoc. 2008, 3, 1101. [Google Scholar] [CrossRef] [PubMed]
  36. Carvalho, B.S.; Irizarry, R.A. A framework for oligonucleotide microarray preprocessing. Bioinformatics 2010, 26, 2363–2367. [Google Scholar] [CrossRef] [PubMed]
  37. Pepper, S.D.; Saunders, E.K.; Edwards, L.E.; Wilson, C.L.; Miller, C.J. The utility of MAS5 expression summary and detection call algorithms. BMC Bioinform. 2007, 8, 273. [Google Scholar] [CrossRef] [PubMed] [Green Version]
  38. Li, C.; Wong, W.H. Model-based analysis of oligonucleotide arrays: Expression index computation and outlier detection. Proc. Natl. Acad. Sci. USA 2001, 98, 31–36. [Google Scholar] [CrossRef]
  39. Wu, Z.; Irizarry, R.A. Preprocessing of oligonucleotide array data. Nat. Biotechnol. 2004, 22, 656. [Google Scholar] [CrossRef]
  40. Shippy, R.; Fulmer-Smentek, S.; Jensen, R.V.; Jones, W.D.; Wolber, P.K.; Johnson, C.D.; Pine, P.S.; Boysen, C.; Guo, X.; Chudin, E. Using RNA sample titrations to assess microarray platform performance and normalization techniques. Nat. Biotechnol. 2006, 24, 1123. [Google Scholar] [CrossRef] [Green Version]
  41. Huber, W.; Von Heydebreck, A.; Sültmann, H.; Poustka, A.; Vingron, M. Variance stabilization applied to microarray data calibration and to the quantification of differential expression. Bioinformatics 2002, 18, S96–S104. [Google Scholar] [CrossRef]
  42. Irizarry, R.A.; Hobbs, B.; Collin, F.; Beazer-Barclay, Y.D.; Antonellis, K.J.; Scherf, U.; Speed, T.P. Exploration, normalization, and summaries of high density oligonucleotide array probe level data. Biostatistics 2003, 4, 249–264. [Google Scholar] [CrossRef] [Green Version]
  43. Pihur, V.; Datta, S.; Datta, S. RankAggreg, an R package for weighted rank aggregation. BMC Bioinform. 2009, 10, 62. [Google Scholar] [CrossRef] [PubMed] [Green Version]
  44. Durinck, S.; Spellman, P.T.; Birney, E.; Huber, W. Mapping identifiers for the integration of genomic datasets with the R/Bioconductor package biomaRt. Nat. Protoc. 2009, 4, 1184. [Google Scholar] [CrossRef] [PubMed] [Green Version]
  45. Huber, W.; Carey, V.J.; Gentleman, R.; Anders, S.; Carlson, M.; Carvalho, B.S.; Bravo, H.C.; Davis, S.; Gatto, L.; Girke, T. Orchestrating high-throughput genomic analysis with Bioconductor. Nat. Methods 2015, 12, 115. [Google Scholar] [CrossRef] [PubMed]
  46. Zhou, Y.; Zhou, B.; Pache, L.; Chang, M.; Khodabakhshi, A.H.; Tanaseichuk, O.; Benner, C.; Chanda, S.K. Metascape provides a biologist-oriented resource for the analysis of systems-level datasets. Nat. Commun. 2019, 10, 1523. [Google Scholar] [CrossRef]
  47. Cline, M.S.; Smoot, M.; Cerami, E.; Kuchinsky, A.; Landys, N.; Workman, C.; Christmas, R.; Avila-Campilo, I.; Creech, M.; Gross, B. Integration of biological networks and gene expression data using Cytoscape. Nat. Protoc. 2007, 2, 2366. [Google Scholar] [CrossRef] [Green Version]
  48. Kryuchkova-Mostacci, N.; Robinson-Rechavi, M. A benchmark of gene expression tissue-specificity metrics. Brief. Bioinform. 2017, 18, 205–214. [Google Scholar] [CrossRef]
  49. O’Hagan, S.; Muelas, M.W.; Day, P.J.; Lundberg, E.; Kell, D.B. GeneGini: Assessment via the Gini coefficient of reference “housekeeping” genes and diverse human transporter expression profiles. Cell Syst. 2018, 6, 230–244.e1. [Google Scholar] [CrossRef] [Green Version]
  50. Büttner, M.; Miao, Z.; Wolf, F.A.; Teichmann, S.A.; Theis, F.J. A test metric for assessing single-cell RNA-seq batch correction. Nat. Methods 2019, 16, 43. [Google Scholar] [CrossRef] [Green Version]
  51. Hartman, J.H.; Richie, C.T.; Gordon, K.L.; Mello, D.F.; Castillo, P.; Zhu, A.; Wang, Y.; Hoffer, B.J.; Sherwood, D.R.; Meyer, J.N.; et al. MANF deletion abrogates early larval Caenorhabditis elegans stress response to tunicamycin and Pseudomonas aeruginosa. Eur. J. Cell Biol. 2019, 98. [Google Scholar] [CrossRef]
  52. Fang, E.F.; Hou, Y.; Lautrup, S.; Jensen, M.B.; Yang, B.; SenGupta, T.; Caponio, D.; Khezri, R.; Demarest, T.G.; Aman, Y.; et al. NAD(+) augmentation restores mitophagy and limits accelerated aging in Werner syndrome. Nat. Commun. 2019, 10, 5284. [Google Scholar] [CrossRef] [Green Version]
  53. Fang, E.F.; Kassahun, H.; Croteau, D.L.; Scheibye-Knudsen, M.; Marosi, K.; Lu, H.; Shamanna, R.A.; Kalyanasundaram, S.; Bollineni, R.C.; Wilson, M.A.; et al. NAD(+) Replenishment Improves Lifespan and Healthspan in Ataxia Telangiectasia Models via Mitophagy and DNA Repair. Cell Metab. 2016, 24, 566–581. [Google Scholar] [CrossRef] [Green Version]
  54. Rangaraju, S.; Solis, G.M.; Thompson, R.C.; Gomez-Amaro, R.L.; Kurian, L.; Encalada, S.E.; Niculescu, A.B., 3rd; Salomon, D.R.; Petrascheck, M. Suppression of transcriptional drift extends C. elegans lifespan by postponing the onset of mortality. eLife 2015, 4, e08833. [Google Scholar] [CrossRef] [PubMed] [Green Version]
  55. Levin, M.; Anavy, L.; Cole, A.G.; Winter, E.; Mostov, N.; Khair, S.; Senderovich, N.; Kovalev, E.; Silver, D.H.; Feder, M.; et al. The mid-developmental transition and the evolution of animal body plans. Nature 2016, 531, 637–641. [Google Scholar] [CrossRef]
  56. Harvald, E.B.; Sprenger, R.R.; Dall, K.B.; Ejsing, C.S.; Nielsen, R.; Mandrup, S.; Murillo, A.B.; Larance, M.; Gartner, A.; Lamond, A.I. Multi-omics Analyses of Starvation Responses Reveal a Central Role for Lipoprotein Metabolism in Acute Starvation Survival in C. elegans. Cell Syst. 2017, 5, 38–52.e4. [Google Scholar] [CrossRef] [PubMed] [Green Version]
  57. Karczewski, K.J.; Snyder, M.P. Integrative omics for health and disease. Nat. Rev. Genet. 2018, 19, 299. [Google Scholar] [CrossRef] [PubMed]
  58. Haghverdi, L.; Lun, A.T.; Morgan, M.D.; Marioni, J.C. Batch effects in single-cell RNA-sequencing data are corrected by matching mutual nearest neighbors. Nat. Biotechnol. 2018, 36, 421. [Google Scholar] [CrossRef] [PubMed]
  59. Goh, W.W.B.; Wang, W.; Wong, L. Why batch effects matter in omics data, and how to avoid them. Trends Biotechnol. 2017, 35, 498–507. [Google Scholar] [CrossRef]
  60. Panagiotou, O.A.; Willer, C.J.; Hirschhorn, J.N.; Ioannidis, J.P. The power of meta-analysis in genome-wide association studies. Ann. Rev. Genom. Hum. Genet. 2013, 14, 441–465. [Google Scholar] [CrossRef] [Green Version]
  61. Dapas, M.; Kandpal, M.; Bi, Y.; Davuluri, R.V. Comparative evaluation of isoform-level gene expression estimation algorithms for RNA-seq and exon-array platforms. Brief. Bioinform. 2016, 18, 260–269. [Google Scholar] [CrossRef] [Green Version]
  62. Romero, J.P.; Ortiz-Estévez, M.; Muniategui, A.; Carrancio, S.; de Miguel, F.J.; Carazo, F.; Montuenga, L.M.; Loos, R.; Pío, R.; Trotter, M.W. Comparison of RNA-seq and microarray platforms for splice event detection using a cross-platform algorithm. BMC Genom. 2018, 19, 703. [Google Scholar] [CrossRef] [Green Version]
  63. Mantione, K.J.; Kream, R.M.; Kuzelova, H.; Ptacek, R.; Raboch, J.; Samuel, J.M.; Stefano, G.B. Comparing bioinformatic gene expression profiling methods: Microarray and RNA-Seq. Med. Sci. Monit. Basic Res. 2014, 20, 138. [Google Scholar] [PubMed] [Green Version]
  64. Meng, Q.; Catchpoole, D.; Skillicorn, D.; Kennedy, P.J. DBNorm: Normalizing high-density oligonucleotide microarray data based on distributions. BMC Bioinform. 2017, 18, 527. [Google Scholar] [CrossRef] [PubMed] [Green Version]
  65. Li, B.; Tang, J.; Yang, Q.; Li, S.; Cui, X.; Li, Y.; Chen, Y.; Xue, W.; Li, X.; Zhu, F. NOREVA: Normalization and evaluation of MS-based metabolomics data. Nucleic Acids Res. 2017, 45, W162–W170. [Google Scholar] [CrossRef] [PubMed] [Green Version]
  66. Li, B.; Tang, J.; Yang, Q.; Cui, X.; Li, S.; Chen, S.; Cao, Q.; Xue, W.; Chen, N.; Zhu, F. Performance evaluation and online realization of data-driven normalization methods used in LC/MS based untargeted metabolomics analysis. Sci. Rep. 2016, 6, 38881. [Google Scholar] [CrossRef] [PubMed] [Green Version]
  67. Hicks, S.C.; Irizarry, R.A. quantro: A data-driven approach to guide the choice of an appropriate normalization method. Genome Biol. 2015, 16, 117. [Google Scholar] [CrossRef] [Green Version]
  68. Casadei, R.; Pelleri, M.C.; Vitale, L.; Facchin, F.; Lenzi, L.; Canaider, S.; Strippoli, P.; Frabetti, F. Identification of housekeeping genes suitable for gene expression analysis in the zebrafish. Gene Expr. Patterns 2011, 11, 271–276. [Google Scholar] [CrossRef]
  69. Simsek, D.; Barna, M. An emerging role for the ribosome as a nexus for post-translational modifications. Curr. Opin. Cell Biol. 2017, 45, 92–101. [Google Scholar] [CrossRef] [Green Version]
  70. Chakraborty, A.; Kenmochi, N. Ribosomes and Ribosomal Proteins: More Than Just ‘Housekeeping’. In e LS; John Wiley & Sons, Inc.: Hoboken, NJ, USA, 2001. [Google Scholar] [CrossRef]
  71. Smagin, D.A.; Kovalenko, I.L.; Galyamina, A.G.; Orlov, Y.L.; Babenko, V.N.; Kudryavtseva, N.N. Heterogeneity of brain ribosomal genes expression following positive fighting experience in male mice as revealed by RNA-Seq. Mol. Neurobiol. 2018, 55, 390–401. [Google Scholar] [CrossRef]
  72. Eisenberg, E.; Levanon, E.Y. Human housekeeping genes, revisited. Trends Genet. 2013, 29, 569–574. [Google Scholar] [CrossRef]
  73. Choudhary, R.; Kumar, S.; Singh, S.V.; Sharma, A.K.; Goud, T.S.; Srivastava, A.K.; Kumar, A.; Mohanty, A.K.; Upadhyay, R.C. Validation of putative reference genes for gene expression studies in heat stressed and α-MSH treated melanocyte cells of Bos indicus using real-time quantitative PCR. Mol. Cell. Probes 2016, 30, 161–167. [Google Scholar] [CrossRef]
  74. Zhang, C.; Wang, Y.Q.; Jin, G.; Wu, S.; Cui, J.; Wang, R.F. Selection of reference genes for gene expression studies in human bladder cancer using SYBR-Green quantitative polymerase chain reaction. Oncol. Lett. 2017, 14, 6001–6011. [Google Scholar] [CrossRef] [PubMed] [Green Version]
  75. Liang, C.; Han, S.; Han, H.; Zhao, F.; He, Y. Selection of reference genes for Harmonia axyridis (Coleoptera: Coccinellidae) feeding on different diets. J. Asia-Pac. Entomol. 2019, 22, 1115–1122. [Google Scholar] [CrossRef]
  76. Mhatre, K.N.; Wakula, P.; Klein, O.; Bisping, E.; Völkl, J.; Pieske, B.; Heinzel, F.R. Crosstalk between FGF23-and angiotensin II-mediated Ca 2+ signaling in pathological cardiac hypertrophy. Cell. Mol. Life Sci. 2018, 75, 4403–4416. [Google Scholar] [CrossRef] [PubMed]
  77. Kfir, S.; Basavaraja, R.; Wigoda, N.; Ben-Dor, S.; Orr, I.; Meidan, R. Genomic profiling of bovine corpus luteum maturation. PLoS ONE 2018, 13, e0194456. [Google Scholar] [CrossRef] [PubMed]
  78. Gruzdev, E.V.; Mardanov, A.V.; Beletsky, A.V.; Kochieva, E.Z.; Ravin, N.V.; Skryabin, K.G. The complete chloroplast genome of parasitic flowering plant Monotropa hypopitys: Extensive gene losses and size reduction. Mitochondrial DNA Part B 2016, 1, 212–213. [Google Scholar] [CrossRef] [Green Version]
  79. Mallet, S.; Weiss, S.; Jacques, N.; Leh-Louis, V.; Sacerdot, C.; Casaregola, S. Insights into the life cycle of yeasts from the CTG clade revealed by the analysis of the Millerozyma (Pichia) farinosa species complex. PLoS ONE 2012, 7, e35842. [Google Scholar] [CrossRef]
Figure 1. The workflow for the identification of housekeeping gene (HKG) candidates. Briefly, gene expression matrix (GEM) for each microarray dataset was obtained by normalizing raw data using six algorithms (RMA, MAS5, Li-Wong, GCRMA, PLIER, and VSN, respectively), and the corresponding first-round ranked gene lists (abbr. GL, from GL1 to GLn) were achieved based on gene expression stability. And then, multiple GLs derived from the algorithm-specific normalization were merged as the second-round ranked gene list (abbr. SGL) using RankAggreg algorithm and produced six SGLs (SGLR, SGLM, SGLd, SGLG, SGLP, and SGLV). Finally, these six SGLs were intersected to obtain the final reliable HKG candidates.
Cells 09 00786 g001
Figure 2. Intersection analysis of top 50 genes from each SGL.
Cells 09 00786 g002
Figure 3. Function enrichment of all top 50 genes in six SGLs.
Cells 09 00786 g003
Figure 4. Violin plots showing the reliability of expression levels and boxplots representing standard variations in six independent datasets, for 13 NRGs (dark green) and 13 CRGs (orange). (AC) and (DF) represent validated results by using three microarray datasets and three RNA-seq datasets, respectively.
Cells 09 00786 g004
Table 1. Reliable housekeeping gene candidates of C. elegans identified in this study.
Gene SymbolEntrez
Gene ID
DescriptionChromosome LocationSize (bp)
rps-2317818840S ribosomal protein S23Chr. IV: 12390264–12391396550
rps-2717853840S ribosomal protein S27Chr. V: 103394–104064356
rps-1617999840S ribosomal protein S16Chr. V: 15000011–15000594533
rps-2617334240S ribosomal protein S26Chr. I: 14759918–14760654440
rps-417748140S ribosomal protein S4Chr. IV: 7083694–7084682849
rps-217758340S ribosomal protein S2Chr. IV: 7925298–7926391998
rps-1717231340S ribosomal protein S17Chr. I: 6220090–6220766465
rpl-24.117206260S ribosomal protein L24Chr. I: 4585115–4586177552
rpl-1517689160S ribosomal protein L15Chr. IV: 653436–654576732
rpl-3517609760S ribosomal protein L35Chr. III: 7855118–7855680460
rpl-3617600760S ribosomal protein L36Chr. III: 7180249–7180677355
rpl-2717175060S ribosomal protein L27Chr. I: 1834881–1835439466
rpl-3317416660S ribosomal protein L35Chr. II: 7105556–7106462440
Table 2. Validation and comparison for housekeeping gene candidates in C. elegans.
Accession NumberJournal, YearTechniqueSample SizeData SourceNormalization MethodTop 10 Genes Sorted by SD 1Top 10 Genes Sorted by GC 2
GSE118294Eur. J. Cell Biol., 2019DNA Microarray12GPL200
Affymetrix C. elegans Genome Array
RMArps-26, rpl-36, rpl-33, rpl-15, rps-27, rpl-35, rpl-27, rps-4, rps-23, rpl-24.1rps-26, rpl-33, rpl-36, rps-27, rpl-15, rpl-35, rpl-27, rps-4, rps-23, rpl-24.1
GSE108968Nat. Commun., 2019DNA Microarray32GPL10094 Agilent-020186 C. elegans (V2) MicroarrayQuantile, logrpl-24.1, rpl-27, rps-16, rpl-35, cyc-1, rps-23, rpl-33, atp-3, rps-2, rpl-36rpl-33, rpl-24.1, rps-16, rpl-35, rpl-27, rps-23, rpl-36, atp-3, rps-2, cyc-1
GSE76380Cell Metab., 2016DNA Microarray48GPL10094 Agilent-020186 C. elegans (V2) MicroarrayQuantile, logrpl-33, rps-2, rps-16, rpl-24.1, rpl-35, rps-23, rps-4, rpl-36, rpl-27, cyc-1rpl-33, rps-23, rps-2, rpl-35, rps-4, rpl-36, rps-16, rpl-15, rpl-24.1, cyc-1
GSE63528eLife, 2015RNA-sequencing36GPL13657
Illumina HiSeq 2000 (C. elegans)
log2(CPM+1)rps-2, rps-4, pmp-3, atp-3, rbd-1, rpl-27, rps-17, rpl-35, rps-26, act-2rps-4, rps-2, atp-3, rps-26, rps-17, rpl-27, rpl-35, rps-16, pmp-3, rpl-24.1
GSE60755Nature, 2016RNA-sequencing139GPL13657
Illumina HiSeq 2000 (C. elegans)
log2(CPM+1)rps-2, atp-3, mdh-1, rpl-36, rps-17, rpl-33, rpl-35, rps-4, cyc-1, rpl-15rps-2, atp-3, rpl-36, cyc-1, rpl-35, rpl-33, mdh-1, rps-27, rps-17, rpl-24.1
GSE98919Cell Syst., 2017RNA-sequencing42GPL18730
Illumina HiSeq 1500 (C. elegans)
log2(CPM+1)tba-1, rps-4, rpl-27, mdh-1, rpl-15, rps-26, rps-2, rps-23, cyc-1, rpl-24.1rpl-4, rpl-15, rps-23, rpl-27, rpl-24.1, rps-2, rps-26, rps-27, rps-17, rps-16
1SD and 2 GC were abbreviations of standard deviation and Gini coefficient, respectively. Top 10 genes were selected based on the ranking results of the combination gene list of 13 newly identified reference genes (NRGs) and 13 commonly used reference genes (CRGs) in this study.

