3.4.1. A Word of Caution: Mechanism vs. Biomarker
The excitement of obtaining an epigenetic signal that is strong, robust and potentially causal can be exhilarating. However, before deriving conclusions about the ‘aetiological mechanism of disease’, it is advisable to recall the original aim of the study. Frequently, the aim is to identify causes of disease, which is imperative for interventions to be successful. On the other hand, establishing non-causal associations (often referred to as biomarkers, see below) can be useful in prediction. However, a biomarker can be causal or non-causal. Whether the aim is to identify a causal pathway and/or a biomarker (of risk or of disease) should be set out in the initial stages of the project. Caution is advised with respect to the conclusions that can be drawn from the study design and data in terms of biological mechanisms. The interpretation of results will differ, depending on the underlying assumptions about the likelihood of system-wide effects of the exposure (i.e., genetic or environmental causes of disease), the relationship between the studied tissue and the primary tissue of pathophysiology. In most cases, methylation profiles would have been obtained from peripheral tissues (blood or saliva), with a small proportion of studies using post-mortem brain tissue.
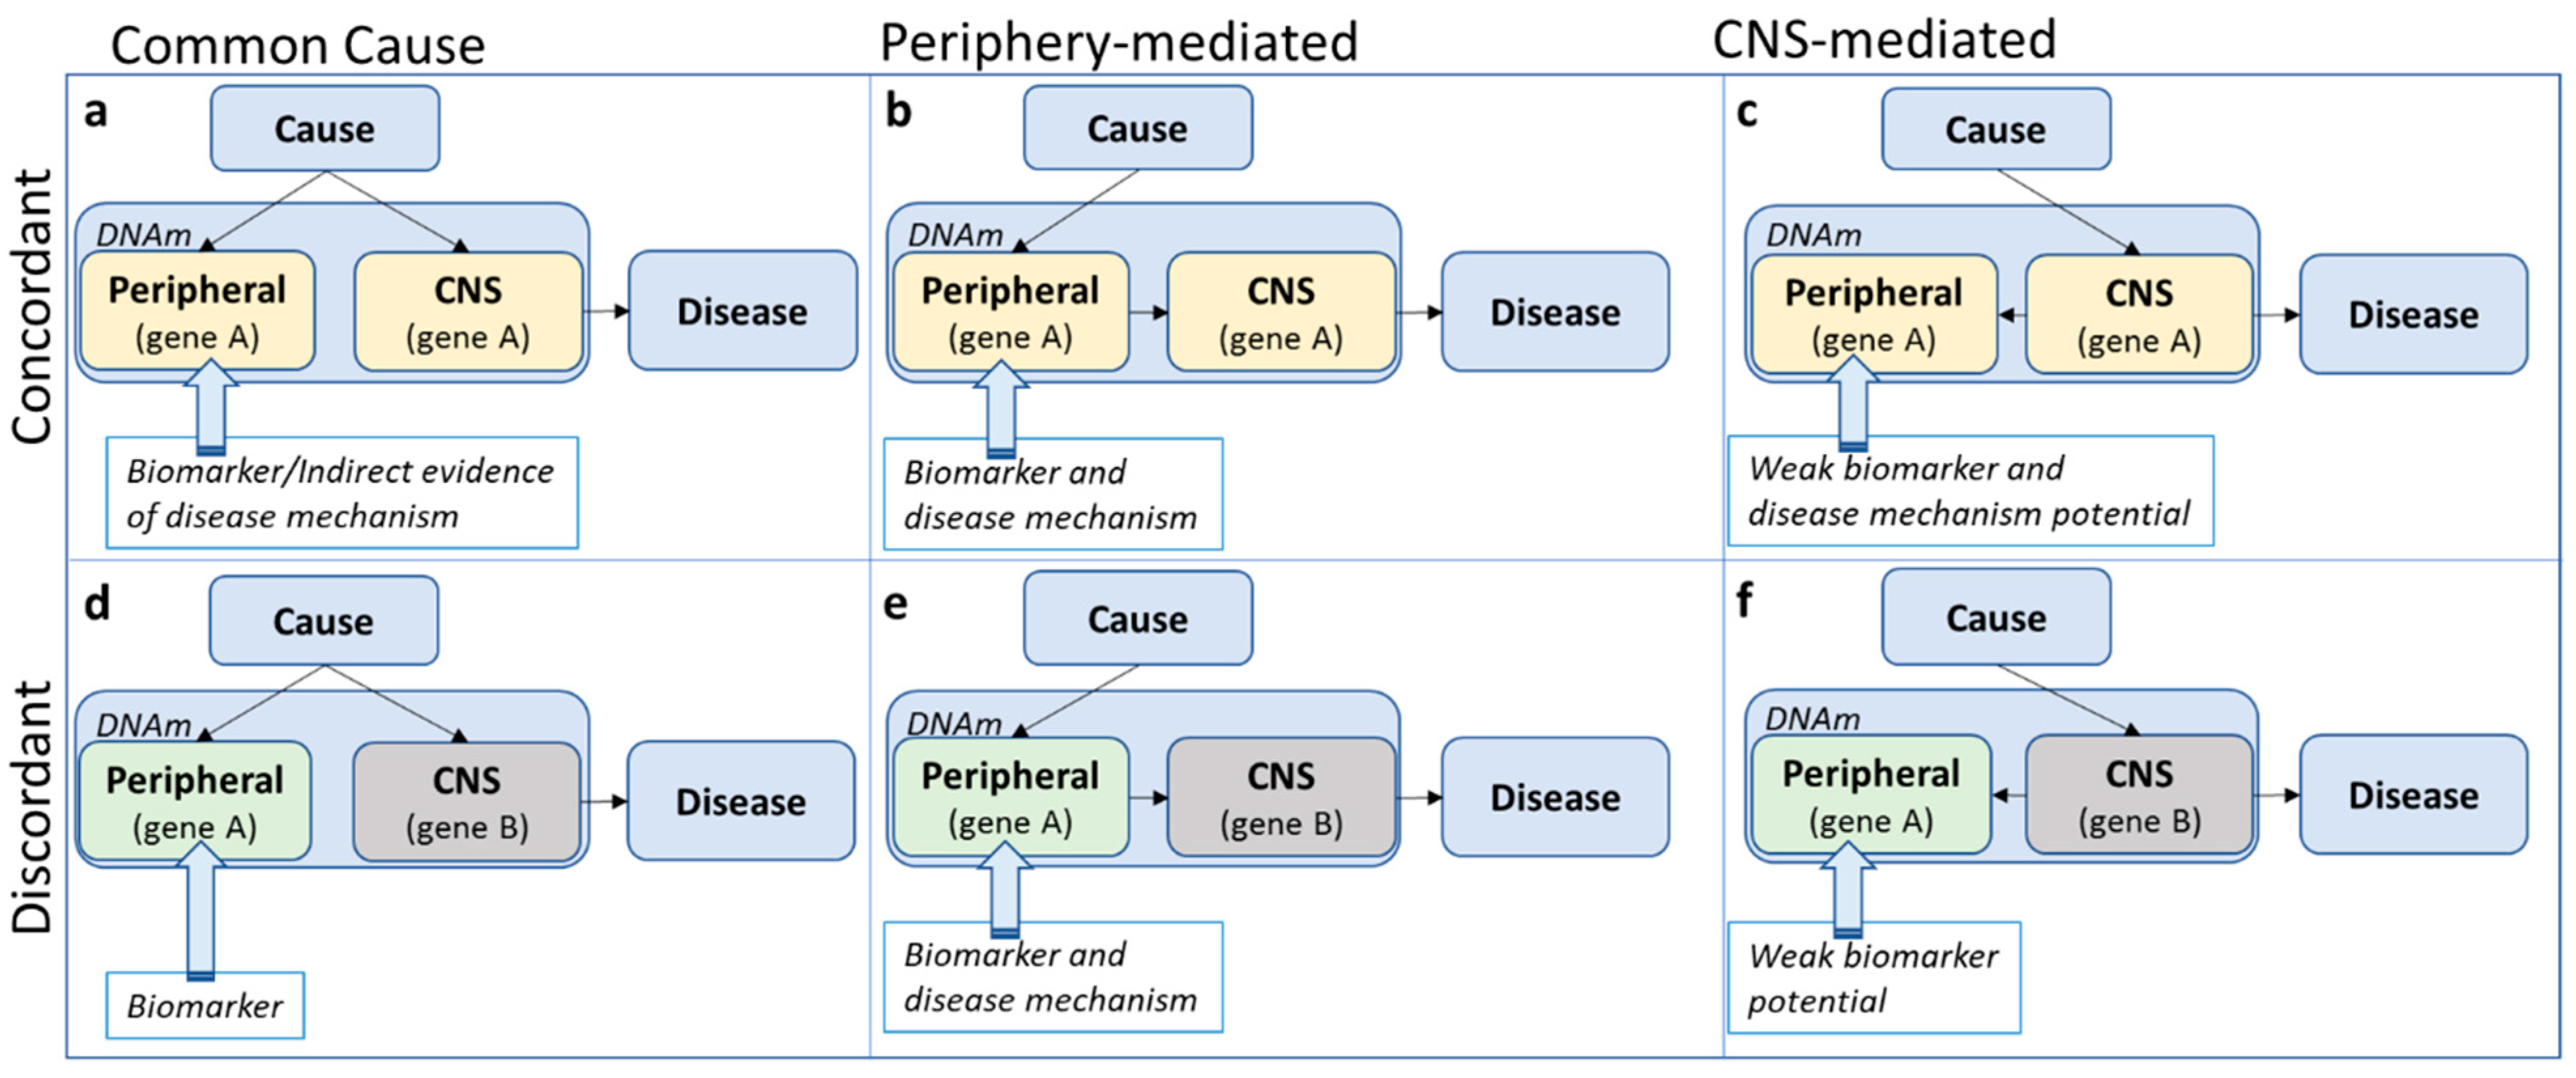
Under the assumption that the causal (but not necessarily initial, see argument below) tissue of pathophysiology is the brain, at least three potential scenarios are possible to describe the relationship between peripheral and CNS methylation profiles: A shared common cause, periphery-mediated or CNS-mediated pathways to disease (left, middle and right panels in
Figure 2). Note that a scenario in which DNA methylation is a direct consequence, rather than a precursor, of disease, is an equally likely possibility, but not the focus of the current discussion. A mechanistic interpretation of findings based on peripheral tissue only makes sense assuming that the initial cause of pathophysiology originates in the periphery (
Figure 2b,e) or at the very least assuming concordance of methylation patterns across tissues (top panel
Figure 2, although see below for additional assumptions).
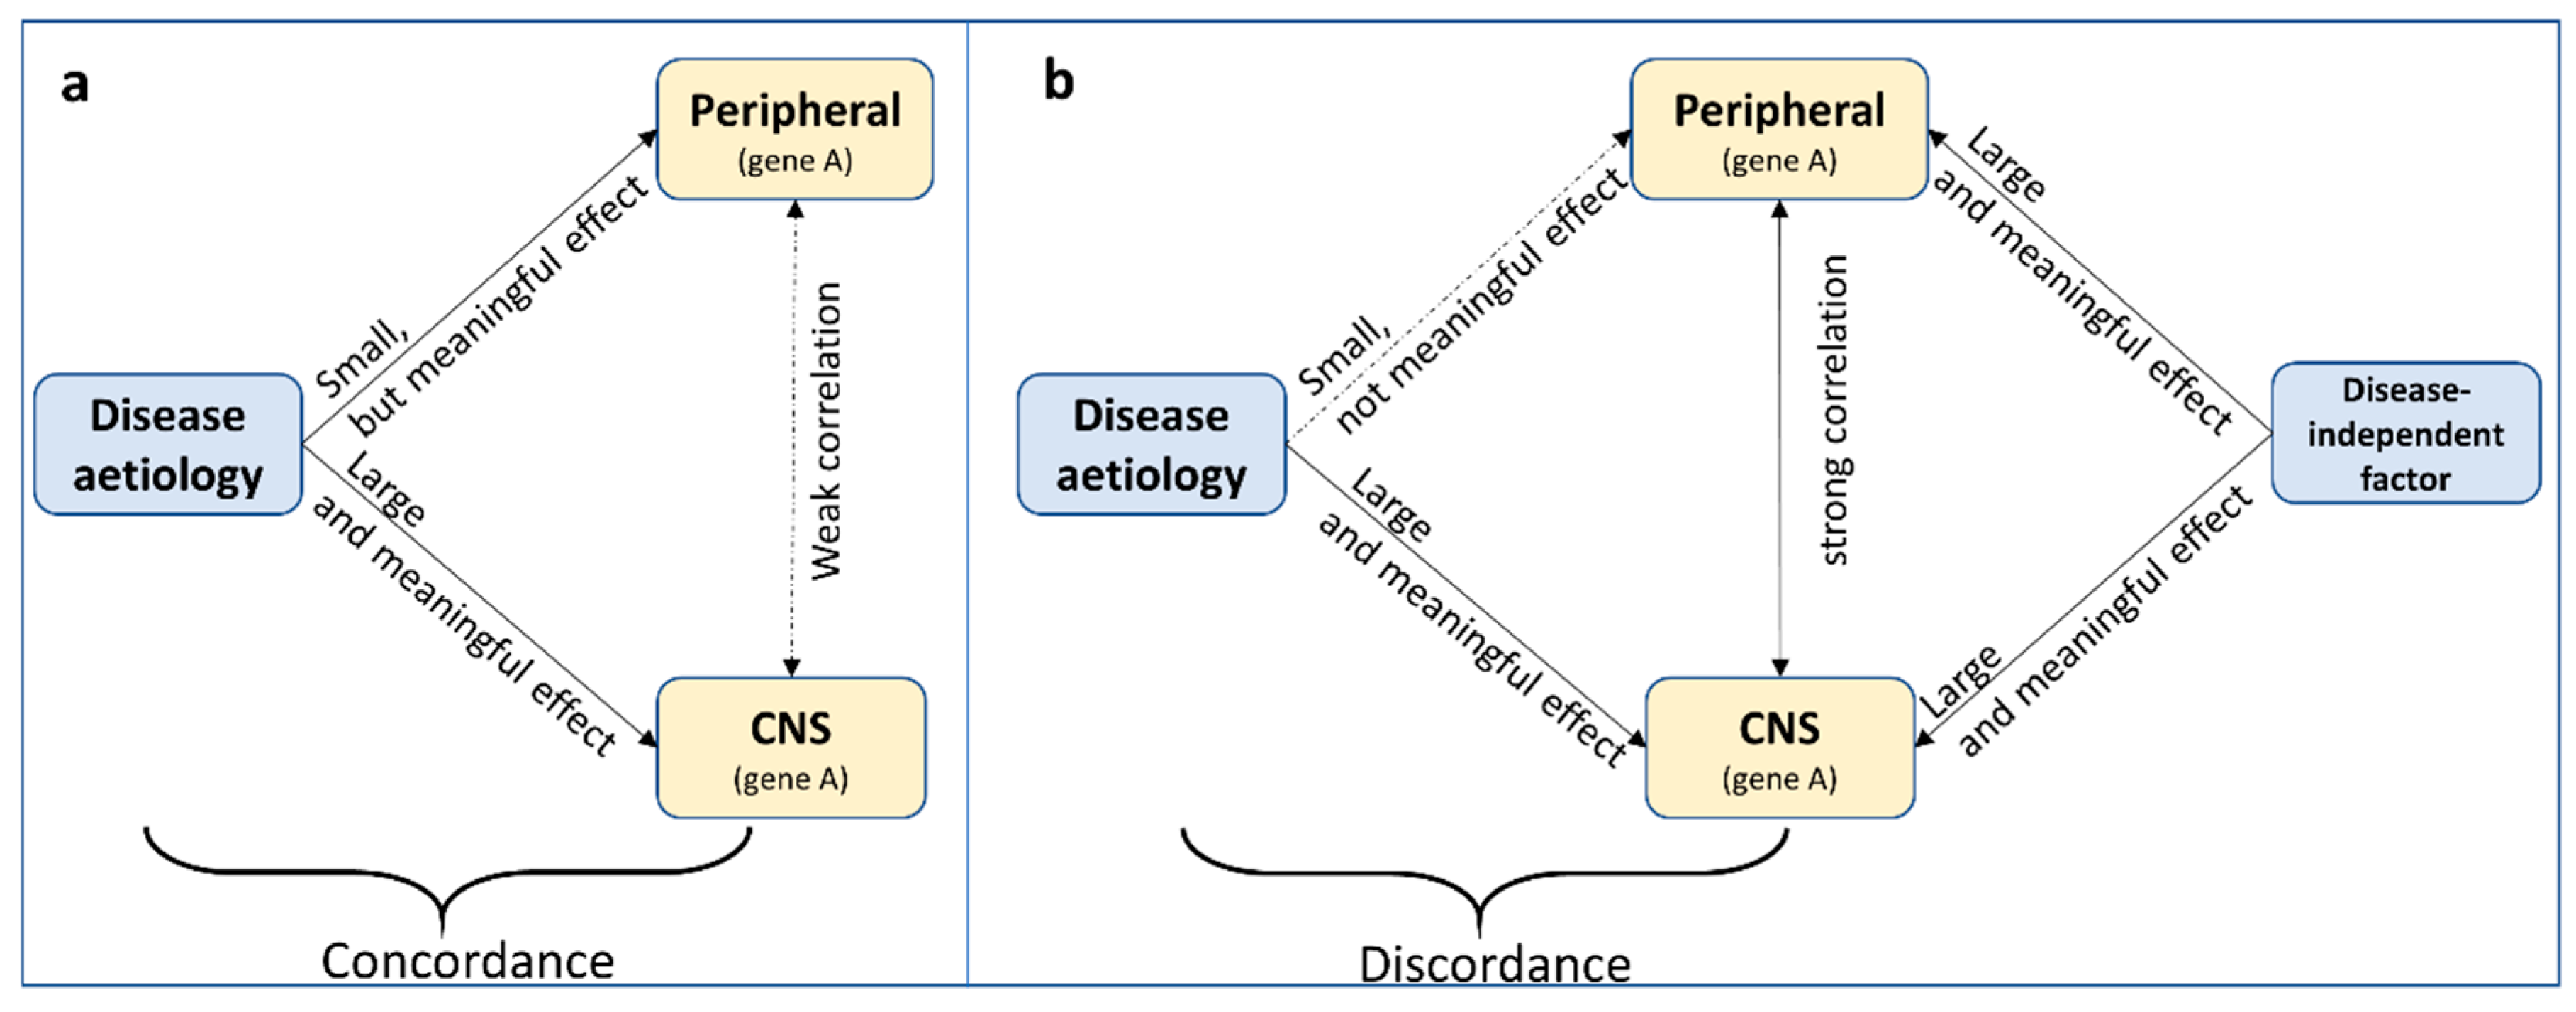
‘Concordance’ in this case shall be defined as the consistency in effect of the exposure (i.e., the cause of disease) on DNA methylation across tissue. This is different from ‘correlation’ of DNA methylation across tissue. For example,
relative (but meaningful) perturbations in DNA methylation due to an exposure might be comparable across tissue, while
absolute DNA methylation levels themselves are less correlated across tissues (
Figure 3a). This assumes that small levels of perturbations can have large effects in some but not in other tissues. Likewise, without knowing what precisely causes cross-tissue correlations in DNA methylation, DNA methylation levels might be correlated across tissue, but the effect of an exposure on DNA methylation in each tissue is different (
Figure 3b). Therefore, while correlation of DNA methylation profiles across tissues is often an important indication, it is neither necessary nor sufficient for cross-tissue concordant effects.
All too often, cross-tissue concordance and correlation are implicitly assumed and findings are interpreted as potentially mechanistic. However, there is evidence that cross-tissue
correlation seems to be the exception, rather than the norm [
66].
Concordance of methylation profiles across tissues is hardly ever investigated, due to the difficulty (and cost) in measuring the effect of a risk factor on DNA methylation across several tissues in the same individuals. The notable exception of this is the investigation of tissue-specific mQTLs. For online available resources to investigate cross-tissue concordance and correlation, see
Section 3.4.2 and
Section 3.4.3.
Even in the case of cross-tissue concordance, it is easy to overstate risk pathways to disease. In the concordant, common cause scenario (
Figure 2a), the tendency is to assume system-wide causal effects, but it might be equally likely that a disease risk factor impacts methylation of the same gene in different tissues independently. In all concordant scenarios (
Figure 2a–c), concordant gene function across tissues is presumed, although genes can have different functions in different tissues. For example, assuming that in an analysis based on data from whole blood, a methylation site was identified with a potential relevance for serotonin function. In the periphery, the primary function of serotonin is digestion, while in the CNS, serotonin is mainly involved in sleep and mood [
67]. In the ‘shared common cause’ scenario (
Figure 2a), we do not need to focus on digestion-related functions, as these are not likely to be involved in the disease pathophysiology. In the ‘periphery-mediated’ scenario (
Figure 2b), however, digestion should be a main pathway-of-risk, while in the ‘CNS-mediated’ scenario (
Figure 2c), digestion is, if anything, a downstream pathway of disease. Any mechanistic interpretation of findings depends fundamentally on which scenario is most likely.
When concordance is not assumed (
Figure 2d–f), the default position is often that, even though the epigenetic variation is not likely to be mechanistically involved, it may act as a biomarker of disease risk. However, the precise ‘biomarker’ definition referred to is often not clear. According to the National Institute of Health Biomarkers Definition Working group, a biomarker is ‘a characteristic that is objectively measured and evaluated as an indicator of normal biologic processes, pathologic processes or biological responses to a therapeutic intervention’ [
68]. While it is beyond the scope of this review to discuss the role of DNA methylation as a biomarker of risk or disease, this term should not be used too lightly. Biomarkers should be easily (in terms of tissue accessibility) and robustly measurable with little measurement error, reproducible across studies (e.g., it is not advised to claim biomarker potential based on a single study without replication) and have predictive power (or alternative advantages, such as reducing costs). Finally, it should be clear what exactly the established biomarker indexes (risk, disease or treatment). While it is often claimed that methylation-based biomarkers have the potential to inform intervention strategies, studies designed to explicitly demonstrate this are rarely seen [
69].
It is impossible to test these scenarios (
Figure 2) directly without access to longitudinal and repeated measures of both peripheral and brain tissue in living humans, but their likelihood can be assessed by using tissue-specific causal inference method such as Mendelian randomization (see
Section 3.3) and the increasing body of online resources as described in the following sections.
3.4.2. Biological Characterisation
Characterising the biological relevance of an identified methylation site is often part of an epigenome-wide analysis, regardless of whether a potential disease mechanism has been established. While methylation sites are often primarily viewed in relation to the nearest coding gene, it can be equally important to consider DNA methylation in the context of regulation of gene expression via impacting chromatin accessibility and transcription factor binding. For instance, studies have confirmed that DNA methylation around the transcription start site is largely associated with reduced gene expression locally [
49]. In a study based on brain samples, DNA methylation and histone modifications were located in regulatory regions and seemed to mediate the association of genetic variants with gene expression [
70]. Many of those epigenomic loci were also replicated in peripheral blood samples and were associated with psychiatric diseases, such as schizophrenia and bipolar disorder. To characterize the biological context of a methylation site, the results of an EWAS can first be matched to the annotation file usually provided with the data, or openly accessible online (Illumina 450k and EPIC array annotation are, for example, available via various R packages such as
meffil [
33]). This will provide CpG information on genomic location, SNPs located in or close to the probe, associated genes and location with respect to the transcription start site of these genes or CpG islands. Furthermore, information is provided on low- or high-CpG density regions associated with Functional Annotation of the Mouse/Mammalian Genome (FANTOM) 4 promoters [
71], although the reader should keep in mind that this information was based on human myeloid leukaemia cell lines and is not specific to CNS tissue. Finally, in the annotation file the reader will find information on enhancer elements, DNase I Hypersensitivity Sites, open chromatin regions and transcription factor binding sites (all based on the Encyclopaedia of DNA Elements (ENCODE) data [
72]).
Whenever possible, however, querying several databases (see
Table 5 for selected resources) is advocated to corroborate results and to summarize all findings to avoid selective reporting. Also, to achieve a more meaningful interpretation of the regulatory nature of the genomic region in question, investigating these regulatory characteristics in a cell-type specific manner is advisable, which can be achieved using ENCODE data (
www.encodeproject.org), usually via platforms such as genome.ucsc.edu. For example, DNase I hypersensitivity clusters—indicative of regulatory chromatin regions that are sensitive to cutting by the enzyme DNase—can be viewed for 125 cell types (including cells derived from blood and brain tissue) as part of the ENCODE project. Histone marks and transcription levels are available for up to nine cell lines (including blood, embryonic stem cells and skeletal muscle, among others). Transcription factor binding sites are listed for 161 factors in 91 cell types (for a list on cell types, see here:
https://genome.ucsc.edu/cgi-bin/hgEncodeVocab?type=%22cell%22). Note that information on CNS-specific cell types is not always available but high (or low) correspondence across these diverse cell types could indicate similarly (un-)correlated profiles in brain tissue. For cell-type specific profiles related to brain tissue, a suggestion could be to investigate DNase I and histone mark data from the Roadmap Epigenetics Project (
http://www.roadmapepigenomics.org/data/) that assayed ten different brain regions (including the hippocampus, cerebellum and mid-frontal lobe, among others). Note though that DNase I data is only available for foetal brain (not region-specific) and spinal cord tissue. Also note that, to view Roadmap data in the UCSC genome browser, the reader will need to import these tracks via the UCSC Track data hub (
https://genome.ucsc.edu/cgi-bin/hgHubConnect) or via
http://www.roadmapepigenomics.org/data/. PsychENCODE is a comprehensive resource with exceptional relevance to brain related traits [
73,
74,
75,
76,
77,
78,
79,
80,
81,
82,
83]. It provides raw and derived transcriptomic, epigenomic, and genomic data of post-mortem adult and developing human brains, both at the single-cell and tissue level. This dataset also includes measures on (hydroxy-)methylation, is based on up to 2000 individuals and incorporates resources such as GTEx, ENCODE and Roadmap Epigenetics Project, discussed above and elsewhere in this article. Data and results can be downloaded from The PsychENCODE knowledge portal (
http://www.synapse.org/pec) and from
http://resource.psychencode.org/.
After investigating the regulatory nature of the genomic region, it can also be helpful to query whether the CpG itself or the differentially methylated region (DMR) has been implicated in other epigenome-wide analyses, which can be done using a manually curated EWAS catalogue hosted at
http://www.ewascatalog.org/.
Finally, it is advised to investigate: (1) Ehether a CpG-of-interest is under genetic control by identifying potential mQTLs, ideally in a tissue-specific manner (see
Section 3.3.1 and
Table 3 above for a list of resources); (2) whether a genomic region might show epigenetic supersimilarity, i.e., where the similarity in DNA methylation between twins is greater than expected based on shared genetics, as reported by Van Baak et al. [
85]; and (3) whether a CpG-linked gene might be imprinted, meaning that the expression of this gene depends on the parental origin. For a list of imprinted genes, see
http://www.geneimprint.com/site/genes-by-species.
3.4.3. Cross-Tissue Comparisons
Cross-tissue correlation (see
Section 3.4.1) is an important, but not essential, requirement, even for a mechanistic interpretation of findings (e.g.,
Figure 2e). In practice, correspondence can be investigated using cell-type specific data on regulatory regions (see
Section 3.4.2 and
Table 5) and several other openly accessible online resources (
Table 6). BECon [
86] (
https://redgar598.shinyapps.io/BECon/) is based on paired blood and post-mortem brain tissue data from 16 individuals. The user can enter a CpG or gene name to visualize cross-tissue correlation across blood and three brain regions (BA10 (frontal), BA20 (temporal) and BA7 (parietal)). Another online resource with similar functionality is available via
https://epigenetics.essex.ac.uk/bloodbrain/, based on matched blood and four post-mortem brain tissues (cerebellum, entorhinal cortex, frontal cortex and superior temporal gyrus) in 74 individuals. These two resources are based on the Illumina 450k array. Methylation data based on bisulphite sequencing are available via MethBase [
87] (
http://smithlabresearch.org/software/methbase/) and can be imported via the Track hub option (see
Section 3.4.2) into the UCSC genome browser. This resource provides information on methylation levels at individual sites, allele-specific methylation and hypomethylated or hypermethylated regions. Furthermore, MethBase does not only allow for comparisons across cell types (frontal cortex, neural progenitor cells, embryonic stem cells and blood tissue cells in humans), but also across development (from 35 days to 64 years in the case of brain tissue data) and across species (including human, mouse, chimp, dog, zebrafish and plants).
Alternatively, it is possible to test for a tissue-specific enrichment of EWAS probe sets, an option which is currently implemented in eFORGE (
http://eforge.cs.ucl.ac.uk/). Relying on data from ENCODE and the Epigenomics Roadmap, eFORGE compares DNase I hypersensitivity site hotspot overlap between an EWAS input list and background probes in a cell-type specific manner.
An alternative technique to investigate cross-tissue correspondence was applied in Linnér et al. [
21] using data from the Epigenomic Roadmap Consortium (see
Section 3.4.2; although alternative resources such as PsychENCODE listed in
Table 5 could also be used). There, the authors calculated average cross-tissue methylation for a selected number of CpG sites linked to educational attainment and derived deviation from this average for a range of tissues (including brain tissue). These tissue-specific measures of deviation were then correlated with EWAS test statistics (z-scores). The authors argued that a lack of correlation between EWAS z-scores of educational attainment and tissue-specific derivation (especially in brain tissue, assumed to be the target tissue of interest) indicated an absence of brain-tissue specific effects and might be suggestive of confounding. Of note, this method is based on average methylation levels across tissue and not on correlations (i.e., methylation profiles might be correlated across tissues, but at different absolute methylation levels).
Finally, there is some evidence that the effects of mQTLs on methylation can be stable across tissues [
48], although large-scale investigations across a wide range of tissue types (including brain tissue) are still missing. With this in mind, investigating consistency of mQTL effects across tissues (using resources described in
Section 3.3.1) can be helpful to obtain some indirect evidence for or against cross-tissue concordance.
3.4.4. Tissue-Specific Gene and Protein Expression
It is generally assumed that DNA methylation influences gene expression. However, this issue is still extensively debated [
89] and the absence of a functional effect of methylation of gene expression does not preclude the possibility of a meaningful, causal mechanism. Still, it can be highly informative to investigate whether a gene linked to variation in DNA methylation at a site-of-interest also shows variation in its level of expression in the tissue-of-interest. The following section and
Table 7 provide an overview of online resources to assess gene expression profiles by tissue and across development.
The Human Protein Atlas (
https://www.proteinatlas.org/humanproteome) is an excellent resource to investigate in which tissues a gene-of-interest is expressed in absolute terms, and also whether the expression of such a gene is elevated in the target tissue relative to average expression levels in all tissues. Lists of whole groups of genes that are preferentially expressed in certain tissues (e.g., n = 1460 genes are listed to show elevated expression profiles in brain tissue relative to all other tissues) can be used to test for enrichment of brain-expressed genes in EWAS results.
The Genotype-Tissue Expression project (GTEx,
https://gtexportal.org/home/) provides similar options, listing information on tissue-specific gene expression, regulation and expression quantitative trait loci (eQTL) information. Importantly, the eQTL function allows users to investigate tissue-specific eQTL effects (for example of SNPs that have already been identified to be mQTLs).
To gain insight into gene expression profiles across development, the reader is encouraged to consult the EMBL-EBI expression atlas (
https://www.ebi.ac.uk/gxa/home), which displays data from a range of resources (including NIH Epigenomics Roadmap, ENCODE and GTEx).
Several resources are of particular relevance to brain tissue-specific gene expression. The Allen Brain Map portal (
http://portal.brain-map.org/) provides a range of useful data, including the Human Brain Atlas and the Developing Human Brain resources. The former is a unique multimodal atlas of the human brain, integrating highly detailed anatomic and genomic information. The user can search for a gene-of-interest and visualize its expression profile in different brain regions using high-resolution, MRI-based 3-D histology scans.
The BrainSpan Atlas of the Developing Human Brain (
http://www.brainspan.org) provides information on the human transcriptome (RNA sequencing and exon microarray data) across different brain regions and development. The BrainCloud application informs on genome-wide gene expression and their genetic control in the dorsolateral prefrontal cortex of normal subjects across the lifespan (
http://braincloud.jhmi.edu).
The PsychENCODE project combines data from several resources (including GTEx and BrainSpan) to characterize a large spectrum of genomic elements with the human brain, including gene expression as well as multi-QTL maps (for expression, chromatin, transcript expression and cell fraction), enhancers, splice variants and co-expression modules, often specific to cell type, brain region or developmental period. For a more detailed discussion on brain-based resources, see Keil et al [
90].
Finally, it is important to note that gene expression levels (either in absolute terms or relative to average levels across tissues) can be misinterpreted. For example,
DRD4 (coding for the dopamine D4 receptor) does not appear to be preferentially expressed in brain tissue, but it would be misleading to come to the conclusion that
DRD4 has no role in psychopathology, as numerous studies have demonstrated DRD4 functioning to be involved in emotion and complex behaviours such as novelty seeking [
94,
95,
96]. Furthermore, there is a renewed interest in dopamine D4 receptor-based pharmacological treatments for substance use and Parkinson’s disease [
97]. As highlighted throughout this review, molecular phenotypes including DNA methylation and gene expression vary over time and across tissues, meaning that any measure will be specific to the temporal context at which the sample was taken, thus limiting the inferences that can be made with respect to cause.


