Cloudy with a Chance of Insights: Context Dependent Gene Regulation and Implications for Evolutionary Studies


Abstract
1. Introduction
2. Gene Expression Divergence Affects Phenotypic Evolution
3. Gene Expression Divergence Reflects Divergent Gene Regulatory Mechanisms
4. Gene Expression and Gene Regulation are Highly Context Dependent
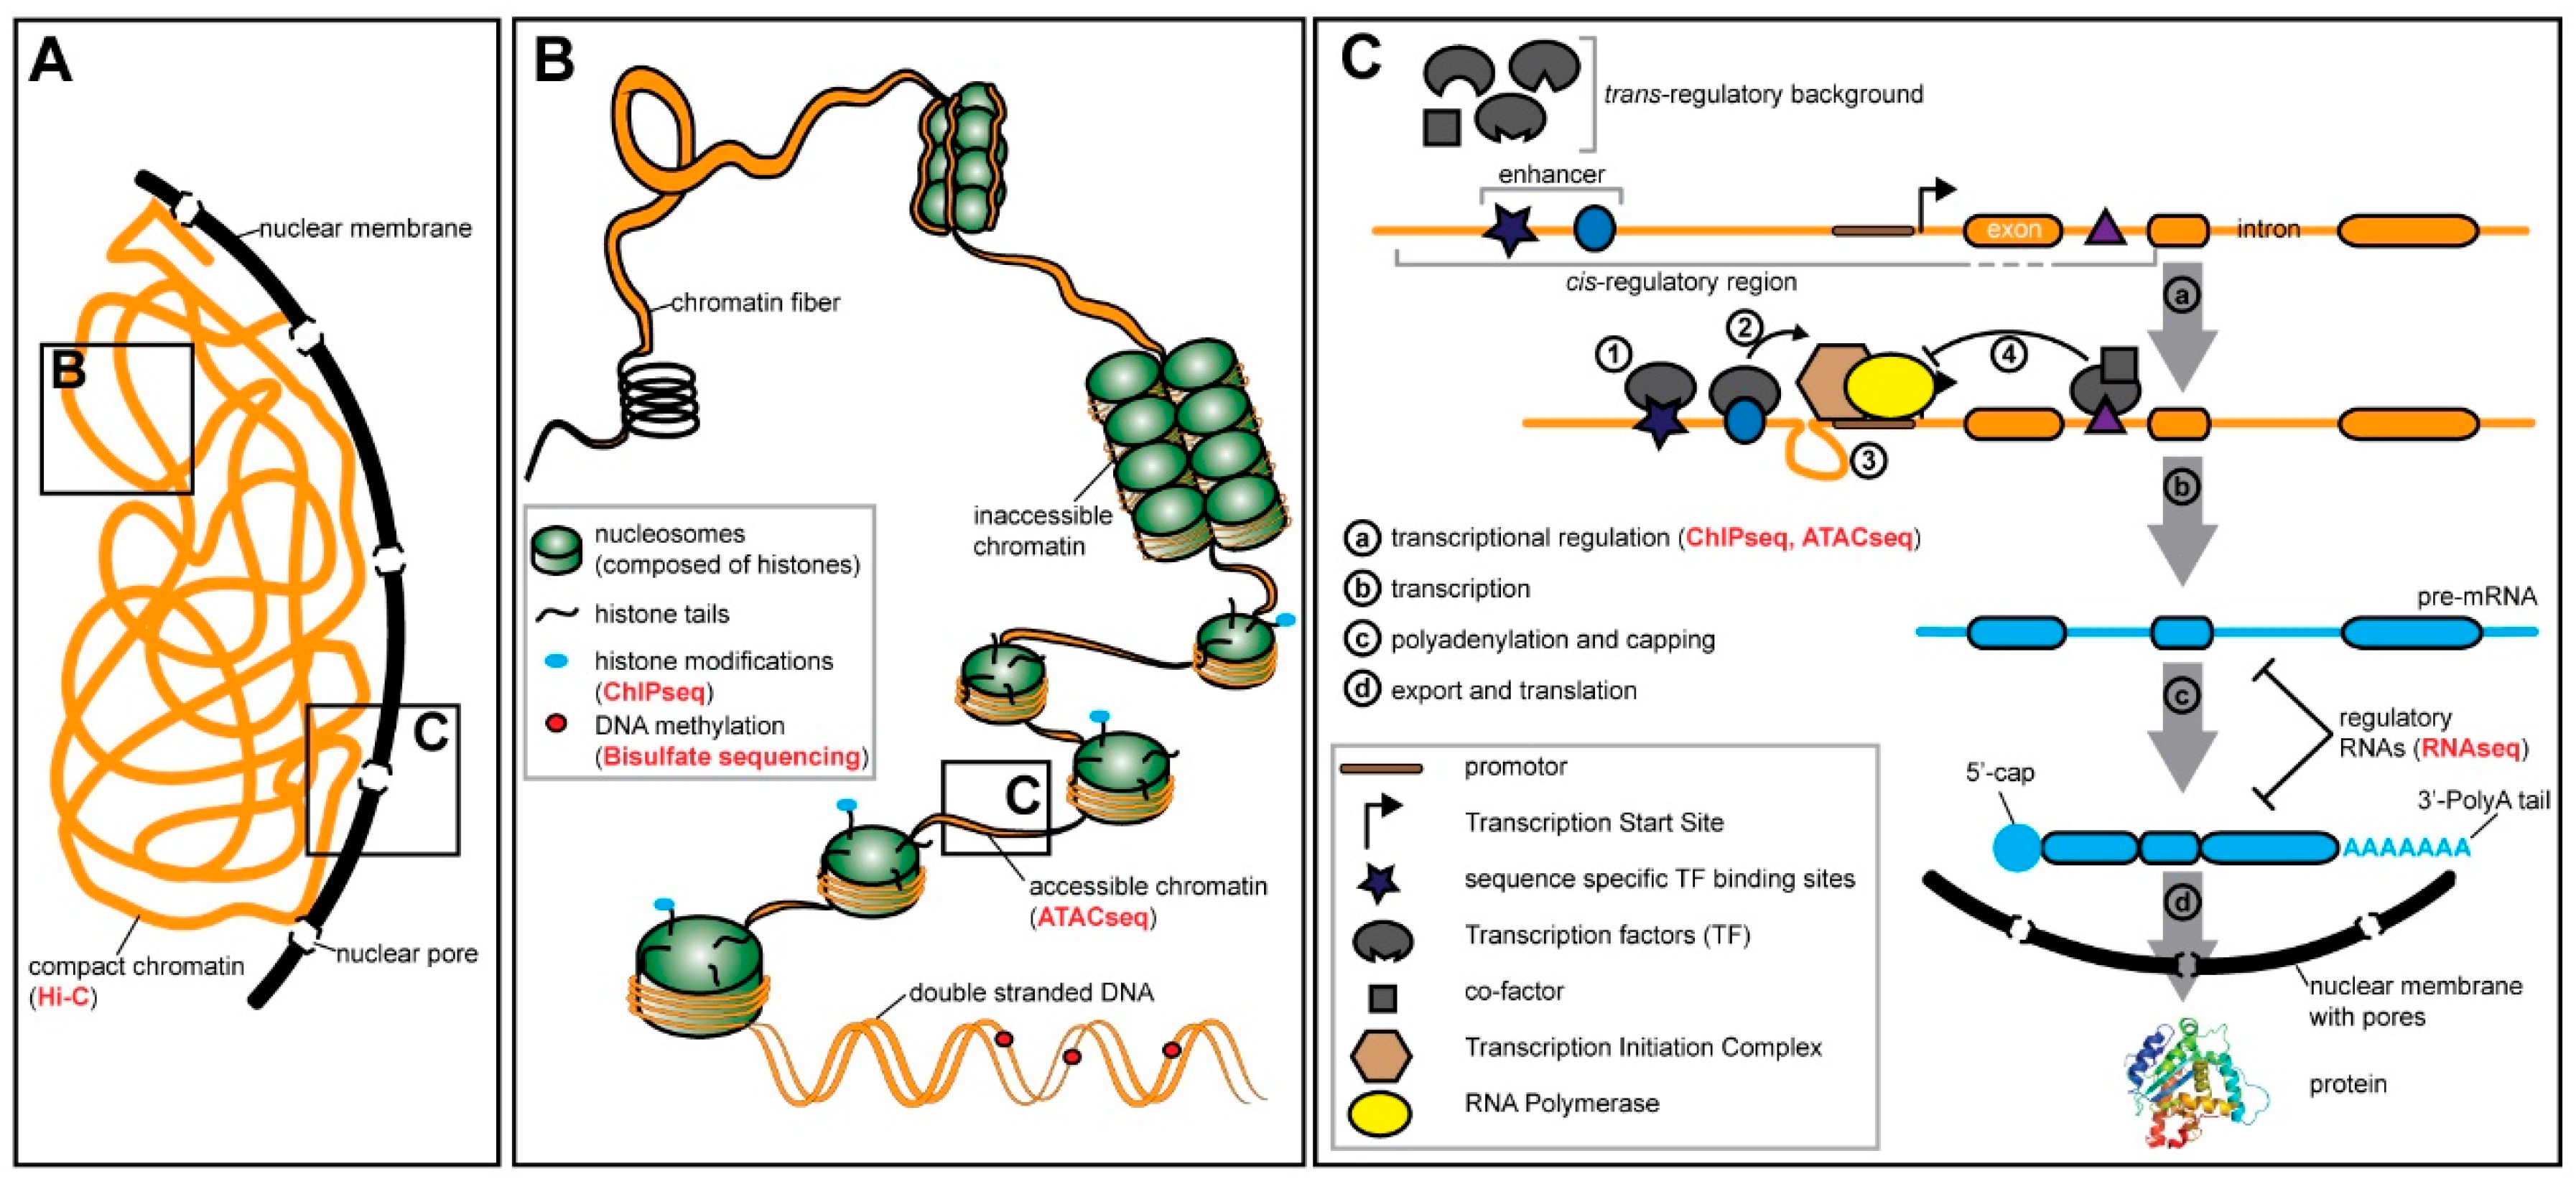
4.1. Pre-transcriptional Regulation—Chromatin States and Methylation
4.2. Transcriptional Regulation—Transcription Factors and Cis-Regulatory Elements
4.3. Post-transcriptional Regulation—RNA Modifications and Regulatory RNA Molecules
5. The Evolution of Gene Expression and Gene Regulation is Context Dependent
6. Context Dependency Should be Considered in Comparative Expression Studies
7. Outlook
8. Conclusions
Author Contributions
Funding
Acknowledgments
Conflicts of Interest
References
- Pearson, J.C.; Lemons, D.; McGinnis, W. Modulating Hox gene functions during animal body patterning. Nat. Rev. Genet. 2005, 6, 893–904. [Google Scholar] [CrossRef] [PubMed]
- Hatefi, Y. The mitochondrial electron transport and oxidative phosphorylation system. Annu. Rev. Biochem. 1985, 54, 1015–1069. [Google Scholar] [CrossRef] [PubMed]
- Saraste, M. Oxidative Phosphorylation at the fin de siècle. Science 1999, 283, 1488–1493. [Google Scholar] [CrossRef] [PubMed]
- Janeway, C.A.; Medzhitov, R. Innate immune recognition. Annu. Rev. Immunol. 2002, 20, 197–216. [Google Scholar] [CrossRef] [PubMed]
- Hancock, R.E.W.; Haney, E.F.; Gill, E.E. The immunology of host defence peptides: Beyond antimicrobial activity. Nat. Rev. Immunol. 2016, 16, 321–334. [Google Scholar] [CrossRef]
- Lumpkin, E.A.; Caterina, M.J. Mechanisms of sensory transduction in the skin. Nature 2007, 445, 858–865. [Google Scholar] [CrossRef] [PubMed]
- Yau, K.-W.; Hardie, R.C. Phototransduction motifs and variations. Cell 2009, 139, 246–264. [Google Scholar] [CrossRef]
- Avery, O.T. Studies on the chemical nature of the substance inducing transformation of pneumococcal types: Induction of transformation by a desoxyribonucleic acid fraction isolated from pneumococcus type III. J. Exp. Med. 1944, 79, 137–158. [Google Scholar] [CrossRef]
- Thoday, J.M. Location of Polygenes. Nat. Insight Biodivers. 1961, 191, 368–370. [Google Scholar] [CrossRef]
- Lander, E.S.; Botstein, D. Mapping mendelian factors underlying quantitative traits using RFLP linkage maps. Genetics 1989, 121, 185–199. [Google Scholar]
- Roff, D.A. A centennial celebration for quantitative genetics. Evol. Int. J. Org. Evol. 2007, 61, 1017–1032. [Google Scholar] [CrossRef] [PubMed]
- Mackay, T.F.C.; Richards, S.; Stone, E.a.; Barbadilla, A.; Ayroles, J.F.; Zhu, D.; Casillas, S.; Han, Y.; Magwire, M.M.; Cridland, J.M.; et al. The Drosophila melanogaster Genetic Reference Panel. Nature 2012, 482, 173–178. [Google Scholar] [CrossRef] [PubMed]
- Linnen, C.R.; Poh, Y.-P.; Peterson, B.K.; Barrett, R.D.H.; Larson, J.G.; Jensen, J.D.; Hoekstra, H.E. Adaptive Evolution of Multiple Traits Through Multiple Mutations at a Single Gene. Science 2013, 339, 1312–1316. [Google Scholar] [CrossRef] [PubMed]
- Hoekstra, H.E.; Hirschmann, R.J.; Bundey, R.A.; Insel, P.A.; Crossland, J.P. A single amino acid mutation contributes to adaptive beach mouse color pattern. Science 2006, 313, 101–104. [Google Scholar] [CrossRef] [PubMed]
- Lang, M.; Murat, S.; Clark, A.G.; Gouppil, G.; Blais, C.; Matzkin, L.M.; Guittard, E.; Yoshiyama-Yanagawa, T.; Kataoka, H.; Niwa, R.; et al. Mutations in the neverland Gene Turned Drosophila pachea into an Obligate Specialist Species. Science 2012, 337, 1658–1661. [Google Scholar] [CrossRef] [PubMed]
- Weinberger, S.; Topping, M.P.; Yan, J.; Claeys, A.; Geest, N.D.; Ozbay, D.; Hassan, T.; He, X.; Albert, J.T.; Hassan, B.A.; et al. Evolutionary changes in transcription factor coding sequence quantitatively alter sensory organ development and function. eLife 2017, 6. [Google Scholar] [CrossRef] [PubMed]
- Wang, Z.; Gerstein, M.; Snyder, M. RNA-Seq: A revolutionary tool for transcriptomics. Nat. Rev. Genet. 2009, 10, 57–63. [Google Scholar] [CrossRef] [PubMed]
- Oppenheim, S.J.; Baker, R.H.; Simon, S.; DeSalle, R. We can’t all be supermodels: The value of comparative transcriptomics to the study of non-model insects. Insect Mol. Biol. 2015, 24, 139–154. [Google Scholar] [CrossRef]
- Necsulea, A.; Kaessmann, H. Evolutionary dynamics of coding and non-coding transcriptomes. Nat. Rev. Genet. 2014, 15, 734–748. [Google Scholar] [CrossRef]
- Alvarez, M.; Schrey, A.W.; Richards, C.L. Ten years of transcriptomics in wild populations: What have we learned about their ecology and evolution? Mol. Ecol. 2015, 24, 710–725. [Google Scholar] [CrossRef]
- Todd, E.V.; Black, M.A.; Gemmell, N.J. The power and promise of RNA-seq in ecology and evolution. Mol. Ecol. 2016, 25, 1224–1241. [Google Scholar] [CrossRef] [PubMed]
- Arif, S.; Kittelmann, S.; McGregor, A.P. From shavenbaby to the naked valley: Trichome formation as a model for evolutionary developmental biology. Evol. Dev. 2015, 17, 120–126. [Google Scholar] [CrossRef] [PubMed]
- Preger-Ben Noon, E.; Sabarís, G.; Ortiz, D.M.; Sager, J.; Liebowitz, A.; Stern, D.L.; Frankel, N. Comprehensive Analysis of a cis-Regulatory Region Reveals Pleiotropy in Enhancer Function. Cell Rep. 2018, 22, 3021–3031. [Google Scholar] [CrossRef] [PubMed]
- Rebeiz, M.; POOL, J.E.; Kassner, V.A.; AQUADRO, C.F.; Carroll, S.B. Stepwise modification of a modular enhancer underlies adaptation in a Drosophila population. Science 2009, 326, 1663–1667. [Google Scholar] [CrossRef] [PubMed]
- Gompel, N.; Prud’homme, B.; Wittkopp, P.J.; Kassner, V.a.; Carroll, S.B. Chance caught on the wing: Cis-regulatory evolution and the origin of pigment patterns in Drosophila. Nature 2005, 433, 481–487. [Google Scholar] [CrossRef] [PubMed]
- Manceau, M.; Domingues, V.S.; Mallarino, R.; Hoekstra, H.E. The developmental role of Agouti in color pattern evolution. Science 2011, 331, 1062–1065. [Google Scholar] [CrossRef]
- Hoekstra, H.E. Genetics, development and evolution of adaptive pigmentation in vertebrates. Heredity 2006, 97, 222–234. [Google Scholar] [CrossRef]
- Kratochwil, C.F.; Liang, Y.; Gerwin, J.; Woltering, J.M.; Urban, S.; Henning, F.; Machado-Schiaffino, G.; Hulsey, C.D.; Meyer, A. Agouti-related peptide 2 facilitates convergent evolution of stripe patterns across cichlid fish radiations. Science 2018, 362, 457–460. [Google Scholar] [CrossRef]
- Hagen, J.F.D.; Mendes, C.C.; Tanaka, K.M.; Gaspar, P.; Kittelmann, M.; McGregor, A.P.; Nunes, M.D.S. tartan underlies the evolution of male genital morphology. bioRxiv 2018. [Google Scholar] [CrossRef]
- Nagy, O.; Nuez, I.; Savisaar, R.; Peluffo, A.E.; Yassin, A.; Lang, M.; Stern, D.L.; Matute, D.R.; David, J.R.; Courtier-Orgogozo, V. Correlated Evolution of Two Copulatory Organs via a Single cis-Regulatory Nucleotide Change. Curr. Biol. 2018, 28, 3450–3457. [Google Scholar] [CrossRef]
- Kocher, S.D.; Mallarino, R.; Rubin, B.E.R.; Yu, D.W.; Hoekstra, H.E.; Pierce, N.E. The genetic basis of a social polymorphism in halictid bees. Nat. Commun. 2018, 9, 4338. [Google Scholar] [CrossRef] [PubMed]
- Bendesky, A.; Kwon, Y.-M.; Lassance, J.-M.; Lewarch, C.L.; Yao, S.; Peterson, B.K.; He, M.X.; Dulac, C.; Hoekstra, H.E. The genetic basis of parental care evolution in monogamous mice. Nature 2017, 544, 434–439. [Google Scholar] [CrossRef] [PubMed]
- Huang, W.; Richards, S.; Carbone, M.A.; Zhu, D.; Anholt, R.R.H.; Ayroles, J.F.; Duncan, L.; Jordan, K.W.; Lawrence, F.; Magwire, M.M.; et al. Epistasis dominates the genetic architecture of Drosophila quantitative traits. Proc. Natl. Acad. Sci. USA 2012, 109, 15553–15559. [Google Scholar] [CrossRef] [PubMed]
- Zhou, S.; Luoma, S.E.; St Armour, G.E.; Thakkar, E.; Mackay, T.F.C.; Anholt, R.R.H. A Drosophila model for toxicogenomics: Genetic variation in susceptibility to heavy metal exposure. PLoS Genet. 2017, 13, e1006907. [Google Scholar] [CrossRef] [PubMed]
- Wang, J.; Ding, J.; Tan, B.; Robinson, K.M.; Michelson, I.H.; Johansson, A.; Nystedt, B.; Scofield, D.G.; Nilsson, O.; Jansson, S.; et al. A major locus controls local adaptation and adaptive life history variation in a perennial plant. Genome Biol. 2018, 19, 72. [Google Scholar] [CrossRef] [PubMed]
- Chang, J.; Zhou, Y.; Hu, X.; Lam, L.; Henry, C.; Green, E.M.; Kita, R.; Kobor, M.S.; Fraser, H.B. The molecular mechanism of a cis-regulatory adaptation in yeast. PLoS Genet. 2013, 9, e1003813. [Google Scholar] [CrossRef]
- Catalán, A.; Glaser-Schmitt, A.; Argyridou, E.; Duchen, P.; Parsch, J. An Indel Polymorphism in the MtnA 3’ Untranslated Region Is Associated with Gene Expression Variation and Local Adaptation in Drosophila melanogaster. PLoS Genet. 2016, 12, e1005987. [Google Scholar] [CrossRef]
- Hutter, S.; Saminadin-Peter, S.S.; Stephan, W.; Parsch, J. Gene expression variation in African and European populations of Drosophila melanogaster. Genome Biol. 2008, 9, R12. [Google Scholar] [CrossRef]
- Townsend, J.P.; Cavalieri, D.; Hartl, D.L. Population genetic variation in genome-wide gene expression. Mol. Biol. Evol. 2003, 20, 955–963. [Google Scholar] [CrossRef]
- Oleksiak, M.F.; Churchill, G.a.; Crawford, D.L. Variation in gene expression within and among natural populations. Nat. Genet. 2002, 32, 261–266. [Google Scholar] [CrossRef]
- Signor, S.A.; Nuzhdin, S.V. The Evolution of Gene Expression in cis and trans. Trends Genet. 2018, 34, 532–544. [Google Scholar] [CrossRef] [PubMed]
- Nourmohammad, A.; Rambeau, J.; Held, T.; Kovacova, V.; Berg, J.; Lässig, M. Adaptive Evolution of Gene Expression in Drosophila. Cell Rep. 2017, 20, 1385–1395. [Google Scholar] [CrossRef] [PubMed]
- Zhang, Y.; Sturgill, D.; Parisi, M.; Kumar, S.; Oliver, B. Constraint and turnover in sex-biased gene expression in the genus Drosophila. Nature 2007, 450, 233–237. [Google Scholar] [CrossRef] [PubMed]
- Guschanski, K.; Warnefors, M.; Kaessmann, H. The evolution of duplicate gene expression in mammalian organs. Genome Res. 2017, 27, 1461–1474. [Google Scholar] [CrossRef] [PubMed]
- Rockman, M.V.; Kruglyak, L. Genetics of global gene expression. Nat. Rev. Genet. 2006, 7, 862–872. [Google Scholar] [CrossRef]
- Gilad, Y.; Rifkin, S.a.; Pritchard, J.K. Revealing the architecture of gene regulation: The promise of eQTL studies. Trends Genet. 2008, 24, 408–415. [Google Scholar] [CrossRef]
- Jia, Z.; Xu, S. Mapping quantitative trait loci for expression abundance. Genetics 2007, 176, 611–623. [Google Scholar] [CrossRef][Green Version]
- Dixon, A.L.; Liang, L.; Moffatt, M.F.; Chen, W.; Heath, S.; Wong, K.C.C.; Taylor, J.; Burnett, E.; Gut, I.; Farrall, M.; et al. A genome-wide association study of global gene expression. Nat. Genet. 2007, 39, 1202–1207. [Google Scholar] [CrossRef]
- Knight, J.C. Allele-specific gene expression uncovered. Trends Genet. 2004, 20, 113–116. [Google Scholar] [CrossRef]
- Coolon, J.D.; Wittkopp, P.J. cis- and trans -Regulation in Drosophila Interspecific Hybrids. Polyploid Hybrid Genomics 2015, 305, 37–57. [Google Scholar] [CrossRef]
- Korir, P.K.; Seoighe, C. Inference of allele-specific expression from RNA-seq data. Methods Mol. Biol. 2014, 1112, 49–69. [Google Scholar] [CrossRef] [PubMed]
- Osada, N.; Miyagi, R.; Takahashi, A. Cis- and Trans-regulatory Effects on Gene Expression in a Natural Population of Drosophila melanogaster. Genetics 2017, 206, 2139–2148. [Google Scholar] [CrossRef] [PubMed]
- Graze, R.M.; McIntyre, L.M.; Main, B.J.; Wayne, M.L.; Nuzhdin, S.V. Regulatory divergence in Drosophila melanogaster and D. simulans, a genomewide analysis of allele-specific expression. Genetics 2009, 183, 547–561. [Google Scholar] [CrossRef] [PubMed]
- Graze, R.M.; Novelo, L.L.; Amin, V.; Fear, J.M.; Casella, G.; Nuzhdin, S.V.; McIntyre, L.M. Allelic imbalance in drosophila hybrid heads: Exons, isoforms, and evolution. Mol. Biol. Evol. 2012, 29, 1521–1532. [Google Scholar] [CrossRef] [PubMed]
- Fontanillas, P.; Landry, C.R.; Wittkopp, P.J.; Russ, C.; Gruber, J.D.; Nusbaum, C.; Hartl, D.L. Key considerations for measuring allelic expression on a genomic scale using high-throughput sequencing. Mol. Ecol. 2010, 19, 212–227. [Google Scholar] [CrossRef] [PubMed]
- McManus, C.J.; Coolon, J.D.; Duff, M.O.; Eipper-Mains, J.; Graveley, B.R.; Wittkopp, P.J. Regulatory divergence in Drosophila revealed by mRNA-seq. Genome Res. 2010, 20, 816–825. [Google Scholar] [CrossRef] [PubMed]
- Tirosh, I.; Reikhav, S.; Levy, A.a.; Barkai, N. A yeast hybrid provides insight into the evolution of gene expression regulation. Science 2009, 324, 659–662. [Google Scholar] [CrossRef]
- Zhang, X.; Borevitz, J.O. Global analysis of allele-specific expression in Arabidopsis thaliana. Genetics 2009, 182, 943–954. [Google Scholar] [CrossRef]
- Lemmon, Z.H.; Bukowski, R.; Sun, Q.; Doebley, J.F. The Role of cis Regulatory Evolution in Maize Domestication. PLoS Genet. 2014, 10. [Google Scholar] [CrossRef]
- Lawniczak, M.K.N.; Holloway, A.K.; Begun, D.J.; Jones, C.D. Genomic analysis of the relationship between gene expression variation and DNA polymorphism in Drosophila simulans. Genome Biol. 2008, 9, R125. [Google Scholar] [CrossRef]
- Lappalainen, T.; Sammeth, M.; Friedländer, M.R.; AC‘t Hoen, P.; Monlong, J.; Rivas, M.A.; Gonzàlez-Porta, M.; Kurbatova, N.; Griebel, T.; Ferreira, P.G.; et al. Transcriptome and genome sequencing uncovers functional variation in humans. Nature 2013, 501, 506–511. [Google Scholar] [CrossRef] [PubMed]
- Lübbe, A.; Schaffner, W. Tissue-specific gene expression. Trends Neurosci. 1985, 8, 100–104. [Google Scholar] [CrossRef]
- Lieberman-Aiden, E.; van Berkum, N.L.; Williams, L.; Imakaev, M.; Ragoczy, T.; Telling, A.; Amit, I.; Lajoie, B.R.; Sabo, P.J.; Dorschner, M.O.; et al. Comprehensive mapping of long-range interactions reveals folding principles of the human genome. Science 2009, 326, 289–293. [Google Scholar] [CrossRef] [PubMed]
- Sexton, T.; Yaffe, E.; Kenigsberg, E.; Bantignies, F.; Leblanc, B.; Hoichman, M.; Parrinello, H.; Tanay, A.; Cavalli, G. Three-dimensional folding and functional organization principles of the Drosophila genome. Cell 2012, 148, 458–472. [Google Scholar] [CrossRef] [PubMed]
- Nora, E.P.; Lajoie, B.R.; Schulz, E.G.; Giorgetti, L.; Okamoto, I.; Servant, N.; Piolot, T.; van Berkum, N.L.; Meisig, J.; Sedat, J.; et al. Spatial partitioning of the regulatory landscape of the X-inactivation centre. Nature 2012, 485, 381–385. [Google Scholar] [CrossRef]
- Dixon, J.R.; Selvaraj, S.; Yue, F.; Kim, A.; Li, Y.; Shen, Y.; Hu, M.; Liu, J.S.; Ren, B. Topological domains in mammalian genomes identified by analysis of chromatin interactions. Nature 2012, 485, 376–380. [Google Scholar] [CrossRef] [PubMed]
- Andrey, G.; Montavon, T.; Mascrez, B.; Gonzalez, F.; Noordermeer, D.; Leleu, M.; Trono, D.; Spitz, F.; Duboule, D. A switch between topological domains underlies HoxD genes collinearity in mouse limbs. Science 2013, 340, 1234167. [Google Scholar] [CrossRef] [PubMed]
- Javierre, B.M.; Burren, O.S.; Wilder, S.P.; Kreuzhuber, R.; Hill, S.M.; Sewitz, S.; Cairns, J.; Wingett, S.W.; Várnai, C.; Thiecke, M.J.; et al. Lineage-Specific Genome Architecture Links Enhancers and Non-coding Disease Variants to Target Gene Promoters. Cell 2016, 167, 1369–1384. [Google Scholar] [CrossRef]
- Buenrostro, J.D.; Giresi, P.G.; Zaba, L.C.; Chang, H.Y.; Greenleaf, W.J. Transposition of native chromatin for fast and sensitive epigenomic profiling of open chromatin, DNA-binding proteins and nucleosome position. Nat. Methods 2013, 10, 1213–1218. [Google Scholar] [CrossRef]
- Cusanovich, D.A.; Hill, A.J.; Aghamirzaie, D.; Daza, R.M.; Pliner, H.A.; Berletch, J.B.; Filippova, G.N.; Huang, X.; Christiansen, L.; DeWitt, W.S.; et al. A Single-Cell Atlas of In Vivo Mammalian Chromatin Accessibility. Cell 2018. [Google Scholar] [CrossRef]
- Cusanovich, D.A.; Reddington, J.P.; Garfield, D.A.; Daza, R.M.; Aghamirzaie, D.; Marco-Ferreres, R.; Pliner, H.A.; Christiansen, L.; Qiu, X.; Steemers, F.J.; et al. The cis-regulatory dynamics of embryonic development at single-cell resolution. Nature 2018, 555, 538–542. [Google Scholar] [CrossRef] [PubMed]
- Ho, J.W.K.; Jung, Y.L.; Liu, T.; Alver, B.H.; Lee, S.; Ikegami, K.; Sohn, K.-A.; Minoda, A.; Tolstorukov, M.Y.; Appert, A.; et al. Comparative analysis of metazoan chromatin organization. Nature 2014, 512, 449–452. [Google Scholar] [CrossRef] [PubMed]
- Liu, T.; Rechtsteiner, A.; Egelhofer, T.A.; Vielle, A.; Latorre, I.; Cheung, M.-S.; Ercan, S.; Ikegami, K.; Jensen, M.; Kolasinska-Zwierz, P.; et al. Broad chromosomal domains of histone modification patterns in C. elegans. Genome Res. 2011, 21, 227–236. [Google Scholar] [CrossRef] [PubMed]
- Lawrence, M.; Daujat, S.; Schneider, R. Lateral Thinking: How Histone Modifications Regulate Gene Expression. Trends Genet. 2016, 32, 42–56. [Google Scholar] [CrossRef] [PubMed]
- Gates, L.A.; Foulds, C.E.; O’Malley, B.W. Histone Marks in the ’Driver’s Seat’: Functional Roles in Steering the Transcription Cycle. Trends Biochem. Sci. 2017, 42, 977–989. [Google Scholar] [CrossRef] [PubMed]
- Bird, A.P.; Wolffe, A.P. Methylation-Induced Repression—Belts, Braces, and Chromatin. Cell 1999, 99, 451–454. [Google Scholar] [CrossRef]
- Jaenisch, R.; Bird, A. Epigenetic regulation of gene expression: How the genome integrates intrinsic and environmental signals. Nat. Genet. 2003, 33, 245–254. [Google Scholar] [CrossRef] [PubMed]
- Zhu, H.; Wang, G.; Qian, J. Transcription factors as readers and effectors of DNA methylation. Nat. Rev. Genet. 2016, 17, 551–565. [Google Scholar] [CrossRef]
- Mohn, F.; Schübeler, D. Genetics and epigenetics: Stability and plasticity during cellular differentiation. Trends Genet. 2009, 25, 129–136. [Google Scholar] [CrossRef]
- Engreitz, J.M.; Pandya-Jones, A.; McDonel, P.; Shishkin, A.; Sirokman, K.; Surka, C.; Kadri, S.; Xing, J.; Goren, A.; Lander, E.S.; et al. The Xist lncRNA exploits three-dimensional genome architecture to spread across the X chromosome. Science 2013, 341, 1237973. [Google Scholar] [CrossRef]
- Pandey, R.R.; Mondal, T.; Mohammad, F.; Enroth, S.; Redrup, L.; Komorowski, J.; Nagano, T.; Mancini-Dinardo, D.; Kanduri, C. Kcnq1ot1 antisense noncoding RNA mediates lineage-specific transcriptional silencing through chromatin-level regulation. Mol. Cell 2008, 32, 232–246. [Google Scholar] [CrossRef] [PubMed]
- Wang, K.C.; Yang, Y.W.; Liu, B.; Sanyal, A.; Corces-Zimmerman, R.; Chen, Y.; Lajoie, B.R.; Protacio, A.; Flynn, R.A.; Gupta, R.A.; et al. A long noncoding RNA maintains active chromatin to coordinate homeotic gene expression. Nature 2011, 472, 120–124. [Google Scholar] [CrossRef] [PubMed]
- Li, W.; Notani, D.; Ma, Q.; Tanasa, B.; Nunez, E.; Chen, A.Y.; Merkurjev, D.; Zhang, J.; Ohgi, K.; Song, X.; et al. Functional roles of enhancer RNAs for oestrogen-dependent transcriptional activation. Nature 2013, 498, 516–520. [Google Scholar] [CrossRef] [PubMed]
- Xiao, M.; Li, J.; Li, W.; Wang, Y.; Wu, F.; Xi, Y.; Zhang, L.; Ding, C.; Luo, H.; Li, Y.; et al. MicroRNAs activate gene transcription epigenetically as an enhancer trigger. RNA Biol. 2017, 14, 1326–1334. [Google Scholar] [CrossRef] [PubMed]
- Berezikov, E.; Robine, N.; Samsonova, A.; Westholm, J.O.; Naqvi, A.; Hung, J.-H.; Okamura, K.; Dai, Q.; Bortolamiol-Becet, D.; Martin, R.; et al. Deep annotation of Drosophila melanogaster microRNAs yields insights into their processing, modification, and emergence. Genome Res. 2011, 21, 203–215. [Google Scholar] [CrossRef] [PubMed]
- Mohammed, J.; Flynt, A.S.; Panzarino, A.M.; Mondal, M.M.H.; DeCruz, M.; Siepel, A.; Lai, E.C. Deep experimental profiling of microRNA diversity, deployment, and evolution across the Drosophila genus. Genome Res. 2018, 28, 52–65. [Google Scholar] [CrossRef] [PubMed]
- Ludwig, N.; Leidinger, P.; Becker, K.; Backes, C.; Fehlmann, T.; Pallasch, C.; Rheinheimer, S.; Meder, B.; Stähler, C.; Meese, E.; et al. Distribution of miRNA expression across human tissues. Nucleic Acids Res. 2016, 44, 3865–3877. [Google Scholar] [CrossRef]
- Spitz, F.; Furlong, E.E.M. Transcription factors: From enhancer binding to developmental control. Nat. Rev. Genet. 2012, 13, 613–626. [Google Scholar] [CrossRef]
- Lambert, S.A.; Jolma, A.; Campitelli, L.F.; Das, P.K.; Yin, Y.; Albu, M.; Chen, X.; Taipale, J.; Hughes, T.R.; Weirauch, M.T. The Human Transcription Factors. Cell 2018, 172, 650–665. [Google Scholar] [CrossRef]
- Homem, C.C.F.; Knoblich, J.A. Drosophila neuroblasts: A model for stem cell biology. Development 2012, 139, 4297–4310. [Google Scholar] [CrossRef]
- Karcavich, R.E. Generating neuronal diversity in the Drosophila central nervous system: A view from the ganglion mother cells. Dev. Dyn. 2005, 232, 609–616. [Google Scholar] [CrossRef] [PubMed]
- Technau, G.M.; Berger, C.; Urbach, R. Generation of cell diversity and segmental pattern in the embryonic central nervous system of Drosophila. Dev. Dyn. 2006, 235, 861–869. [Google Scholar] [CrossRef] [PubMed]
- Nogales, E.; Louder, R.K.; He, Y. Structural Insights into the Eukaryotic Transcription Initiation Machinery. Annu. Rev. Biophys. 2017, 46, 59–83. [Google Scholar] [CrossRef] [PubMed]
- Engel, C.; Neyer, S.; Cramer, P. Distinct Mechanisms of Transcription Initiation by RNA Polymerases I and II. Annu. Rev. Biophys. 2018, 47, 425–446. [Google Scholar] [CrossRef] [PubMed]
- Levine, M.; Tjian, R. Transcription regulation and animal diversity. Nature 2003, 424, 147–151. [Google Scholar] [CrossRef] [PubMed]
- Banerji, J.; Rusconi, S.; Schaffner, W. Expression of a beta-globin gene is enhanced by remote SV40 DNA sequences. Cell 1981, 27, 299–308. [Google Scholar] [CrossRef]
- Kirchhamer, C.V.; Yuh, C.H.; Davidson, E.H. Modular cis-regulatory organization of developmentally expressed genes: Two genes transcribed territorially in the sea urchin embryo, and additional examples. Proc. Natl. Acad. Sci. USA 1996, 93, 9322–9328. [Google Scholar] [CrossRef]
- Arnone, M.I.; Davidson, E.H. The hardwiring of development: Organization and function of genomic regulatory systems. Development 1997, 124, 1851–1864. [Google Scholar]
- Small, S.; Blair, A.; Levine, M. Regulation of even-skipped stripe 2 in the Drosophila embryo. EMBO J. 1992, 11, 4047–4057. [Google Scholar] [CrossRef]
- Goto, T.; Macdonald, P.; Maniatis, T. Early and late periodic patterns of even skipped expression are controlled by distinct regulatory elements that respond to different spatial cues. Cell 1989, 57, 413–422. [Google Scholar] [CrossRef]
- Haenlin, M.; Cubadda, Y.; Blondeau, F.; Heitzler, P.; Lutz, Y.; Simpson, P.; Ramain, P. Transcriptional activity of Pannier is regulated negatively by heterodimerization of the GATA DNA-binding domain with a cofactor encoded by the u-shaped gene of Drosophila. Genes Dev. 1997, 11, 3096–3108. [Google Scholar] [CrossRef] [PubMed]
- Fromental-Ramain, C.; Taquet, N.; Ramain, P. Transcriptional interactions between the pannier isoforms and the cofactor U-shaped during neural development in Drosophila. Mech. Dev. 2010, 127, 442–457. [Google Scholar] [CrossRef] [PubMed]
- Fromental-Ramain, C.; Vanolst, L.; Delaporte, C.; Ramain, P. pannier encodes two structurally related isoforms that are differentially expressed during Drosophila development and display distinct functions during thorax patterning. Mech. Dev. 2008, 125, 43–57. [Google Scholar] [CrossRef] [PubMed]
- Meireles-Filho, A.C.a.; Bardet, A.F.; Yáñez-Cuna, J.O.; Stampfel, G.; Stark, A. cis-regulatory requirements for tissue-specific programs of the circadian clock. Curr. Biol. 2014, 24, 1–10. [Google Scholar] [CrossRef] [PubMed]
- Elkon, R.; Ugalde, A.P.; Agami, R. Alternative cleavage and polyadenylation: Extent, regulation and function. Nat. Rev. Genet. 2013, 14, 496–506. [Google Scholar] [CrossRef] [PubMed]
- Mayr, C. Evolution and Biological Roles of Alternative 3’UTRs. Trends Cell Biol. 2016, 26, 227–237. [Google Scholar] [CrossRef]
- Topisirovic, I.; Svitkin, Y.V.; Sonenberg, N.; Shatkin, A.J. Cap and cap-binding proteins in the control of gene expression. Wiley Interdiscip. Rev. RNA 2011, 2, 277–298. [Google Scholar] [CrossRef]
- Matera, A.G.; Wang, Z. A day in the life of the spliceosome. Nat. Rev. Mol. Cell Biol. 2014, 15, 108–121. [Google Scholar] [CrossRef]
- Grosso, A.R.; Gomes, A.Q.; Barbosa-Morais, N.L.; Caldeira, S.; Thorne, N.P.; Grech, G.; von Lindern, M.; Carmo-Fonseca, M. Tissue-specific splicing factor gene expression signatures. Nucleic Acids Res. 2008, 36, 4823–4832. [Google Scholar] [CrossRef]
- Bartel, D.P. MicroRNAs: Genomics, Biogenesis, Mechanism, and Function. Cell 2004, 116, 281–297. [Google Scholar] [CrossRef]
- Fatica, A.; Bozzoni, I. Long non-coding RNAs: New players in cell differentiation and development. Nat. Rev. Genet. 2014, 15, 7–21. [Google Scholar] [CrossRef] [PubMed]
- Gong, C.; Maquat, L.E. lncRNAs transactivate STAU1-mediated mRNA decay by duplexing with 3’ UTRs via Alu elements. Nature 2011, 470, 284–288. [Google Scholar] [CrossRef] [PubMed]
- Kretz, M.; Siprashvili, Z.; Chu, C.; Webster, D.E.; Zehnder, A.; Qu, K.; Lee, C.S.; Flockhart, R.J.; Groff, A.F.; Chow, J.; et al. Control of somatic tissue differentiation by the long non-coding RNA TINCR. Nature 2013, 493, 231–235. [Google Scholar] [CrossRef] [PubMed]
- Poliseno, L.; Salmena, L.; Zhang, J.; Carver, B.; Haveman, W.J.; Pandolfi, P.P. A coding-independent function of gene and pseudogene mRNAs regulates tumour biology. Nature 2010, 465, 1033–1038. [Google Scholar] [CrossRef]
- Alvarez-Garcia, I.; Miska, E.A. MicroRNA functions in animal development and human disease. Development 2005, 132, 4653–4662. [Google Scholar] [CrossRef] [PubMed]
- Agirre, X.; Meydan, C.; Jiang, Y.; Garate, L.; Doane, A.S.; Li, Z.; Verma, A.; Paiva, B.; Martín-Subero, J.I.; Elemento, O.; et al. Long non-coding RNAs discriminate the stages and gene regulatory states of human humoral immune response. Nat. Commun. 2019, 10, 821. [Google Scholar] [CrossRef]
- Schor, I.E.; Bussotti, G.; Maleš, M.; Forneris, M.; Viales, R.R.; Enright, A.J.; Furlong, E.E.M. Non-coding RNA Expression, Function, and Variation during Drosophila Embryogenesis. Curr. Biol. 2018, 28, 3547–3561. [Google Scholar] [CrossRef]
- Mercer, T.R.; Mattick, J.S. Structure and function of long noncoding RNAs in epigenetic regulation. Nat. Struct. Mol. Biol. 2013, 20, 300–307. [Google Scholar] [CrossRef]
- O’Neil, D.; Glowatz, H.; Schlumpberge, M. Ribosomal RNA depletion for efficient use of RNA-seq capacity. Curr. Protoc. Mol. Biol. 2013, 1–8. [Google Scholar] [CrossRef]
- Coenen-Stass, A.M.L.; Magen, I.; Brooks, T.; Ben-Dov, I.Z.; Greensmith, L.; Hornstein, E.; Fratta, P. Evaluation of methodologies for microRNA biomarker detection by next generation sequencing. RNA Biol. 2018, 15, 1133–1145. [Google Scholar] [CrossRef]
- Mortazavi, A.; Williams, B.a.; McCue, K.; Schaeffer, L.; Wold, B. Mapping and quantifying mammalian transcriptomes by RNA-Seq. Nat. Methods 2008, 5, 621–628. [Google Scholar] [CrossRef] [PubMed]
- Pritchard, C.C.; Cheng, H.H.; Tewari, M. MicroRNA profiling: Approaches and considerations. Nat. Rev. Genet. 2012, 13, 358. [Google Scholar] [CrossRef] [PubMed]
- Akhade, V.S.; Pal, D.; Kanduri, C. Long Noncoding RNA: Genome Organization and Mechanism of Action. Adv. Exp. Med. Biol. 2017, 1008, 47–74. [Google Scholar] [CrossRef]
- Tang, F.; Barbacioru, C.; Wang, Y.; Nordman, E.; Lee, C.; Xu, N.; Wang, X.; Bodeau, J.; Tuch, B.B.; Siddiqui, A.; et al. mRNA-Seq whole-transcriptome analysis of a single cell. Nat. Meth. 2009, 6, 377–382. [Google Scholar] [CrossRef] [PubMed]
- Zheng, G.X.Y.; Terry, J.M.; Belgrader, P.; Ryvkin, P.; Bent, Z.W.; Wilson, R.; Ziraldo, S.B.; Wheeler, T.D.; McDermott, G.P.; Zhu, J.; et al. Massively parallel digital transcriptional profiling of single cells. Nat. Commun. 2017, 8, 14049. [Google Scholar] [CrossRef] [PubMed]
- Svensson, V.; Vento-Tormo, R.; Teichmann, S.A. Exponential scaling of single-cell RNA-seq in the past decade. Nat. Protoc. 2018, 13, 599–604. [Google Scholar] [CrossRef] [PubMed]
- Buenrostro, J.D.; Wu, B.; Chang, H.Y.; Greenleaf, W.J. ATAC-seq: A method for assaying chromatin accessibility genome-wide. Curr. Protoc. Mol. Biol. 2015, 2015, 21–29. [Google Scholar] [CrossRef]
- Corces, M.R.; Trevino, A.E.; Hamilton, E.G.; Greenside, P.G.; Sinnott-Armstrong, N.A.; Vesuna, S.; Satpathy, A.T.; Rubin, A.J.; Montine, K.S.; Wu, B.; et al. An improved ATAC-seq protocol reduces background and enables interrogation of frozen tissues. Nat. Methods 2017, 14, 959–962. [Google Scholar] [CrossRef]
- Daugherty, A.C.; Yeo, R.W.; Buenrostro, J.D.; Greenleaf, W.J.; Kundaje, A.; Brunet, A. Chromatin accessibility dynamics reveal novel functional enhancers in C. elegans. Genome Res. 2017, 27, 2096–2107. [Google Scholar] [CrossRef]
- Cusanovich, D.A.; Daza, R.; Adey, A.; Pliner, H.A.; Christiansen, L.; Gunderson, K.L.; Steemers, F.J.; Trapnell, C.; Shendure, J. Multiplex single cell profiling of chromatin accessibility by combinatorial cellular indexing. Science 2015, 348, 910–914. [Google Scholar] [CrossRef]
- Buenrostro, J.D.; Wu, B.; Litzenburger, U.M.; Ruff, D.; Gonzales, M.L.; Snyder, M.P.; Chang, H.Y.; Greenleaf, W.J. Single-cell chromatin accessibility reveals principles of regulatory variation. Nat. Insight Biodivers. 2015, 523, 486–490. [Google Scholar] [CrossRef] [PubMed]
- Johnson, D.S.; Mortazavi, A.; Myers, R.M.; Wold, B. Genome-wide mapping of in vivo protein-DNA interactions. Science 2007, 316, 1497–1502. [Google Scholar] [CrossRef] [PubMed]
- Robertson, G.; Hirst, M.; Bainbridge, M.; Bilenky, M.; Zhao, Y.; Zeng, T.; Euskirchen, G.; Bernier, B.; Varhol, R.; Delaney, A.; et al. Genome-wide profiles of STAT1 DNA association using chromatin immunoprecipitation and massively parallel sequencing. Nat. Methods 2007, 4, 651–657. [Google Scholar] [CrossRef] [PubMed]
- Schmidt, D.; Wilson, M.D.; Ballester, B.; Schwalie, P.C.; Brown, G.D.; Marshall, A.; Kutter, C.; Watt, S.; Martinez-Jimenez, C.P.; Mackay, S.; et al. Five-vertebrate ChlP-seq reveals the evolutionary dynamics of transcription factor binding. Science 2010, 328, 1036–1040. [Google Scholar] [CrossRef] [PubMed]
- Rotem, A.; Ram, O.; Shoresh, N.; Sperling, R.A.; Goren, A.; Weitz, D.A.; Bernstein, B.E. Single-cell ChIP-seq reveals cell subpopulations defined by chromatin state. Nat. Biotechnol. 2015, 33, 1165–1172. [Google Scholar] [CrossRef] [PubMed]
- Belton, J.-M.; McCord, R.P.; Gibcus, J.H.; Naumova, N.; Zhan, Y.; Dekker, J. Hi-C: A comprehensive technique to capture the conformation of genomes. Methods 2012, 58, 268–276. [Google Scholar] [CrossRef]
- Sati, S.; Cavalli, G. Chromosome conformation capture technologies and their impact in understanding genome function. Chromosoma 2017, 126, 33–44. [Google Scholar] [CrossRef]
- Ma, W.; Ay, F.; Lee, C.; Gulsoy, G.; Deng, X.; Cook, S.; Hesson, J.; Cavanaugh, C.; Ware, C.B.; Krumm, A.; et al. Fine-scale chromatin interaction maps reveal the cis-regulatory landscape of human lincRNA genes. Nat. Methods 2015, 12, 71–78. [Google Scholar] [CrossRef]
- Hsieh, T.-H.S.; Weiner, A.; Lajoie, B.; Dekker, J.; Friedman, N.; Rando, O.J. Mapping Nucleosome Resolution Chromosome Folding in Yeast by Micro-C. Cell 2015, 162, 108–119. [Google Scholar] [CrossRef]
- Fishman, V.; Battulin, N.; Nuriddinov, M.; Maslova, A.; Zlotina, A.; Strunov, A.; Chervyakova, D.; Korablev, A.; Serov, O.; Krasikova, A. 3D organization of chicken genome demonstrates evolutionary conservation of topologically associated domains and highlights unique architecture of erythrocytes’ chromatin. Nucleic Acids Res. 2019, 47, 648–665. [Google Scholar] [CrossRef]
- Nagano, T.; Lubling, Y.; Stevens, T.J.; Schoenfelder, S.; Yaffe, E.; Dean, W.; Laue, E.D.; Tanay, A.; Fraser, P. Single-cell Hi-C reveals cell-to-cell variability in chromosome structure. Nat. Insight Biodivers. 2013, 502, 59–64. [Google Scholar] [CrossRef]
- Frommer, M.; McDonald, L.E.; Millar, D.S.; Collis, C.M.; Watt, F.; Grigg, G.W.; Molloy, P.L.; Paul, C.L. A genomic sequencing protocol that yields a positive display of 5-methylcytosine residues in individual DNA strands. Proc. Natl. Acad. Sci. USA 1992, 89, 1827–1831. [Google Scholar] [CrossRef]
- Cokus, S.J.; Feng, S.; Zhang, X.; Chen, Z.; Merriman, B.; Haudenschild, C.D.; Pradhan, S.; Nelson, S.F.; Pellegrini, M.; Jacobsen, S.E. Shotgun bisulphite sequencing of the Arabidopsis genome reveals DNA methylation patterning. Nat. Insight Biodivers. 2008, 452, 215–219. [Google Scholar] [CrossRef]
- Lea, A.J.; Vilgalys, T.P.; Durst, P.A.P.; Tung, J. Maximizing ecological and evolutionary insight in bisulfite sequencing data sets HHS Public Access. Nat. Ecol. Evol. 2017, 1, 1074–1083. [Google Scholar] [CrossRef]
- Yong, W.-S.; Hsu, F.-M.; Chen, P.-Y. Profiling genome-wide DNA methylation. Epigenet. Chromatin 2016, 9, 26. [Google Scholar] [CrossRef]
- Verhoeven, K.J.F.; VonHoldt, B.M.; Sork, V.L. Epigenetics in ecology and evolution: What we know and what we need to know. Mol. Ecol. 2016, 25, 1631–1638. [Google Scholar] [CrossRef]
- Guo, H.; Zhu, P.; Wu, X.; Li, X.; Wen, L.; Tang, F. Single-cell methylome landscapes of mouse embryonic stem cells and early embryos analyzed using reduced representation bisulfite sequencing. Genome Res. 2013, 23, 2126–2135. [Google Scholar] [CrossRef] [PubMed]
- Smallwood, S.A.; Lee, H.J.; Angermueller, C.; Krueger, F.; Saadeh, H.; Peat, J.; Andrews, S.R.; Stegle, O.; Reik, W.; Kelsey, G. Single-cell genome-wide bisulfite sequencing for assessing epigenetic heterogeneity. Nat. Methods 2014, 11, 817–820. [Google Scholar] [CrossRef] [PubMed]
- Brawand, D.; Soumillon, M.; Necsulea, A.; Julien, P.; Csárdi, G.; Harrigan, P.; Weier, M.; Liechti, A.; Aximu-Petri, A.; Kircher, M.; et al. The evolution of gene expression levels in mammalian organs. Nature 2011, 478, 343–348. [Google Scholar] [CrossRef] [PubMed]
- Irie, N.; Kuratani, S. Comparative transcriptome analysis reveals vertebrate phylotypic period during organogenesis. Nat. Commun. 2011, 2, 248. [Google Scholar] [CrossRef]
- Domazet-Lošo, T.; Tautz, D. A phylogenetically based transcriptome age index mirrors ontogenetic divergence patterns. Nature 2010, 468, 815–818. [Google Scholar] [CrossRef] [PubMed]
- Liscovitch, N.; Chechik, G. Specialization of gene expression during mouse brain development. PLoS Comput. Biol. 2013, 9, e1003185. [Google Scholar] [CrossRef] [PubMed]
- Spies, N.; Smith, C.L.; Rodriguez, J.M.; Baker, J.C.; Batzoglou, S.; Sidow, A. Constraint and divergence of global gene expression in the mammalian embryo. eLife 2015, 4, e05538. [Google Scholar] [CrossRef] [PubMed]
- Yang, X.; Schadt, E.E.; Wang, S.; Wang, H.; Arnold, A.P.; Ingram-Drake, L.; Drake, T.A.; Lusis, A.J. Tissue-specific expression and regulation of sexually dimorphic genes in mice. Genome Res. 2006, 16, 995–1004. [Google Scholar] [CrossRef] [PubMed]
- Wittkopp, P.J.; Haerum, B.K.; Clark, A.G. Regulatory changes underlying expression differences within and between Drosophila species. Nat. Genet. 2008, 40, 346–350. [Google Scholar] [CrossRef]
- Glaser-Schmitt, A.; Parsch, J. Functional characterization of adaptive variation within a cis-regulatory element influencing Drosophila melanogaster growth. PLoS Biol. 2018, 16, e2004538. [Google Scholar] [CrossRef] [PubMed]
- Frazer, K.A.; Ballinger, D.G.; Cox, D.R.; Hinds, D.A.; Stuve, L.L.; Gibbs, R.A.; Belmont, J.W.; Boudreau, A.; Hardenbol, P.; Leal, S.M.; et al. A second generation human haplotype map of over 3.1 million SNPs. Nature 2007, 449, 851–861. [Google Scholar] [CrossRef]
- Grubert, F.; Zaugg, J.B.; Kasowski, M.; Ursu, O.; Spacek, D.V.; Martin, A.R.; Greenside, P.; Srivas, R.; Phanstiel, D.H.; Pekowska, A.; et al. Genetic Control of Chromatin States in Humans Involves Local and Distal Chromosomal Interactions. Cell 2015, 162, 1051–1065. [Google Scholar] [CrossRef]
- Degner, J.F.; Pai, A.a.; Pique-Regi, R.; Veyrieras, J.-B.; Gaffney, D.J.; Pickrell, J.K.; de Leon, S.; Michelini, K.; Lewellen, N.; Crawford, G.E.; et al. DNase I sensitivity QTLs are a major determinant of human expression variation. Nature 2012, 482, 390–394. [Google Scholar] [CrossRef]
- McVicker, G.; van de Geijn, B.; Degner, J.F.; Cain, C.E.; Banovich, N.E.; Raj, A.; Lewellen, N.; Myrthil, M.; Gilad, Y.; Pritchard, J.K. Identification of genetic variants that affect histone modifications in human cells. Science 2013, 342, 747–749. [Google Scholar] [CrossRef]
- Del Rosario, R.C.-H.; Poschmann, J.; Rouam, S.L.; Png, E.; Khor, C.C.; Hibberd, M.L.; Prabhakar, S. Sensitive detection of chromatin-altering polymorphisms reveals autoimmune disease mechanisms. Nat. Methods 2015, 12, 458–464. [Google Scholar] [CrossRef] [PubMed]
- Li, Y.I.; van de Geijn, B.; Raj, A.; Knowles, D.A.; Petti, A.A.; Golan, D.; Gilad, Y.; Pritchard, J.K. RNA splicing is a primary link between genetic variation and disease. Science 2016, 352, 600–604. [Google Scholar] [CrossRef] [PubMed]
- Monlong, J.; Calvo, M.; Ferreira, P.G.; Guigó, R. Identification of genetic variants associated with alternative splicing using sQTLseekeR. Nat. Commun. 2014, 5, 4698. [Google Scholar] [CrossRef] [PubMed]
- Han, J.; Xiong, J.; Wang, D.; Fu, X.-D. Pre-mRNA splicing: Where and when in the nucleus. Trends Cell Biol. 2011, 21, 336–343. [Google Scholar] [CrossRef] [PubMed]
- Pierce, B.L.; Tong, L.; Argos, M.; Demanelis, K.; Jasmine, F.; Rakibuz-Zaman, M.; Sarwar, G.; Islam, M.T.; Shahriar, H.; Islam, T.; et al. Co-occurring expression and methylation QTLs allow detection of common causal variants and shared biological mechanisms. Nat. Commun. 2018, 9, 804. [Google Scholar] [CrossRef] [PubMed]
- Arnold, C.D.; Gerlach, D.; Spies, D.; Matts, J.A.; Sytnikova, Y.A.; Pagani, M.; Lau, N.C.; Stark, A. Quantitative genome-wide enhancer activity maps for five Drosophila species show functional enhancer conservation and turnover during cis-regulatory evolution. Nat. Genet. 2014, 46, 685–692. [Google Scholar] [CrossRef] [PubMed]
- Weber, M.; Hellmann, I.; Stadler, M.B.; Ramos, L.; Pääbo, S.; Rebhan, M.; Schübeler, D. Distribution, silencing potential and evolutionary impact of promoter DNA methylation in the human genome. Nat. Genet. 2007, 39, 457–466. [Google Scholar] [CrossRef] [PubMed]
- Luscombe, N.M.; Babu, M.M.; Yu, H.; Snyder, M.; Teichmann, S.A.; Gerstein, M. Genomic analysis of regulatory network dynamics reveals large topological changes. Nature 2004, 431, 308–312. [Google Scholar] [CrossRef]
- Wittkopp, P.J. Genomic sources of regulatory variation in cis and in trans. Cell. Mol. Life Sci. 2005, 62, 1779–1783. [Google Scholar] [CrossRef]
- Yang, B.; Wittkopp, P.J. Structure of the Transcriptional Regulatory Network Correlates with Regulatory Divergence in Drosophila. Mol. Biol. Evol. 2017, 34, 1352–1362. [Google Scholar] [CrossRef]
- Kittelmann, S.; Buffry, A.D.; Franke, F.A.; Almudi, I.; Yoth, M.; Sabaris, G.; Couso, J.P.; Nunes, M.D.S.; Frankel, N.; Gómez-Skarmeta, J.L.; et al. Gene regulatory network architecture in different developmental contexts influences the genetic basis of morphological evolution. PLoS Genet. 2018, 14, e1007375. [Google Scholar] [CrossRef] [PubMed]
- McGregor, A.P.; Orgogozo, V.; Delon, I.; Zanet, J.; Srinivasan, D.G.; Payre, F.; Stern, D.L. Morphological evolution through multiple cis-regulatory mutations at a single gene. Nature 2007, 448, 587–590. [Google Scholar] [CrossRef] [PubMed]
- Arif, S.; Murat, S.; Almudi, I.; Nunes, M.D.S.; Bortolamiol-Becet, D.; McGregor, N.S.; Currie, J.M.S.; Hughes, H.; Ronshaugen, M.; Sucena, É.; et al. Evolution of mir-92a underlies natural morphological variation in Drosophila melanogaster. Curr. Biol. 2013, 23, 523–528. [Google Scholar] [CrossRef]
- Khaitovich, P.; Hellmann, I.; Enard, W.; Nowick, K.; Leinweber, M.; Franz, H.; Weiss, G.; Lachmann, M.; Pääbo, S. Parallel patterns of evolution in the genomes and transcriptomes of humans and chimpanzees. Science 2005, 309, 1850–1854. [Google Scholar] [CrossRef] [PubMed]
- Yang, J.; Su, A.I.; Li, W.-H. Gene expression evolves faster in narrowly than in broadly expressed mammalian genes. Mol. Biol. Evol. 2005, 22, 2113–2118. [Google Scholar] [CrossRef] [PubMed]
- Amaral, A.J.; Brito, F.F.; Chobanyan, T.; Yoshikawa, S.; Yokokura, T.; van Vactor, D.; Gama-Carvalho, M. Quality assessment and control of tissue specific RNA-seq libraries of Drosophila transgenic RNAi models. Front. Genet. 2014, 5, 43. [Google Scholar] [CrossRef]
- Potier, D.; Davie, K.; Hulselmans, G.; Naval Sanchez, M.; Haagen, L.; Huynh-Thu, V.A.; Koldere, D.; Celik, A.; Geurts, P.; Christiaens, V.; et al. Mapping gene regulatory networks in Drosophila eye development by large-scale transcriptome perturbations and motif inference. Cell Rep. 2014, 9, 2290–2303. [Google Scholar] [CrossRef]
- Hickman, S.E.; Kingery, N.D.; Ohsumi, T.K.; Borowsky, M.L.; Wang, L.-c.; Means, T.K.; El Khoury, J. The microglial sensome revealed by direct RNA sequencing. Nat. Neurosci. 2013, 16, 1896–1905. [Google Scholar] [CrossRef]
- Ahn, R.S.; Taravati, K.; Lai, K.; Lee, K.M.; Nititham, J.; Gupta, R.; Chang, D.S.; Arron, S.T.; Rosenblum, M.; Liao, W. Transcriptional landscape of epithelial and immune cell populations revealed through FACS-seq of healthy human skin. Sci. Rep. 2017, 7, 1343. [Google Scholar] [CrossRef]
- Florio, M.; Albert, M.; Taverna, E.; Namba, T.; Brandl, H.; Lewitus, E.; Haffner, C.; Sykes, A.; Wong, F.K.; Peters, J.; et al. Human-specific gene ARHGAP11B promotes basal progenitor amplification and neocortex expansion. Science 2015. [Google Scholar] [CrossRef]
- Karaiskos, N.; Wahle, P.; Alles, J.; Boltengagen, A.; Ayoub, S.; Kipar, C.; Kocks, C.; Rajewsky, N.; Zinzen, R.P. The Drosophila embryo at single-cell transcriptome resolution. Science 2017, 3235, eaan3235. [Google Scholar] [CrossRef]
- Sebé-Pedrós, A.; Saudemont, B.; Chomsky, E.; Plessier, F.; Mailhé, M.-P.; Renno, J.; Loe-Mie, Y.; Lifshitz, A.; Mukamel, Z.; Schmutz, S.; et al. Cnidarian Cell Type Diversity and Regulation Revealed by Whole-Organism Single-Cell RNA-Seq. Cell 2018, 173, 1520–1534. [Google Scholar] [CrossRef] [PubMed]
- Fincher, C.T.; Wurtzel, O.; de Hoog, T.; Kravarik, K.M.; Reddien, P.W. Cell type transcriptome atlas for the planarian Schmidtea mediterranea. Science 2018, 360. [Google Scholar] [CrossRef] [PubMed]
- Achim, K.; Eling, N.; Vergara, H.M.; Bertucci, P.Y.; Musser, J.; Vopalensky, P.; Brunet, T.; Collier, P.; Benes, V.; Marioni, J.C.; et al. Whole-Body Single-Cell Sequencing Reveals Transcriptional Domains in the Annelid Larval Body. Mol. Biol. Evol. 2018, 35, 1047–1062. [Google Scholar] [CrossRef] [PubMed]
- Davie, K.; Janssens, J.; Koldere, D.; de Waegeneer, M.; Pech, U.; Kreft, Ł.; Aibar, S.; Makhzami, S.; Christiaens, V.; Bravo González-Blas, C.; et al. A Single-Cell Transcriptome Atlas of the Aging Drosophila Brain. Cell 2018. [Google Scholar] [CrossRef] [PubMed]
- Konstantinides, N.; Kapuralin, K.; Fadil, C.; Barboza, L.; Satija, R.; Desplan, C. Phenotypic Convergence: Distinct Transcription Factors Regulate Common Terminal Features. Cell 2018. [Google Scholar] [CrossRef]
- Croset, V.; Treiber, C.D.; Waddell, S. Cellular diversity in the Drosophila midbrain revealed by single-cell transcriptomics. eLife 2018, 7. [Google Scholar] [CrossRef]
- Aibar, S.; González-Blas, C.B.; Moerman, T.; Huynh-Thu, V.A.; Imrichova, H.; Hulselmans, G.; Rambow, F.; Marine, J.-C.; Geurts, P.; Aerts, J.; et al. SCENIC: Single-cell regulatory network inference and clustering. Nat. Methods 2017, 14, 1083–1086. [Google Scholar] [CrossRef]
- Chan, T.E.; Stumpf, M.P.H.; Babtie, A.C. Gene Regulatory Network Inference from Single-Cell Data Using Multivariate Information Measures. Cell Syst. 2017, 5, 251–267. [Google Scholar] [CrossRef]
- Ashburner, M.; Ball, C.A.; Blake, J.A.; Botstein, D.; Butler, H.; Cherry, J.M.; Davis, A.P.; Dolinski, K.; Dwight, S.S.; Eppig, J.T.; et al. Gene Ontology: Tool for the unification of biology. Nat. Genet. 2000, 25, 25–29. [Google Scholar] [CrossRef]
- The Gene Ontology Consortium. The Gene Ontology Resource: 20 years and still GOing strong. Nucleic Acids Res. 2019, 47, D330–D338. [Google Scholar] [CrossRef] [PubMed]
- Subramanian, A.; Tamayo, P.; Mootha, V.K.; Mukherjee, S.; Ebert, B.L.; Gillette, M.A.; Paulovich, A.; Pomeroy, S.L.; Golub, T.R.; Lander, E.S.; et al. Gene set enrichment analysis: A knowledge-based approach for interpreting genome-wide expression profiles. Proc. Natl. Acad. Sci. USA 2005, 102, 15545–15550. [Google Scholar] [CrossRef] [PubMed]
- Mootha, V.K.; Lindgren, C.M.; Eriksson, K.-F.; Subramanian, A.; Sihag, S.; Lehar, J.; Puigserver, P.; Carlsson, E.; Ridderstråle, M.; Laurila, E.; et al. PGC-1alpha-responsive genes involved in oxidative phosphorylation are coordinately downregulated in human diabetes. Nat. Genet. 2003, 34, 267–273. [Google Scholar] [CrossRef] [PubMed]
- Goeman, J.J.; Bühlmann, P. Analyzing gene expression data in terms of gene sets: Methodological issues. Bioinformatics 2007, 23, 980–987. [Google Scholar] [CrossRef] [PubMed]
- Nam, D.; Kim, S.-Y. Gene-set approach for expression pattern analysis. Brief. Bioinform. 2008, 9, 189–197. [Google Scholar] [CrossRef] [PubMed]
- Xie, C.; Mao, X.; Huang, J.; Ding, Y.; Wu, J.; Dong, S.; Kong, L.; Gao, G.; Li, C.-Y.; Wei, L. KOBAS 2.0: A web server for annotation and identification of enriched pathways and diseases. Nucleic Acids Res. 2011, 39, W316-22. [Google Scholar] [CrossRef] [PubMed]
- Wang, S.; Cao, M.; Ma, X.; Chen, W.; Zhao, J.; Sun, C.; Tan, L.; Liu, F. Integrated RNA Sequencing and QTL Mapping to Identify Candidate Genes from Oryza rufipogon Associated with Salt Tolerance at the Seedling Stage. Front. Plant Sci. 2017, 8, 1427. [Google Scholar] [CrossRef] [PubMed]
- Jian, H.; Zhang, A.; Ma, J.; Wang, T.; Yang, B.; Shuang, L.S.; Liu, M.; Li, J.; Xu, X.; Paterson, A.H.; et al. Joint QTL mapping and transcriptome sequencing analysis reveal candidate flowering time genes in Brassica napus L. BMC Genom. 2019, 20, 21. [Google Scholar] [CrossRef] [PubMed]
- Zhang, Z.; Jia, Y.; Almeida, P.; Mank, J.E.; van Tuinen, M.; Wang, Q.; Jiang, Z.; Chen, Y.; Zhan, K.; Hou, S.; et al. Whole-genome resequencing reveals signatures of selection and timing of duck domestication. GigaScience 2018, 7. [Google Scholar] [CrossRef]


| Method | Key information |
|---|---|
| RNAseq | Summary: RNA is isolated and reverse transcribed into cDNA for library preparation and sequencing. Practical considerations: The most common protocol uses oligo-dT primers to enrich for polyadenylated RNAs for reverse transcription of processed mRNA [17] and the majority of lncRNAs [118]. Alternative protocols use total RNA and ribosome depletion prior to reverse transcription with random oligos to obtain other RNA molecules (e.g., immature mRNA, miRNA, and siRNA) [119]. For small RNA enrichment several commercial kits are available to select for molecule sizes less than 30 nucleotides [120]. Applications: Transcriptome generation for gene annotation including alternative isoforms (paired-end sequencing) and differential gene expression analysis between different samples (e.g., tissues, experimental conditions, populations of the same species or even species showing different phenotypes) [18,19,20,21,121]. RNAseq is also a useful tool for miRNA profiling and annotation [122] as well as differential expression of lncRNAs [123]. Single cell application: [124,125,126] |
| ATACseq* | Summary: Accessible chromatin regions which are not condensed by histones, are digested with a genetically modified transposase (Tn5). Nucleotide overhangs (tagmentation) are utilized for specific adapter ligation during the library preparation and sequencing [69,127]. This method substituted previous ones such as DNaseseq and FAIREseq, due to its simplicity and effectiveness. Practical considerations: Usually the protocol should be done with fresh tissue and a defined number of nuclei/cells (e.g 500–50,000 for mammalian tissues [127]) that have to be estimated prior to tagmentation. These technical aspects limit the number of samples that can be processed simultaneously. However, protocols were successfully applied to frozen tissue [128]. Applications: ATACseq is commonly used to complement RNAseq data to identify potential regulatory regions (enhancers) [129]. ATACseq can also be used to evaluate chromatin structure dynamics and epigenetic changes by providing information about histone position as well as a complementary approach to ChIPseq to characterize transcription factor and repressor (e.g., CTCF) occupancies [69]. Single cell application: [130,131] |
| ChIPseq* | Summary: DNA bound proteins (e.g., transcription factors, histones) are crosslinked and the chromatin is digested with restriction enzymes. Antibodies specific for the DNA-binding protein are used to isolate Protein-DNA fragments. After reversal of the crosslink and dissociation of the DNA short read sequencing libraries are prepared [132,133].
Practical considerations: This technique relies on previous knowledge about the DNA-binding proteins and available antibodies. Applications: ChIPseq is commonly used to generate genome wide data on protein-DNA interactions, mainly to determine transcription factor binding sites and their binding dynamics [134]. It has been used also to estimate histone modifications and nucleosome position between different species [72]. Single cell application: [135] |
| Hi-C* | Summary: DNA-binding proteins and chromatin are covalently crosslinked with formaldehyde and digested with a restriction enzyme. The resulting fragments are ligated to create chimeric molecules of DNA which are further isolated for library preparation and sequencing [136].
Practical considerations: Hi-C relies on restriction enzyme recognition sites which can create bias due to their heterogeneous distribution in the genome [137]. Alternative methods used DNase I [138] or micrococcus digestion [139] to overcome that issue. Applications: Hi-C is commonly used to identify global patterns of 3D genome conformation. Additionally, this method allows exploring how interactions between different chromosomal regions can affect gene regulation. The impact of chromatin topology on gene expression between species has been studied [64,66,140]. Single cell application: [141] |
| BSseq | Summary: DNA is treated with sodium bisulfite to deaminate cytosine bases into uracil (thymine after PCR) while methyl-cytosine bases are not affected [142]. The treated DNA is then digested for library preparation and sequencing [143]. Practical considerations: The deamination reaction usually has high yield, but small variations can create significant bias in the estimation of global methylation patterns [144]. Since cytosine is converted into thymine, the sequence complexity is reduced, and the strands are no longer complementary causing potential problems with the alignments. However, dedicated software has been developed to deal with the challenging BSseq data analysis (reviewed in [145]). Applications: This method is used to obtain genome wide patterns of DNA methylation which is an important epigenetic modification typically associated with gene expression repression [143]. In recent years, this method has been extensively applied to ecological and evolutionary studies [146,144]. Single cell application: [147,148] |
| bulk-RNAseq of Whole Individuals | bulk-RNAseq with Prior Selection | scRNAseq | |
|---|---|---|---|
| What can I do? | |||
| Gain cell type specific gene expression | − | +/− | + |
| Identify overall gene expression profile | + | − | − |
| What do I need? | |||
| Prior knowledge about the tissue or cells of interest | − | + | − |
| Transgenic organisms/fluorescently labeled cells | − | + | − |
| Specific technique to obtain tissue/cells | − | +/− | + |
© 2019 by the authors. Licensee MDPI, Basel, Switzerland. This article is an open access article distributed under the terms and conditions of the Creative Commons Attribution (CC BY) license (http://creativecommons.org/licenses/by/4.0/).
Share and Cite
Buchberger, E.; Reis, M.; Lu, T.-H.; Posnien, N. Cloudy with a Chance of Insights: Context Dependent Gene Regulation and Implications for Evolutionary Studies. Genes 2019, 10, 492. https://doi.org/10.3390/genes10070492
Buchberger E, Reis M, Lu T-H, Posnien N. Cloudy with a Chance of Insights: Context Dependent Gene Regulation and Implications for Evolutionary Studies. Genes. 2019; 10(7):492. https://doi.org/10.3390/genes10070492
Chicago/Turabian StyleBuchberger, Elisa, Micael Reis, Ting-Hsuan Lu, and Nico Posnien. 2019. "Cloudy with a Chance of Insights: Context Dependent Gene Regulation and Implications for Evolutionary Studies" Genes 10, no. 7: 492. https://doi.org/10.3390/genes10070492
APA StyleBuchberger, E., Reis, M., Lu, T.-H., & Posnien, N. (2019). Cloudy with a Chance of Insights: Context Dependent Gene Regulation and Implications for Evolutionary Studies. Genes, 10(7), 492. https://doi.org/10.3390/genes10070492