Decreased Temperature Sensitivity of Vestigial Gene Expression in Temperate Populations of Drosophila melanogaster


1
Section of Evolutionary Biology, Department of Biology II, University of Munich, Planegg-Martinsried, 82152 Munich, Germany
2
Applied Zoology, Faculty of Biology, Technische Universität Dresden, 01217 Dresden, Germany
3
Lunenfeld-Tanenbaum Research Institute, Mount Sinai Hospital, Toronto, ON M5G 1X5, Canada
4
Leibniz Institute for Evolution and Biodiversity Science, 10115 Berlin, Germany
*
Author to whom correspondence should be addressed.
†
This work is part of her Ph.D. Thesis.
Genes 2019, 10(7), 498; https://doi.org/10.3390/genes10070498
Submission received: 25 April 2019
/
Revised: 5 June 2019
/
Accepted: 21 June 2019
/
Published: 28 June 2019
(This article belongs to the Special Issue Evolutionary Genetics of Gene Expression)
Abstract
:Drosophila melanogaster recently spread from its tropical origin in Africa and became a cosmopolitan species that has adapted to a wide range of different thermal environments, including temperate climates. An important limiting factor of temperate climates has probably been their low and varying temperatures. The transcriptional output of genes can vary across temperatures, which might have been detrimental while settling in temperate environments. The reduction of temperature-sensitive expression of functionally important genes to ensure consistent levels of gene expression might have been relevant while adapting to such environments. In this study, we focus on the gene vestigial (vg) whose product is a key factor in wing development. We provide evidence that temperature-sensitivity of vg has been buffered in populations from temperate climates. We investigated temperature-sensitivity of vg gene expression in six natural populations, including four temperate populations (three from Europe and one from high-altitude Africa), and two tropical populations from the ancestral species range. All temperate populations exhibited a lower degree of temperature-induced expression plasticity than the tropical populations.
1. Introduction
Species colonizing new environments need to adapt to novel biotic and abiotic conditions. One critical determinant of species ranges that varies with latitudes and altitudes is environmental temperature. In particular for ectotherms, such as insects, temperature plays a major role in determining species abundance and geographic distribution [1,2]. As a cosmopolitan species, the fruit fly Drosophila melanogaster has adapted to a wide range of thermal environments [3,4,5]. Its origin is thought to be in tropical southern-central Africa from where it spread around the world [6,7,8]. After an initial expansion throughout Africa, it reached the Eurasian continent after the last glaciation around 10,000 years ago [9,10], and later moved on to colonize Asia and Europe [11]. An important limiting factor while settling in Europe and at high altitudes in sub-Saharan Africa must have been temperate climates, with their low and varying temperatures.
For Drosophila, it is known that the transcriptional output of genes can be affected by temperature [12,13]. The resulting expression plasticity across temperatures might have been detrimental in temperate climates if it shifts the transcriptional output away from the optimum. A high degree of expression plasticity, for instance, could have severe consequences for the intricate interactions of genes involved in development and cell differentiation. The reduction of temperature-induced expression plasticity of functionally important genes, therefore, might have been important while adapting to temperate environments, in order to buffer against fluctuations in temperature and to maintain consistent expression levels across temperatures [14]. Indeed, temperature-induced gene expression plasticity was generally reduced in a temperate compared to a tropical population, both from Australia [12].
The gene vestigial (vg), well-known for its wing mutants, is a key player in the development of the Drosophila wing. It encodes a transcription factor that plays an essential role in the development and patterning of the wing [15]. Loss of vg results in the failure of wings to develop [16] and ectopic expression of vg leads to the outgrowth of ectopic wing tissue [17]. Known vg mutations display a range of temperature-sensitive expression patterns [18] indicating that DNA sequence changes at the vg locus can cause differences in temperature-sensitivity. This makes vg an interesting candidate for studying temperature-sensitive gene expression and the potential buffering thereof in flies from temperate climates.
We investigated temperature-sensitive expression of vg in natural populations of D. melanogaster from six different locations. These included three temperate populations from Europe, one temperate population from a high-altitude location in Africa, and two tropical populations from the ancestral species range. Temperature-induced plasticity of vg expression with higher expression at lower temperature appeared to be restricted to certain tissues and/or stages. The degree of expression plasticity differed between the populations with a higher degree in those from hot climates than in those from temperate climates. In addition, vg expression was significantly increased across temperatures in cold-temperate flies.
2. Materials and Methods
2.1. Expression Analysis
Six population samples from Sweden (Umeå), The Netherlands (Leiden), France (Lyon), Rwanda (Gikongoro), Zimbabwe (Lake Kariba), and Zambia (Siavonga) (Table 1) were selected for expression analysis in adult D. melanogaster. Tissue-specific expression analysis in third instar larvae was performed using samples of four of the aforementioned populations from Sweden, The Netherlands, Zimbabwe, and Zambia. Each population sample consisted of a pool of eight isofemale lines from the respective population. Flies were reared on a standard cornmeal-molasses medium with a 14/10 h light/dark cycle at 17 °C or 28 °C. Five males and five females were allowed to mate and oviposit for seven or three days at 17 °C and 28 °C, respectively. Flies reared at 17 °C were allowed to oviposit for a longer period since development is slowed at lower temperatures. Mated adult males (aged 4–6 days after eclosion) of the resulting progeny, with one male of each line of the respective population, were pooled for RNA extraction resulting in a pool of eight flies per sample. For tissue-specific expression-analysis, 50 eggs per vial were allowed to hatch and develop into wandering third instar larvae (wL3) from which tissue was sampled. Eight brain and 16 wing imaginal discs of each line were pooled for RNA extraction resulting in a pool of 64 brains and 128 discs per sample, respectively. After dissection, tissues were immediately stored in RNAlater (Qiagen, Hilden, Germany). RNA was extracted using the MasterPure RNA Purification Kit (Epicentre, Madison, WI, USA). RNA purity was assessed via the ratio of absorbances at 260 and 280 nm (A260/A280 > 1.8). It was then reverse transcribed into cDNA using random primers and SuperScript® III Reverse Transcriptase (Invitrogen, Carlsbad, CA, USA). The RT-qPCR reactions were performed with iQ™ SYBR® Green Supermix (BioRad, Hercules, CA, USA) on a CFX96™ real-time PCR cycler (BioRad, Hercules, CA, USA). Primers for target genes and two reference genes for normalization (RpS20 and RpL32) were designed applying the QuantPrime software [19]. Primer sequences are given in Supplementary Table S1. Three biological replicates per population sample, rearing temperature and tissue were run in triplicates. Primer specificity was confirmed by a melting curve analysis. The PCR efficiency was above 95% for all primer pairs. Negative controls included no template controls (NTCs) and no reverse-transcription controls (NRTs) to exclude contamination. Relative expression was calculated using the qBase relative quantification framework [20]. Both reference genes were stably expressed across samples. This was assessed by calculating the coefficient of variation and the M stability parameter according to Hellesmans et al. [20]. Log-transformed normalized relative quantities were subjected to statistical analysis. The effects of rearing temperature and climate were analyzed using a mixed linear model with rearing temperature, climate as well as their interaction as fixed effects factors, and population as a random effects factor. Models were fitted employing REML estimation. Significance of fixed effects was estimated using Type III Wald Chi-square tests. Welch Two Sample t-tests were done for pairwise comparisons. between the different rearing temperatures and population samples. False discovery rate was controlled applying the multiple testing correction method by Benjamini and Hochberg [21].
2.2. Sequence Analysis
Sequence data of multiple genomes from the French (96 lines), Rwandan (27 lines), and Zambian (197 lines) populations were derived from the population genomic resource Drosophila Genome Nexus (DGN) [22]. The Dutch population used in the expression analysis was not available through the DGN. Another Dutch sample (19 lines) included in the DGN, which was collected only about 60 km away from Leiden in Houten was instead used in the analysis. Genomes from the Swedish population (14 lines) [23] were aligned using the DGN alignment pipeline [22]. FST was estimated according to Hudson et al. [24] and assessed per SNP in a 300-kB window surrounding vg. SNPs with less than seven called alleles in one or more of the populations were excluded from the analysis. The vg gene region was defined as the interval between the two outer insulators [25] flanking the vg locus.
3. Results
3.1. Expression Analysis in Adult D. melanogaster
Male adult flies from different natural populations were reared at two different temperatures (17 °C and 28 °C) to examine whether vg is exhibiting temperature-sensitive expression. Population samples were from six locations of different climates (Table 1). Samples from tropical regions included two from the ancestral D. melanogaster species range: Zambia and Zimbabwe [8]. The other four samples were derived from populations of temperate regions: three from warm-temperate climates including two European samples (France and The Netherlands) and an African high-elevation population sample from Rwanda, and one from the cold-temperate climate of Sweden.
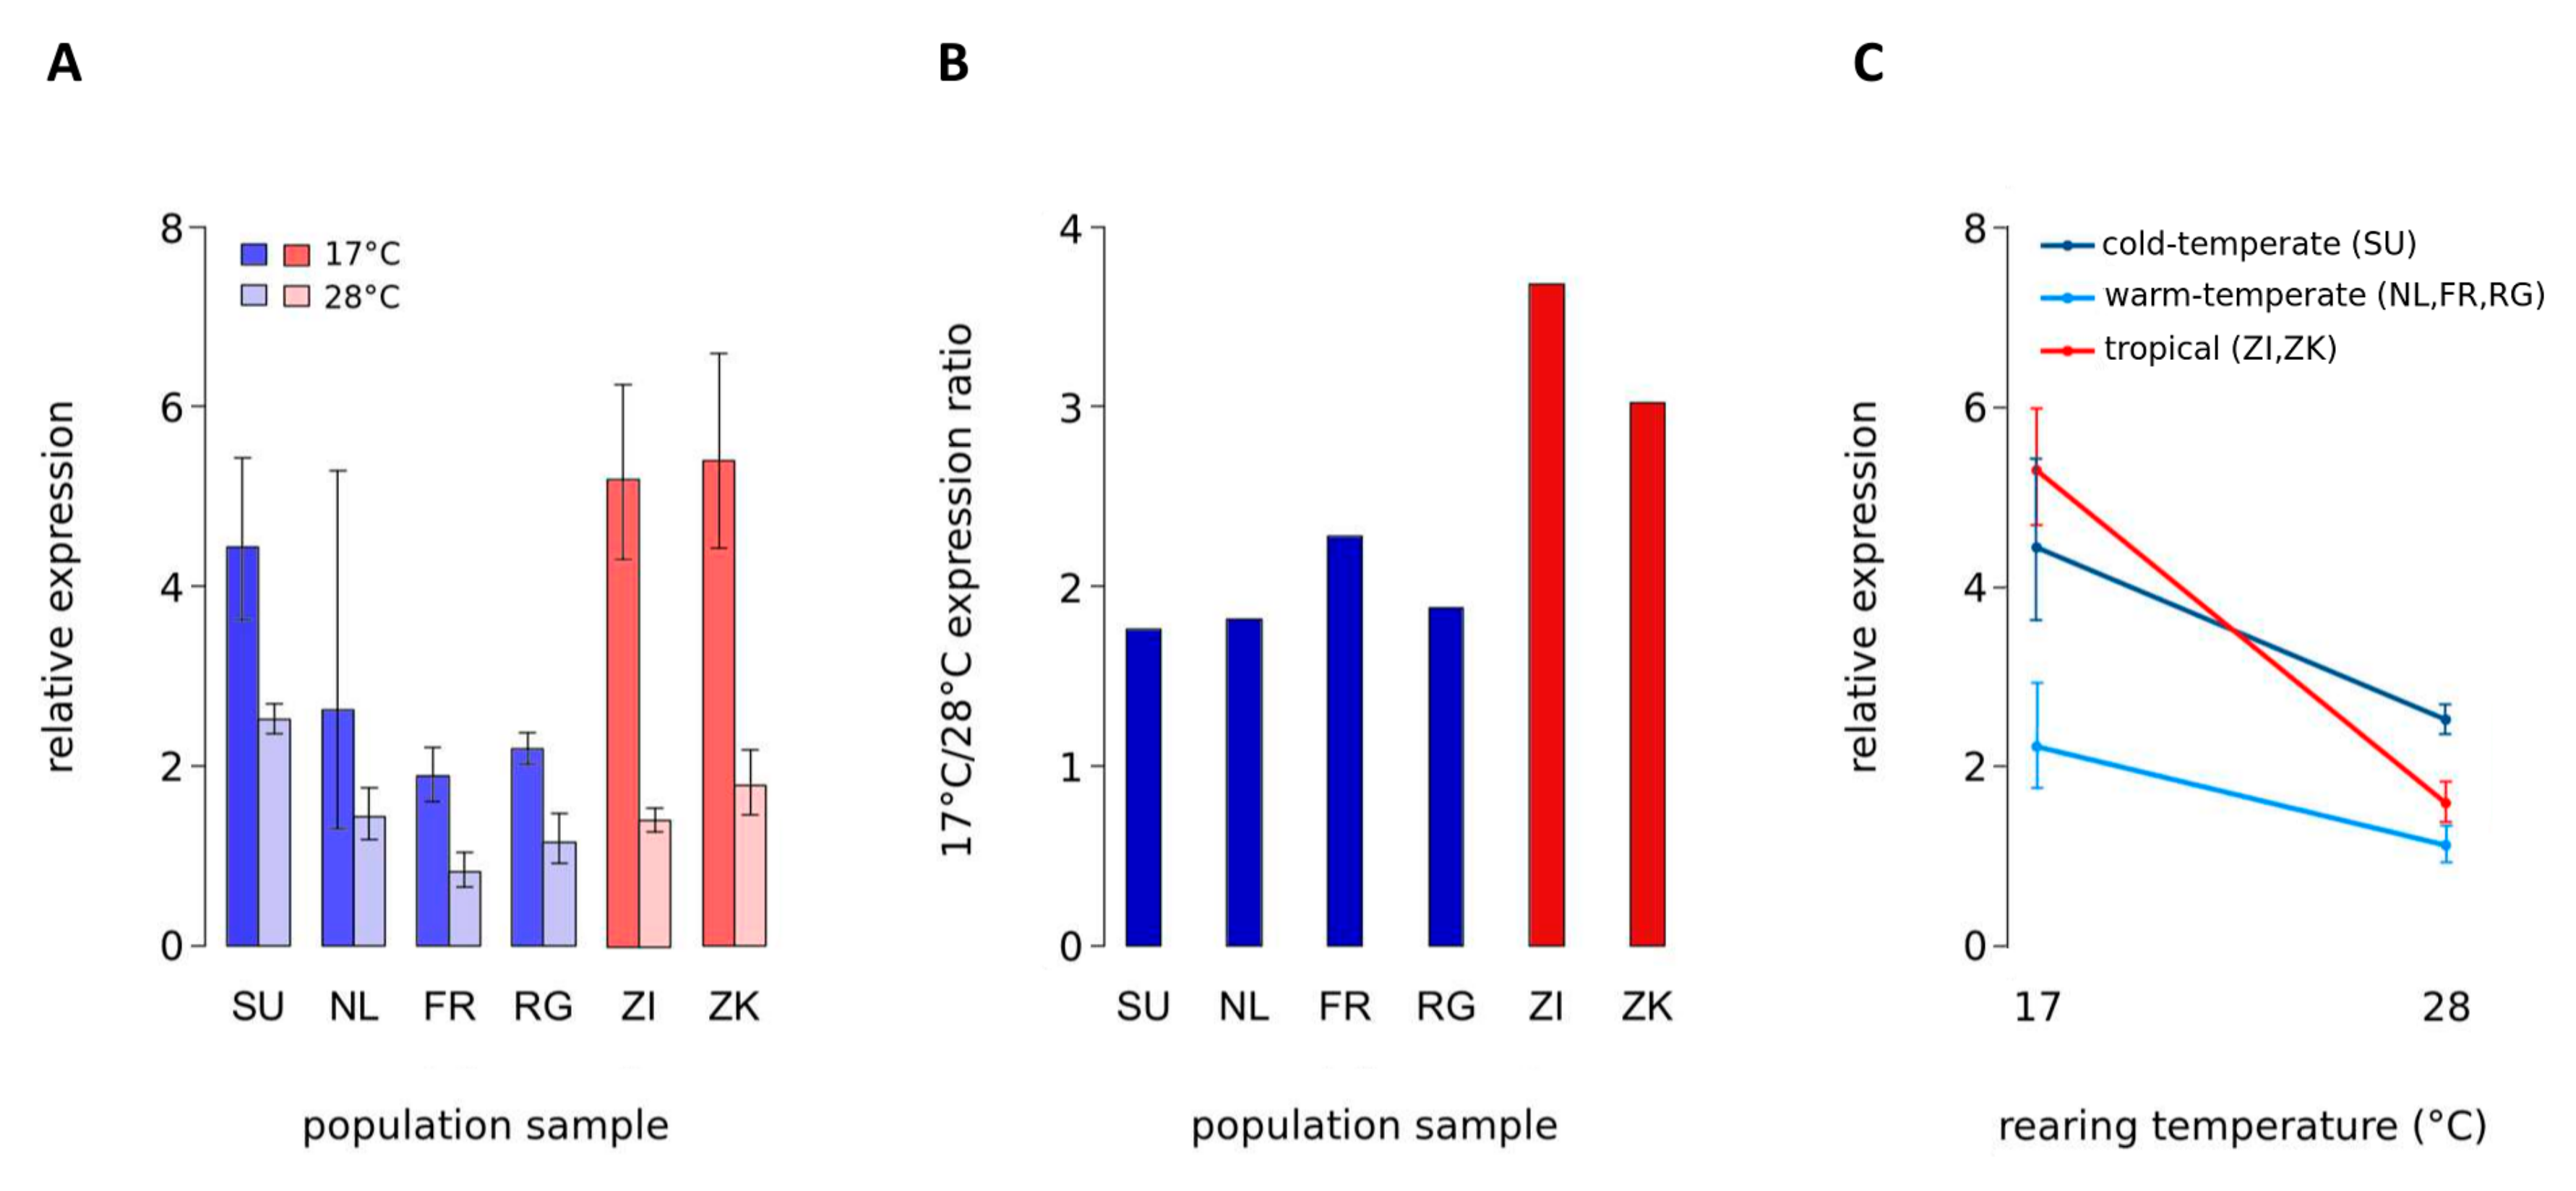
Expression of vg was significantly affected by the temperature at which flies were reared, and by the climate from which they were derived (Figure 1, Table 2). The interaction between rearing temperature and climate of origin was highly significant (Figure 1C, Table 2), suggesting a change in the degree of temperature-induced expression plasticity between populations from different climates. No significant interaction was observed when only the populations from cold- and warm-temperate climates were included in the model. Thus, the amount of change in vg expression due to temperature appears to be similar between the populations from cold- and warm-temperate climates. We then fitted a more parsimonious model for the temperate populations without the interaction, which yielded highly significant effects of rearing temperature and climate of origin on the expression of vg (Supplementary Table S2). Removing the interaction had no significant effect on the fit of the model (Χ2 = 0.2832, p = 0.59). Therefore, although the expression response to temperature seems to be similar between flies from cold- and warm-temperate climates, the overall expression of vg was higher in cold- than in warm-temperate populations (Figure 1C). Temperature-sensitive gene expression of vg due to variation in rearing temperature was observed for all population samples, but not for the control gene Aats-asp, which is located adjacent to vg (Figure 1, 2,3 ). Expression of vg was consistently higher at 17 °C than at 28 °C, and this difference was significant for all samples except for the Dutch one, which exhibited a rather high variation between biological replicates at 17 °C (Figure 1A, Table 3). Interestingly, with a ~2-fold higher expression at 17 °C, the ratio between vg expression at 17 °C and at 28 °C was lower in all four temperate population samples than in the tropical samples in which vg expression was more than 3-fold higher at 17 °C (Figure 1B, Table 2). Temperature-induced expression plasticity of vg, therefore, appears to be buffered in derived temperate genotypes compared to tropical genotypes.
Although the amount of buffering among temperate samples appears to be the same, the mechanisms of how the lowered expression ratio between rearing temperatures comes about seem to be different. For the cold-temperate sample from Sweden, increased vg expression relative to the other population samples was observed at 28 °C. The difference was statistically significant for all comparisons between the Swedish and the other samples, except for the one to Zimbabwe, which was of borderline significance (p = 0.07) (Supplementary Table S3). In the three warm-temperate population samples, vg expression was decreased at 17 °C compared to the other three samples. Statistical significance was found for all comparisons, except for those including the Dutch sample (Figure 1A, Table 3). Again, the reason for this is the high variation between biological samples in the Dutch vg expression at 17 °C, which might be eliminated by increasing sample size. At least for the French and Rwandan samples, this decreased vg expression is also visible at 28 °C, though to a lower extent than at 17 °C (Figure 1A, Table 2). This could suggest different mechanisms between cold- and warm-temperate populations of how the lowered expression ratio between rearing temperatures arises. More likely, however, given the shared demographic history of European populations, is that, on top of buffering of temperature-sensitive expression in European flies, overall expression of vg is additionally elevated in the Swedish population.
3.2. Tissue-Specific Expression Analysis in Third Instar Larvae of D. melanogaster
Adult structures are derived from larval structures called imaginal discs. Since the vg gene product has its main function in the control of wing formation [15,16,17], the vg gene shows an enriched expression in wing imaginal discs [15]. This tissue was, therefore, chosen to further examine vg expression under different rearing temperatures. The same was done for larval brains in order to monitor vg expression in a tissue in which expression of the gene is known to be low [27]. Gene expression was measured in four samples of the aforementioned populations from Sweden, The Netherlands, Zambia and Zimbabwe (Table 1). As expected, vg expression was significantly higher in wing discs than in brains at both rearing temperatures and across all populations (Supplementary Table S4). Temperature-sensitive expression with increased expression levels at lower temperatures, as observed for adults in this study, was neither detected in wing discs nor in brains for vg or the control gene Aats-asp (Supplementary Table S5). Decreased expression levels in the Zambian sample at 17 °C relative to 28 °C were the only statistically significant differences observed in vg expression (Supplementary Table S5, Supplementary Table S6). Thus, neither temperature-sensitivity in vg expression as observed for adults nor a buffering of it in temperate populations appear to play a role in the larval tissues examined here.
3.3. Sequence Analysis of Genetic Differentiation at the vg Locus
Both trans-regulatory and cis-regulatory changes might be responsible for the expression changes observed in adult flies. Potential cis-regulatory changes should be sufficiently differentiated between populations. In order to identify candidates of cis-regulatory changes between temperate and tropical populations that might be contributing to the observed expression differences, we estimated FST per SNP between each of the four temperate populations and the tropical, ancestral range population from Zambia in a 300-kB window around vg. We then looked for outlier SNPs (TOP FST values) in the vg gene region (see Materials and Methods). No shared outlier SNPs (TOP1% FST) were detected when all temperate populations were considered (Figure 2). Given their geographic closeness and their shared demographic history [10,11,23], a common genetic basis for the reduced plasticity in vg expression is rather likely in the case of the European temperate populations. Nine outlier SNPs (TOP1% FST) were found to be shared between the three European populations (Figure 2; Supplementary Table S7). Since overall expression in the Swedish population appears to be elevated compared to the other temperate populations, we also looked for outlier SNPs (TOP1% FST) that are also highly differentiated between the Swedish and each of the other temperate populations (TOP5% FST). We observed two such SNPs which are located in the fourth intron of vg (Figure 2, Supplementary Table S7). The TOP1% FST cutoff value between the two sub-Saharan African populations from Rwanda and Zambia was relatively low (0.19). Thus, we only considered the TOP0.1% FST values as possible candidate SNPs for reduced plasticity in vg expression in the Rwandan population. Three such SNPs were observed (Figure 2, Supplementary Table S7).
4. Discussion
Here we examined the expression response to temperature of the gene vg in six natural populations of D. melanogaster from different latitudes and altitudes. vg is a transcription factor that is known as a wing selector gene due to its essential role in the development and patterning of the Drosophila wing. In all four temperate populations, temperature-sensitive expression plasticity was reduced compared to the two tropical populations from the ancestral species range. Temperate populations were derived from a range of different locations including high-latitude Europe and high-altitude Africa. The consistent response to temperature across all temperate populations is consistent with positive selection acting to reduce temperature-sensitivity of vg expression in temperate climates.
We observed that reduced vg expression at 17 °C compared to the expression level in tropical flies led to a buffering of temperature-induced expression plasticity in the three population samples from warm-temperate climates. In contrast, in the cold-temperate sample from Sweden, increased vg expression at 28°C relative to the tropical and the other population samples resulted in the observed buffering effect. Given the shared demographic history of European populations, it seems likely that in addition to buffering temperature-sensitive expression in European flies, overall expression of vg is increased in the Swedish population. Other ecological constraints due to the colder climate in Sweden could be a possible explanation for the observed difference. Higher overall vg expression, for instance, might have been further beneficial in the colder climate of Sweden.
The observed direction of the expression response to temperature with higher expression at lower temperatures is typical for genes regulated by the Polycomb group (PcG) [28,29,30,31,32]. As for many developmentally important genes, the expression of vg is epigenetically controlled by this group of proteins. Interestingly, an earlier study found evidence for selection acting on cis-regulatory sites leading to reduced expression plasticity of another PcG-target gene in temperate flies [33]. The selected sites were highly differentiated between African and European D. melanogaster populations and were located in a Polycomb response element (PRE), a cis-regulatory DNA element that recruits PcG proteins to their target genes [34].
Although vg plays important roles in the differentiation of adult structures during development [15,16,17,35], little is known about its function in adult flies. Since the main function of vg is in wing development [15,16,17], we also looked for temperature-induced expression plasticity and its possible buffering in wing discs of wandering third instar larvae. In this tissue and at this developmental stage, vg is in an activated state and highly expressed [15,27]. We chose the larval brain, in which vg gene expression is low, as a control tissue [27]. Temperature-sensitive expression as it is often observed for PcG-regulated genes and as we found for adults was not detected in either of the two larval tissues. Possible explanations for this include that selective pressure against such a temperature-induced expression plasticity might be much stronger in larval tissues compared to adult tissues and therefore is not observed in any of the populations. Alternatively, vg expression is in itself not affected by temperatures in larval tissues like it is in adult tissues. At least for wing discs, the former explanation might be more likely. Mutations in vg introns were found to cause temperature-sensitive expression of the gene in wing imaginal discs, whereas no temperature-sensitivity was observed for wild type discs [18].
Both trans-regulatory and cis-regulatory changes might be responsible for the changes in vg expression in adult flies. A range of temperature-sensitive expression patterns of vg has been observed in mutant flies carrying mutations at the vg locus [18] indicating that DNA sequence changes at the vg locus can cause differences in temperature-sensitivity. We assessed genetic differentiation in the vg gene region in an attempt to identify potential candidates for cis-regulatory changes responsible for the observed expression differences. Candidate SNPs were located in the introns of vg and upstream of vg in a region also occupied by the insulators that demarcate the vg gene region. As mentioned above, mutations in introns of vg can change temperature-sensitivity of vg expression [18], whereas insulators are known to play important roles in ensuring PcG-mediated gene repression [36,37,38,39]. One of the Rwandan candidate SNPs was found in a region in the third intron of vg, which, if disrupted by a mutation, was shown to result in increased temperature-sensitive expression of vg [18]. A common cis-regulatory mechanism between the temperate European and Rwandan populations appears to be less likely, since no shared outlier SNPs were observed. However, whether the detected candidate SNPs are actually involved in changes of vg expression observed in this study remains unclear. Trans-regulatory changes also might play a role, as well as sites and indels that were not included in the analysis. Furthermore, elevated genetic differentiation of SNPs might also result from neutral processes such as demographic processes or due to being linked to selected sites not involved in the regulation of vg gene expression.
Supplementary Materials
Table S1: Primer sequences, Table S2: Analysis of variance for effects of rearing temperature and climate of origin on vg expression including only temperate populations, Table S3: Fold-changes in gene expression between population samples in adult D. melanogaster, Table S4: Fold-changes in gene expression at different rearing temperatures between tissues in third instar larvae, Table S5: Fold-changes in tissue-specific gene expression between rearing temperatures in third instar larvae, Table S6: Fold-changes in tissue-specific gene expression between population samples in third instar larvae, Table S7: candidate SNPs.
Author Contributions
Conceptualization, S.V. and W.S; methodology, S.V.; validation, S.V. and W.S.; formal analysis, S.V.; investigation, S.V. and A.C.E.; resources, W.S.; data curation, S.V.; writing—original draft preparation, S.V.; writing—review and editing, S.V. and W.S.; visualization, S.V.; supervision, W.S.; Project administration, W.S.; funding acquisition, W.S.
Funding
This work was supported by the Deutsche Forschungsgemeinschaft (DFG) Research Unit grants STE 325/12-1 and 12-2.
Acknowledgments
We thank Simone Lange, Hilde Lainer, Gisela Brinkmann, and Gaby Kumpfmüller for their excellent technical assistance. We are grateful to the reviewers for their valuable comments.
Conflicts of Interest
The authors declare no conflict of interest.
References
- Andrewartha, H.G.; Birch, L.C. The Distribution and Abundance of Animals; University Of Chicago Press: Chicago, IL, USA; p. 1954.
- Cossins, A. Temperature Biology of Animals; Springer Science & Business Media: Heidelberg, Germany, 2012; ISBN 978-94-009-3127-5. [Google Scholar]
- Hoffmann, A.A.; Sørensen, J.G.; Loeschcke, V. Adaptation of Drosophila to temperature extremes: Bringing together quantitative and molecular approaches. J. Therm. Biol. 2003, 28, 175–216. [Google Scholar] [CrossRef]
- Ayrinhac, A.; Debat, V.; Gibert, P.; Kister, A.-G.; Legout, H.; Moreteau, B.; Vergilino, R.; David, J.R. Cold adaptation in geographical populations of Drosophila melanogaster: Phenotypic plasticity is more important than genetic variability. Funct. Ecol. 2004, 18, 700–706. [Google Scholar] [CrossRef]
- Pool, J.E.; Braun, D.T.; Lack, J.B. Parallel evolution of cold tolerance within Drosophila melanogaster. Mol. Biol. Evol. 2017, 34, 349–360. [Google Scholar] [CrossRef] [PubMed]
- David, J.; Capy, P. Genetic variation of Drosophila melanogaster natural populations. Trends Genet. 1988, 4, 106–111. [Google Scholar] [CrossRef]
- Lachaise, D.; Silvain, J.-F. How Two Afrotropical Endemics Made Two Cosmopolitan Human Commensals: the Drosophila Melanogaster–D. Simulans Palaeogeographic Riddle. Genetics 2004, 120, 17–39. [Google Scholar] [CrossRef]
- Pool, J.E.; Corbett-Detig, R.B.; Sugino, R.P.; Stevens, K.A.; Cardeno, C.M.; Crepeau, M.W.; Duchen, P.; Emerson, J.J.; Saelao, P.; Begun, D.J.; et al. Population Genomics of Sub-Saharan Drosophila melanogaster: African Diversity and Non-African Admixture. PLoS Genet. 2012, 8, e1003080. [Google Scholar] [CrossRef] [PubMed]
- Stephan, W.; Li, H. The recent demographic and adaptive history of Drosophila melanogaster. Heredity 2007, 98, 65–68. [Google Scholar] [CrossRef] [PubMed]
- Li, H.; Stephan, W.; Przeworski, M. Inferring the Demographic History and Rate of Adaptive Substitution in Drosophila. PLoS Genet. 2006, 2, e166. [Google Scholar] [CrossRef]
- Laurent, S.J.Y.; Werzner, A.; Excoffier, L.; Wolfgang, S. Approximate Bayesian Analysis of Drosophila melanogaster Polymorphism Data Reveals a Recent Colonization of Southeast Asia. Mol. Biol. Evol. 2011, 28, 2041–2051. [Google Scholar] [CrossRef] [Green Version]
- Levine, M.T.; Eckert, M.L.; Begun, D.J. Whole-genome expression plasticity across tropical and temperate Drosophila melanogaster populations from Eastern Australia. Mol. Biol. Evol. 2011, 28, 249–256. [Google Scholar] [CrossRef] [PubMed]
- Zhao, L.; Wit, J.; Svetec, N.; Begun, D.J. Parallel Gene Expression Differences between Low and High Latitude Populations of Drosophila melanogaster and D. simulans. PLoS Genet. 2015, 11, e1005184. [Google Scholar] [CrossRef] [PubMed]
- Levine, M.T.; Begun, D.J. Evidence of Spatially Varying Selection Acting on Four Chromatin-Remodeling Loci in Drosophila melanogaster. Genetics 2008, 179, 475–485. [Google Scholar] [CrossRef] [Green Version]
- Williams, J.A.; Bell, J.B.; Carroll, S.B. Control of Drosophila wing and haltere development by the nuclear vestigial gene product. Genes Dev. 1991, 5, 2481–2495. [Google Scholar] [CrossRef] [PubMed]
- Lindsley, D.L.; Zimm, G.G. The Genome of Drosophila melanogaster; Academic Press: Cambridge, MA, USA, 2012; ISBN 978-0-323-13984-7. [Google Scholar]
- Kim, J.; Sebring, A.; Esch, J.J.; Kraus, M.E.; Vorwerk, K.; Magee, J.; Carroll, S.B. Integration of positional signals and regulation of wing formation and identity by Drosophila vestigial gene. Nature 1996, 382, 133–138. [Google Scholar] [CrossRef] [PubMed]
- Silber, J.; Flagiello, D.; Cossard, R.; Zider, A.; Becker, J.L. Temperature regulates expression of the Drosophila vestigial gene only in mutant wing discs. Mol. Genet. Genom. 1997, 256, 328–332. [Google Scholar] [CrossRef]
- Arvidsson, S.; Kwasniewski, M.; Riaño-Pachón, D.M.; Mueller-Roeber, B. QuantPrime—A flexible tool for reliable high-throughput primer design for quantitative PCR. BMC Bioinf. 2008, 9, 465. [Google Scholar] [CrossRef]
- Hellemans, J.; Mortier, G.; De Paepe, A.; Speleman, F.; Vandesompele, J. qBase relative quantification framework and software for management and automated analysis of real-time quantitative PCR data. Genome Biol. 2007, 8, R19. [Google Scholar] [CrossRef]
- Benjamini, Y.; Hochberg, Y. Controlling the False Discovery Rate: A Practical and Powerful Approach to Multiple Testing. J. R. Stat. Soc. Ser. B Methodol. 1995, 57, 289–300. [Google Scholar] [CrossRef]
- Lack, J.B.; Lange, J.D.; Tang, A.D.; Corbett-Detig, R.B.; Pool, J.E. A Thousand Fly Genomes: An Expanded Drosophila Genome Nexus. Mol. Boil. Evol. 2016, 33, 3308–3313. [Google Scholar] [CrossRef]
- Kapopoulou, A.; Kapun, M.; Pavlidis, P.; Pieper, B.; Wilches, R.; Stephan, W.; Laurent, S. Early split between African and European populations of Drosophila melanogaster. bioRxiv 2018, 340422. [Google Scholar]
- Hudson, R.R.; Slatkin, M.; Maddison, W.P. Estimation of Levels of Gene Flow from DNA Sequence Data. Genetics 1992, 132, 583–589. [Google Scholar] [PubMed]
- Nègre, N.; Brown, C.D.; Shah, P.K.; Kheradpour, P.; Morrison, C.A.; Henikoff, J.G.; Feng, X.; Ahmad, K.; Russell, S.; White, R.A.H.; et al. A Comprehensive Map of Insulator Elements for the Drosophila Genome. PLoS Genet. 2010, 6, e1000814. [Google Scholar] [CrossRef] [PubMed]
- Climate data for cities worldwide—Climate-Data.org. OpenStreetMap contributor. Available online: https://en.climate-data.org/.
- Chintapalli, V.R.; Wang, J.; Dow, J.A.T. Using FlyAtlas to identify better Drosophila melanogaster models of human disease. Nat. Genet. 2007, 39, 715–720. [Google Scholar] [CrossRef]
- Fauvarque, M.O.; Dura, J.M. polyhomeotic regulatory sequences induce developmental regulator-dependent variegation and targeted P-element insertions in Drosophila. Genes Dev. 1993, 7, 1508–1520. [Google Scholar] [CrossRef] [PubMed]
- Chan, C.; Rastelli, L.; Pirrotta, V. A Polycomb response element in the Ubx gene that determines an epigenetically inherited state of repression. EMBO J. 1994, 13, 2553–2564. [Google Scholar] [CrossRef] [PubMed]
- Zink, D.; Paro, R. Drosophila Polycomb-group regulated chromatin inhibits the accessibility of a trans-activator to its target DNA. EMBO J. 1995, 14, 5660–5671. [Google Scholar] [CrossRef]
- Bantignies, F.; Grimaud, C.; Lavrov, S.; Gabut, M.; Cavalli, G. Inheritance of Polycomb-dependent chromosomal interactions in Drosophila. Genome Res. 2003, 17, 2406–2420. [Google Scholar] [CrossRef]
- Gibert, J.-M.; Karch, F.; Schlötterer, C. Segregating Variation in the Polycomb Group Gene cramped Alters the Effect of Temperature on Multiple Traits. PLoS Genet. 2011, 7, 1001280. [Google Scholar] [CrossRef]
- Voigt, S.; Laurent, S.; Litovchenko, M.; Stephan, W. Positive Selection at the Polyhomeotic Locus Led to Decreased Thermosensitivity of Gene Expression in Temperate Drosophila melanogaster. Genetics 2015, 200, 591–599. [Google Scholar] [CrossRef] [Green Version]
- Kassis, J.A.; Brown, J.L. Chapter three—Polycomb group response elements in Drosophila and vertebrates. In Advances in Genetics; Friedmann, T., Dunlap, J.C., Goodwin, S.F., Eds.; Academic Press: Cambridge, MA, USA, 2013; Volume 81, pp. 83–118. [Google Scholar]
- Sudarsan, V.; Anant, S.; Guptan, P.; VijayRaghavan, K.; Skaer, H. Myoblast Diversification and Ectodermal Signaling in Drosophila. Dev. Cell 2001, 1, 829–839. [Google Scholar] [CrossRef]
- Sigrist, C.J.A.; Pirrotta, V. Chromatin insulator elements block the silencing of a target gene by the Drosophila Polycomb response element (PRE) but allow trans interactions between PREs on different chromosomes. Genetics 1997, 147, 209–221. [Google Scholar] [PubMed]
- Comet, I.; Schuettengruber, B.; Sexton, T.; Cavalli, G. A chromatin insulator driving three-dimensional Polycomb response element (PRE) contacts and Polycomb association with the chromatin fiber. Proc. Natl. Acad. Sci. USA 2011, 108, 2294–2299. [Google Scholar] [CrossRef] [PubMed] [Green Version]
- Li, H.-B.; Müller, M.; Bahechar, I.A.; Kyrchanova, O.; Ohno, K.; Georgiev, P.; Pirrotta, V. Insulators, not Polycomb response elements, are required for long-range interactions between Polycomb targets in Drosophila melanogaster. Mol. Cell. Biol. 2011, 31, 616–625. [Google Scholar] [CrossRef] [PubMed]
- Li, H.-B.; Ohno, K.; Gui, H.; Pirrotta, V. Insulators Target Active Genes to Transcription Factories and Polycomb-Repressed Genes to Polycomb Bodies. PLoS Genet. 2013, 9, e1003436. [Google Scholar] [CrossRef] [PubMed]
Figure 1.
Expression of vg in adult D. melanogaster. mRNA abundance in adult males was measured via RT-qPCR. (A) Expression in population samples from temperate Sweden (SU), Netherlands (NL), France (FR), and Rwanda (RG; high-altitude) (blue bars), as well as in tropical samples from Zambia (ZI) and Zimbabwe (ZK) (red bars). Flies were reared at either 17 °C or 28 °C. Error bars represent the 95% confidence intervals. (B) Ratio of mean vg expression between rearing temperatures (17 °C to 28 °C) for all six population samples. (C) Expression response to rearing temperature in cold-temperate (SU), warm-temperate (NL, FR, RG), and tropical (ZK, ZI) populations. Error bars indicate the 95% confidence intervals.

Figure 2.
FST per SNP across the vg gene region. FST was estimated between the tropical Zambian population and each of the temperate populations. FST between the populations from Sweden (A), The Netherlands (B), France (C) and the tropical, ancestral range population from Zambia. Outlier SNPs shared between all European populations are encircled in red. Dashed lines correspond to the respective 99th quantiles. Outlier SNPs between the Swedish and Zambian population samples and that are also highly differentiated between the Swedish and each of the other three temperate populations (TOP5%) are encircled in blue. (D) FST between the Rwandan and the Zambian population samples. Outlier SNPs are encircled in red. The dashed line corresponds to the 99.9th quantile. The bottom diagram depicts the vg gene region. Coding regions are represented by black boxes, untranslated regions by gray boxes, and introns by black lines. Arrowheads indicate the direction of transcription and positions of insulators are given by triangles.


Table 1.
Population samples.
| Population Sample | Latitude | Longitude | Altitude (m) | Mean Annual Temperature (°C) | Minimum Annual Temperature (°C) | Maximum Annual Temperature (°C) | Climate |
|---|---|---|---|---|---|---|---|
| Umeå, Sweden (SU) | 63.83 | 20.26 | 12 | 2.7 | −1.6 | 7.0 | cold-temperate |
| Leiden, The Netherlands (NL) | 52.17 | 4.48 | 0 | 9.5 | 6.4 | 12.6 | warm-temperate |
| Lyon, France (FR) | 45.76 | 4.84 | 175 | 11.6 | 6.9 | 16.4 | warm-temperate |
| Gikongoro, Rwanda (RG) | −2.49 | 28.92 | 1927 | 17.6 | 12.4 | 23.0 | warm-temperate |
| Lake Kariba, Zimbabwe (ZK) | −16.52 | 28.80 | 619 | 25.5 | 18.7 | 31.9 | tropical |
| Siavonga, Zambia (ZI) | −16.54 | 28.72 | 530 | 25.2 | 18.6 | 31.9 | tropical |
Climate data was taken from http://en.climate-data.org/. [26]
Table 2.
Analysis of variance for effects of rearing temperature and climate of origin on vg expression.
Table 2.
Analysis of variance for effects of rearing temperature and climate of origin on vg expression.
| Χ2 | df | p | |
|---|---|---|---|
| Adult | |||
| Intercept | 32.6367 | 1 | <0.001 *** |
| Rearing temperature | 9.9029 | 1 | 0.001650 ** |
| Climate of origin | 19.7739 | 2 | <0.001 *** |
| Rearing temperature x climate of origin | 12.7246 | 2 | 0.001725 ** |
| wL3 wing imaginal discs | |||
| Intercept | 1.4627 | 1 | 0.2265 |
| Rearing temperature | 0.0066 | 1 | 0.9354 |
| Climate of origin | 0.3989 | 2 | 0.8192 |
| Rearing temperature x climate of origin | 1.4034 | 2 | 0.4957 |
| wL3 brains | |||
| Intercept | 19.8352 | 1 | <0.001 *** |
| Rearing temperature | 2.0164 | 1 | 0.1556 |
| Climate of origin | 1.6951 | 2 | 0.4285 |
| Rearing temperature x climate of origin | 1.0706 | 2 | 0.5855 |
Significance of fixed effects was estimated using Type III Wald Chi-square tests. ** p < 0.01, *** p < 0.001; three climates of origin were considered in the analysis: cold-temperate, warm-temperate, and tropical. Rearing temperature, climate of origin as well as their interaction were treated as fixed effects factors, and population as a random effects factor.
Table 3.
Fold-changes in gene expression between rearing temperatures in adult D. melanogaster.
| Gene | Gene Expression Ratio 17/28 °C | |||||
|---|---|---|---|---|---|---|
| Sweden (SU) | The Netherlands (NL) | France (FR) | Rwanda (RG) | Zimbabwe (ZK) | Zambia (ZI) | |
| vg | 1.76 * | 1.82 | 2.28 ** | 1.88 ** | 3.68 ** | 3.02 ** |
| Aats-asp | 1.15 | 1.52 | 0.90 | 0.92 | 1.01 | 1.17 |
Statistical testing included t-tests and correction for multiple testing. * p < 0.05, ** p < 0.01 (FDR = 0.05).
© 2019 by the authors. Licensee MDPI, Basel, Switzerland. This article is an open access article distributed under the terms and conditions of the Creative Commons Attribution (CC BY) license (http://creativecommons.org/licenses/by/4.0/).
Share and Cite
MDPI and ACS Style
Voigt, S.; Erpf, A.C.; Stephan, W. Decreased Temperature Sensitivity of Vestigial Gene Expression in Temperate Populations of Drosophila melanogaster. Genes 2019, 10, 498. https://doi.org/10.3390/genes10070498
AMA Style
Voigt S, Erpf AC, Stephan W. Decreased Temperature Sensitivity of Vestigial Gene Expression in Temperate Populations of Drosophila melanogaster. Genes. 2019; 10(7):498. https://doi.org/10.3390/genes10070498
Chicago/Turabian StyleVoigt, Susanne, Anna Christina Erpf, and Wolfgang Stephan. 2019. "Decreased Temperature Sensitivity of Vestigial Gene Expression in Temperate Populations of Drosophila melanogaster" Genes 10, no. 7: 498. https://doi.org/10.3390/genes10070498
Note that from the first issue of 2016, this journal uses article numbers instead of page numbers. See further details here.