Article

First Record of Comparative Plastid Genome Analysis and Phylogenetic Relationships among Corylopsis Siebold & Zucc. (Hamamelidaceae)

1
Division of Forest Biodiversity, Korea National Arboretum, Pocheon 11186, Republic of Korea
2
Graduate School of Human and Environmental Studies, Kyoto University, Kyoto 606-8501, Japan
3
Division of Garden and Plant Resources, Korea National Arboretum, Pocheon 11186, Republic of Korea
*
Author to whom correspondence should be addressed.
Genes 2024, 15(3), 380; https://doi.org/10.3390/genes15030380
Submission received: 29 February 2024 / Revised: 15 March 2024 / Accepted: 15 March 2024 / Published: 20 March 2024
(This article belongs to the Special Issue Plant Plastid Genome and Phylogenetics)

Abstract

:
Corylopsis Siebold & Zucc. (Hamamelidaceae) is widely used as a horticultural plant and comprises approximately 25 species in East Asia. Molecular research is essential to distinguish Corylopsis species, which are morphologically similar. Molecular research has been conducted using a small number of genes but not in Corylopsis. Plastid genomes of Corylopsis species (Corylopsis gotoana, Corylopsis pauciflora, and Corylopsis sinensis) were sequenced using next-generation sequencing techniques. Repeats and nucleotide diversity that could be used as DNA markers were also investigated. A phylogenetic investigation was carried out using 79 protein-coding genes to infer the evolutionary relationships within the genus Corylopsis. By including new plastomes, the overall plastid genome structure of Corylopsis was similar. Simple sequence repeats of 73–106 SSRs were identified in the protein-coding genes of the plastid genomes, and 33–40 long repeat sequences were identified in the plastomes. The Pi value of the rpl33_rps18 region, an intergenic spacer, was the highest. Phylogenetic analysis demonstrated that Corylopsis is a monophyletic group and Loropetalum is closely related to Corylopsis. C. pauciflora, C. gotoana, and C. spicata formed a clade distributed in Japan, whereas C. sinensis, C. glandulifera, and C. velutina formed a clade that was distributed in China.

1. Introduction

The genus Corylopsis Siebold & Zucc. (Hamamelidaceae), commonly known as winter haze, comprises approximately 25 species of shrubs and small trees. This genus is restricted to the Northern Hemisphere, and many are found in East Asia, including Republic of Korea, Japan, China, and Taiwan [1]. Corylopsis has the following common morphological characteristics: deciduous shrubs with stellate pubescent branches; petiolate leaves, membranous or leathery blades, ovate to orbicular, margin serrate, raceme inflorescence, usually blooming before leaves; sepals 5, persistent or deciduous; petals 5 (rarely 4), yellow, ovate to spathulate [1,2]. Corylopsis species are commonly used as ornamental plants because of their attractive, yellow-flowered racemes in early spring [3]. In addition, it is used as a medicinal material; for example, C. coreana decreases the factor-induced generation of reactive oxygen species, and C. sinensis contains bergenin, which is a traditional Chinese medicinal material [3,4,5,6].
The classification of Corylopsis is controversial among botanists. In 1930, Harms suggested the intrageneric classification of the genus Corylopsis for the first time [1]. He divided the genus into five sections (Henryanae, Multiflorae, Pauciflorae, Spicatae, and Manipurenses) based on morphological characteristics, such as whether the ovary and hypanthium are fused, petal number, and nectary shape and number [1]. However, a heterogeneous section existed because the relationships between Corylopsis species that were more phenotypically similar could not be identified. Morley and Chao [1] explained that Corylopsis was divided into two groups, the Himalayan and Chinese, which were subdivided into continental and offshore groups. Furthermore, they provided a description, a new classification, and, by extension, a key to Corylopsis. In 2008, Yamanaka et al. [7] described the morphological characteristics of four species of Corylopsis distributed in Japan. The suggested morphological traits included leaf blades, inflorescences, stamens, stigmas, and staminodes. The identification of target species formed through morphological traits is often difficult, and recent phylogenetic analyses using molecular data, especially plastid genomes, are in progress [8,9,10,11,12].
Plastids, which are semi-autonomous organelles in plants, participate in the processes of photosynthesis and biosynthesis and range in size from 120 to 160 kb in general land plants [13,14,15]. The typical structure of the plastid genome consists of four parts in which two inverted repeats (IRs) divide the boundary between the large single-copy (LSC) and small single-copy (SSC) regions. Due to the high conservation of plastid protein-coding gene composition, reconstructing phylogenetic relationships among taxa is essential [16,17,18]. Furthermore, it is useful for inferring biogeography, molecular evolution, and age estimation [19,20]. With the development of next-generation sequencing (NGS), genomic data can be obtained quickly and easily. Consequently, more genes can be used for phylogenetic analysis, and the relationships between taxa can be reconstructed through high-resolution analysis.
As the morphological characteristics of Corylopsis species are similar and difficult to distinguish, molecular phylogenetic studies on this genus are necessary. Although Wang et al. [3] reconstructed the phylogenetic relationships of Hamamelidaceae using the plastid genome, the detailed phylogenetic relationships within the genus Corylopsis are unknown. Currently, the plastomes of seven species in the genus Corylopsis are registered in GenBank [3,21,22,23,24,25]. In this study, we aimed to (1) construct an unknown plastid genome of three species of Corylopsis to identify the phylogenetic relationships within Hamamelidaceae, (2) investigate repeats to propose DNA markers, and (3) perform a comparative examination of the plastid genome of Corylopsis and assess the phylogenetic associations.

2. Materials and Methods

2.1. Plant Material and DNA Extraction

Fresh leaves of C. gotoana, C. pauciflora, and C. sinensis were collected from fields in Japan, the Republic of Korea, and China (Table S1). All voucher specimens were deposited in the Herbarium of Korea National Arboretum with the collection numbers coryJ4 (C. gotoana), ESK22-086 (C. pauciflora), and coryc-2 (C. sinensis). After the leaves were dried with silica gel, the total genomic DNAs were extracted using a DNeasy Plant Mini Kit (Qiagen Inc., Valencia, CA, USA).

2.2. Genome Assembly and Annotation

A DNA library with an insert size of 550 bp was prepared, and next-generation sequencing (NGS) was performed using the Illumina MiSeq sequencing system at Macrogen Inc. (Seoul, Republic of Korea). Total raw reads were imported and trimmed with a 2% error probability limitation using Geneious Prime ver. 2019.0.4 to remove poor-quality reads [26]. The processed reads were assembled through ‘map to reference’ with C. coreana (GenBank accession no. NC_040141), which was used as a reference. Reads that were assembled into the reference genome were subjected to De novo assembly to create a scaffold contig. De novo assembly was conducted to reassemble the contigs using Geneious Prime [26]. The gene content and order were annotated using the Geseq tool and Geneious Prime [26,27].

2.3. Comparative Plastid Genome Analysis of Corylopsis

Ten plastid genomes of Corylopsis, three plastid genomes produced in this study, and seven plastid genomes provided by GenBank were compared. Using Geneious Prime ver. 2019.0.4, the GC content was calculated and compared. The mVISTA program in LAGAN mode was employed to analyze the entire plastome sequences of Corylopsis, with the annotation of C. coreana (GenBank accession no. NC_040141.1) as the reference [28,29]. IRscope was used to compare and illustrate the boundaries of inverted repeat (IR) and single copy (SC) sequences for Corylopsis species [30]. Relative synonymous codon usage (RSCU) for the CDS of the 10 Corylopsis cp genomes was calculated using DAMBE v 7.3.32 [31]. When RSCU > 1, this codon is used at higher frequencies than expected, and RSCU < 1 indicates the opposite. In addition, only genes in the IRA that were repeated in the IR regions were used.

2.4. Repeats and Nucleotide Diversity Analysis

Simple sequence repeats (SSRs) within Corylopsis were identified using MicroSAtellite ver. 2.1 (MISA). [32,33]. For MISA, we set the following parameters: ten for mononucleotides, five for dinucleotides, four for trinucleotides, and three for tetra-, penta-, and hexanucleotide SSR motifs. Long repeat analysis was conducted using the REPuter software with the following parameters: a minimal repeat size of 30 bp and a Hamming distance of 3 [34]. The nucleotide diversity (Pi) of cp genomes was examined using the DnaSP v. 6.0 program, which analyzed aligned sequences from 10 Corylopsis plastid genomes [35,36]. Pi values were calculated using a window length of 100 bp and a step size of 25 bp.

2.5. Phylogenetic Analyses

To investigate the phylogenetic relationships within Corylopsis, including the three newly sequenced plastid genomes, 20 cp genome sequences were obtained from NCBI. Liquidambar styraciflua (GenBank accession No. NC_046938) and Liquidambar orientalis (GenBank accession no. NC_046937) were designated as the outgroups. For phylogenetic analysis, 79 protein-coding genes were extracted and aligned using MAFFT ver. 7.313 with the default alignment parameters of the Phylosuite ver. 1.2.2 program [35,37]. The gaps present in the data were considered as missing values. Maximum parsimony (MP), maximum likelihood (ML), and Bayesian inference (BI) methods were used to analyze phylogenetic relationships. The MP analysis was performed using PAUP* v4.0a with equally weighted and unordered characters [38]. A heuristic search was employed to select the most parsimonious trees, which involved branch-swapping, tree bisection-reconnection (TBR), and MulTrees, allowing ten trees to be retained at each step. Bootstrap analyses comprising 1000 pseudoreplicates were performed to determine individual support values for each clade.
ModelFinder was used to determine the best model for ML and BI analyses. The best model for the concatenated data was GTR+F+I+G4, chosen according to Akaike’s information criterion (AIC) [39]. ML analysis was performed with 5000 replicates of ultrafast bootstrapping using the IQ-TREE web server [40]. MrBayes v3.2.6 was used for BI analysis [41]. Markov chain Monte Carlo (MCMC) algorithms were run for two million generations and sampled every 100 generations. In total, 25% of the generations were discarded as burn-ins. In Phylosuite, ML and BI analyses were performed using programs like ModelFinder, IQ-TREE, and MrBayes [37]. The phylogenetic trees were visualized using FigTree v1.4.4 (http://tree.bio.ed.ac.uk/software/figtree/ (accessed on 7 Decemeber 2023)).

3. Results

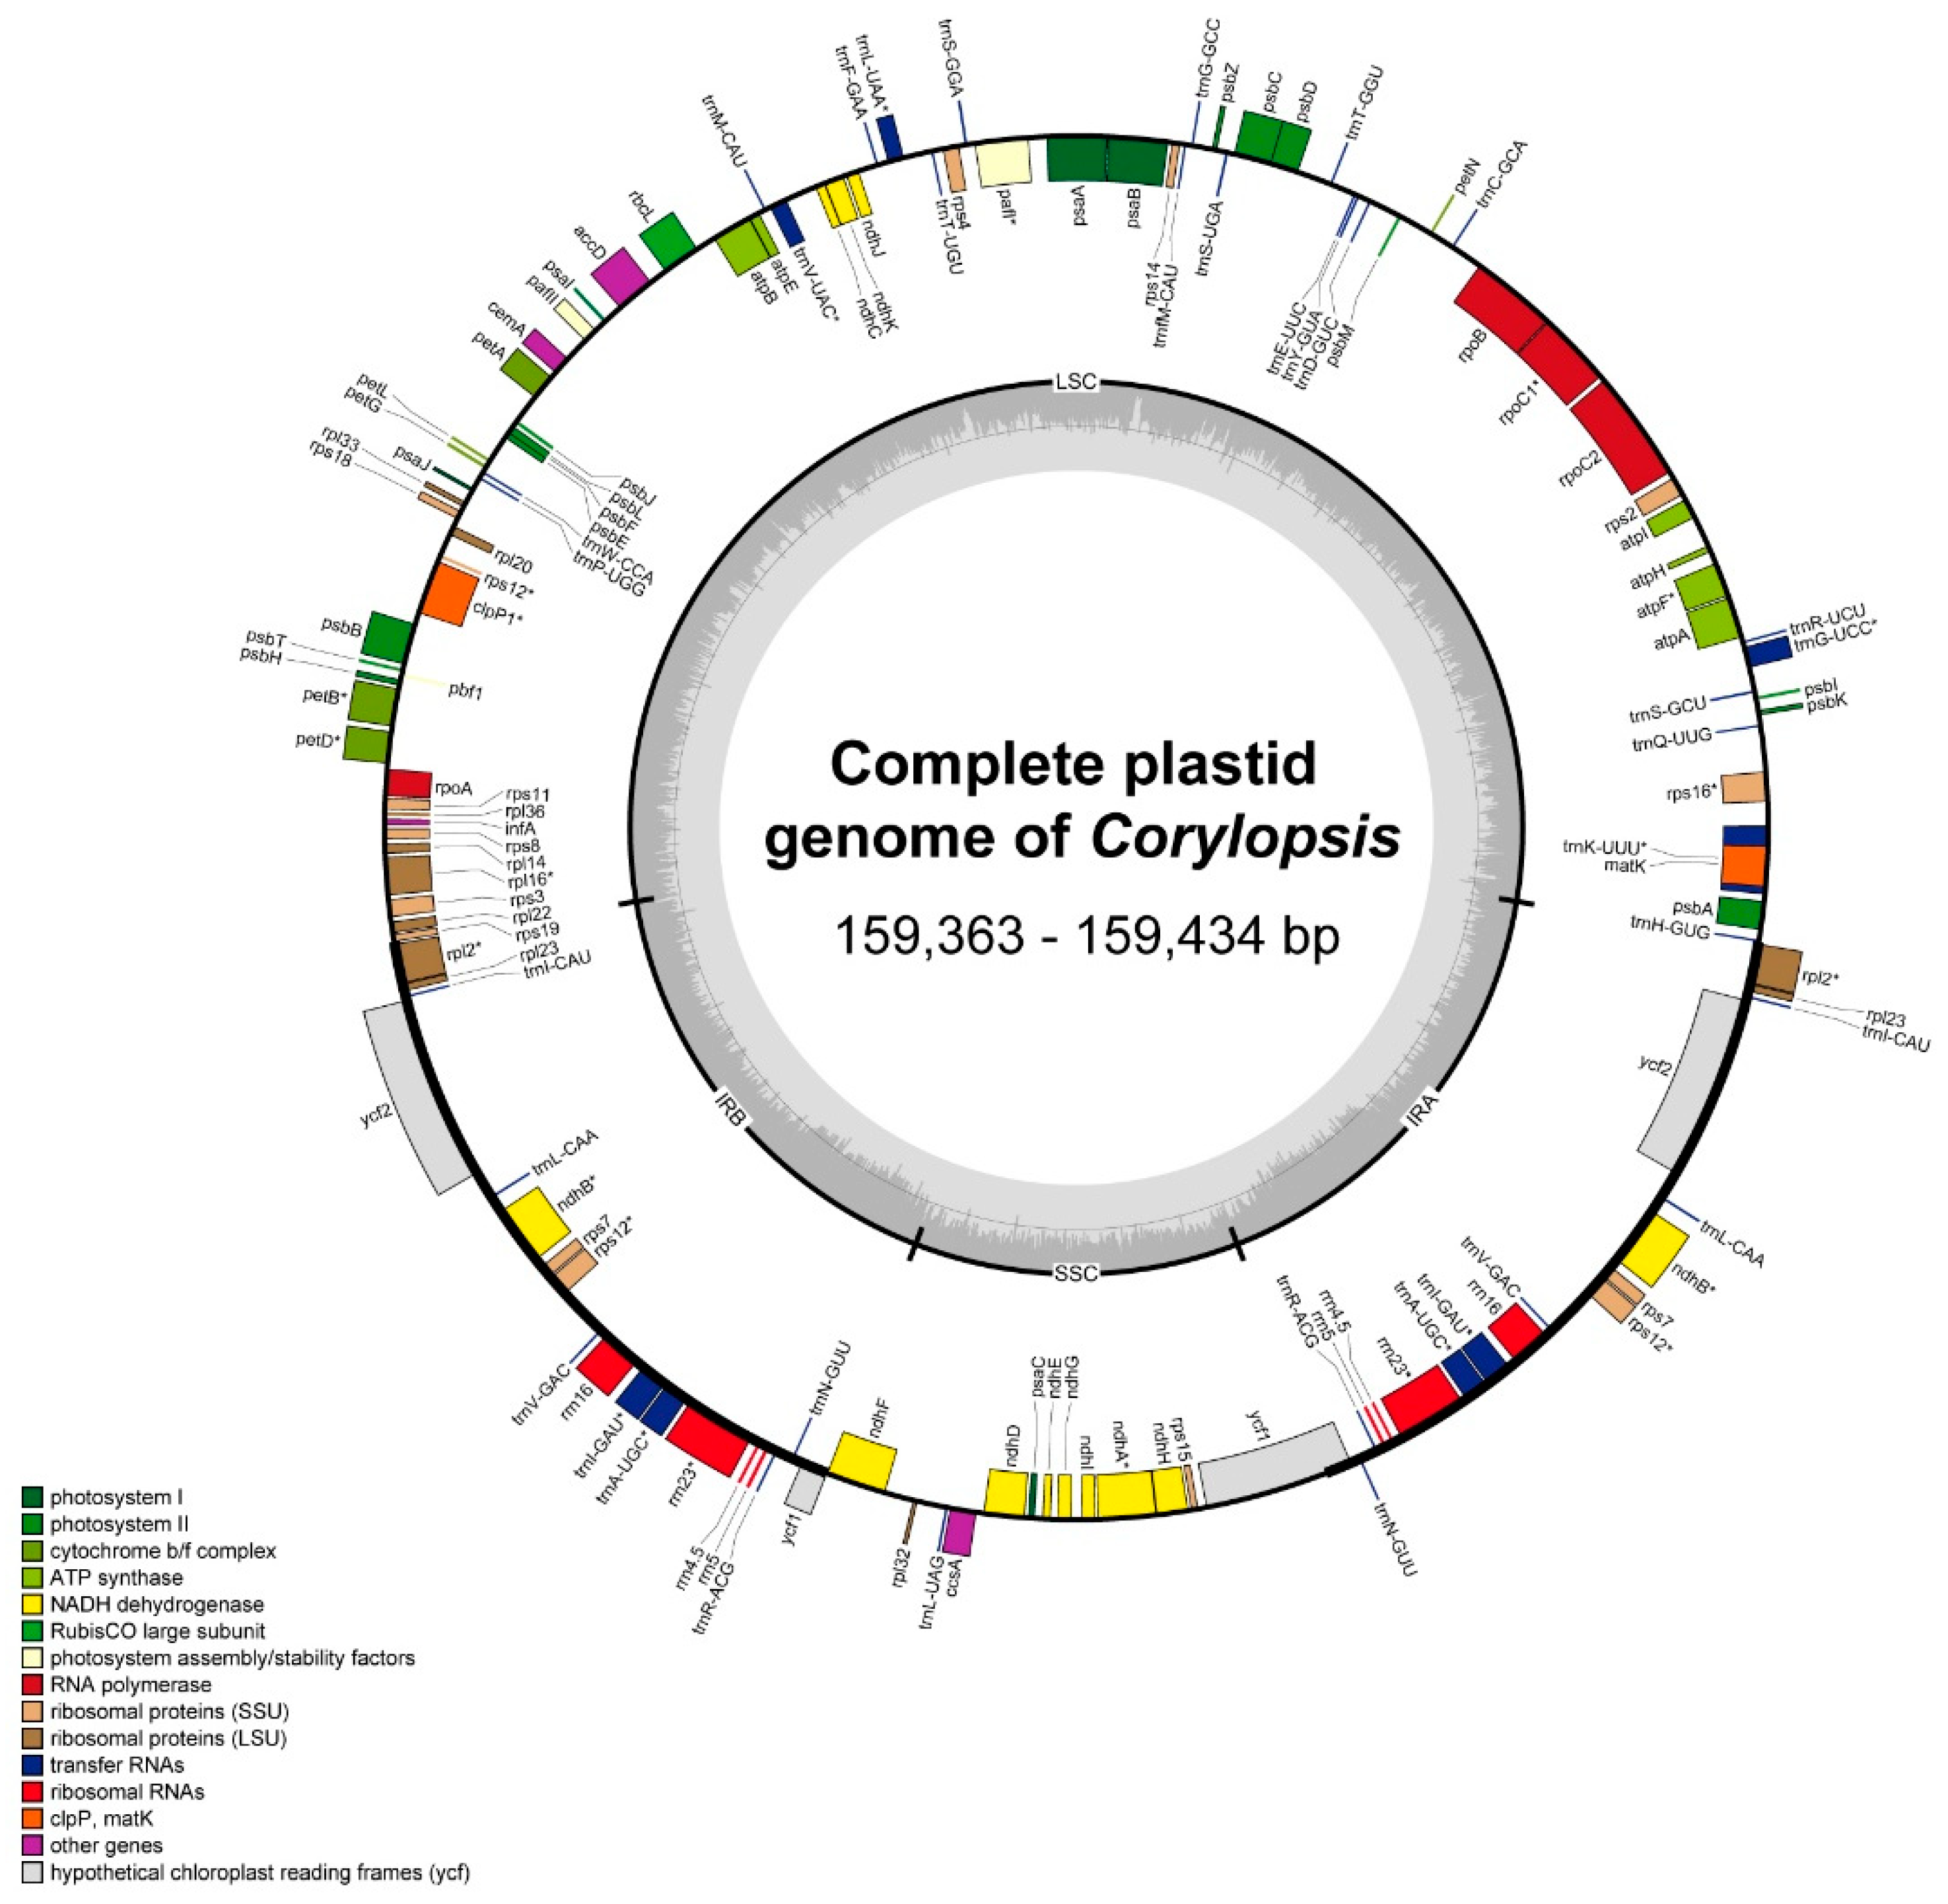
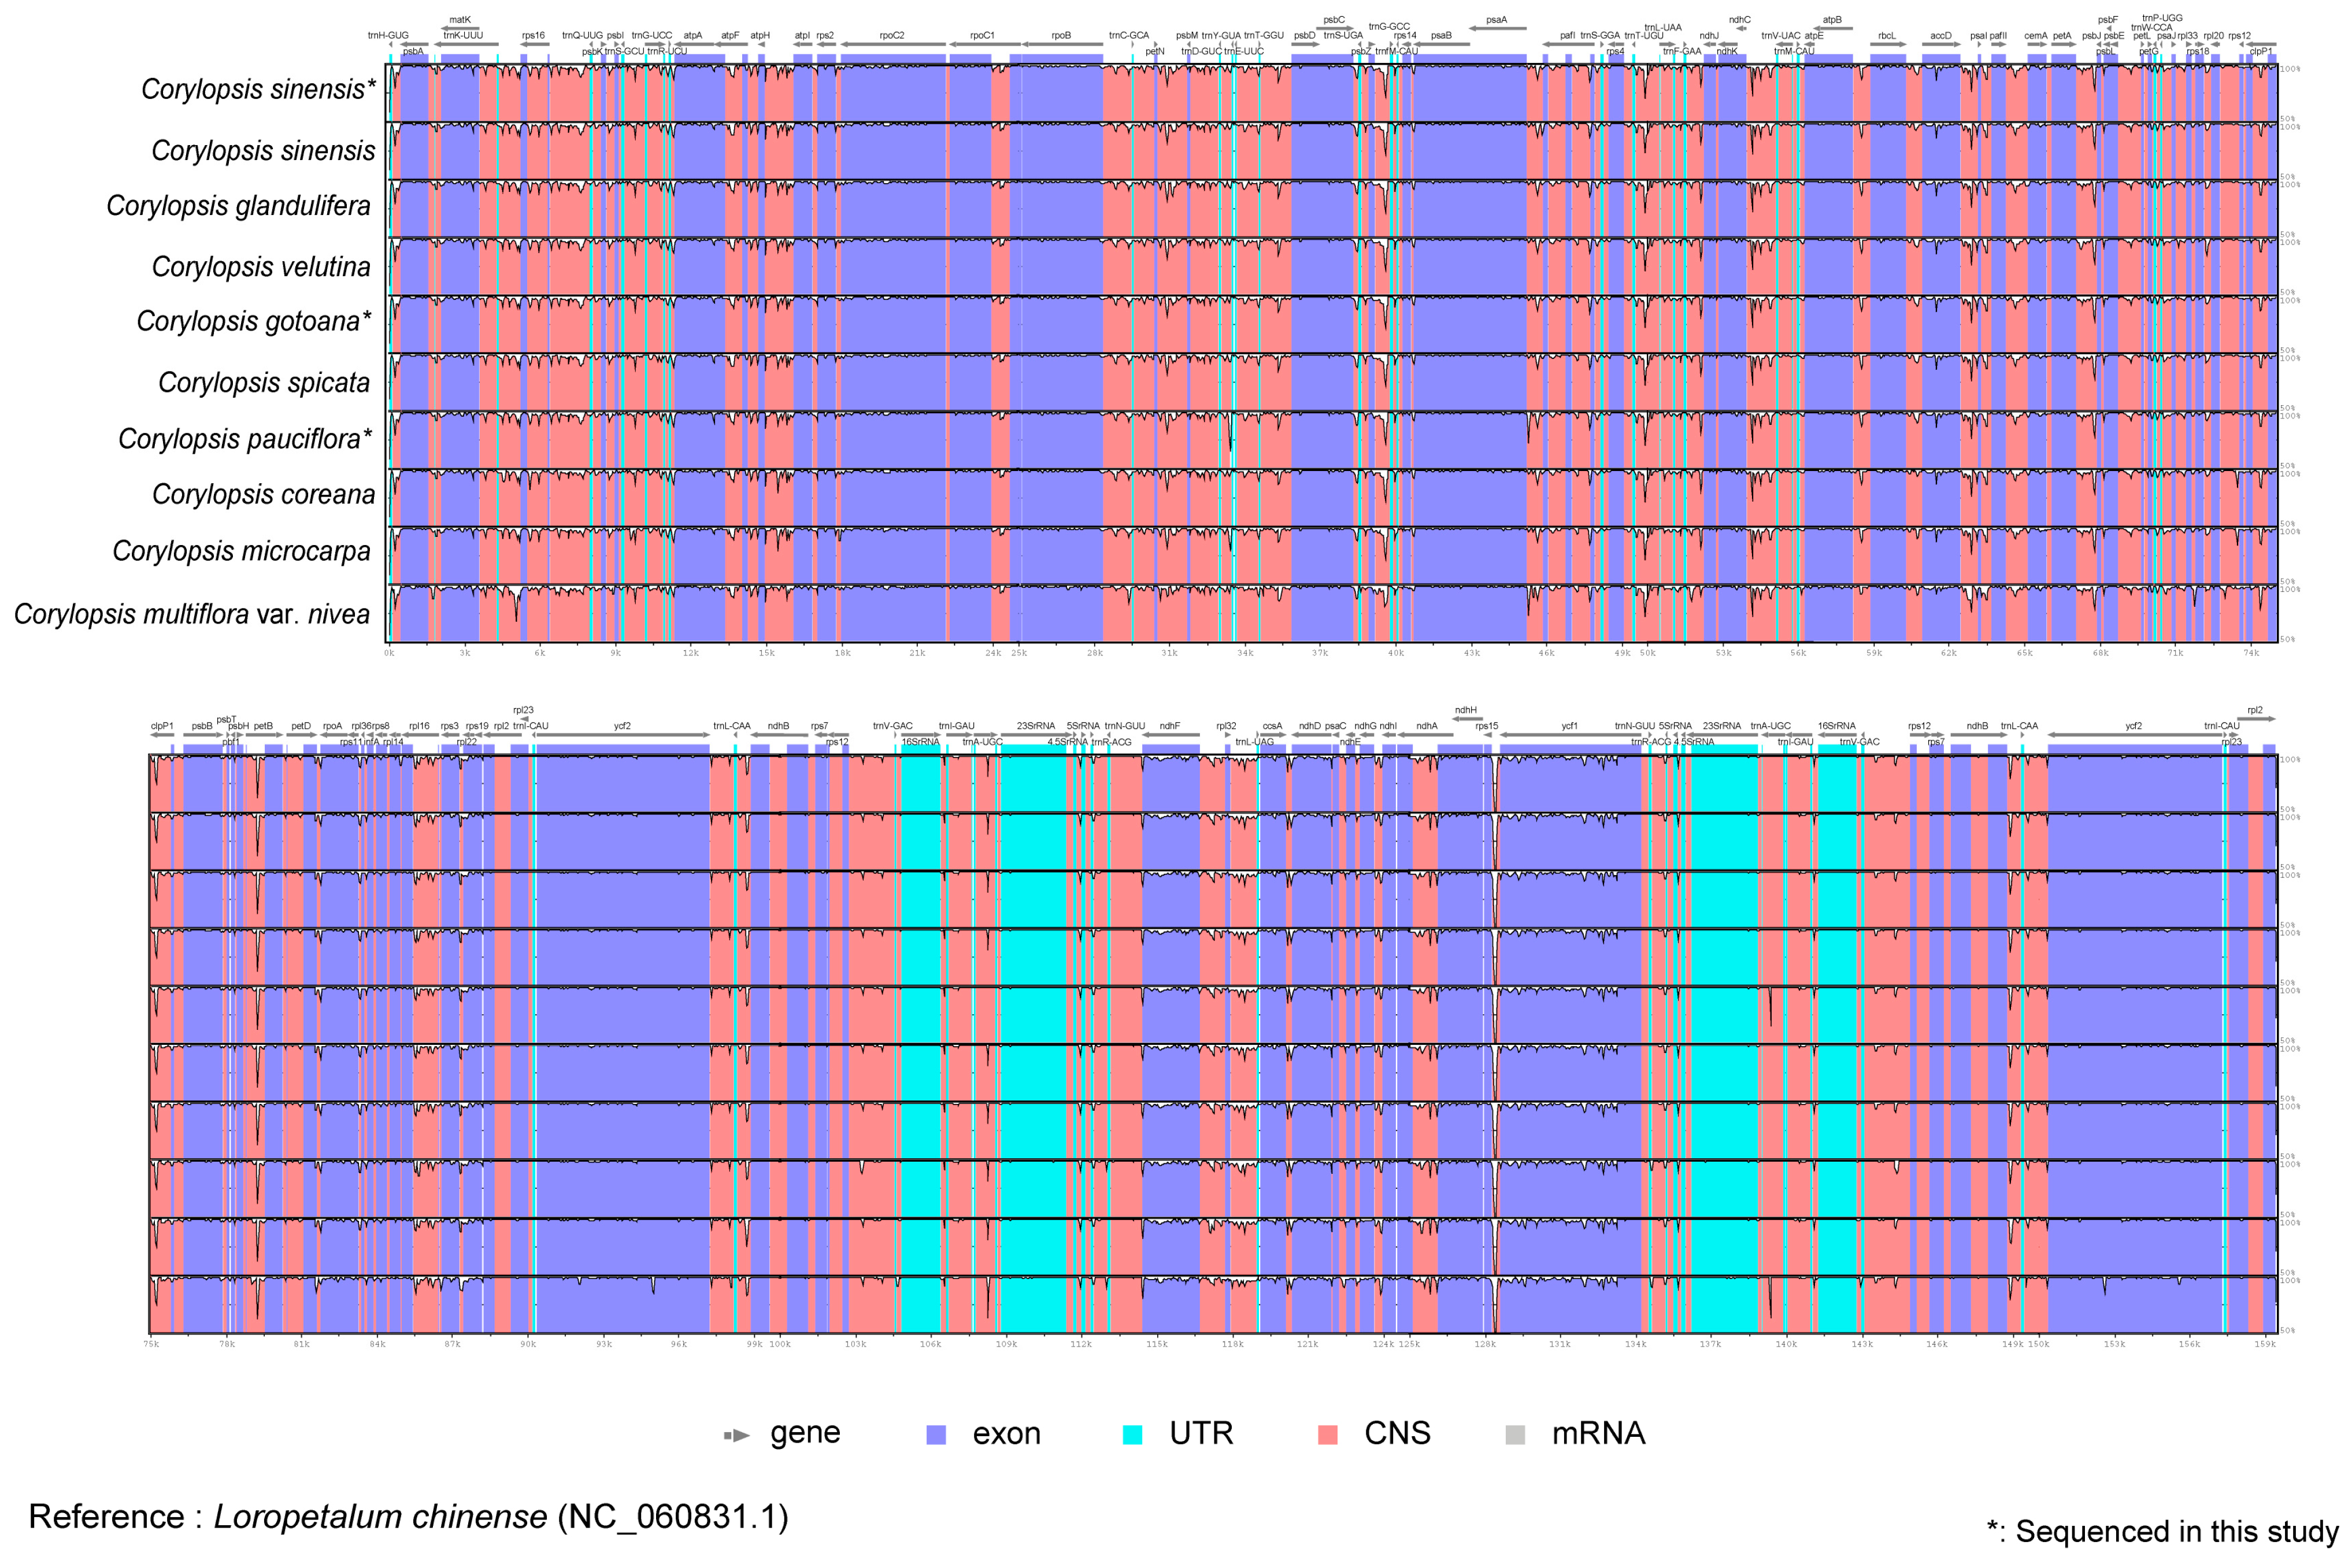
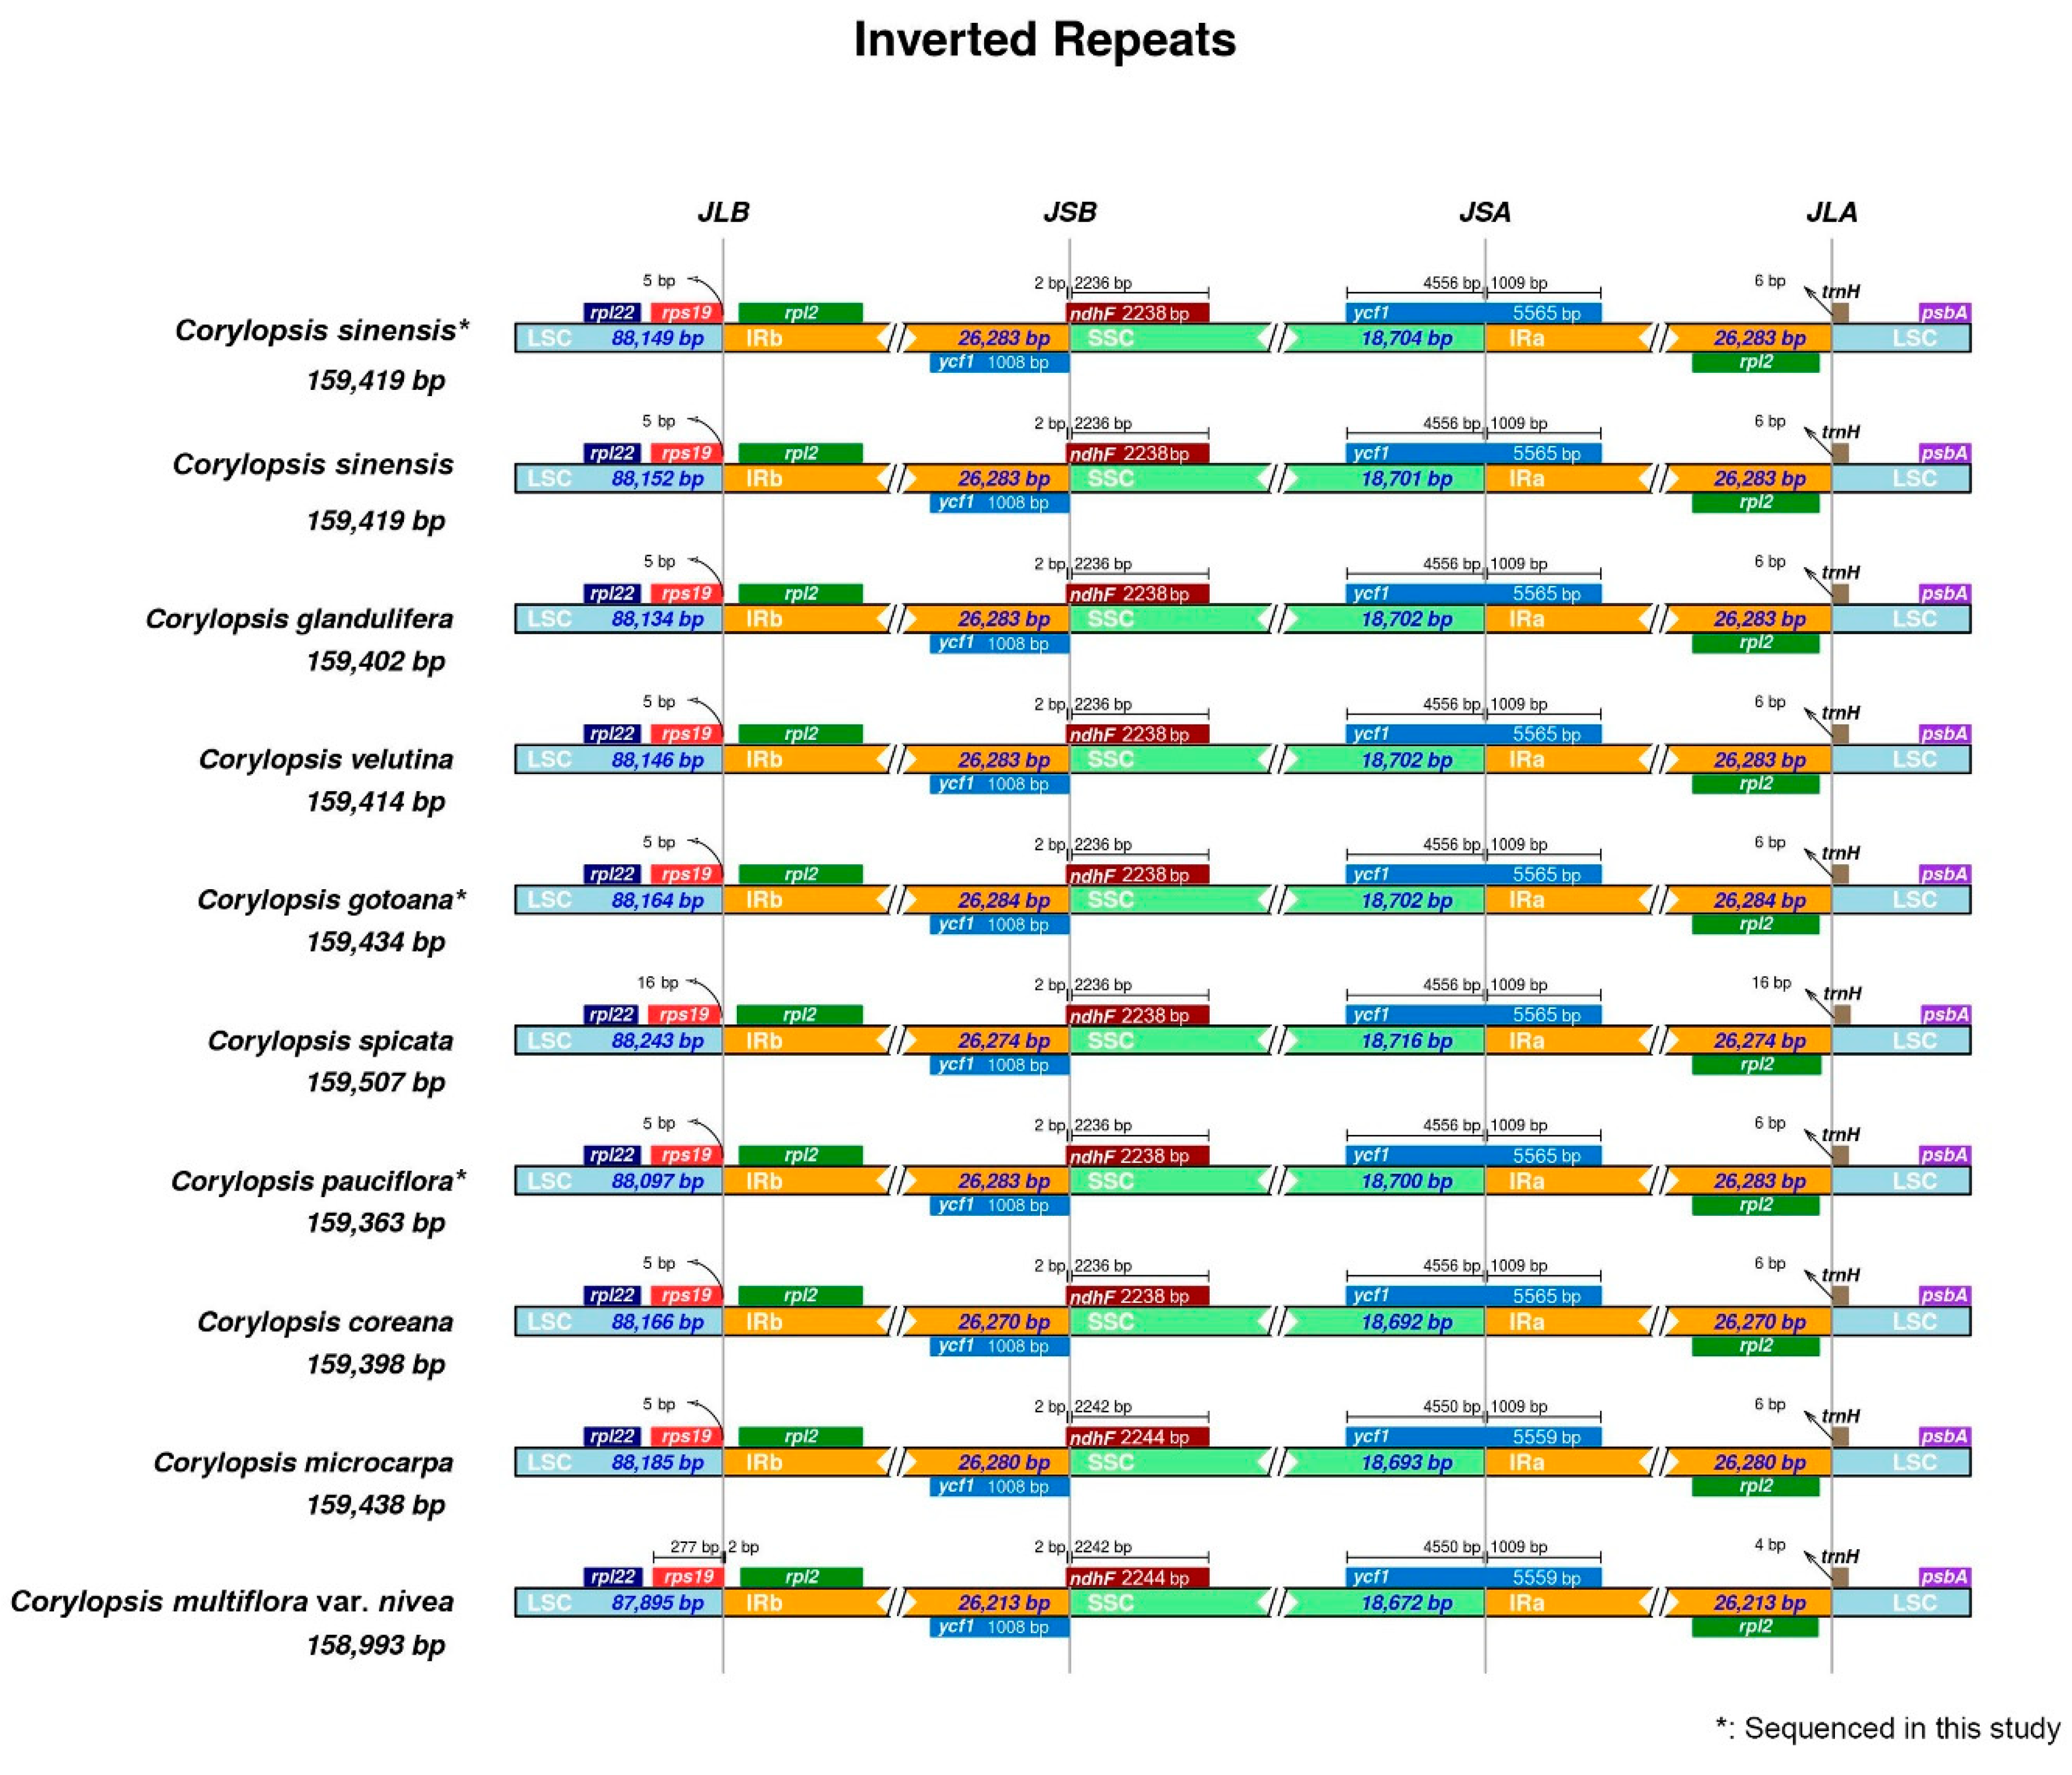
3.1. Plastid Genome Structure and Comparative Analysis of Corylopsis

Three plastid genomes of Corylopsis were obtained using NGS. The sequenced genomes had a quadripartite structure common to angiosperms, ranging from 159,363 bp (C. pauciflora) to 159,434 bp (C. gotoana) (Figure 1 and Figure S1). Ten plastid genomes of Corylopsis species produced in this study and from GenBank were obtained and analyzed. Among the Corylopsis species, the length of C. multiflora var. nivea was the smallest (158,993 bp), and C. spicata was the largest (159,507 bp) (Table 1). The overall GC contents of all Corylopsis were distinct at 38.0% (LSC, SSC, and IR were 36.1%, 32.6–32.7%, and 43.1%, respectively). The plastid genomes of the Corylopsis species contained 79 protein-coding genes, 30 tRNAs, and 4 rRNA genes (Table S2). Among these genes, 15 (atpF, ndhA, ndhB, petB, petD, rpl2, rpl16, rpoC1, rps16, trnA-UGC, trnG-UCC, trnI-GAU, trnK-UUU, trnL-UAA, and trnV-UAC) contained only one intron, and 3 (clpP1, pafI, and rps12) contained two introns. In addition, 17 genes (ndhB, rpl2, rpl23, rps7, rps12, ycf2, trnA-UGC, trnI-CAU, trnI-GAU, trnL-CAA, trnN-GUU, trnR-ACG, trnV-GAC, rrn16, rrn23, rrn4.5, and rrn5) were replicated in the IR regions. rps12 was recognized as a trans-spliced gene, with its 5′ end located in the LSC region and its 3′ end in the IR regions.
In the mVISTA analysis, the complete plastid genomes of the 10 species were compared to the plastids of Loropetalum chinense as a reference (Figure 2). Overall, the plastid genomes were similar and conserved. In addition, the boundaries of the IRs were investigated (Figure 3). Most genes were preserved; however, rps19 in C. multiflora var. nivea was located only at the junction between the LSC and IRb regions.
The relative synonymous codon usage (RSCU) of Corylopsis plastomes was computed using all protein-coding genes (Figure 4 and Table S3). The analysis confirmed that Corylopsis plastid genomes contained 61 codons encoding 20 amino acids. A total of 22,146–22,815 codons exist. Of the 61 codons, 29 had RSCU values greater than one. Methionine and tryptophan had a single codon. All codons had an RSCU > 1 end in the A/U at the third nucleotide position (except for UCC, which encodes Ser in C. coreana). On the other hand, out of the codons with RSCU values of one or less, only one had an A/U ending, whereas 31 codons had a G/C ending. In C. coreana, two Ser-encoding codons had a bias different from that in other species; when encoding Ser, UCC was used more often than UCA. The exact values for each species of Corylopsis are shown in Table S3.

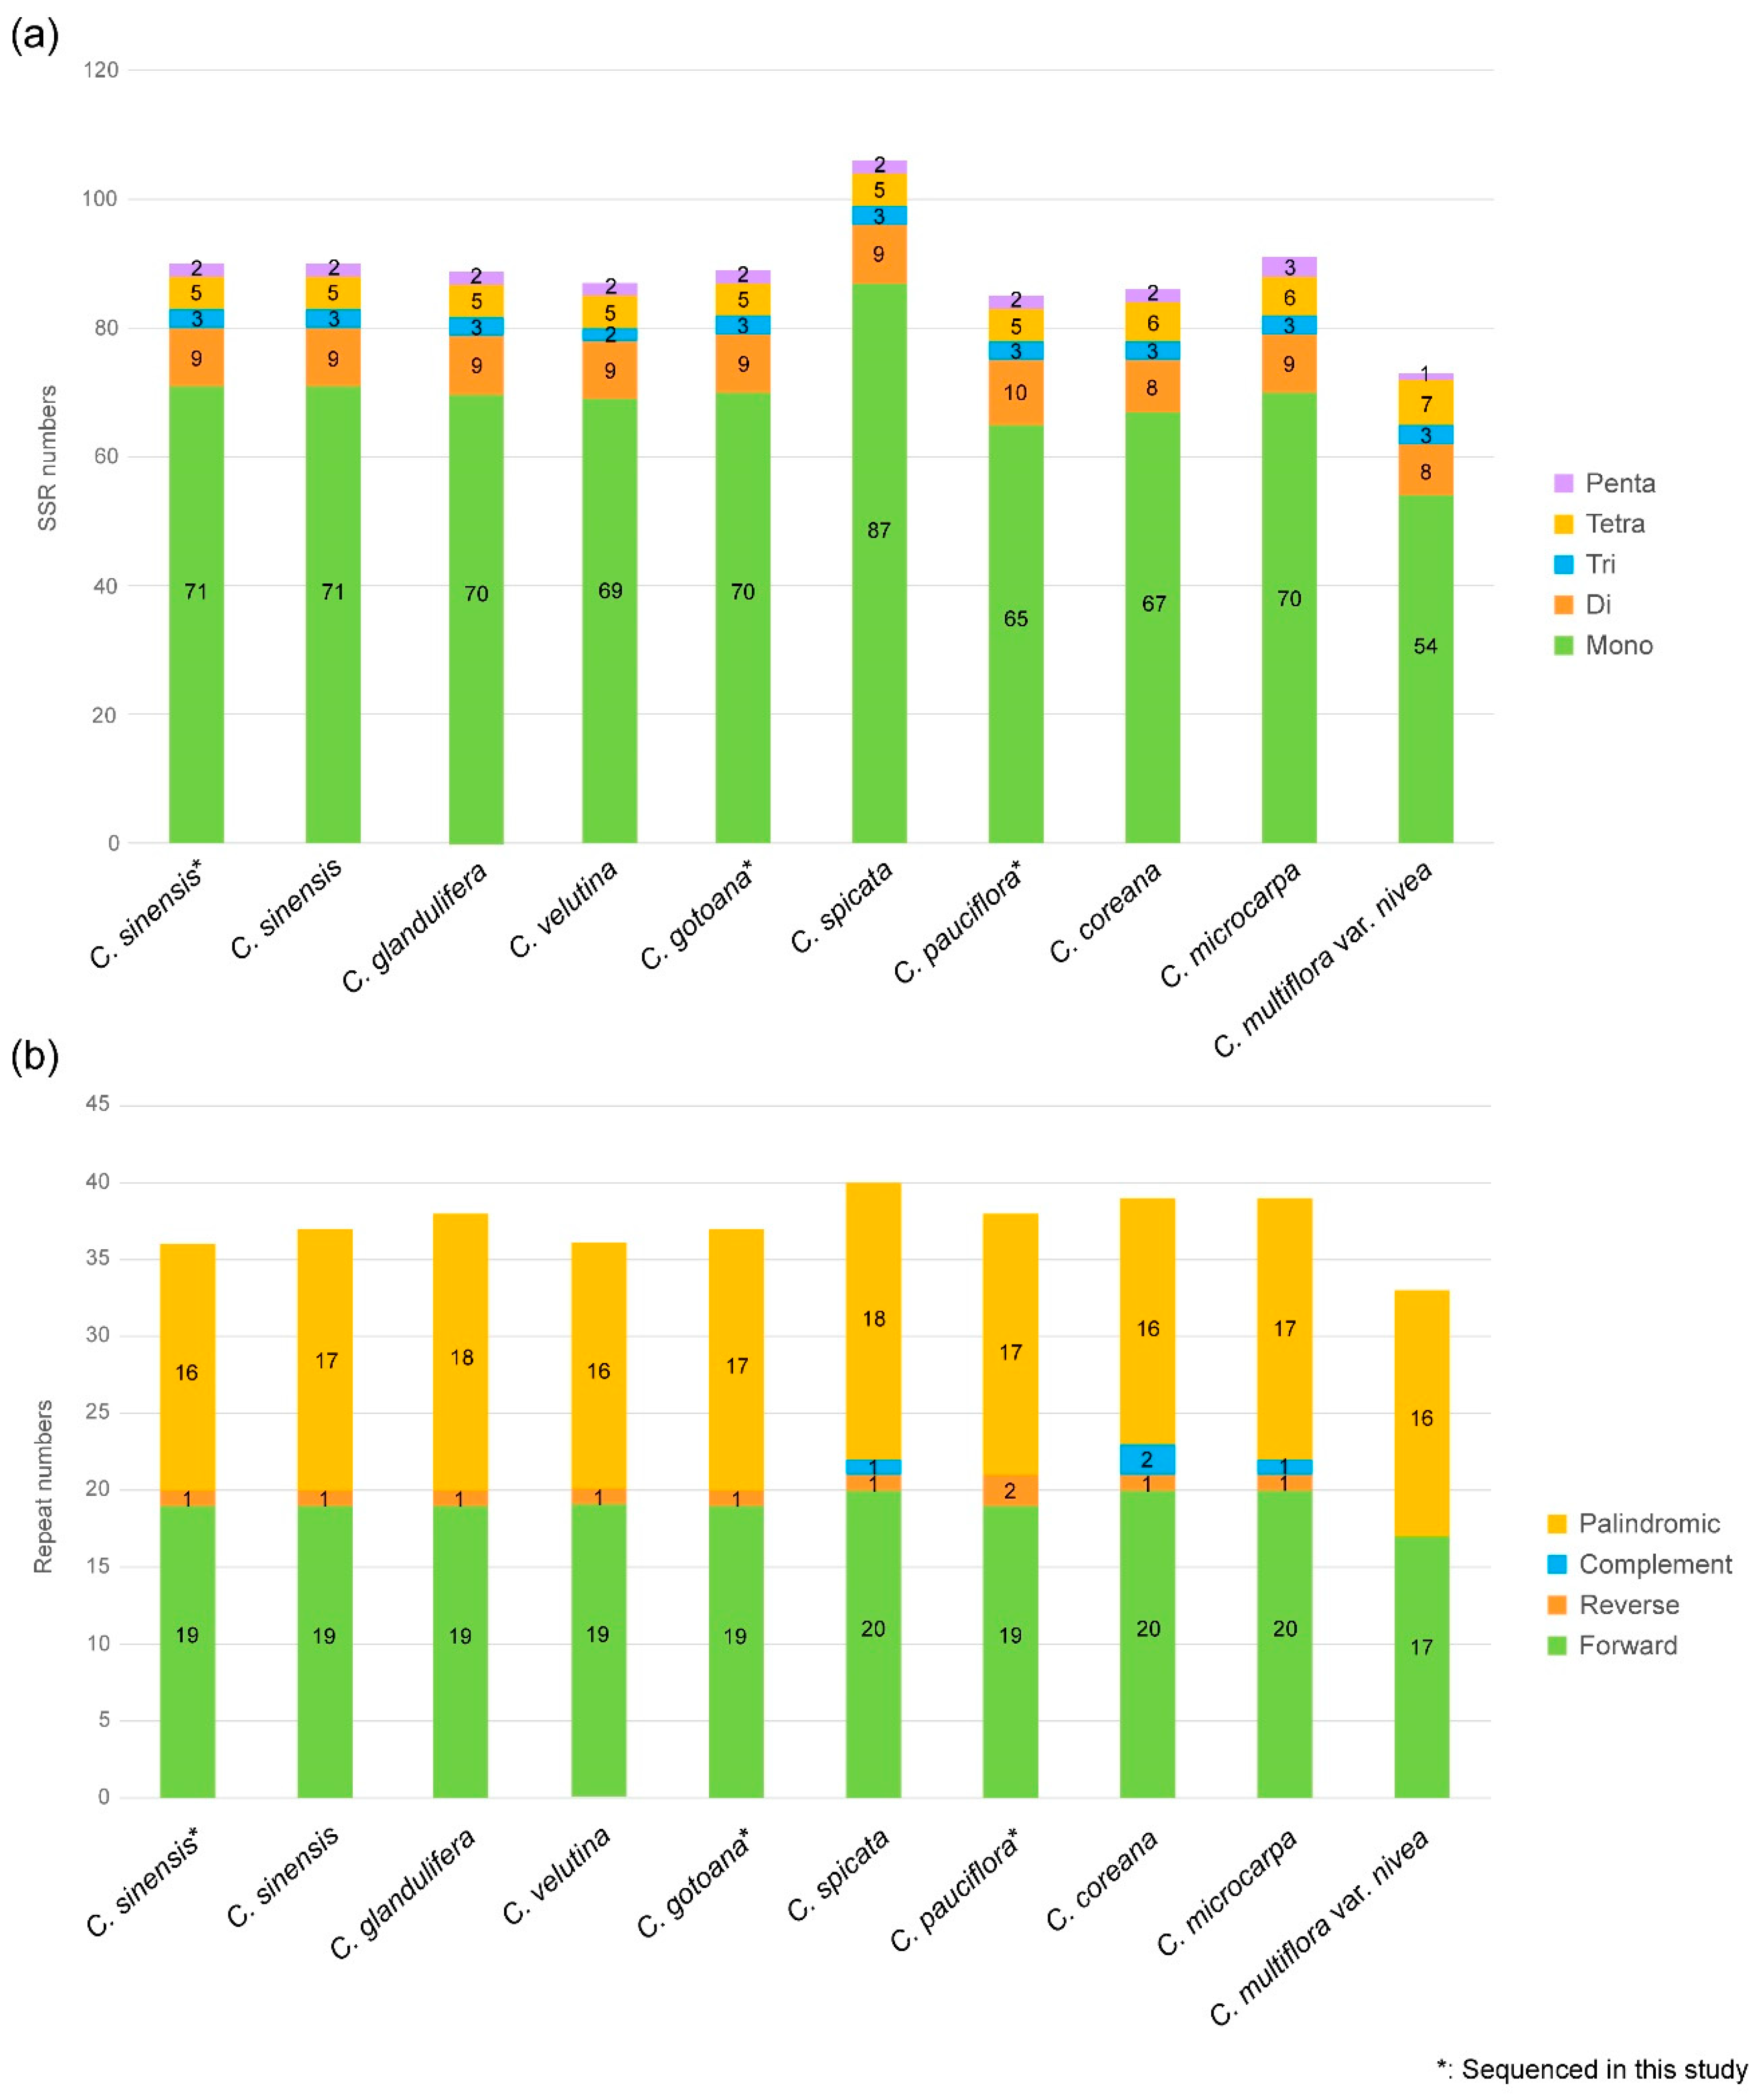
3.2. Repeat Analysis and Nucleotide Diversity Assessment

Simple sequence repeats (SSRs), also known as microsatellites, are short repeats composed of 1–6 nucleotide sequences of DNA segments within the genome. The SSRs for Corylopsis are shown in Figure 5a. As a result of the analysis, Corylopsis had 88 SSRs, and the species with the most number of SSRs was C. spicata, and C. multiflora var. nivea exhibited the lowest number of SSRs. This is because the number of mononucleotides is relatively large and small compared to that in other species. Among SSRs of Corylopsis, mononucleotides occupied the largest proportion (78.33%), most of which were A/T mononucleotides, followed by dinucleotide SSRs (10.05%), tetranucleotide SSRs (6.09%), trinucleotide SSRs (3.27%), and pentanucleotide SSRs (2.26%) (Figure 5a and Table S4).
In addition, we investigated forward, reverse, complement, and palindromic repeat sequences within the plastid genome of Corylopsis (Figure 5b and Table S5). Although the IR regions were repeated sections, the analysis results excluded them from Figure 5b. The average number of repeats in Corylopsis was 37, with a minimum of 33 repeats (C. multiflora var. nivea) and a maximum of 40 (C. spicata). Most of these were composed of forward and palindromic repeats. Complement repeats were found in only three species, C. spicata, C. coreana, and C. microcarpa, of which C. coreana had two complement repeats. Most species had one reverse repeat, whereas C. pauciflora had two reverse repeats. However, C. multiflora var. nivea confirmed the absence of reverse repeats.
To identify phylogenetically divergent hotspots, a nucleotide diversity (Pi) analysis of the complete plastid genome of Corylopsis was performed (Figure 6 and Table S6). Variable sites in the IR region were more conserved than those in the SC region. The Pi value was the highest at 0.02135 (rpl33_rps18), followed by 0.01237 (petD_rpoA), 0.00765 (trnG-GCC_trnfM-CAU), and 0.00756 (rps8_rpl14), all of which were intergenic spacers. Within the protein-coding genes, ndhE exhibited the highest Pi value (0.00327), followed by rps16 (0.003), rps19 (0.00279), and ndhF (0.00275).

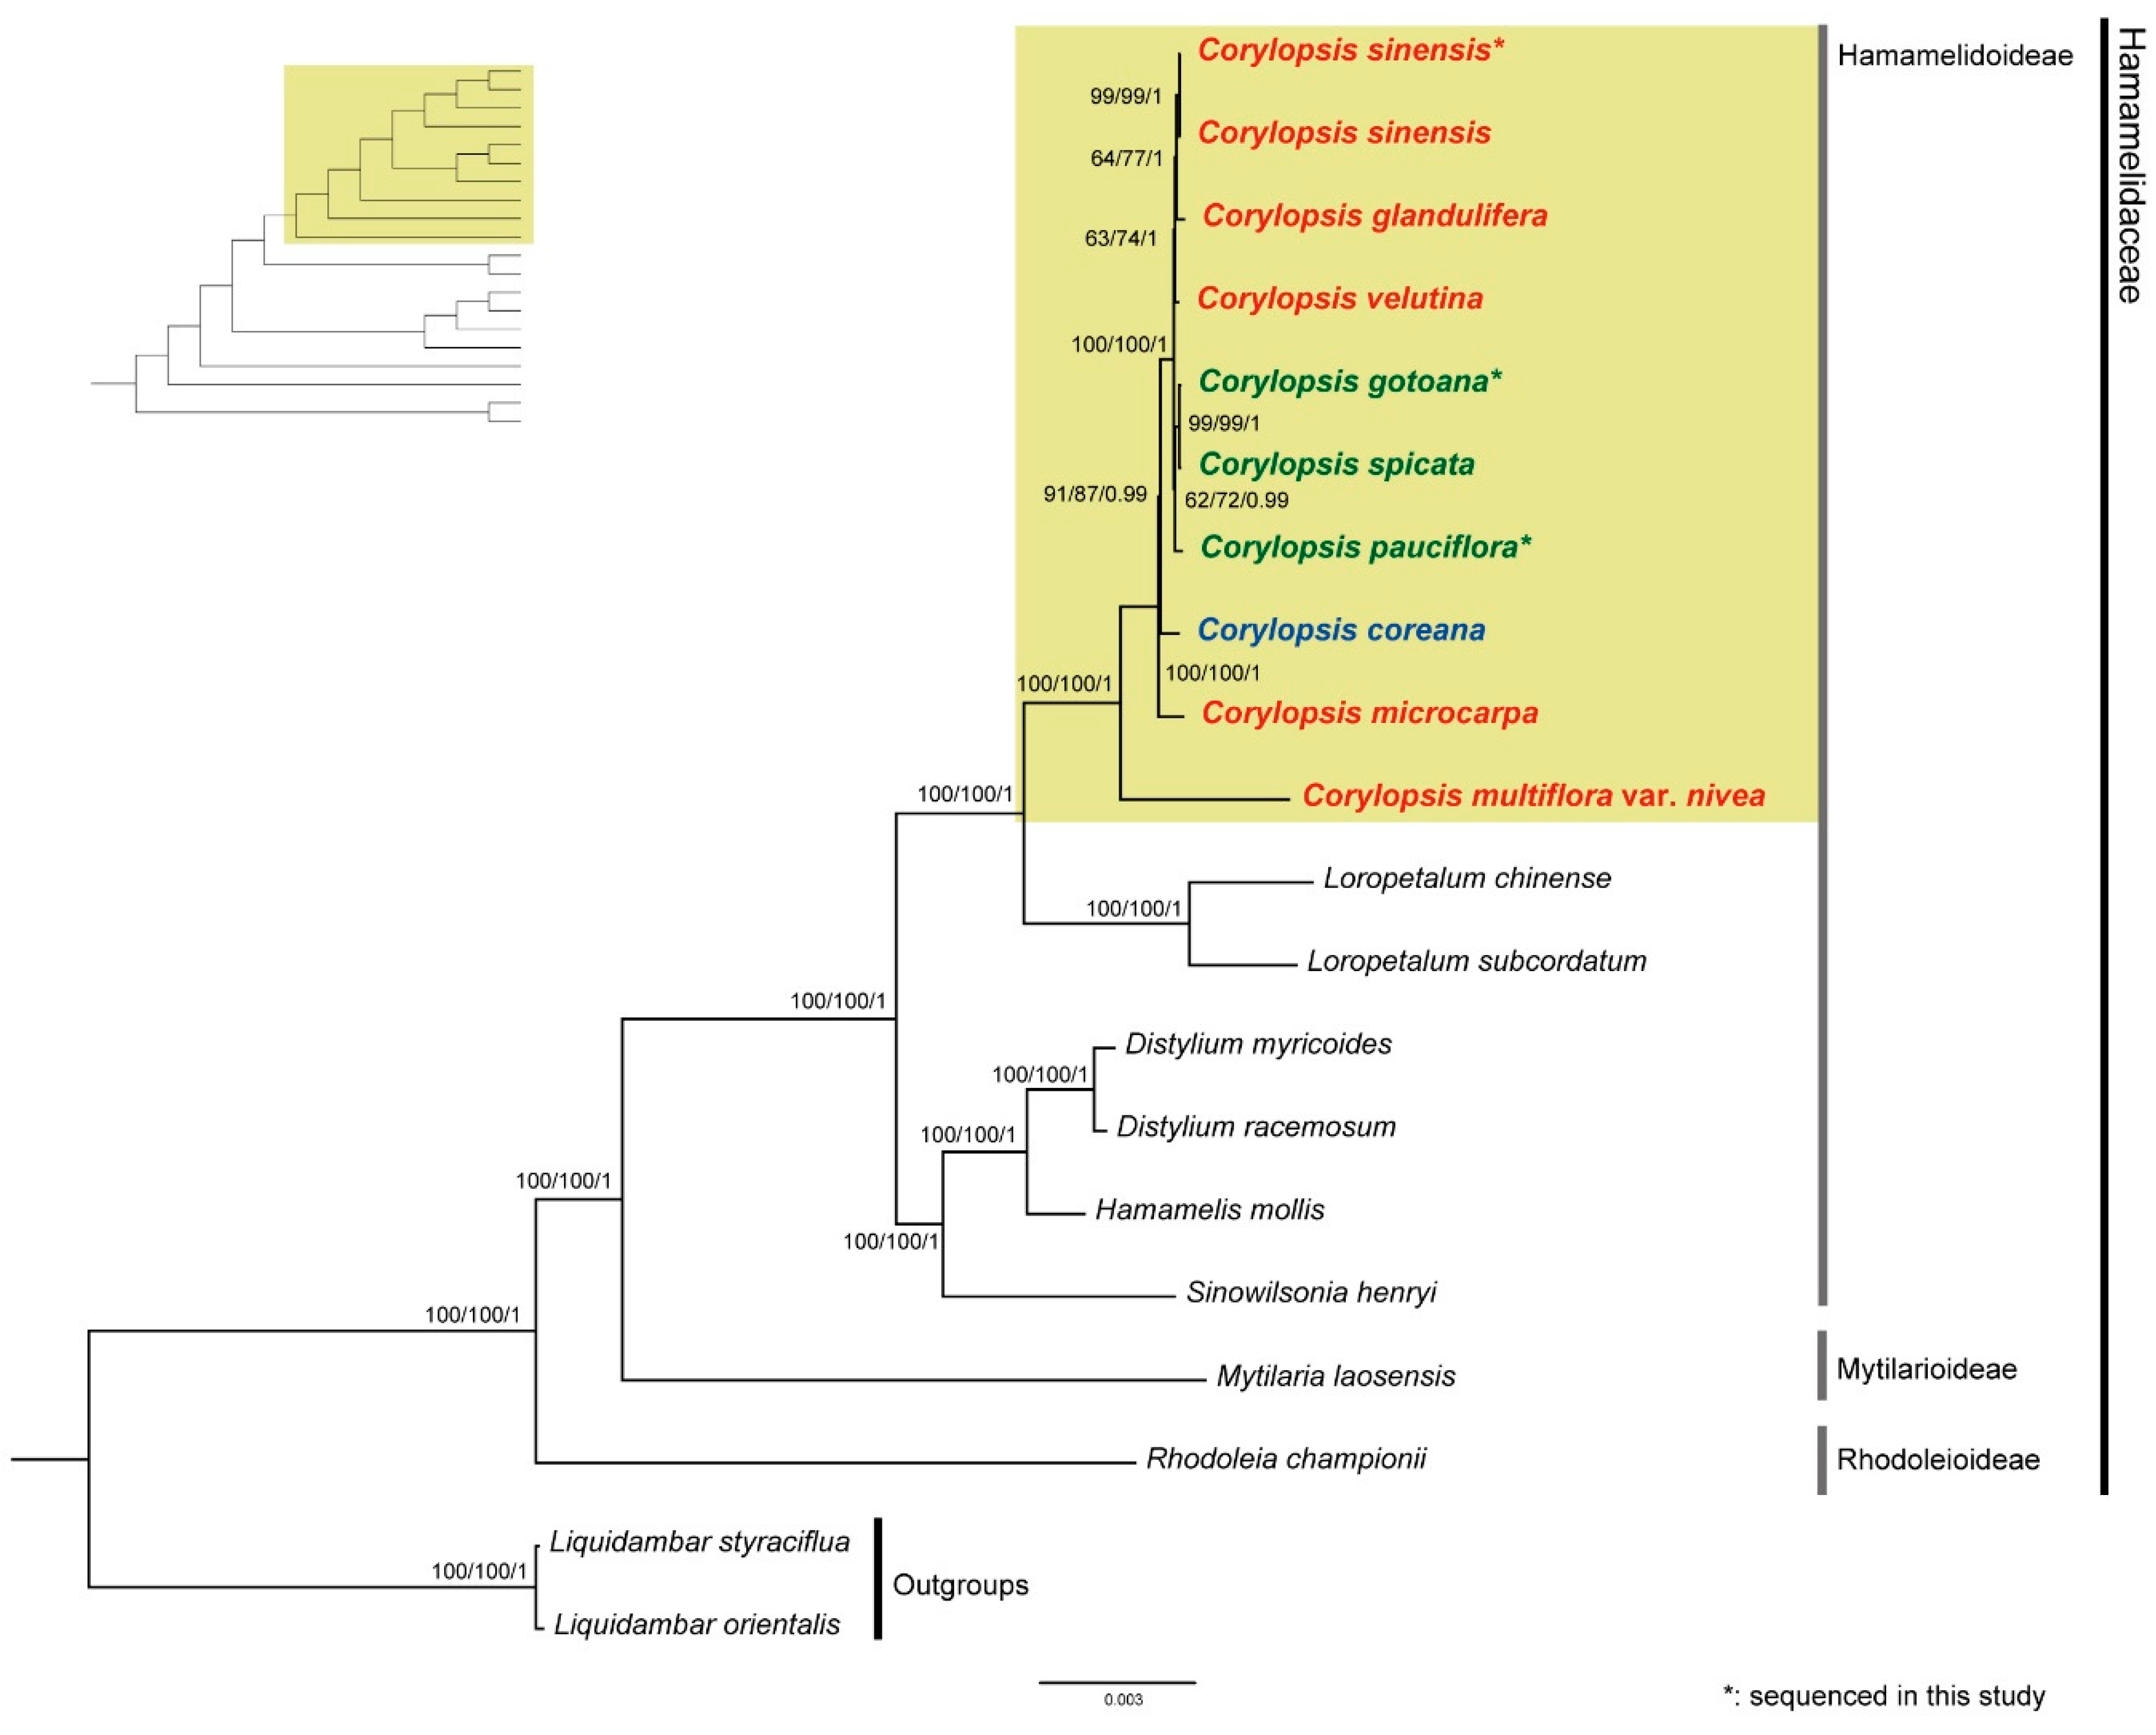
3.3. Phylogenetic Analyses of Corylopsis and Related Taxa

Phylogenetic analyses were conducted using concatenated 79 protein-coding genes, employing maximum parsimony (MP), maximum likelihood (ML), and Bayesian inference (BI) methods. Consistently, all three tree constructions displayed identical topologies, with high support values at each node.
Twenty species were used to reconstruct phylogenetic relationships within Hamamelidaceae (Figure 7). Liquidambar styraciflua and L. orientalis (Altingiaceae) were designated as outgroups. In Hamamelidaceae, Rhodoleioideae, including Rhodoleia, was sister to the remaining taxa. Hamamelidoideae, including Sinowilsonia, Hamamelis, Distylium, Loropetalum, and Corylopsis, were located in the upper clade and divided into two major clades: Sinowilsonia, Hamamelis, and Distylium, Loropetalum, and Corylopsis. The genus closest to Corylopsis was identified as Loropetalum, with a high support value.
The genus Corylopsis was monophyletic, and most nodes showed high levels of support. C. multiflora var. nivea was sister to the remaining Corylopsis, followed by C. microcarpa and C. coreana. C. pauciflora, C. spicata, and C. gotoana formed one clade, and C. pauciflora was confirmed to be the sister of the other species, with relatively weak support values in the MP and ML analyses (62 and 72, respectively). Another clade consisted of C. velutina, C. glandulifera, and C. sinensis, where C. velutina was sister to the other species.

4. Discussion

4.1. Comparison of Plastid Genomes and Characteristics of Corylopsis

Several studies have used plastid genomes to identify the characteristics of target species and comprehend phylogenetic relationships within taxa [16,17,18]. This study confirmed that the plastid genome of Corylopsis has a typical quadripartite structure. The plastomes of the three species of Corylopsis completed in this study were based on Illumina MiSeq sequencing and had a length of 159,363 bp (C. pauciflora) to 159,434 bp (C. gotoana) and an average GC content of 38.0%. The GC content of the IR regions is relatively higher than that of the SC regions, implying that fewer AT contents have relatively weak hydrogen bonds. Consequently, evidence exists that IR regions are better preserved than SC regions (Figure 2 and Figure 6, Table 1) [20,42,43,44,45]. The IR region is commonly found duplicated in most plastid genomes. Due to this arrangement, it is thought that the IR region provides structural stability to the circularized plastomes [46]. In addition, these repetitions can aid in limiting gene movement and rearrangement, thus contributing stability. In the case of transgenes, insertion into the IR regions is necessary to double the copy number and enhance homoplasmy to strengthen the selection pressure [47]. This is because when transgenes are inserted into the IR region, they are also inserted into the other copy. Indeed, homoplasmy, which refers to the integration of foreign genes into all plastid genomes, and increased levels of polymer transcripts were detected only within the IR region, with no such observations in LSC transgenic plants [48]. Because of the comparison of the plastome structure and mVISTA analysis, it was confirmed that the characteristics such as GC content, genome length, and content of genes were generally similar and well conserved within Corylopsis (Figure 2, Table 1 and Table S2). Through IR scope analysis, the IR boundaries of the three plastid genomes created in this study were well conserved, similar to those of other species. Among the other species, a notable difference was observed in C. multiflora var. nivea, where the rps19 gene was present at the boundary between the LSC and Irb. The fate of genes located at the boundaries of each region also depends on the extension or contraction of specific regions of the plastome, which can be used for the phylogenetic classification of taxa [49,50,51,52]. For example, in the genus Camellia (Theaceae), variations in the length of the IR regions due to various indels in the plastome have been observed [51]. The extension or contraction of at least one to seven IR regions has been observed within Apioideae (Apiaceae), which explains the pattern of genetic evolution in Apioideae [52]. C. multiflora var. nivea may be considered an evolutionary phenomenon in Corylopsis, although the plastid genome structure did not show evident differences, as in the aforementioned taxa. The location of the rps19 gene of C. multiflora var. nivea revealed in this study can provide the basis for understanding the evolutionary patterns of Corylopsis in the future.
Synonymous codons encode the same amino acids in many eukaryotes but occur at different frequencies, which is referred to as codon bias [45,53,54]. Codon bias is determined by various factors such as base composition, gene length, and amino acid hydrophobicity, and is involved in regulating gene expressions and increasing translation accuracy and efficiency [54,55,56,57,58]. This study confirmed that the RSCU values of 29 out of 61 codons encoding amino acids in Corylopsis were more than one, indicating codon bias (Figure 4 and Table S3). Among the 29 codons, most had an A/U at the third nucleotide position, which is considered to be due to the high A/T content found in most plastid genomes [53,59]. Unlike other species, C. coreana had an RSCU value of more than one for UCC and less than one for UCA among the codons encoding the amino acid serine (Table S3). This phenomenon of changing codon bias can be explained by complex factors such as genes and mutations selected during long-term adaptation to the environment and evolution [60]. In particular, C. coreana is an endemic species distributed only in the Republic of Korea, and it is considered to be a phenomenon that occurred after being isolated in the Republic of Korea for a long time and undergoing adaptation and evolution.

4.2. Divergence Hotspots of Corylopsis

SSRs are useful molecular markers for distinguishing species and are used to identify phylogenetic relationships within taxa because of their high degree of polymorphism [61,62]. A total of 73 (C. multiflora var. nivea) to 106 (C. spicata) SSRs were found in the genus Corylopsis (Figure 5a). Mononucleotide SSRs (78.33%) were the most common, followed by dinucleotide SSRs (10.05%), tetranucleotide SSRs (6.09%), trinucleotide SSRs (3.27%), and pentanucleotide SSRs (2.26%) (Figure 5a). SSRs consisting of A and T were the richest: the ratio of A/T nucleotide was overwhelmingly high in mononucleotide SSRs (72.60–80.19%), AT/AT in dinucleotide SSRs (7.55–10.59%), and AAAT/ATTT in tetranucleotide SSRs (1.89–4.11%) (Table S4). In the SSRs of many plants, poly A and poly T occur relatively more frequently than poly G or poly C, which is consistent with the SSR repetition results of Corylopsis identified in this study [45,63,64,65].
Repetitive elements like palindromic, forward, and reverse repeats, as well as complementary sequences, exert significant influence on genetic organization. They serve as valuable molecular markers for identifying phylogenetic relationships or distinguishing between species [46,66]. In this study, the repeat sequences of 10 plastid genomes, including those of Corylopsis, were searched (Figure 5b). In all species, forward and palindromic repeats accounted for more than 90% of the repeats. One or two reverse repeats were found in the remaining species, with the exception of one (C. multiflora var. nivea), and complementary repeats were found in only three species (C. spicata, C. coreana, and C. microcarpa). The length of most repeats was more than 30 bp and less than 50 bp, which is similar to the repeat results of Hamamelidaceae species found in a previous study (Table S5 and [3]).
A phylogenetically useful region can be selected through nucleotide diversity analysis, which can provide information on divergent hotspots in plastid genomes [20,67]. The nucleotide diversity (Pi) of the CDS, tRNA, rRNA, introns, and intergenic spacers was calculated (Figure 6). The Pi value of the IR regions was lower compared to that of the SC regions, suggesting a higher level of conservation in the IR regions than in the SC regions [64,67,68]. Most of the regions with high Pi values were non-coding regions such as intergenic spacers or introns, and the region with the highest Pi value was rpl33_rps18 (Figure 6). This suggests that coding regions exhibit greater conservation compared to non-coding regions. In the coding region, ndhE exhibited the highest Pi value (Table S6). These selected regions can be useful molecular markers for phylogeny at the genus level, such as in DNA barcoding.

4.3. Phylogenetic Relationships within Corylopsis

The plastid genome has features such as a small and simple structure, well-conserved gene content and arrangement compared to the mitochondrial and nuclear genomes, and uniparental inheritance, which are considered informative and valuable for understanding evolutionary biology [69,70]. Several studies have conducted phylogenetic analyses of Hamamelidaceae using genes. Li et al. [9] identified the phylogeny of the Corylopsis complex (Corylopsis, Distylium, Eustigma, Fortunearia, and Sinowilsonia) using morphological features and internal transcribed spacers (ITS). Shi et al. [71] suggested the phylogeny of Hamamelidaceae based on ITS regions and 5.8 S coding regions of the nuclear genome and confirmed that the genus Corylopsis forms a monophyletic group with the genus Loropetalum. Wang et al. [3] used plastid genomes to confirm the phylogenetic relationships of genera belonging to Hamamelidaceae. However, studies conducted to date have examined the phylogenetic relationships of Corylopsis and other genera, and no study has been conducted to identify the phylogenetic relationships within Corylopsis using plastid genomes. This study outlines the proposed phylogenetic relationships of Corylopsis, utilizing concatenated protein-coding genes.
Three new plastid genomes of Corylopsis species were produced based on NGS using Illumina sequencing, and the systematic relationships of Corylopsis were identified based on the protein-coding genes of the plastid. Similar to previous studies, Hamamelidoideae, including Corylopsis, were confirmed to be monophyletic, and the genus Loropetalum is sister to Corylopsis [3,72,73]. Loropetalum is characterized by its colorful and red flowers, leathery elliptical leaves, and often evergreen habit [74]. In contrast, Corylopsis is known for its pendulous catkin-like clusters of small, yellowish flowers, serrated deciduous leaves, and a more upright growth habit [1]. Within the genus Corylopsis, the earliest branched species was C. multiflora var. nivea, which is a variety of C. multiflora characterized by glabrous young branches, leaves, peduncles, and short stamens and is endemic to Mt. Fuji, China (Figure 7) [2,24]. The branched species are C. microcarpa, distributed in China, and C. coreana, which is endemic to the Republic of Korea [21]. Previously, C. coreana was considered as C. gotoana var. coreana; however, they are distinguished by the presence or absence of hair on the lower surface of leaves and the number of flowers per inflorescence. Because a prominent difference between the two species was observed in the results of the phylogenetic tree, considering them as independent species is reasonable [21,75]. C. pauciflora, C. spicata, and C. gotoana form a clade, and all share the common feature of being distributed in Japan. C. pauciflora is distinguished by its notably smaller leaves (less than 6 cm) compared to other species (approximately 10 cm), and its inflorescence is also characterized by its short size, consisting only of one to five flowers [1]. Additionally, C. spicata is morphologically distinguished by its filaments being bright red, whereas those of other taxa in the genus are typically yellow or white [1]. Four species of Corylopsis are known to be distributed in Japan, three of which were included in this study. The adjacent relationships between the three species and the formation of a monophyletic group suggest that speciation occurred in Japan. Yamanaka et al. [7] also suggested the possibility that independent speciation may have occurred in areas where Corylopsis species in Japan became refugia under the influence of Quaternary climate change [7]. C. velutina, C. glandulifera, and C. sinensis formed a clade, all of which were distributed in China. The plastid genome of C. sinensis obtained in the present study formed a clade with that previously listed in GenBank (MZ590567). Most of the distribution area of Corylopsis is occupied by China, but five species distributed in China were included in this study. A phylogenetic study involving the species distributed in China is essential for understanding the biogeographical evolution of Corylopsis. The correlation between the geographical distribution and clade formation of phylogenetic trees can usually be estimated using fossil data such as divergence time and migration route. Kim et al. [22,23] identified the biogeographical history of the Northern Hemisphere by inferring the migration routes and divergence times of Melanthiaceae species based on fossil data. Although this study did not investigate the biogeographical history using fossil data, it is considered that their evolutionary history and distribution may be related, as clades within Corylopsis are formed by their distribution.
In this study, 9 of 25 species belonging to the genus Corylopsis were analyzed to confirm the lineage within Corylopsis and provide information on the new plastid genome. This is significant in that it is the first study to compare the plastid genomes of species belonging to the genus Corylopsis and to explore the phylogenetic relationship between taxa. However, there is a limitation in that there is a node with a low support value, and the phylogenetic relationship of the entire genus Corylopsis cannot be confirmed. If more species are added and analyzed, the limitations of this study will be resolved, and the various pieces of information presented in our results will serve as the foundation for identifying the phylogenetic history of Hamamelidaceae in the future.

5. Conclusions

For the first time, our study performed a comprehensive comparative analysis based on the plastid genome of Corylopsis and phylogenetic relationships. We also provided information on the plastid genomes of the three species within Corylopsis. The Corylopsis plastome has the quadripartite structure of a typical angiosperm plastid genome, ranging from 158,996 bp to 159,507 bp. It comprises 79 protein-coding genes, 30 tRNAs, and 4 rRNA genes. Through various plastome structure analyses, the plastid genome structure of Corylopsis was similar and well-conserved. Repeat and nucleotide diversity analyses were performed to search for divergent hotspots that could be used as molecular markers. The number of SSRs in Corylopsis ranged from 73 to 106, and mononucleotide SSRs accounted for the largest proportion. More than 90% of the repeats were composed of forward and palindromic repeats, and most repeats were 30–50 bp in length. A phylogenetically useful region was identified using nucleotide diversity analysis. The Pi values of the SC regions were higher than those of the IR regions, and the highest Pi value was rpl33_rps18 intergenic spacer region. Phylogenetic analysis using the protein-coding genes of the plastid genome confirmed that the genus Corylopsis is a monophyletic group and that its sister is a genus of Loropetalum. In this study, the phylogenetic relationships within Corylopsis were demonstrated, which will be helpful for identifying the phylogeny of Hamamelidaceae in the future.

Supplementary Materials

The following supporting information can be downloaded at: https://www.mdpi.com/article/10.3390/genes15030380/s1, Figure S1: The complete plastid genomes assembled in this study; Table S1: List of samples for total DNA extraction; Table S2: List of annotated genes in the plastid genome of Corylopsis; Table S3: Relative synonymous codon usage (RSCU) analysis of protein-coding genes in 10 Corylopsis; Table S4: The number of simple sequence repeats (SSRs) identified within the plastome of Corylopsis; Table S5: List of Repeat analysis of Corylopsis; Table S6: Nucleotide diversity (Pi) of 10 Corylopsis.

Author Contributions

Conceptualization: H.-J.K.; Methodology: T.-H.K. and Y.-H.H.; Formal analysis: T.-H.K.; Resources: T.-H.K., H.S. and K.C.; Data curation: H.S. and S.-C.K.; Writing—original draft: T.-H.K.; Writing—review and editing: T.-H.K., Y.-H.H. and S.-C.K.; Visualization: T.-H.K.; Investigation: Y.-H.H., K.C. and S.-C.K.; Project administration: H.S., K.C. and H.-J.K. Funding acquisition: H.-J.K. All authors have read and agreed to the published version of the manuscript.

Funding

This research was funded by SCIENTIFIC RESEARCH OF THE KOREA NATIONAL ARBORETUM under Grant numbers [KNA 1-1-13, 14-1].

Institutional Review Board Statement

Not applicable.

Informed Consent Statement

Not applicable.

Data Availability Statement

The associated BioProject number is PRJNA1066397. SRA numbers are SRR27630243 (Corylopsis sinensis), SRR27630244 (C. pauciflora), and SRR27630245 (C. gotoana). The biosample numbers are SAMN39487248 (C. gotoana), SAMN39487249 (C. pauciflora), and SAMN39487250 (C. sinensis). The new plastome sequences are available in GenBank: PP273280 (C. gotoana), PP273281 (C. pauciflora), and PP273282 (C. sinensis).

Acknowledgments

We appreciate Kae-Sun Chang and Eun-Ho Lee for tissue sampling and laboratory assistance throughout the project.

Conflicts of Interest

The authors declare no conflicts of interest.

References

  1. Morley, B.; Chao, J.-M. A review of Corylopsis (Hamamelidaceae). J. Arnold Arbor. 1977, 58, 382–415. [Google Scholar] [CrossRef]
  2. Wu, Z.; Raven, P.H.; Hong, D. Pittosporaceae through Connaraceae. In Flora of China; Science Press: Beijing, China, 2003; Volume 9. [Google Scholar]
  3. Wang, N.; Chen, S.; Xie, L.; Wang, L.; Feng, Y.; Lv, T.; Fang, Y.; Ding, H. The complete chloroplast genomes of three Hamamelidaceae species: Comparative and phylogenetic analyses. Ecol. Evol. 2022, 12, e8637. [Google Scholar] [CrossRef] [PubMed]
  4. Kim, M.H.; Ha, S.Y.; Oh, M.H.; Kim, H.H.; Kim, S.R.; Lee, M.W. Anti-oxidative and anti-proliferative activity on human prostate cancer cells lines of the phenolic compounds from Corylopsis coreana Uyeki. Molecules 2013, 18, 4876–4886. [Google Scholar] [CrossRef] [PubMed]
  5. Kim, S.; Boo, H.O.; Ahn, T.; Bae, C.S. Protective effects of Erythronium japonicum and Corylopsis coreana Uyeki extracts against 1,3-dichloro-2-propanol-induced hepatotoxicity in rats. Appl. Microsc. 2020, 50, 29. [Google Scholar] [CrossRef]
  6. Li, C.; Chen, X.; Fang, D.; Li, G. A new bergenin derivative from Corylopsis willmottiae. Chem. Nat. Compd. 2011, 47, 194–196. [Google Scholar] [CrossRef]
  7. Yamanaka, M.; Kobayashi, S.; Setoguchi, H. Distinct geographical structure across species units evidenced by chloroplast DNA haplotypes and nuclear ribosomal ITS genotypes of Corylopsis (Hamamelidaceae) in the Japanese islands. Bot. J. Linn. Soc. 2008, 157, 501–518. [Google Scholar] [CrossRef]
  8. Barrett, R.D.H.; Hebert, P.D.N. Identifying spiders through DNA barcodes. Can. J. Zool. 2005, 83, 481–491. [Google Scholar] [CrossRef]
  9. Li, J.; Bogle, A.L.; Klein, A.S. Phylogenetic relationships in the Corylopsis complex (Hamamelidaceae): Evidence from sequences of the internal transcribed spacers of nuclear ribosomal DNA and morphology. Rhodora 1997, 99, 302–318. [Google Scholar]
  10. Li, J.; Bogle, A.L.; Klein, A.S. Phylogenetic relationships in the Hamamelidaceae: Evidence from the nucleotide sequences of the plastid genematK. Plant Syst. Evol. 1999, 218, 205–219. [Google Scholar] [CrossRef]
  11. Palmer, J.D.; Zamir, D. Chloroplast DNA evolution and phylogenetic relationships in Lycopersicon. Proc. Natl. Acad. Sci. USA 1982, 79, 5006–5010. [Google Scholar] [CrossRef]
  12. Pennington, R.T.; Lavin, M.; Ireland, H.; Klitgaard, B.; Preston, J.; Hu, J.M. Phylogenetic relationships of basal papilionoid legumes based upon sequences of the chloroplast trnL intron. Syst. Bot. 2001, 26, 537–556. [Google Scholar]
  13. Dobrogojski, J.; Adamiec, M.; Luciński, R. The chloroplast genome: A review. Acta Physiol. Plant 2020, 42, 98. [Google Scholar] [CrossRef]
  14. Palmer, J.D. Comparative organization of chloroplast genomes. Annu. Rev. Genet. 1985, 19, 325–354. [Google Scholar] [CrossRef] [PubMed]
  15. Sugiura, M. The chloroplast genome. In 10 Years Plant Molecular Biology; Springer: Dordrecht, The Netherlands, 1992; pp. 149–168. [Google Scholar]
  16. Provan, J.; Powell, W.; Hollingsworth, P.M. Chloroplast microsatellites: New tools for studies in plant ecology and evolution. Trends Ecol. Evol. 2001, 16, 142–147. [Google Scholar] [CrossRef]
  17. Ravi, V.; Khurana, J.P.; Tyagi, A.K.; Khurana, P. An update on chloroplast genomes. Plant Syst. Evol. 2008, 271, 101–122. [Google Scholar] [CrossRef]
  18. Shaw, J.; Lickey, E.B.; Schilling, E.E.; Small, R.L. Comparison of whole chloroplast genome sequences to choose noncoding regions for phylogenetic studies in angiosperms: The tortoise and the hare III. Am. J. Bot. 2007, 94, 275–288. [Google Scholar] [CrossRef]
  19. Jones, S.S.; Burke, S.V.; Duvall, M.R. Phylogenomics, molecular evolution, and estimated ages of lineages from the deep phylogeny of Poaceae. Plant Syst. Evol. 2014, 300, 1421–1436. [Google Scholar] [CrossRef]
  20. Kim, T.H.; Kim, J.H. Molecular phylogeny and historical biogeography of Goodyera R. Br. (Orchidaceae): A case of the vicariance between East Asia and North America. Front. Plant Sci. 2022, 13, 850170. [Google Scholar] [CrossRef] [PubMed]
  21. Choi, K.S.; Ha, Y.-H.; Jeong, K.S.; Joo, M.; Chang, K.S.; Choi, K. The complete chloroplast genome of Corylopsis coreana (Hamamelidaceae). Conserv. Genet. Resour. 2019, 11, 291–293. [Google Scholar] [CrossRef]
  22. Kim, C.; Kim, S.C.; Kim, J.H. Historical biogeography of Melanthiaceae: A case of out-of-North America through the Bering land bridge. Front. Plant Sci. 2019, 10, 396. [Google Scholar] [CrossRef] [PubMed]
  23. Kim, S.C.; Shin, S.; Ahn, J.Y.; Lee, J.W. Complete chloroplast genome of Corylopsis spicata and phylogenetic analysis. Mitochondrial DNA B Resour. 2019, 4, 2700–2701. [Google Scholar] [CrossRef] [PubMed]
  24. Lv, T.; Chen, S.; Zhao, R.; Wang, N.; Fang, Y. The complete chloroplast genome sequence of Corylopsis multiflora Hance var. nivea Chang. Mitochondrial DNA B Resour. 2021, 6, 271–273. [Google Scholar] [CrossRef] [PubMed]
  25. Zhang, H.; Gu, J.; Chang, H. The complete chloroplast genome sequence of Corylopsis sinensis (Hamamelidaceae). Mitochondrial DNA B Resour. 2022, 7, 417–418. [Google Scholar] [CrossRef] [PubMed]
  26. Kearse, M.; Moir, R.; Wilson, A.; Stones-Havas, S.; Cheung, M.; Sturrock, S.; Buxton, S.; Cooper, A.; Markowitz, S.; Duran, C.; et al. Geneious Basic: An integrated and extendable desktop software platform for the organization and analysis of sequence data. Bioinformatics 2012, 28, 1647–1649. [Google Scholar] [CrossRef] [PubMed]
  27. Tillich, M.; Lehwark, P.; Pellizzer, T.; Ulbricht-Jones, E.S.; Fischer, A.; Bock, R.; Greiner, S. GeSeq—Versatile and accurate annotation of organelle genomes. Nucleic Acids Res. 2017, 45, W6–W11. [Google Scholar] [CrossRef] [PubMed]
  28. Brudno, M.; Do, C.B.; Cooper, G.M.; Kim, M.F.; Davydov, E.; NISC Comparative Sequencing Program; Green, E.D.; Sidow, A.; Batzoglou, S. LAGAN and Multi-LAGAN: Efficient tools for large-scale multiple alignment of genomic DNA. Genome Res. 2003, 13, 721–731. [Google Scholar] [CrossRef] [PubMed]
  29. Frazer, K.A.; Pachter, L.; Poliakov, A.; Rubin, E.M.; Dubchak, I. VISTA: Computational tools for comparative genomics. Nucleic Acids Res. 2004, 32 (Suppl. S2), W273–W279. [Google Scholar] [CrossRef] [PubMed]
  30. Amiryousefi, A.; Hyvönen, J.; Poczai, P. IRscope: An online program to visualize the junction sites of chloroplast genomes. Bioinformatics 2018, 34, 3030–3031. [Google Scholar] [CrossRef]
  31. Xia, X. DAMBE6: New tools for microbial genomics, phylogenetics, and molecular evolution. J. Hered. 2017, 108, 431–437. [Google Scholar] [CrossRef]
  32. Beier, S.; Thiel, T.; Münch, T.; Scholz, U.; Mascher, M. MISA-web: A web server for microsatellite prediction. Bioinformatics 2017, 33, 2583–2585. [Google Scholar] [CrossRef]
  33. Thiel, T.; Michalek, W.; Varshney, R.K.; Graner, A. Exploiting EST databases for the development and characterization of gene-derived SSR-markers in barley (Hordeum vulgare L.). Theor. Appl. Genet. 2003, 106, 411–422. [Google Scholar] [CrossRef]
  34. Kurtz, S.; Choudhuri, J.V.; Ohlebusch, E.; Schleiermacher, C.; Stoye, J.; Giegerich, R. REPuter: The manifold applications of repeat analysis on a genomic scale. Nucleic Acids Res. 2001, 29, 4633–4642. [Google Scholar] [CrossRef] [PubMed]
  35. Katoh, K.; Standley, D.M. MAFFT multiple sequence alignment software version 7: Improvements in performance and usability. Mol. Biol. Evol. 2013, 30, 772–780. [Google Scholar] [CrossRef]
  36. Rozas, J.; Ferrer-Mata, A.; Sánchez-Delbarrio, J.C.; Guirao-Rico, S.; Librado, P.; Ramos-Onsins, S.E.; Sánchez-Gracia, A. DnaSP 6: DNA sequence polymorphism analysis of large data sets. Mol. Biol. Evol. 2017, 34, 3299–3302. [Google Scholar] [CrossRef]
  37. Zhang, D.; Gao, F.; Jakovlić, I.; Zou, H.; Zhang, J.; Li, W.X.; Wang, G.T. PhyloSuite: An integrated and scalable desktop platform for streamlined molecular sequence data management and evolutionary phylogenetics studies. Mol. Ecol. Resour. 2020, 20, 348–355. [Google Scholar] [CrossRef]
  38. Swofford, D.L. PAUP: Phylogenetic Analysis Using Parsimony, Mac Version 3.1.1; Illinois Natural History Survey: Champaign, IL, USA, 1993. [Google Scholar]
  39. Kalyaanamoorthy, S.; Minh, B.Q.; Wong, T.K.F.; Von Haeseler, A.; Jermiin, L.S. ModelFinder: Fast model selection for accurate phylogenetic estimates. Nat. Methods 2017, 14, 587–589. [Google Scholar] [CrossRef]
  40. Nguyen, L.T.; Schmidt, H.A.; Von Haeseler, A.; Minh, B.Q. IQ-TREE: A fast and effective stochastic algorithm for estimating maximum-likelihood phylogenies. Mol. Biol. Evol. 2015, 32, 268–274. [Google Scholar] [CrossRef]
  41. Ronquist, F.; Teslenko, M.; Van Der Mark, P.; Ayres, D.L.; Darling, A.; Höhna, S.; Larget, B.; Liu, L.; Suchard, M.A.; Huelsenbeck, J.P. MrBayes 3.2: Efficient Bayesian phylogenetic inference and model choice across a large model space. Syst. Biol. 2012, 61, 539–542. [Google Scholar] [CrossRef]
  42. Li, W.; Zhang, C.; Guo, X.; Liu, Q.; Wang, K. Complete chloroplast genome of Camellia japonica genome structures, comparative and phylogenetic analysis. PLoS ONE 2019, 14, e0216645. [Google Scholar] [CrossRef] [PubMed]
  43. Lu, R.S.; Li, P.; Qiu, Y.X. The complete chloroplast genomes of three Cardiocrinum (Liliaceae) species: Comparative genomic and phylogenetic analyses. Front. Plant Sci. 2016, 7, 2054. [Google Scholar] [CrossRef]
  44. Menezes, A.P.A.; Resende-Moreira, L.C.; Buzatti, R.S.O.; Nazareno, A.G.; Carlsen, M.; Lobo, F.P.; Kalapothakis, E.; Lovato, M.B. Chloroplast genomes of Byrsonima species (Malpighiaceae): Comparative analysis and screening of high divergence sequences. Sci. Rep. 2018, 8, 2210. [Google Scholar] [CrossRef]
  45. Moore, M.J.; Bell, C.D.; Soltis, P.S.; Soltis, D.E. Using plastid genome-scale data to resolve enigmatic relationships among basal angiosperms. Proc. Natl. Acad. Sci. USA 2007, 104, 19363–19368. [Google Scholar] [CrossRef]
  46. Palmer, J.D.; Thompson, W.F. Chloroplast DNA rearrangements are more frequent when a large inverted repeat sequence is lost. Cell 1982, 29, 537–550. [Google Scholar] [CrossRef]
  47. Daniell, H.; Lin, C.S.; Yu, M.; Chang, W.J. Chloroplast genomes: Diversity, evolution, and applications in genetic engineering. Genome Biol. 2016, 17, 134. [Google Scholar] [CrossRef]
  48. Guda, C.; Lee, S.B.; Daniell, H. Stable expression of a biodegradable protein-based polymer in tobacco chloroplasts. Plant Cell Rep. 2000, 19, 257–262. [Google Scholar] [CrossRef]
  49. Wu, L.; Nie, L.; Wang, Q.; Xu, Z.; Wang, Y.; He, C.; Song, J.; Yao, H. Comparative and phylogenetic analyses of the chloroplast genomes of species of Paeoniaceae. Sci. Rep. 2021, 11, 14643. [Google Scholar] [CrossRef]
  50. Lee, H.R.; Kim, K.A.; Kim, B.Y.; Park, Y.J.; Lee, Y.B.; Cheon, K.S. The complete chloroplast genome sequences of eight Orostachys species: Comparative analysis and assessment of phylogenetic relationships. PLoS ONE 2022, 17, e0277486. [Google Scholar] [CrossRef]
  51. Li, L.; Hu, Y.; He, M.; Zhang, B.; Wu, W.; Cai, P.; Huo, D.; Hong, Y. Comparative chloroplast genomes: Insights into the evolution of the chloroplast genome of Camellia sinensis and the phylogeny of Camellia. BMC Genom. 2021, 22, 138. [Google Scholar] [CrossRef]
  52. Plunkett, G.M.; Downie, S.R. Expansion and contraction of the chloroplast inverted repeat in Apiaceae subfamily Apioideae. Syst. Bot. 2000, 25, 648–667. [Google Scholar] [CrossRef]
  53. Peng, J.-Y.; Zhang, X.-S.; Zhang, D.-G.; Wang, Y.; Deng, T.; Huang, X.-H.; Kuang, T.-H.; Zhou, Q. Newly reported chloroplast genome of Sinosenecio albonervius Y. Liu & QE Yang and comparative analyses with other Sinosenecio species. BMC Genom. 2022, 23, 639. [Google Scholar] [CrossRef]
  54. Sharp, P.M.; Matassi, G. Codon usage and genome evolution. Curr. Opin. Genet. Dev. 1994, 4, 851–860. [Google Scholar] [CrossRef]
  55. Carlini, D.B.; Stephan, W. In vivo introduction of unpreferred synonymous codons into the Drosophila Adh gene results in reduced levels of ADH protein. Genetics 2003, 163, 239–243. [Google Scholar] [CrossRef]
  56. Hiraoka, Y.; Kawamata, K.; Haraguchi, T.; Chikashige, Y. Codon usage bias is correlated with gene expression levels in the fission yeast Schizosaccharomyces pombe. Genes. Cells 2009, 14, 499–509. [Google Scholar] [CrossRef]
  57. Romero, H.; Zavala, A.; Musto, H. Codon usage in Chlamydia trachomatis is the result of strand-specific mutational biases and a complex pattern of selective forces. Nucleic Acids Res. 2000, 28, 2084–2090. [Google Scholar] [CrossRef]
  58. Romero, H.; Zavala, A.; Musto, H.; Bernardi, G. The influence of translational selection on codon usage in fishes from the family Cyprinidae. Gene 2003, 317, 141–147. [Google Scholar] [CrossRef]
  59. Gao, B.; Yuan, L.; Tang, T.; Hou, J.; Pan, K.; Wei, N. The complete chloroplast genome sequence of Alpinia oxyphylla Miq. and comparison analysis within the Zingiberaceae family. PLoS ONE 2019, 14, e0218817. [Google Scholar] [CrossRef]
  60. Zhang, Y.; Tian, Y.; Tng, D.Y.; Zhou, J.; Zhang, Y.; Wang, Z.; Li, P.; Wang, Z. Comparative chloroplast genomics of Litsea Lam. (Lauraceae) and its phylogenetic implications. Forests 2021, 12, 744. [Google Scholar] [CrossRef]
  61. Xue, J.; Wang, S.; Zhou, S.L. Polymorphic chloroplast microsatellite loci in Nelumbo (Nelumbonaceae). Am. J. Bot. 2012, 99, e240–e244. [Google Scholar] [CrossRef]
  62. Yang, A.H.; Zhang, J.J.; Yao, X.H.; Huang, H.W. Chloroplast microsatellite markers in Liriodendron tulipifera (Magnoliaceae) and cross-species amplification in L. chinense. Am. J. Bot. 2011, 98, e123–e126. [Google Scholar] [CrossRef]
  63. Kuang, D.Y.; Wu, H.; Wang, Y.L.; Gao, L.M.; Zhang, S.Z.; Lu, L. Complete chloroplast genome sequence of Magnolia kwangsiensis (Magnoliaceae): Implication for DNA barcoding and population genetics. Genome 2011, 54, 663–673. [Google Scholar] [CrossRef]
  64. Song, Y.; Chen, Y.; Lv, J.; Xu, J.; Zhu, S.; Li, M. Comparative chloroplast genomes of Sorghum species: Sequence divergence and phylogenetic relationships. BioMed Res. Int. 2019, 2019, 5046958. [Google Scholar] [CrossRef]
  65. Wang, L.; Wuyun, T.-N.; Du, H.; Wang, D.; Cao, D. Complete chloroplast genome sequences of Eucommia ulmoides: Genome structure and evolution. Tree Genet. Genomes 2016, 12, 12. [Google Scholar] [CrossRef]
  66. Park, I.; Yang, S.; Choi, G.; Kim, W.J.; Moon, B.C. The complete chloroplast genome sequences of Aconitum pseudolaeve and Aconitum longecassidatum, and development of molecular markers for distinguishing species in the Aconitum subgenus Lycoctonum. Molecules 2017, 22, 2012. [Google Scholar] [CrossRef]
  67. Jung, J.; Kim, C.; Kim, J.H. Insights into phylogenetic relationships and genome evolution of subfamily Commelinoideae (Commelinaceae Mirb.) inferred from complete chloroplast genomes. BMC Genom. 2021, 22, 231. [Google Scholar] [CrossRef] [PubMed]
  68. Huang, J.; Yu, Y.; Liu, Y.M.; Xie, D.F.; He, X.J.; Zhou, S.D. Comparative chloroplast genomics of Fritillaria (Liliaceae), inferences for phylogenetic relationships between Fritillaria and Lilium and plastome evolution. Plants 2020, 9, 133. [Google Scholar] [CrossRef] [PubMed]
  69. Terakami, S.; Matsumura, Y.; Kurita, K.; Kanamori, H.; Katayose, Y.; Yamamoto, T.; Katayama, H. Complete sequence of the chloroplast genome from pear (Pyrus pyrifolia): Genome structure and comparative analysis. Tree Genet. Genomes 2012, 8, 841–854. [Google Scholar] [CrossRef]
  70. Yang, Y.; Zhou, T.; Duan, D.; Yang, J.; Feng, L.; Zhao, G. Comparative analysis of the complete chloroplast genomes of five Quercus species. Front. Plant Sci. 2016, 7, 959. [Google Scholar] [CrossRef]
  71. Shi, S.; Chang, H.T.; Chen, Y.; Qu, L.; Wen, J. Phylogeny of the Hamamelidaceae based on the ITS sequences of nuclear ribosomal DNA. Biochem. Syst. Ecol. 1998, 26, 55–69. [Google Scholar] [CrossRef]
  72. Bobrov, A.V.; Roslov, M.S.; Romanov, M.S. Phylogenetic biogeography of Hamamelidaceae s. l. based on molecular data. Vestn. St. Petersbg Univ. Earth Sci. 2020, 65, 224–244. [Google Scholar] [CrossRef]
  73. Xiao, M.; Li, Y.; Xiong, X.; Shen, S.; Song, J.; Liu, Q.; Jiang, T.; Luo, X.; Zhang, L. Complete chloroplast genome of Loropetalum chinense var. rubrum and phylogenetic analysis from Baoshan, China. Mitochondrial DNA Part B 2021, 6, 3336–3337. [Google Scholar] [CrossRef] [PubMed]
  74. Xiang, X.; Xiang, K.; Ortiz, R.D.C.; Jabbour, F.; Wang, W. Integrating palaeontological and molecular data uncovers multiple ancient and recent dispersals in the pantropical Hamamelidaceae. J. Biogeogr. 2019, 46, 2622–2631. [Google Scholar] [CrossRef]
  75. Chang, C.; Chang, K. Typification of Corylopsis coreana (Hamamelidaceae) and Carpinus laxiflora var. longispica (Betulaceae). J. Jpn. Bot. 2010, 85, 270–276. [Google Scholar]
Figure 1. The complete plastid genome of Corylopsis manufactured in this study. Genes located within the inner portion of the circular structure are transcribed in a clockwise direction, whereas those positioned on the outer side are transcribed counterclockwise. The dark gray shading within the inner circle indicates the GC content, while the light gray represents the AT content. Various colors are used to indicate distinct functional genes. Genes containing intron are denoted with an asterisk (*).
Genes 15 00380 g001
Figure 2. Using mVISTA plots, the alignment of plastid genome sequences was conducted to evaluate the percent sequence identity of the plastid genomes of 10 Corylopsis species, with Loropetalum chinense (NC_060831.1) serving as the reference. The x-axis represents the coordinate in the plastid genome, while the y-axis represents the average percentage of sequence similarity in the aligned regions, which ranges from 50% to 100%. Genome regions are categorized as protein-coding, rRNA-coding, tRNA-coding, or conserved noncoding sequences (CNS).
Genes 15 00380 g002
Figure 3. Comparison of LSC, SSC, and IR region boundaries in the plastomes of Corylopsis. JLB (IRB/LSC), JSB (IRB/SSC), JSA (IRA/LSC), and JLA (IRA/LSC) represent the junction sites between two adjacent regions in the genome.
Genes 15 00380 g003
Figure 4. The average RSCU value of Corylopsis.
Genes 15 00380 g004
Figure 5. Analyses of repeats in the 10 plastid genome of Corylopsis. (a) The number of SSR motifs in Corylopsis. (b) Number of different repeat types in Corylopsis.
Genes 15 00380 g005
Figure 6. Nucleotide diversity (Pi) values in 10 Corylopsis species plastid genomes. The dashed lines demarcate the boundaries of the LSC, IR, and SSC regions.
Genes 15 00380 g006
Figure 7. The ML tree of 20 species based on protein-coding genes. Above the nodes are MP bootstrap values, ML bootstrap values, and BI posterior probabilities (PP). The red, blue, and green colors indicate species distributed in China, the Republic of Korea, and Japan, respectively.
Genes 15 00380 g007
Table 1. Comparison of the plastome features of Corylopsis and related taxa.
TaxaLength (bp) and GC Content (%)GenBank Accession Number
LSCSSCIRTotal
Corylopsis sinensis *88,149 (36.1%)18,704 (32.7%)26,283 (43.1%)159,419 (38.0%)PP273282
Corylopsis sinensis88,152 (36.1%)18,701 (32.7%)26,283 (43.1%)159,419 (38.0%)MZ590567
Corylopsis glandulifera88,134 (36.1%)18,702 (32.6%)26,283 (43.1%)159,402 (38.0%)MZ642354
Corylopsis velutina88,146 (36.1%)18,702 (32.7%)26,283 (43.1%)159,414 (38.0%)MZ823391
Corylopsis gotoana *88,164 (36.1%)18,702 (32.7%)26,284 (43.1%)159,434 (38.0%)PP273280
Corylopsis spicata88,243 (36.1%)18,716 (32.7%)26,274 (43.1%)159,507 (38.0%)MK942341
Corylopsis pauciflora *88,097 (36.1%)18,700 (32.7%)26,283 (43.1%)159,363 (38.0%)PP273281
Corylopsis coreana88,166 (36.1%)18,692 (32.7%)26,270 (43.1%)159,398 (38.0%)MG835449
Corylopsis microcarpa88,185 (36.1%)18,693 (32.6%)26,280 (43.1%)159,438 (38.0%)MZ642356
Corylopsis multiflora var. nivea87,895 (36.1%)18,672 (32.6%)26,213 (43.1%)158,993 (38.0%)MW043717
Loropetalum chinense88,160 (36.1%)18,770 (32.7%)26,257 (43.1%)159,444 (38.0%)NC_060831
Loropetalum subcordatum88,216 (36.1%)18,494 (32.7%)25,998 (43.1%)158,706 (38.0%)NC_037694
Distylium myricoides87,847 (36.2%)18,780 (32.5%)26,233 (43.1%)159,093 (38.0%)NC_059883
Distylium racemosum87,863 (36.2%)18,782 (32.5%)26,231 (43.1%)159,107 (38.0%)NC_059886
Hamamelis mollis88,301 (36.1%)18,762 (32.5%)26,334 (43.1%)159,731 (38.0%)NC_037881
Sinowilsonia henryi87,507 (36.4%)18,768 (32.8%)26,233 (43.1%)158,741 (38.2%)NC_036069
Mytilaria laosensis89,016 (35.9%)18,127 (32.8%)26,399 (43.1%)159,941 (37.9%)NC_048997
Rhodoleia championii88,144 (35.8%)18,131 (32.3%)26,420 (42.9%)159,115 (37.7%)NC_045276
Liquidambar styraciflua88,891 (36.1%)18,977 (32.4%)26,441 (43.0%)160,750 (37.9%)NC_046938
Liquidambar orientalis88,882 (36.1%)18,947 (32.4%)26,471 (43.1%)160,771 (37.9%)NC_046937
* Sequenced in this study.
Disclaimer/Publisher’s Note: The statements, opinions and data contained in all publications are solely those of the individual author(s) and contributor(s) and not of MDPI and/or the editor(s). MDPI and/or the editor(s) disclaim responsibility for any injury to people or property resulting from any ideas, methods, instructions or products referred to in the content.

