

Screening and Preliminary Identification of Asparagus officinalis Varieties under Low-Temperature Stress

Zhejiang Institute of Subtropical Crops, Wenzhou 325005, China
*
Author to whom correspondence should be addressed.
Genes 2024, 15(4), 486; https://doi.org/10.3390/genes15040486
Submission received: 13 March 2024
/
Revised: 5 April 2024
/
Accepted: 9 April 2024
/
Published: 12 April 2024
(This article belongs to the Special Issue Abiotic Stress in Plants: Genetics and Genomics)
Abstract
:To meet the large demand for Asparagus officinalis in the spring market and improve the economic benefits of cultivating asparagus, we explored the molecular mechanism underlying the response of A. officinalis to low temperature. First, “Fengdao No. 1” was screened out under low-temperature treatment. Then, the transcriptome sequencing and hormone detection of “Fengdao No. 1” and “Grande” (control) were performed. Transcriptome sequencing resulted in screening out key candidate genes, while hormone analysis indicated that ABA was important for the response to low temperature. The combined analysis indicated that the AoMYB56 gene may regulate ABA in A. officinalis under low temperature. And the phylogenetic tree was constructed, and subcellular localisation was performed. From these results, we speculated that the AoMYB56 gene may regulate ABA in A. officinalis. The results of this research provide a theoretical basis for the further exploration of low-temperature response in A. officinalis.
1. Introduction
Asparagus officinalis (A. officinalis) is a plant in the Asparagaceae family that is native to the Mediterranean coast and Asia Minor and has been cultivated in China for more than 100 years [1]. The tender young stems of A. officinalis are suitable for consumption and rich in nutrition; they have a delicate aroma and crisp taste; and they can be consumed in cold dishes, fried food, soup, or processed into canned food. The regular consumption of asparagus can increase appetite and prevent hypertension and heart disease, among other effects. A. officinalis has high nutritional value and is a popular product in the vegetable market that is favoured by consumers, enjoying its reputation as the “king of vegetables” [2].
In plants, low temperatures influence their viability, even leading to plant death in severe cases [3,4]. Low temperature has a significant impact on plants originating in subtropical and tropical areas. The tolerance level of different plants to low temperatures usually varies among plant species [5,6]. Under low temperatures, once the plants receive the signal, their defence mechanisms are activated [7]. The mechanism of plant response to low-temperature stress has been gradually clarified under the development of molecular biology technology [8,9,10].
Endogenous hormone ABA can improve the abiotic stress (such as low temperature, drought, and salt) resistance of plants, which has been confirmed in various plants [11,12,13]. Under stress, ABA begins the response mechanism in plants through stress signal transduction, participates in the regulation of plant metabolism, alleviates plant stress damage, and improves plant stress resistance [14,15,16]). Moreover, ABA is an important promoter of low temperature resistance-related gene expression in plants [17,18,19]. ABA treatment can improve the low-temperature resistance of Arabidopsis [20], wheat [21], strawberry [22], Gladiolus [23], and other plants.
The MYB family is widely distributed in plants, mainly through the specific binding with cis-factors to activate or inhibit gene transcription process, and then involved in the regulation of plant growth [24]. Many plants have been found to include the MYB family, such as A. thaliana [25], Brassica [26], and so on [27,28]. Responses to various abiotic, the MYB family is also a vital regulatory factor, regulating plant stresses. In cotton, GbMYB5 was a positive regulatory factor in response to drought tolerance [29]. In Carthamus tinctorius (C. tinctorius), the transcription level of CtMYB63 in grape is significantly up-regulated under various abiotic stress conditions, and can enhance cold and drought tolerance by activating rapid anthocyanin synthesis [30]. In addition, previous reports showed that the MYB family could influence plant development by regulating ABA under cold stress. Masrur found that AtMYBR1 can delay leaf senescence by regulating ABA synthesis in Arabidopsis [31]. In strawberries, R2R3-MYB FaMYB10 response to ABA induction was found to promote strawberry pigment synthesis and fruit ripening [32].
This research aimed to provide insights for meeting the large demand for A. officinalis in the spring market and improving the economic benefits of cultivating asparagus. In A. officinalis, to explore the mechanism of molecular response to low temperatures, we first screened out “Fengdao No. 1” under low-temperature treatment. Transcriptome analysis revealed key candidate genes, while hormone analysis indicated that ABA is important for the response to low temperature. In asparagus, the results showed that AoMYB56 regulates ABA in response to low temperature. This research provides a basis for the further exploration of the low-temperature response of asparagus.
2. Plant Materials and Methods
2.1. Plant Materials and Low-Temperature Stress Treatment
Six asparagus varieties (“Fengdao No. 1”, “Fengdao No. 2”, “Grande”, “Wenlv No. 1”, “Hangyu No. 6”, and “Jingang 111”), which were cultivated in the Zhejiang Institute of Subtropical Crops Herbarium (120′63 E, 27.99 E), were placed in the dark at 7 °C for 8 h and light at 15 °C for 16 h (75% humidity), for low-temperature tolerance testing in this study. Then, we observed the growth of the six asparagus varieties under low-temperature stress treatment.
2.2. Physiological Index Detection
The tips of “Fengdao No. 1” (repeat sample names: FM1, FM2, and FM3) and “Grande” (repeat sample names: GM1, GM2, and GM3) were chosen for further study. To test the superoxide dismutase (SOD) and peroxidase (POD) activities in the A. officinalis, 0.1 mg FM1, FM2, FM3, GM1, GM2, and GM3 were selected. Then, 1 mL SOD/POD extraction liquid was added. All samples were placed in ice bath homogenization. Then, they were centrifuged at 8000× g at 4 °C for 10 min, and the supernatant was removed and put on ice to be measured. The kit was obtained from Nanjing Jiancheng Bioengineering Institute (Nanjing, China). All measurements were repeated in triplicate.
2.3. Transcriptome Sequencing
The RNeasy Plant Mini Kit (Tiangen, Beijing, China) was used to extract the total RNA of the six samples (FM1, FM2, FM3, GM1, GM2, and GM3) [33]. The mRNA was enriched using magnetic beads with oligo (dT) after the sample quality was checked and was randomly disrupted with fragmentation buffer. First, the cDNA strand was synthesized using six-base random hexamers as templates. Second, the cDNA chain was synthesized after adding buffer, dNTPs, RNase H, and DNA polymerase. The cDNA was purified using AMPure XP beads, end-repaired, and A-tailed, and the adaptors were connected [34]. Agilent 2100 (Agilent, Beijing, China) was used to test the cDNA library.
2.4. Analysis of Transcriptomic Results
The asparagus genome (reference genome version: GCF_001876935.1_Aspof. V1) was used as a reference sequence for alignment and transcriptomic reconstruction. HISAT2-2.2.1, which was designed and developed by Hopkins University in the United States, is a fast and sensitive comparison software based on the BWT algorithm, and its core was developed on the basis of Bowtie2. Compared with tophat2, it has greater efficiency and provides more accurate results, and it has been widely used for the comparison of RNA-seq data. After the mapped data were obtained from the clean data and the asparagus reference genome was aligned, the insertion fragment length test and randomness test were used to evaluated the sequencing library quality.
The mapped reads’ number in each sample and the length of the transcripts were normalized using the FPKM calculation method, and the expression levels for each sample were obtained. DESeq (R package 4.1.1) was used to analyse differential expression among different samples. The significance (P) obtained with the original hypothesis test was corrected using the Benjamini-Hochberg correction method, and the Q value was obtained using the false discovery rate (FDR) of the differentially expressed genes (DEGs). KEGG metabolic pathway analysis and differential gene expression analysis were performed on the transcripts.
2.5. DEGs Identified Using qRT-PCR in A. officinalis
Eight DEGs were identified using qRT-PCR, while Oligo 7 software was used to design primers (Table S1). The total RNA of the tips in “Fengdao No. 1” and “Grande” was reverse-transcribed to synthesize first-strand cDNAs, which would be used in the qRT-PCR experiment programme. Then, 2 μL of cDNA, 10 mL of SYBR Premix Ex Taq, 3 μL of 50× ROX Reference Dye II, 0.2 μL (10 μM) of each primer, and 4.6 μL of H2O were used for a 20 μL mixture. ABI Viia 7 system (Applied Biosystems, Waltham, MA, USA) was used to conduct the experiment according to the manufacturers’ protocols [35], while three technical replicates were performed for each sample. Reference gene 18S was used as a control for normalization. Relative expression levels in different tissues were calculated using the 2−ΔΔ CT method.
2.6. Determination of Endogenous Hormone Levels in A. officinalis
The tips of “Fengdao No. 1” and “Grande” were collected and stored at −80 °C for subsequent use. One millilitre of methanol/water/formic acid (15:4:1, V/V/V) was used to obtain extracts from 50 mg of seeds. Under a nitrogen gas stream, the combined extracts were evaporated to dryness, reconstituted in 100 μL of 80% methanol (V/V), and then filtered through a 0.22 μm filter for further LC-MS analysis. Then, the AB 6500+ QTRAP® LC-MS/MS platform was used to detect ABA and GA. To ensure the accuracy of the experiment, three replicates of each assay were performed.
2.7. Combined Analysis of DEGs and Endogenous Hormones
A combined analysis of 8 DEGs and 14 endogenous hormones was performed, and a correlation network was constructed. The correlation network was performed using the OmicStudio tool at https://www.omicstudio.cn/tool with the default program (12 January 2024) [36].
2.8. Phylogenetic Analysis between the AoMYB56 and MYB Genes in A. thaliana
Sequences of the MYB proteins of A. thaliana were downloaded from PlantTFDB, a plant transcription factor database (planttfdb.cbi.pku.edu.cn, 18 Feburary 2024). To analyse the sequences, DNAMAN 6.0 software was used to align the AoMYB56 and MYB genes in A. thaliana. A phylogenetic tree of the AoMYB56 and MYB genes in A. thaliana was constructed via the NJ (neighbour-joining) method in MEGA X software.
2.9. Subcellular Localisation of AoMYB56
First, coding regions of the AoMYB56 gene were inserted into the entry vector pCR8/GW/TOPO. And then, pBI121 (with a C-terminal HA-tag) was driven by the cauliflower mosaic virus (CaMV) 35S promoter. The constructed expression plasmid was transformed into Agrobacterium. The Agrobacterium clone (EHA105) with a transformed-expression plasmid was selected and cultured in 1 mL LB liquid medium containing corresponding antibiotics at 200 rpm at 28 °C for 24 h. Then, 1 mL of cultured Agrobacterium solution was transferred to 20 mL of LB medium containing the corresponding antibiotic, which contained 15 μM acetylsyringone (20 mL of LB with 3 μL of 100 mM AS). The mixture was cultured at 28 °C, 200 rpm to the logarithmic phase of Agrobacterium growth (OD600 = 0.5–0.6). Then, it was centrifuged at room temperature at 5000 rpm for 10 min to collect the bacteria, and the bacteria were suspended with dye solution (containing 10 mM MgCl2, 10 mM MES, 150 μM acetylsyringone, pH = 5.6) to OD600 = 1.0. They were then left at room temperature for 2~3 h. Two kinds of bacteria containing different plasmids were mixed in equal volume; a small opening was gently made on the back of the tobacco leaf with a 1 mL needle (taking care not to pierce it), and then a needle tube with the needle removed was used to absorb the bacterial solution and inject it into the leaf from the wound site. Water-stained areas of tobacco leaves were marked with a marker. The injected plants were placed in the dark for 12 h, and then cultured at around 21 °C for 2 days to observe whether the tobacco area injected with Agrobacterium was fluorescent, and the labelled areas of tobacco leaves were torn off. Then, cellular localization was observed using confocal microscopy (Carl Zeiss, Oberkochen, Germany) with a fluorescence microscope and an excitation light source system (Lumen Dynamic Connections). Protoplast transfection was repeated three times for experiment accuracy.
3. Results
3.1. Growth of Six Asparagus Varieties under Low-Temperature Conditions
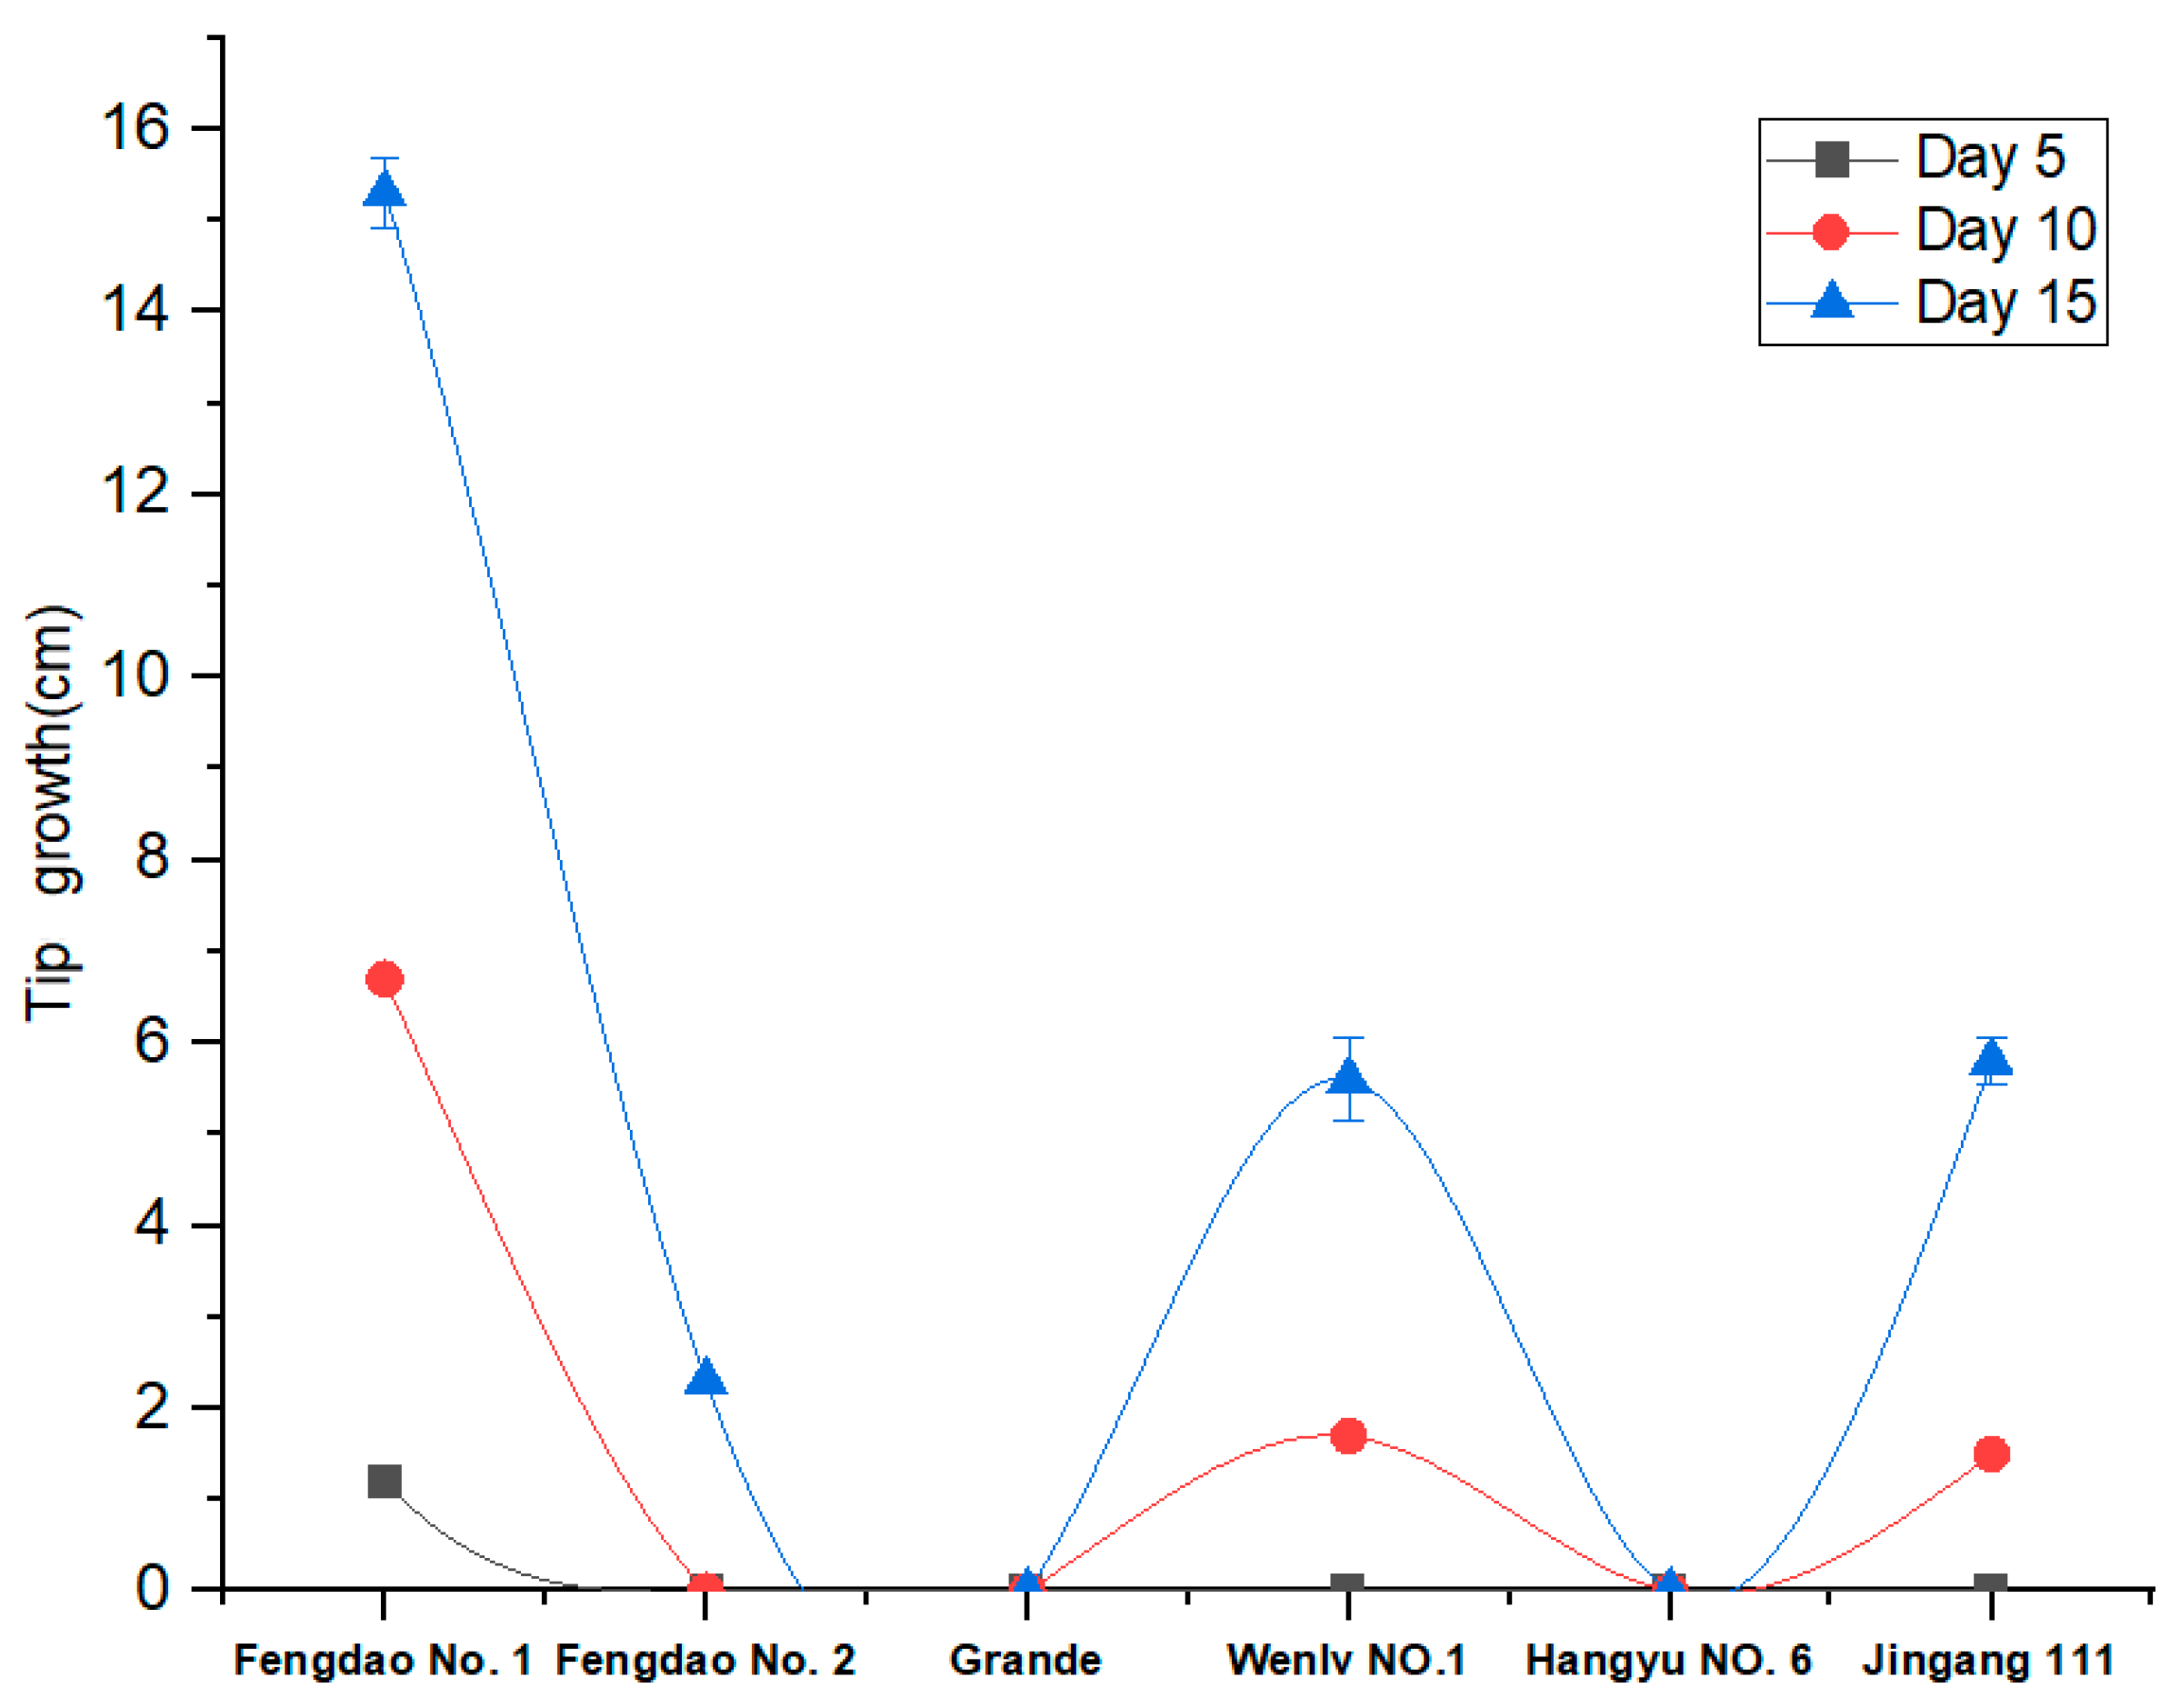
The growth of six asparagus varieties (“Fengdao No. 1”, “Fengdao No. 2”, “Grande”, “Wenlv No. 1”, “Hangyu No. 6”, and “Jingang 111”) under low-temperature conditions was evaluated. The results indicated that only “Fengdao No. 1” grew by day 5, while “Wenlv No. 1” and “Jingang 111” grew by day 10. “Grande” and “Hangyu NO. 6” did not grow at low temperatures. Therefore, we selected “Fengdao No. 1” as the experimental material, and “Grande”, which grows at 25 °C, as the control material. The repeat samples “Fengdao No. 1” and “Grande” were named “FM1, FM2, FM3”, and “GM1, GM2, GM3” (Figure 1).
3.2. POD and SOD Activity Determination in “Fengdao No. 1” and “Grande”
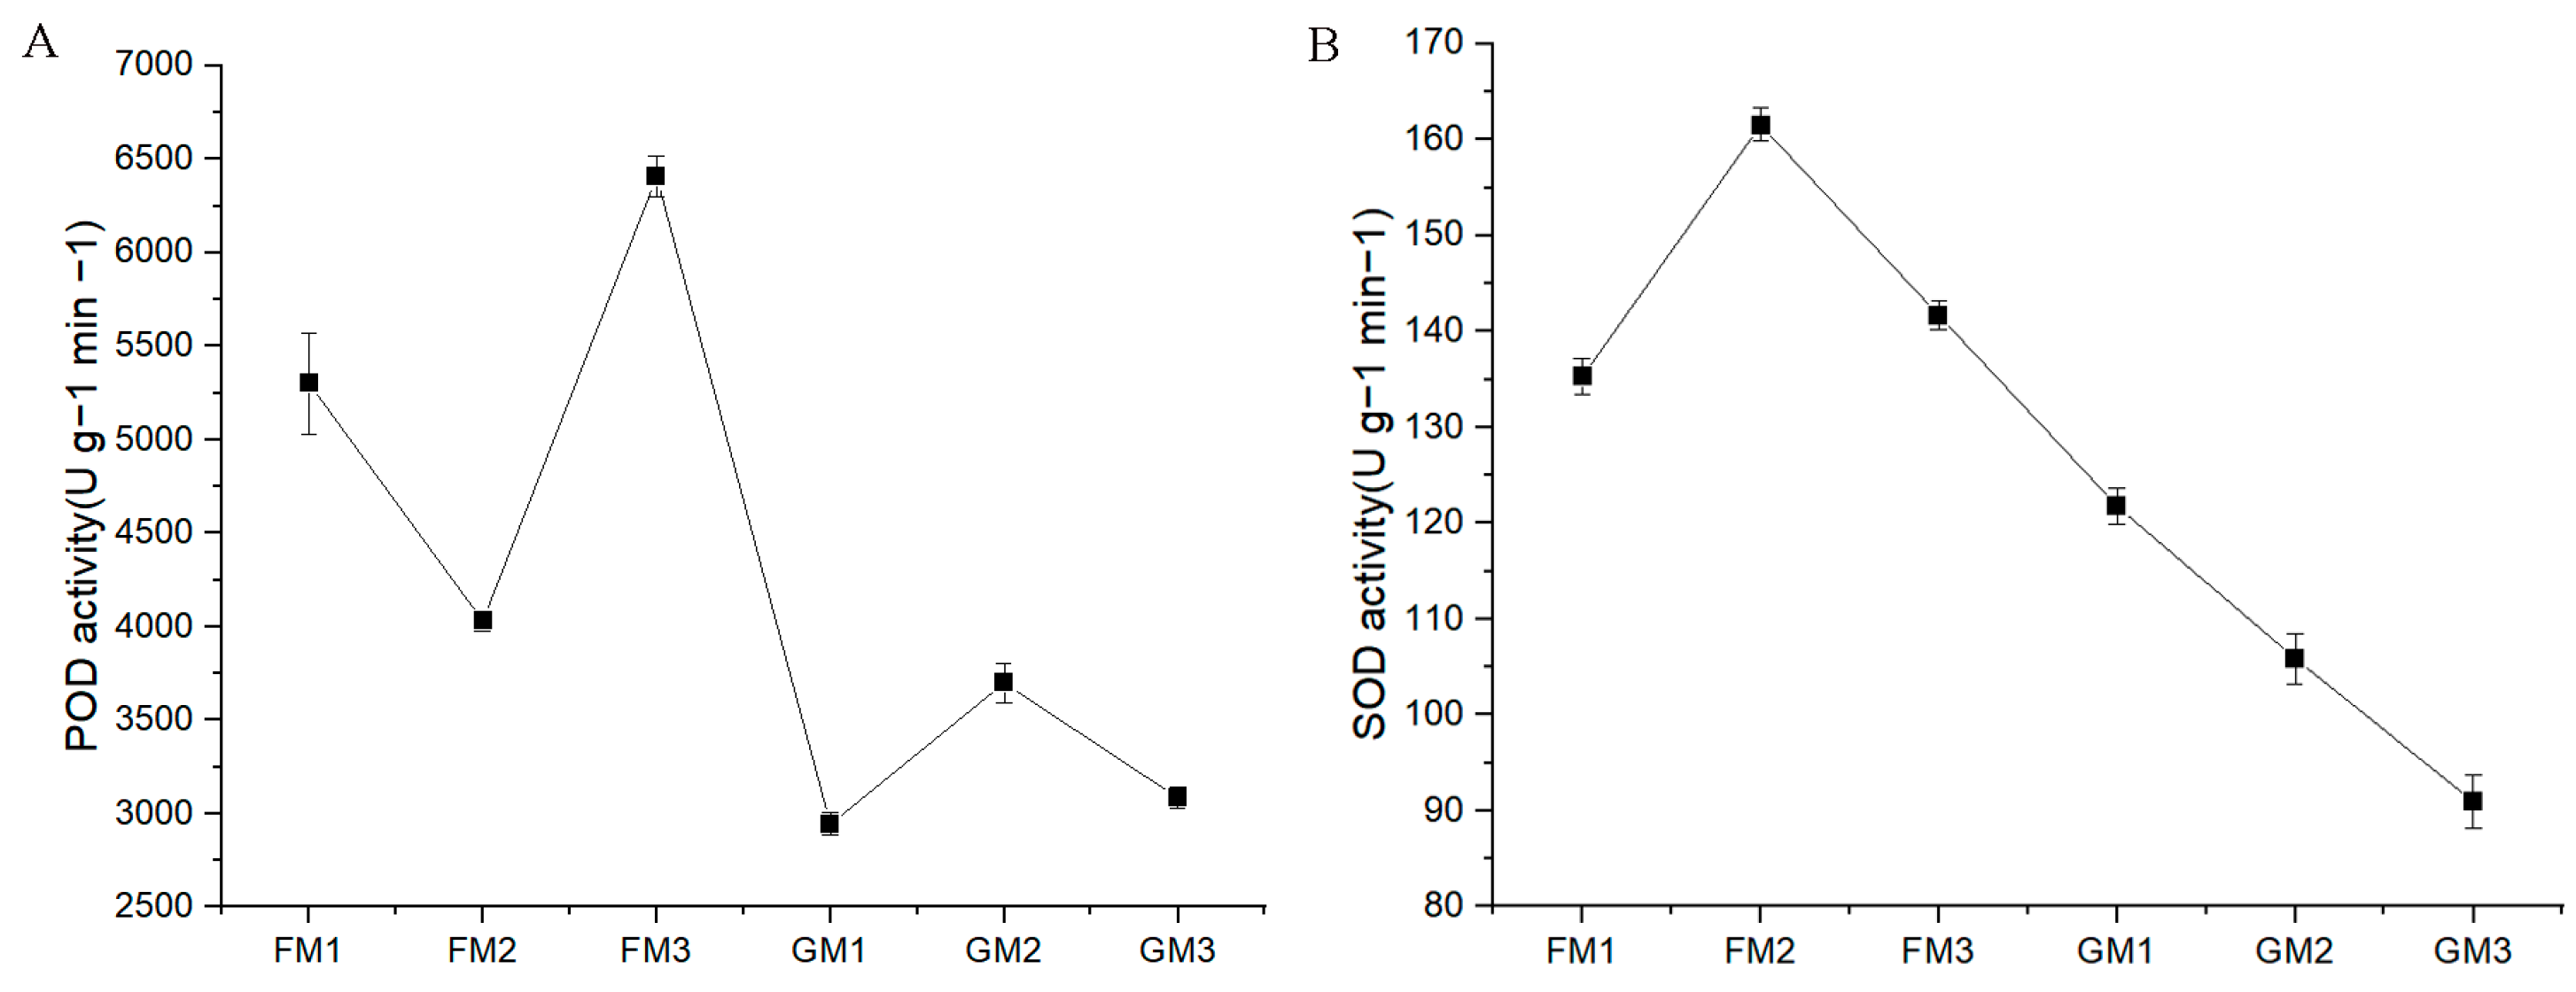
The detection results indicated that POD activity was greater in FM than in GM. POD activity was highest in FM3 and lowest in GM1. Moreover, SOD activity was also greater in FM than in GM. SOD activity was highest in FM2 and lowest in GM3 (Figure 2).
3.3. Transcriptome Sequencing Data
Transcriptome sequencing was performed on the six samples of “Fengdao No. 1” produced at a low temperature and those of “Grande” produced at a normal temperature, and 39.80 Gb clean data were obtained. The clean data of each sample reached 5.76 Gb or more, GC content was greater than 45.31%, and the N base content (N) in the clean data was 0. The percentage of Q20 bases was more than 98.1%, and the percentage of Q30 bases was 95.16% or greater (Table 1).
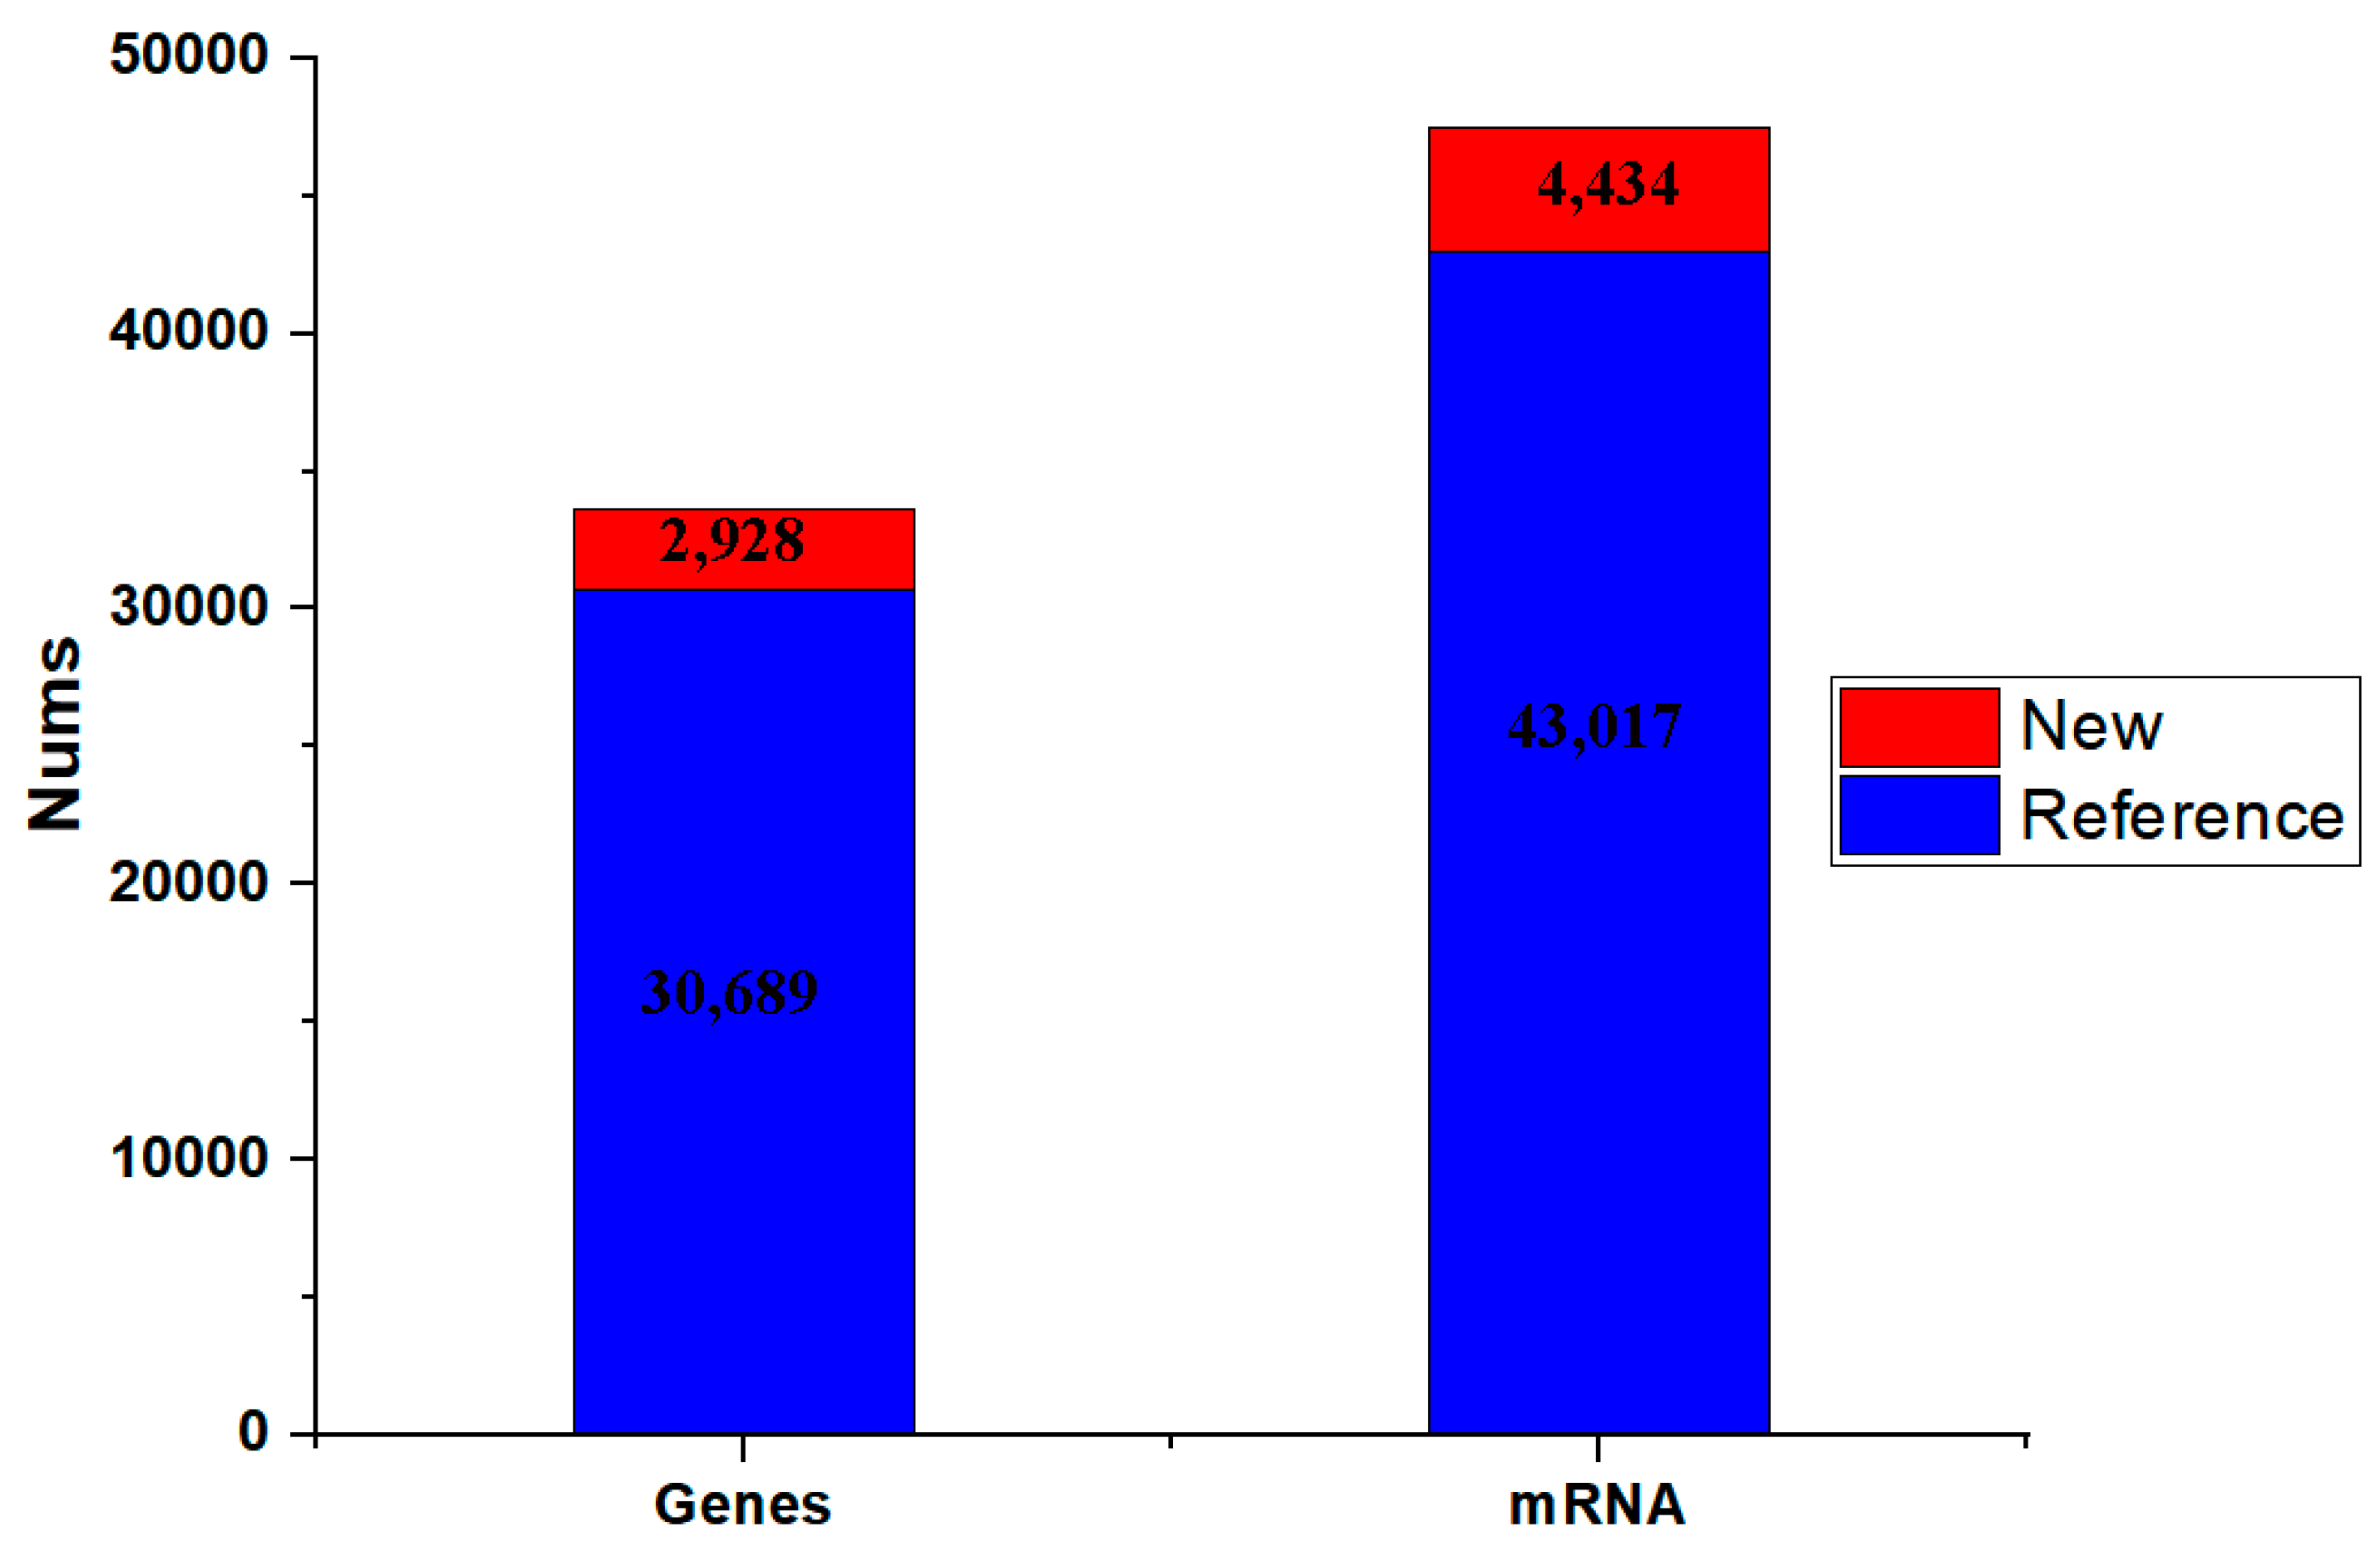
The published asparagus genome sequence was subsequently used as a reference sequence for alignment and transcriptome reconstruction. The clean reads of each sample were compared with the specified reference genome, and the efficiency of the comparison was greater than 90.39%. After StringTie was used to assemble the transcripts, 43,017 transcripts matched the reference genome, and 2709 transcripts were new transcripts. In addition, 30,689 genes could be compared with the reference genome, and the other 1957 genes were new transcript sequences, which may be related to differences between samples (Figure 3).
3.4. DEG Analysis between “Fengdao No. 1” and “Grande”
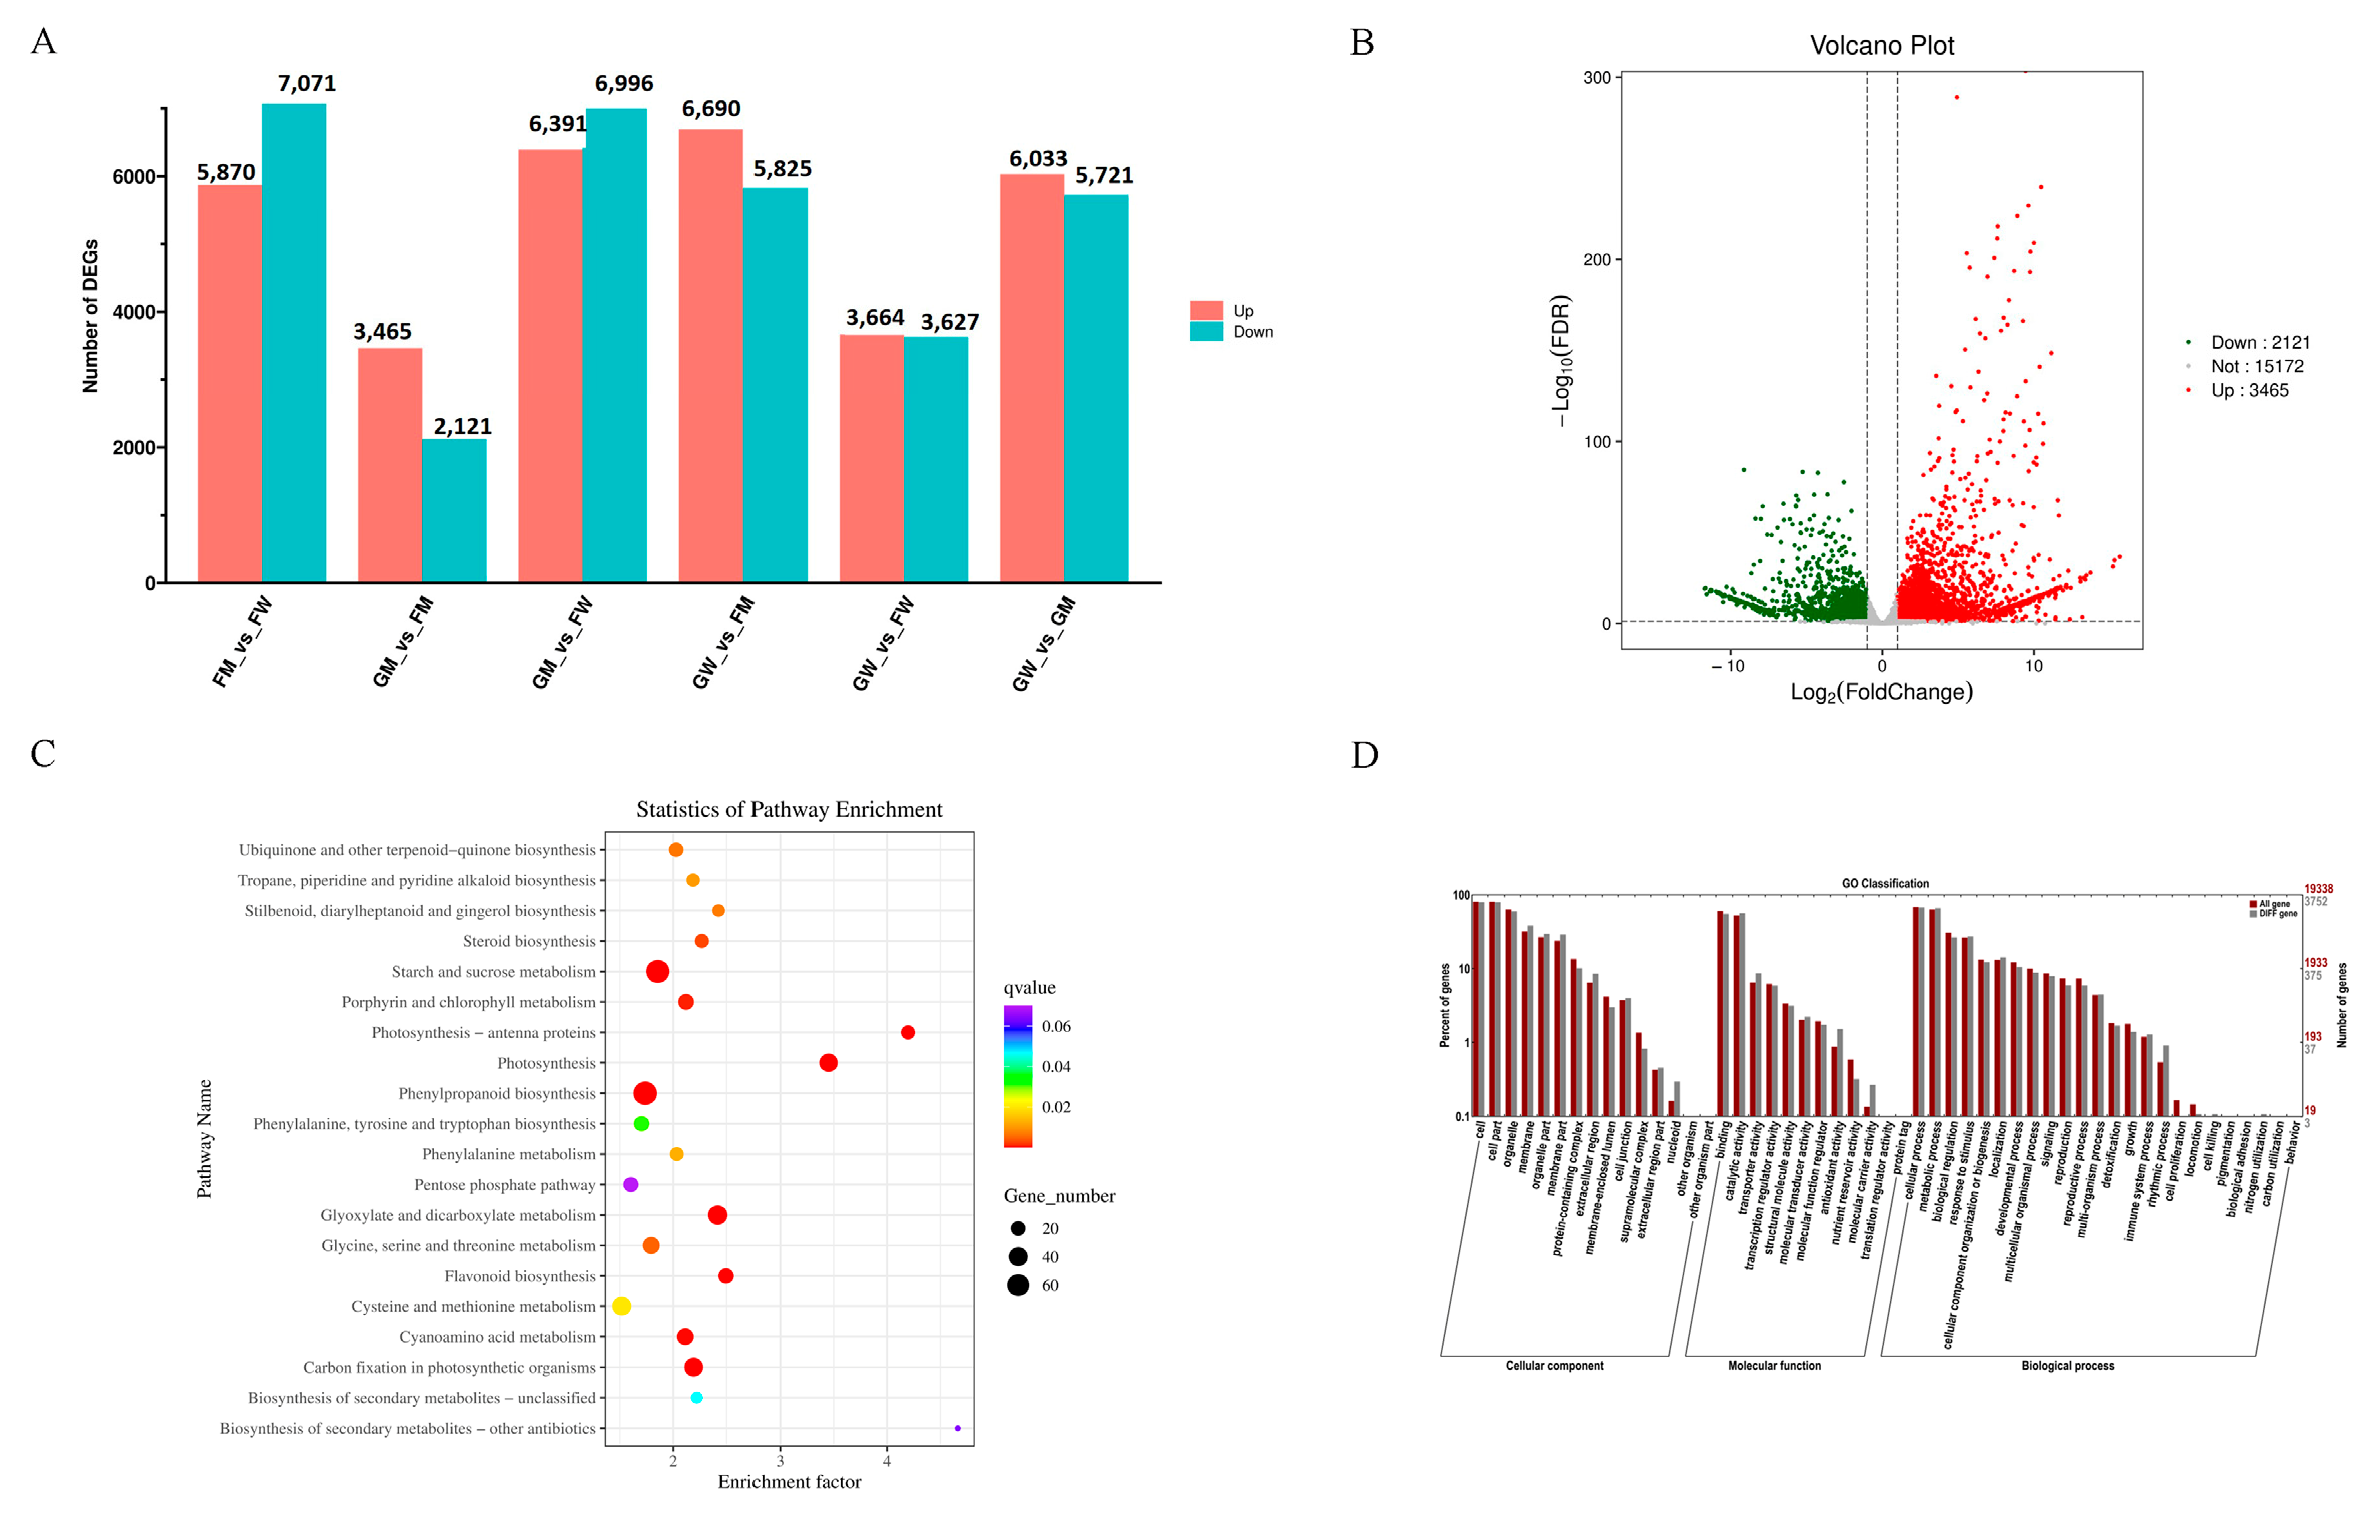
The DEG analysis revealed that 5488 DEGs exist between FM and GM (2072 up-regulated genes and 3416 down-regulated genes) (Figure 4A). Functional annotation was performed by comparing the DEGs with protein databases, and 3954, 3706, 1923, 1709, 4882, 2330, 3961, and 4878 genes were annotated with the Swiss-Prot, GO, KEGG, COG, KOG, Pfam, and NR databases, respectively (Figure 4B).
The result of KEGG enrichment revealed that most genes were enriched in the starch and sucrose metabolism pathway, followed by phenylpropanoid biosynthesis and carbon fixation in photosynthetic organisms (Figure 4C). The GO enrichment result indicated that most genes were enriched in the biological process (BP) category, followed by molecular function (MF) and cellular component (CC) (Figure 4D).
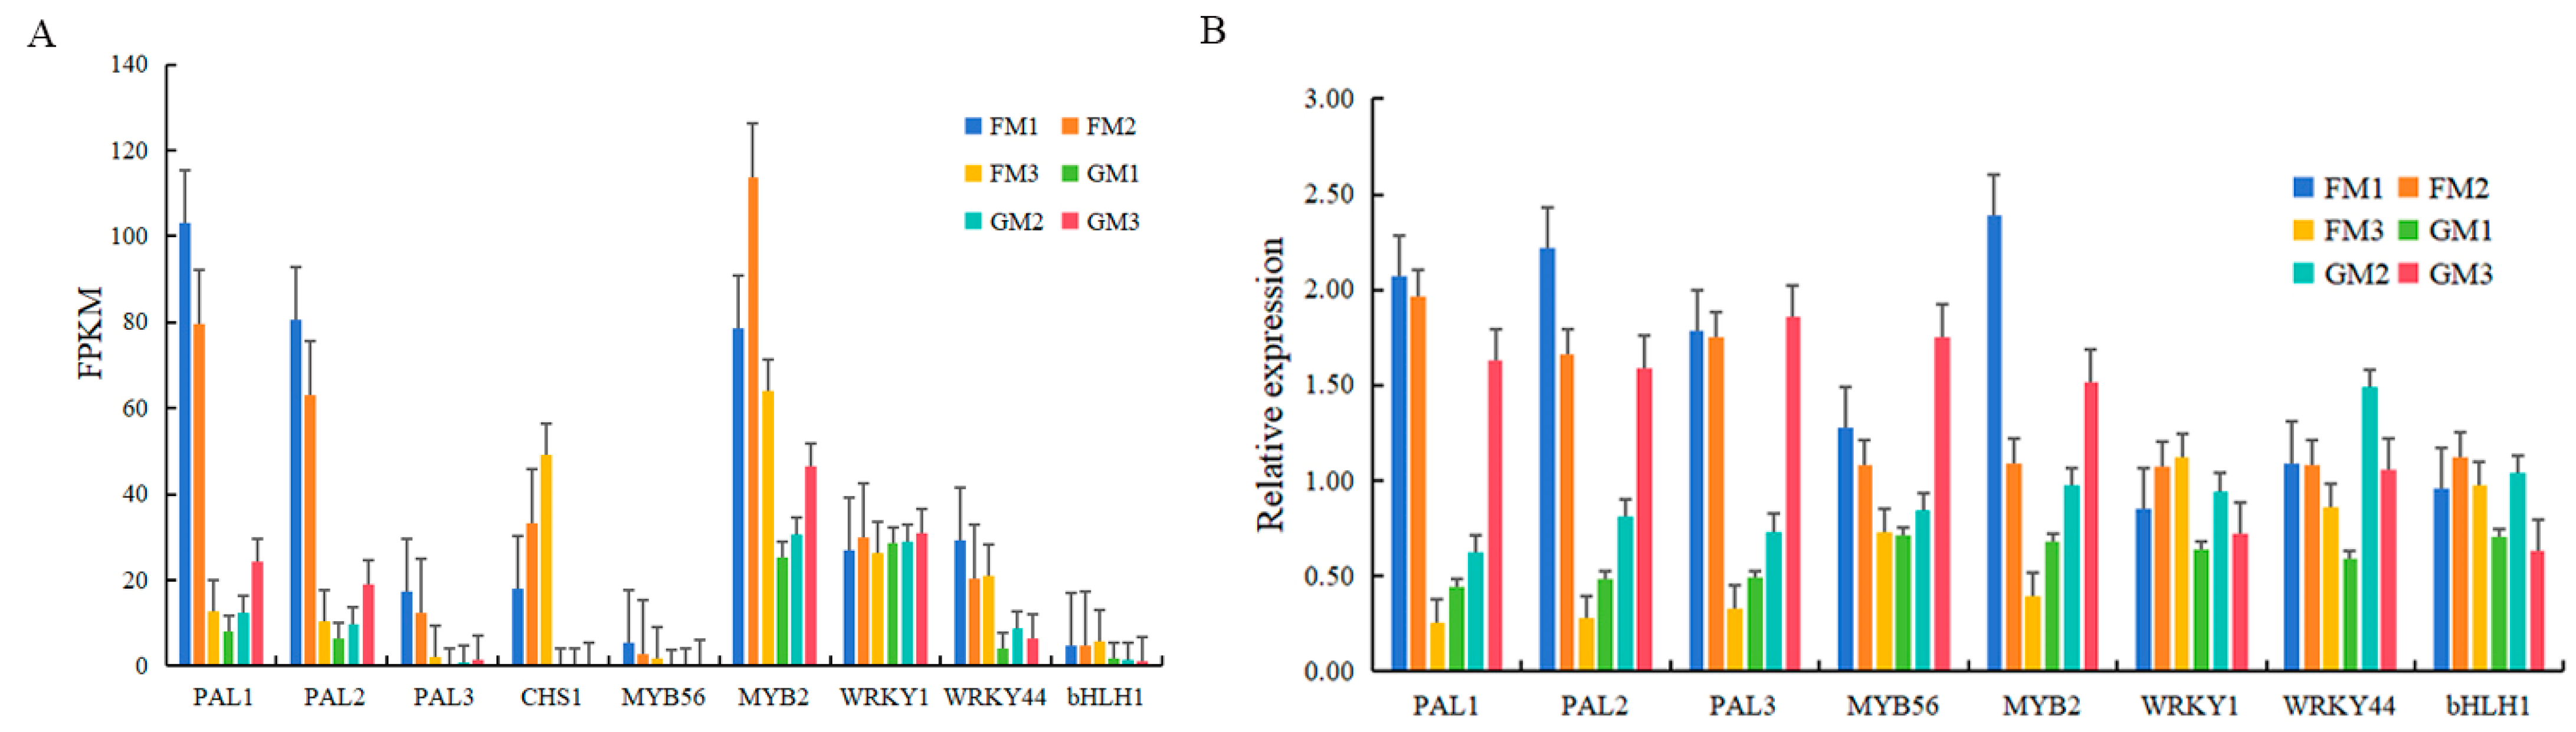
3.5. Candidate Key DEG Analysis and qRT-PCR Verification
To further study the function of key DEG response to low-temperature stress, we selected eight DEGs to perform the qRT-PCR experiment. Three DEGs belonging to the anthocyanin synthesis structural gene family, and another five DEGs belonging to the MYB-bHLH-WD40 (MBW) complex were selected. The results of qRT-PCR were consistent with the FPKM values, which indicated that the transcriptomic results were accurate and reliable (Figure 5).
3.6. Endogenous Hormone Analysis
The results of the endogenous hormone analysis revealed that three ABA class hormones (ABA, ABA-GE, and ABA-ald) and nine GA class hormones (GA20, GA9, GA3, GA15, GA53, GA12-ald, GA7, GA29, GA24, GA4, and GA19) were detected in the six samples. The ABA content was highest in the six samples, followed by the ABA-GE and GA29 content. It is worth noting that ABA showed a significant difference between FM and GM (Figure 6).
3.7. Correlation Analysis of DEGs and Hormones
The correlation analysis revealed that bHLH1, CHS1, and MYB56 may be important genes that regulate ABA. The endogenous hormone detection result showed that the ABA content was significantly different between FM and GM. Therefore, we speculated that MYB56 may be the key gene involved in the response to low temperature by regulating ABA in A. officinalis (Figure 7).
3.8. Preliminary Identification of AoMYB56
An evolutionary tree was constructed using MEGA X (1000 bootstrap), to determine the relationships between the MYB protein of A. thaliana and the AoMYB56 protein. The evolutionary tree showed that AoMYB56 shared the highest homology with AtMYB56, followed by AtMYB117, AtMYB105, and AtMYB110 (Figure 8).
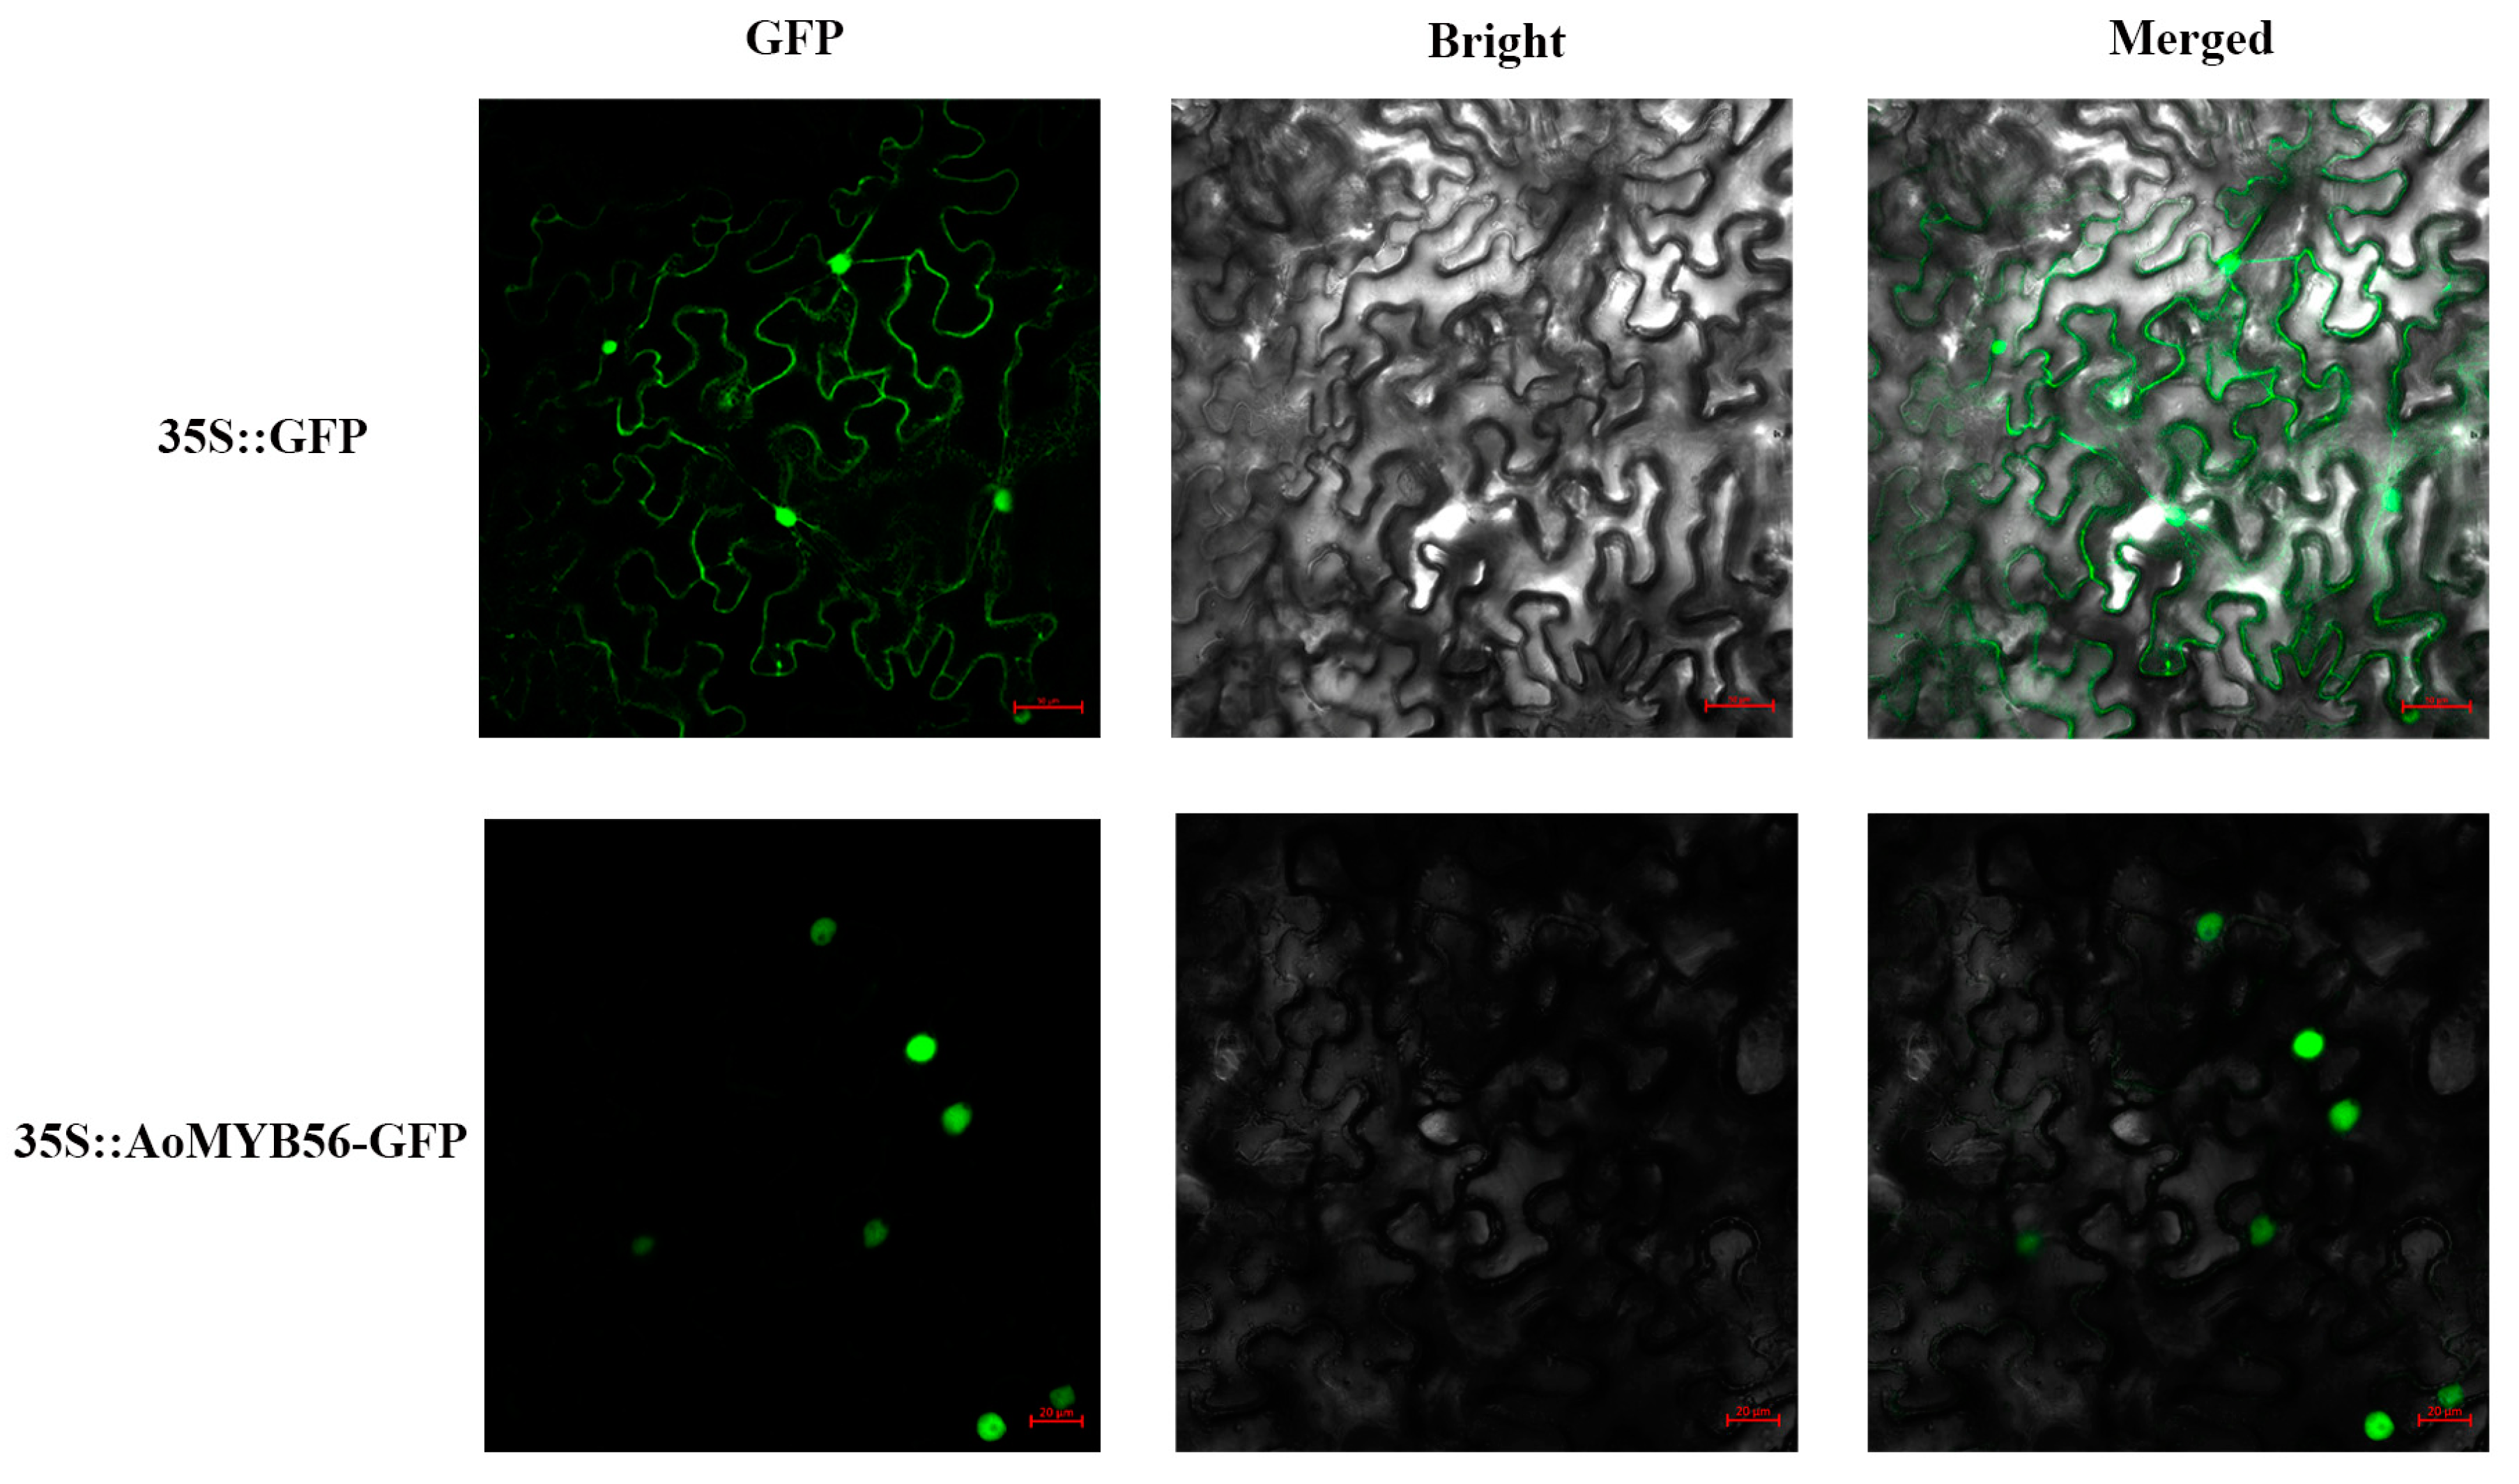
3.9. Subcellular Localization of AoMYB56
First, we used MLEG to identify AoMYB656 and found that it was localized in the nucleus. To verify this result, we constructed 35S::GFP-AoMYB56 plasmids and transfected them into tobacco protoplasts. Moreover, 35S::GFP fusion protein was expressed in the tobacco protoplast nucleus and cytomembrane as a positive control. The result of confocal microscopy showed that the plasmids were located in the nucleus, which is consistent with the predicted outcome (Figure 9).
4. Discussion
Low temperature is a vital environmental factor influencing plant growth, which delays the growth and development of plants, causing them to stagnate [37]. The production of A. officinalis, as an important vegetable worldwide, is often limited by low temperatures. Low temperatures slow the growth of A. officinalis and reduce its economic benefits. Therefore, it is important to identify low-temperature-resistant varieties of A. officinalis and explore the underlying molecular mechanism for further directive breeding to improve the economic benefits.
In this study, low-temperature-resistant varieties of A. officinalis were selected using a low-temperature treatment, and “Fengdao No. 1” was selected from six varieties. Transcriptome analysis between FM and GM was performed, and the results showed that 5488 DEGs were detected. Most DEGs were enriched in metabolic process categories. In our hormone detection experiment, “Fengdao No. 1” exhibited greater SOD and POD activities than the control group “Grande”. Previous study indicated that abiotic stress induces the accumulation of reactive oxygen species (ROS), while ROS-scavenging enzymes (SOD and POD) can protect plants from oxidative damage [38]. The result of our research indicated that the low-temperature tolerance of “Fengdao No. 1” may be enhanced by activating the ROS-scavenging enzyme system. That is probably because that the metabolic process system is the first to experience damage in plants under low temperatures, followed by a series of physiological and biochemical reactions.
ABA has been reported as an important hormone regulating abiotic stress in plants, including rice [39], maize [40], banana [41], and many other plants [42,43,44]. In lily, Cai found that Fluridone, a synthetic inhibitor of ABA, can effectively prevent the occurrence of dormancy in a lily tissue culture at low temperatures [45]. In this study, the ABA content was greater in “Fengdao No. 1” than in “Grande”. A. officinalis, like lily, is a bulbiferous plant; therefore, we speculated that ABA could promote development in “Fengdao No. 1” under low temperatures.
Evolutionary tree analysis showed that AoMYB56 shared the highest homology with AtMYB56. In a previous study, Zhang and colleagues reported that AtMYB56 could promote seed growth [46]. Therefore, we speculated that AoMYB56 may have a function similar to AtMYB56. The correlation analysis indicated that ABA was regulated by AoMYB56 in this study. Therefore, we speculated that AoMYB56 maybe the transcriptional activator of ABA signalling in A. officinalis. A previous report indicated that AtMYC2 (bHLH) and AtMYB2 are transcriptional activators of ABA signalling [47]. Plant transcription factors play important roles in low-temperature responses, and numerous MYB genes have been shown to respond to low-temperature stress [48,49]. Combining the above results, this study showed that AoMYB56 may act as a positive regulator under low-temperature stress by regulating ABA. This finding is consistent with previous reports showing that MYB is frequently involved in the ABA signalling-mediated regulation of plant adversity responses [50,51,52]. However, uncovering the detailed function of AoMYB56 requires further research, which we will conduct in future work.
5. Conclusions
Low temperatures influence the growth and development in almost all plants, include the important vegetable A. officinalis. To meet the large demand for A. officinalis in the spring market and improve the economic benefits of cultivating asparagus, the molecular mechanism underlying the response of A. officinalis to low temperatures was explored in this research. “Fengdao No. 1” was selected as a low-temperature-tolerant variety, and the transcriptome analysis and hormone analysis indicated that AoMYB56 may regulate ABA in A. officinalis. This research provides a theoretical basis for the further exploration of the low-temperature response in A. officinalis.
Supplementary Materials
The following supporting information can be downloaded at: https://www.mdpi.com/article/10.3390/genes15040486/s1, Table S1: The primers of qRT-PCR.
Author Contributions
Design of the experimental approach and writing of the original draft, R.Q.; main experiments, data analysis, and writing of the original draft, Y.Y. and J.Y.; image preparation, S.W. and Y.C. All authors have read and agreed to the published version of the manuscript.
Funding
Technology Commissioner of Wenzhou (2022OHKJ1471), Ouhai Science Innovation Center Program of Zhejiang Academy of Agricultural Sciences (20220HKC0005) and Zhejiang Leading Talents Program (2024C04006).
Institutional Review Board Statement
Not applicable.
Informed Consent Statement
Not applicable.
Data Availability Statement
The data were uploaded to the NCBI database (https://www.ncbi.nlm.nih.gov/Traces/study/?acc=PRJNA1049888, accessed on 2 November 2023). The data that support the findings of this study are available from the corresponding author upon reasonable request.
Conflicts of Interest
The authors declare no conflicts of interest.
References
- Yu, T.; Nassuth, A.; Peterson, R. Characterization of the interaction between the dark septate fungus Phialocephala fortinii and Asparagus officinalis roots. Can. J. Microbiol. 2001, 47, 741. [Google Scholar] [CrossRef] [PubMed]
- He, C.; Hsiang, T.; Wolyn, D. Induction of systemic disease resistance and pathogen defence responses in Asparagus officinalis inoculated with nonpathogenic strains of Fusarium oxysporum. Plant Pathol. 2010, 5, 225–230. [Google Scholar] [CrossRef]
- Gilmour, S.; Zarka, D.; Stockinger, E. Low temperature regulation of the Arabidopsis CBF family of AP2 transcriptional activators as an early step in cold-induced COR gene expression. Plant J. 2010, 16, 433–442. [Google Scholar] [CrossRef] [PubMed]
- Song, Z.; Lai, X.; Chen, H.; Wang, L.; Pang, X.; Hao, Y.; Lu, W.; Chen, W.; Zhu, X.; Li, X. Role of MaABI5-like in abscisic acid-induced cold tolerance of ‘Fenjiao’ banana fruit. Hortic. Res. 2022, 9, uhac130. [Google Scholar] [CrossRef]
- Kreps, J.; Wu, Y.; Chang, H. Transcriptome changes for Arabidopsis in response to salt, osmotic, and cold Stress. Plant Physiol. 2002, 130, 2129–2141. [Google Scholar] [CrossRef]
- Jiang, G.; Wang, S.; Xie, J.; Tan, P.; Han, L. Discontinuous low temperature stress and plant growth regulators during the germination period promote roots growth in alfalfa (Medicago sativa L.). Plant Physiol. Biochem. 2023, 11, 197–208. [Google Scholar] [CrossRef]
- Yang, C.; Dong, A.; Deng, L. Deciphering the change pattern of lipid metabolism in Saccharomyces cerevisiae responding to low temperature. Biochem. Eng. J. 2023, 12, 190–201. [Google Scholar] [CrossRef]
- Shinozaki, K.; Yamaguchi-Shinozaki, K. Molecular response to dehydration and low temperature: Differences and cross-talk between two stress signaling pathways. Curr. Opin. Plant Biol. 2000, 3, 217–223. [Google Scholar] [CrossRef]
- Renaut, J.; Hausman, J.; Wisniewski, M. Proteomics and low-temperature studies: Bridging the gap between gene expression and metabolism. Physiol. Plant. 2010, 126, 97–109. [Google Scholar] [CrossRef]
- Guan, Y.; Hwarari, D.; Korboe, H.; Ahmad, B.; Cao, Y.; Movahedi, A.; Yang, L. Low temperature stress-induced perception and molecular signaling pathways in plants. Environ. Exp. Bot. 2023, 207, 105–119. [Google Scholar] [CrossRef]
- Cao, F.; Yoshioka, K.; Desveaux, D. The roles of ABA in plant-pathogen interactions. J. Plant Res. 2011, 124, 489–499. [Google Scholar] [CrossRef]
- Teng, Z.; Lyu, J.; Chen, Y.; Zhang, J.; Ye, N. Effects of stress-induced ABA on root architecture development: Positive and negative actions. Crop J. 2023, 11, 1072–1079. [Google Scholar] [CrossRef]
- Alwutayd, K.; Rawat, A.; Sheikh, A.; Almeida-Trapp, M.; Veluchamy, A.; Jalal, R.; Karampelias, M.; Froehlich, K.; Alzaed, W.; Tabassum, N.; et al. Microbe-induced drought tolerance by ABA-mediated root architecture and epigenetic reprogramming. EMBO Rep. 2023, 24, e56754. [Google Scholar] [CrossRef] [PubMed]
- Yoshida, T.; Fujita, Y.; Maruyama, K. Four Arabidopsis AREB/ABF transcription factors function predominantly in gene expression downstream of SnRK2 kinases in abscisic acid signalling in response to osmotic stress. Plant Cell Environ. 2015, 38, 35–49. [Google Scholar] [CrossRef] [PubMed]
- Gupta, K.; Wani, S.; Razzaq, A. Abscisic acid:role in fruit development and ripening. Front. Plant Sci. 2022, 13, 817500. [Google Scholar] [CrossRef] [PubMed]
- Zhan, W.; Wang, Y.; Duan, W.; Li, A.; Miao, Y.; Wang, H.; Meng, J.; Liu, H.; Niu, L.; Pan, L.; et al. Preliminary analysis, combined with omics of chilling injury mechanism of peach fruits with different cold sensitivities during postharvest cold storage. Horticulturae 2024, 10, 46. [Google Scholar] [CrossRef]
- Narusaka, Y.; Nakashima, K.; Shinwari, Z. Interaction between two cis-acting elements, ABRE and DRE, in ABA-dependent expression of Arabidopsis rd29A gene in response to dehydration and high-salinity stresses. Plant J. 2003, 34, 137–148. [Google Scholar] [CrossRef]
- Akihiro, M.; Junko, I.; Taeko, M. Arabidopsis transcriptome analysis under drought, cold, high-Salinity and ABA treatment conditions using a tiling array. Plant Cell Physiol. 2008, 8, 12–20. [Google Scholar]
- Sybilska, E.; Daszkowska-Golec, A. A complex signaling trio in seed germination: Auxin-JA-ABA. Trends Plant Sci. 2023, 8. [Google Scholar] [CrossRef]
- Oh, J.; Hong, S.; Lee, Y. Modulation of gene expressions and enzyme activities of methionine sulfoxide reductases by cold, ABA or high salt treatments in Arabidopsis. Plant Sci. 2005, 169, 1030–1036. [Google Scholar] [CrossRef]
- Jing, Y.; Lin, Z.; Jing, C. Effects of exogenous ABA on cold resistance and tender seedlings growth of winter wheat dongnongdongmai 1 in cold area. J. Triticeae Crops 2008, 28, 883–887. [Google Scholar]
- Yubero, M.; Enriqueta, M.; Medina, N. Identification of a strawberry gene encoding a non-specific lipid transfer protein that responds to ABA, wounding and cold stress. J. Exp. Bot. 2003, 389, 1865–1877. [Google Scholar] [CrossRef] [PubMed]
- Liang, J.; Li, J.; Liu, C.; Pan, W.Q.; Wu, W.J.; Shi, W.J.; Wang, L.J.; Yi, M.F.; Wu, J. GhbZIP30-GhCCCH17 module accelerates corm dormancy release by reducing endogenous ABA under cold storage in Gladiolus. Plant Cell Environ. 2023, 11, 14–30. [Google Scholar] [CrossRef] [PubMed]
- Dubos, C.; Stracke, R.; Grotewold, E.; Weisshaar, B.; Martin, C.; Lepiniec, L. MYB transcription factors in Arabidopsis. Trends Plant Sci. 2010, 15, 573–581. [Google Scholar] [CrossRef] [PubMed]
- Katiyar, A.; Smita, S.; Lenka, K.; Rajwanshi, R.; Chinnusamy, V.; Bansal, K.C. Genome-wide classification and expression analysis of MYB transcription factor families in rice and Arabidopsis. BMC Genom. 2012, 13, 544. [Google Scholar] [CrossRef] [PubMed]
- Chen, Z.; Chen, D.; Dai, Q.; Zhang, H.; Liu, Y.; Shen, W.; Zhu, B.; Cui, C.; Tan, C. Genome-wide identification of R2R3-MYB gene family and association with anthocyanin biosynthesis in Brassica species. BMC Genom. 2022, 23, 441. [Google Scholar] [CrossRef] [PubMed]
- An, P.; Wang, F.; Zhang, W.; Xu, H.F.; Bi, S.Q.; You, C.X.; Hao, Y.J. An apple MYB transcription factor regulates cold tolerance and anthocyanin accumulation and undergoes MIEL1-mediated degradation. Plant Biotechnol. J. 2020, 18, 337–353. [Google Scholar] [CrossRef] [PubMed]
- Cheng, J.; Yu, K.J.; Shi, Y.; Wang, J.; Duan, C.Q. Transcription factor VviMYB86 oppositely regulates proantho cyanidin and anthocyanin biosynthesis in grape berries. Front. Plant Sci. 2020, 11, 613677. [Google Scholar] [CrossRef] [PubMed]
- Chen, Z.; Li, J.; Hu, H.; Guo, J.; Liu, A.; Zhang, B. Acotton MYB transcription factor, GbMYB5, is positively involved in plant adaptive response to drought stress. Plant Cell Physiol. 2015, 56, 917–929. [Google Scholar] [CrossRef]
- Hong, Y.; Ahmad, N.; Zhang, J.; Lv, Y.; Zhang, X.; Ma, X.; Xiuming, L.; Na, Y. Genome-wide analysis and transcriptional reprogrammings of MYB superfamily revealed positive insights into abiotic stress responses and anthocyanin accumulation in Carthamus tinctorius L. Mol. Genet. Genom. 2022, 297, 125–145. [Google Scholar] [CrossRef]
- Masrur, R.; Allan, F.; Daiqing, H. Multiple roles of the transcription factor AtMYBR1/AtMYB44 in ABA signaling, stress responses, and leaf senescence. BMC Plant Biol. 2013, 13, 192. [Google Scholar]
- Medina, L.; Cumplido, G.; Amil, F. MYB10 plays a major role in the regulation of flavonoid/phenylpropanoid metabolism during ripening of Fragaria × ananassa fruits. J. Exp. Bot. 2014, 65, 401–417. [Google Scholar] [CrossRef]
- Ye, Y.; Wang, J.; Ni, Z.; Meng, X.; Xu, L. Small RNA and degradome sequencing reveal roles of miRNAs in strobilus development in masson pine (Pinus massoniana). Ind. Crop. Prod. 2020, 154, 112724. [Google Scholar] [CrossRef]
- Yang, K.; Liang, Z.; Wu, C. Analysis on differentially expressed genes in watermelon rind color based on RNA–Seq. J. Cent. South Univ. 2016, 23, 2818–2826. [Google Scholar] [CrossRef]
- Ye, Y.; Han, X.; Rong, H.; Qian, R.; Zheng, J.; Ni, Z.; Xu, L.A. Effect of the PmARF6 Gene from Masson Pine (Pinus massoniana) on the Development of Arabidopsis. Genes 2022, 13, 469. [Google Scholar] [CrossRef] [PubMed]
- Xu, Q.; Jian, H.; Zhao, W.; Li, J.; Zou, X.; Dong, X. Early weaning stress induces intestinal microbiota disturbance, mucosal barrier dysfunction and inflammation response activation in pigeon squabs. Front. Microbiol. 2022, 13, 866–877. [Google Scholar] [CrossRef]
- Chinnusamy, V.; Zhu, J.; Zhu, J. Cold stress regulation of gene expression in plants. Trends Plant Sci. 2007, 12, 444–451. [Google Scholar] [CrossRef] [PubMed]
- Choudhury, F.; Rivero, R.; Blumwald, E.; Mittler, R. Reactive oxygen species, abiotic stress and stress combination. Plant. J. 2017, 90, 856–867. [Google Scholar] [CrossRef] [PubMed]
- Rabbani, M.; Maruyama, K.; Abe, H.; Khan, M.A.; Katsura, K.; Ito, Y.; Yoshiwara, K.; Seki, M.; Shinozaki, K.; Yamaguchi-Shinozaki, K. Monitoring expression profiles of rice genes under cold, drought, and high-salinity stresses and abscisic acid application using cDNA microarray and RNA gel-blot analyses. Plant Physiol. 2003, 133, 175–185. [Google Scholar] [CrossRef]
- Gao, J.; Zhang, Y.; Xu, C.; Wang, X.; Wang, P.; Huang, S. Abscisic acid collaborates with lignin and flavonoid to improve pre-silking drought tolerance by tuning stem elongation and ear development in maize (Zea mays L.). Plant J. 2023, 12, 9–18. [Google Scholar] [CrossRef]
- Song, J.; Sajad, S.; Xia, D.; Jiang, S. Identification of F-box gene family in Brassica oleracea and expression analysis in response to low-temperature stress. Plant Physiol. Biochem. 2023, 199, 107717. [Google Scholar] [CrossRef]
- Ren, X.; Chen, Z.; Liu, Y.; Zhang, H.; Zhang, M.; Liu, Q.; Hong, X.; Zhu, J.K.; Gong, Z. ABO3, a WRKY transcription factor, mediates plant responses to abscisic acid and drought tolerance in Arabidopsis. Plant J. 2010, 63, 417–429. [Google Scholar] [CrossRef]
- Ruth, F. Abscisic Acid synthesis and response. Am. Soc. Plant Biol. 2013, 11, e0166. [Google Scholar]
- Iuchi, S.; Kobayashi, M.; Taji, T.; Naramoto, M.; Seki, M.; Kato, T.; Tabata, S.; Kakubari, Y.; Yamaguchi-Shinozaki, K.; Shinozaki, K. Regulation of drought tolerance by gene manipulation of 9-cis-epoxycarotenoid dioxygenase, a key enzyme in abscisic acid biosynthesis in Arabidopsis. Plant J. 2010, 27, 325–333. [Google Scholar] [CrossRef] [PubMed]
- Cai, Z.; Li, R.; Zhao, Z.; Chen, Y.; Lu, C. Association between dormancy release and phenolic metabolic alteration induced by low temperature in Cardiocrinumgiganteum bulbs. J. Trop. Subtrop. Bot. 2024, 32, 209–218. [Google Scholar]
- Zhang, Y.; Liang, W.; Shi, J.; Xu, J.; Zhang, D. MYB56 encoding a R2R3 MYB transcription factor regulates seed size in Arabidopsis thaliana. J. Integr. Plant Biol. 2013, 55, 1166–1178. [Google Scholar] [CrossRef] [PubMed]
- Abe, H. Arabidopsis AtMYC2 (bHLH) and AtMYB2 (MYB) Function as transcriptional activators in abscisic acid signaling. Plant Cell 2003, 15, 63–78. [Google Scholar] [CrossRef] [PubMed]
- Xie, X.; Li, S.; Zhang, R.; Zhao, J.; Chen, Y.C.; Zhao, Q.; Yao, Y.X.; You, C.X.; Zhang, X.S.; Hao, Y.J. The bHLH transcription factor MdbHLH3 promotes anthocyanin accumulation and fruit colouration in response to low temperature in apples. Plant Cell Environ. 2012, 35, 1884–1897. [Google Scholar] [CrossRef]
- Yang, Y.; Jiang, M.; Feng, J.; Wu, C.; Shan, W.; Kuang, J.; Chen, J.; Hu, Z.; Lu, W. Transcriptome analysis of low-temperature-affected ripening revealed MYB transcription factors-mediated regulatory network in banana fruit. Food Res. Int. 2021, 1, 148. [Google Scholar] [CrossRef]
- Fujita, Y.; Fujita, M.; Shinozaki, K. ABA-mediated transcriptional regulation in response to osmotic stress in plants. J. Plant Res. 2011, 124, 509–525. [Google Scholar] [CrossRef]
- Seo, P.J.; Xiang, F.; Qiao, M.; Park, J.Y.; Lee, Y.N.; Kim, S.G.; Lee, Y.H.; Park, W.J.; Park, C.M. The MYB96 transcription factor mediates abscisic acid signaling during drought stress response in Arabidopsis. Plant Physiol. 2009, 151, 275–289. [Google Scholar] [CrossRef] [PubMed]
- Li, J.; Zhou, H.; Xiong, C.; Peng, Z.; Du, W.; Li, H.; Wang, L.; Ruan, C. Genome-wide analysis R2R3-MYB transcription factors in Xanthoceras sorbifolium Bunge and functional analysis of XsMYB30 in drought and salt stresses tolerance. Ind. Crops Prod. 2022, 17, 178–185. [Google Scholar] [CrossRef]
Figure 1.
Growth conditions of six asparagus varieties under low-temperature, represented by a different colour. The X axis shows the low-temperature treatment time, while the Y axis shows the tip growth status.
Figure 1.
Growth conditions of six asparagus varieties under low-temperature, represented by a different colour. The X axis shows the low-temperature treatment time, while the Y axis shows the tip growth status.

Figure 2.
POD (A) and SOD (B) activity determination in “Fengdao No. 1” and “Grande”. (A) The X axis shows the different samples, while the Y axis shows POD activity. (B) The Xaxis shows the different samples, while the Y axis shows SOD activity.
Figure 2.
POD (A) and SOD (B) activity determination in “Fengdao No. 1” and “Grande”. (A) The X axis shows the different samples, while the Y axis shows POD activity. (B) The Xaxis shows the different samples, while the Y axis shows SOD activity.

Figure 3.
Transcriptome reconstruction results. The blue bar chart represents the number of genes compared with the reference genome, and the red bar chart represents the number of genes which are new transcript sequences. The X axis represents the numbers (Nums), and the Y axis represents the genes or mRNAs.

Figure 4.
DEG analysis. (A) DEG annotations in the seven databases. The X axis shows the different databases, while the Y axis shows the gene number. Different databases are represented by different colours. (B) Volcano plot of DEGs. The X axis shows the FDR, while the Y axis shows the fold change. Green dots represent down-regulated genes, and red dots represent up-regulated genes. (C) KEGG pathway analysis of DEGs. The X axis shows the enrichment factor, while the Y axis shows the pathway name. The larger the circle, the more the genes. (D) GO enrichment of DEGs. The X axis shows the Go classification, while the Y axis shows the percentage of genes.

Figure 5.
FPKM (A) and qRT-PCR (B) results of eight DEGs. Different samples are represented by different colours. The X axis represents the DEGs, while the Y axis represents FPKM (A) or relative expression (B).
Figure 5.
FPKM (A) and qRT-PCR (B) results of eight DEGs. Different samples are represented by different colours. The X axis represents the DEGs, while the Y axis represents FPKM (A) or relative expression (B).

Figure 6.
Endogenous hormone content in FM and GM. ABA-ald: abscisic acid aldosterone; ABA-GE: β-D-glucopyranosyl abscisate; GA12-ald: gibberellin 12 aldosterone. The X axis represents the different endogenous hormones, while the Y axis shows the hormone content. * represent significant (p < 0.05), ** represent highly significant (p < 0.01).
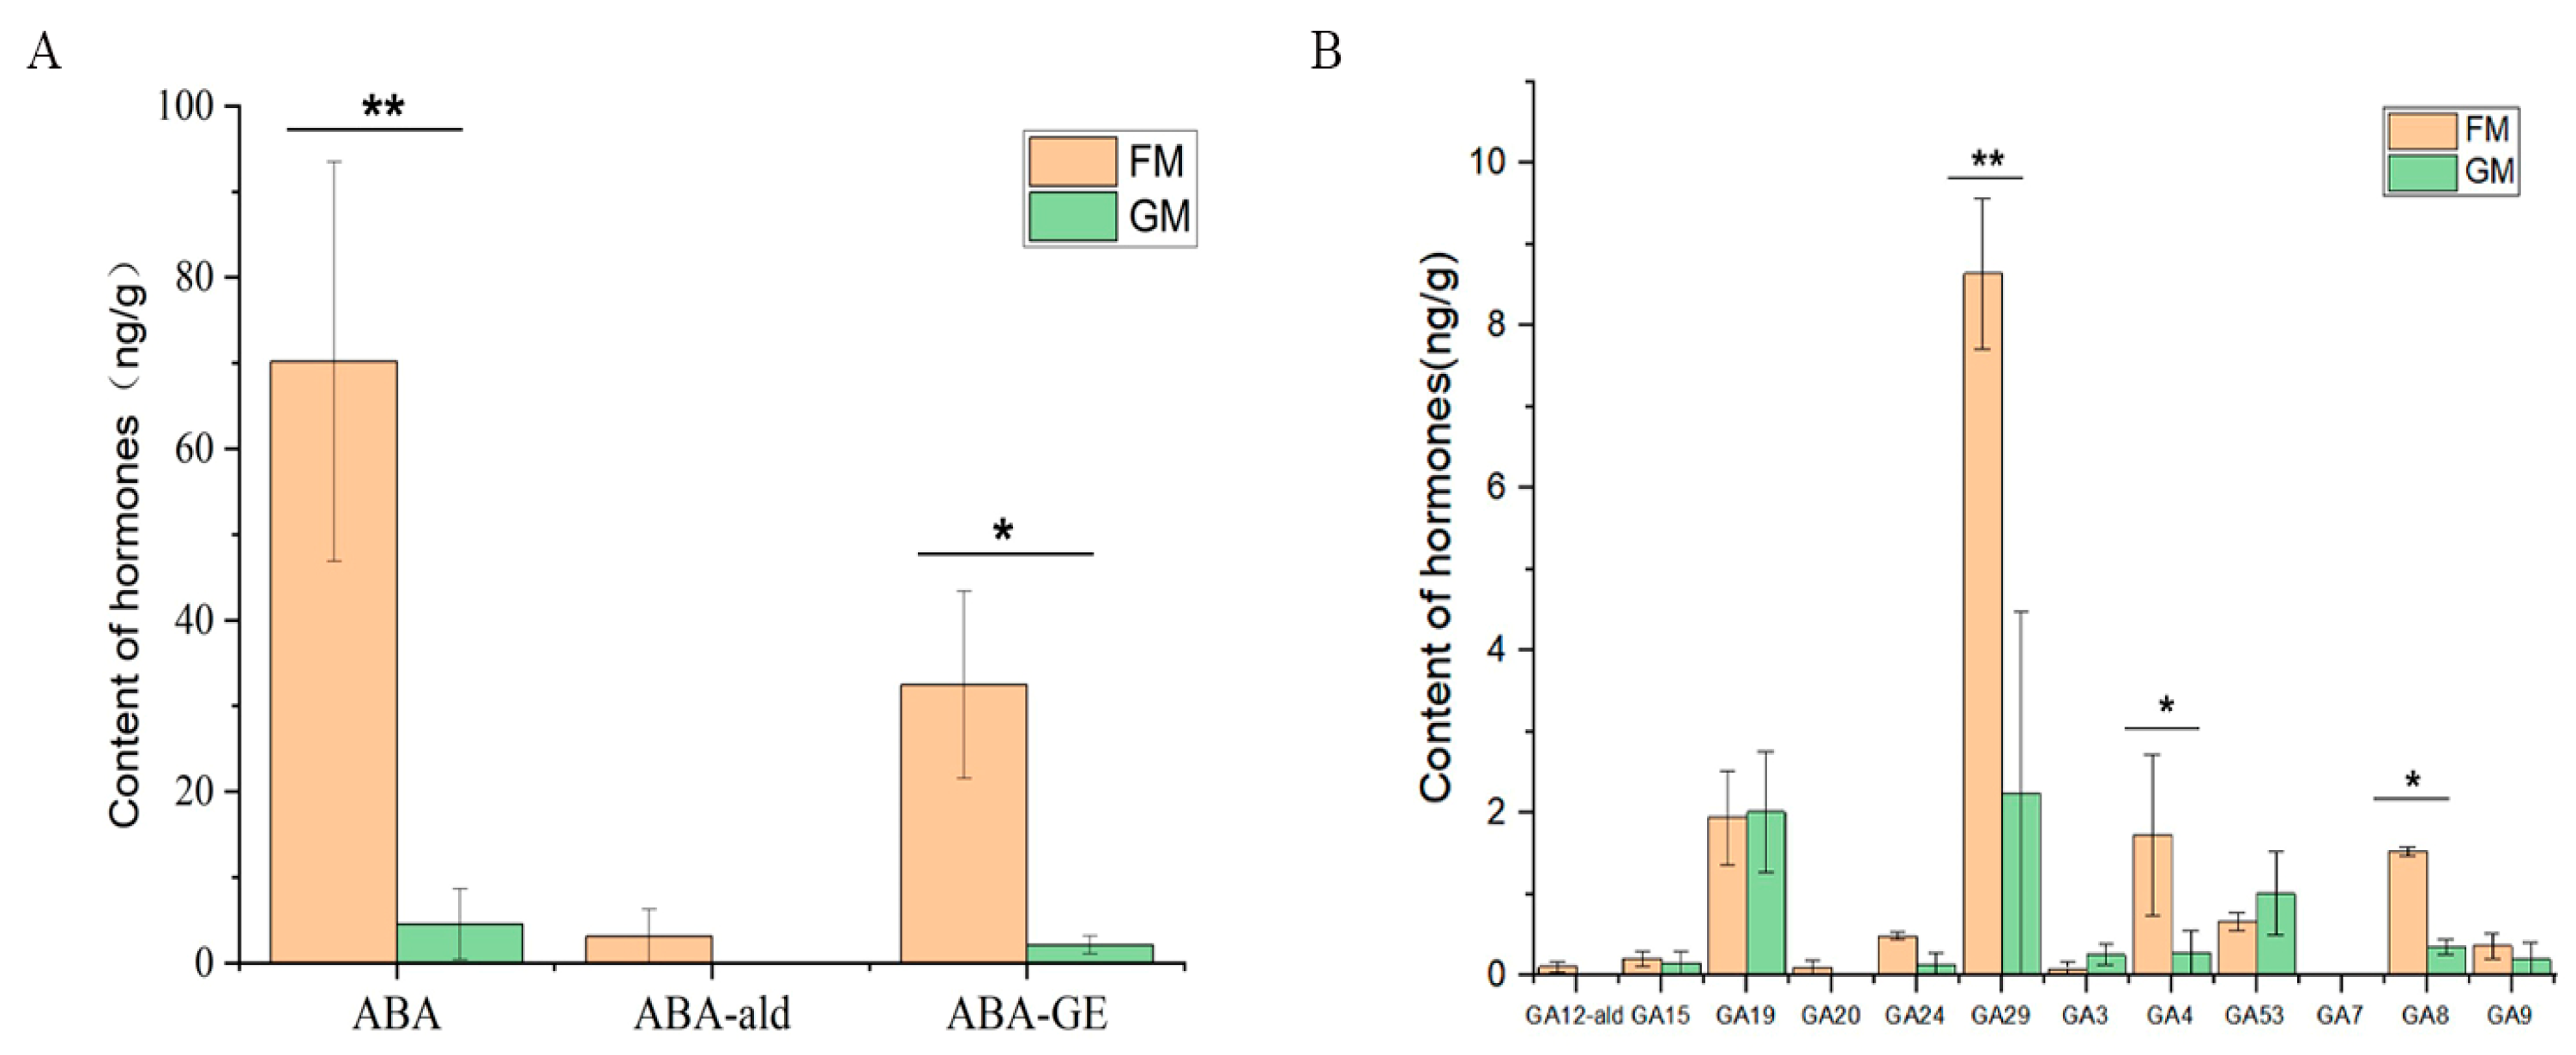
Figure 7.
Correlation analysis of DEGs and hormones. Degree is represented by the colour and loop size. Positive is represented by the solid yellow line, while negative is represented by the grey dotted line.
Figure 7.
Correlation analysis of DEGs and hormones. Degree is represented by the colour and loop size. Positive is represented by the solid yellow line, while negative is represented by the grey dotted line.
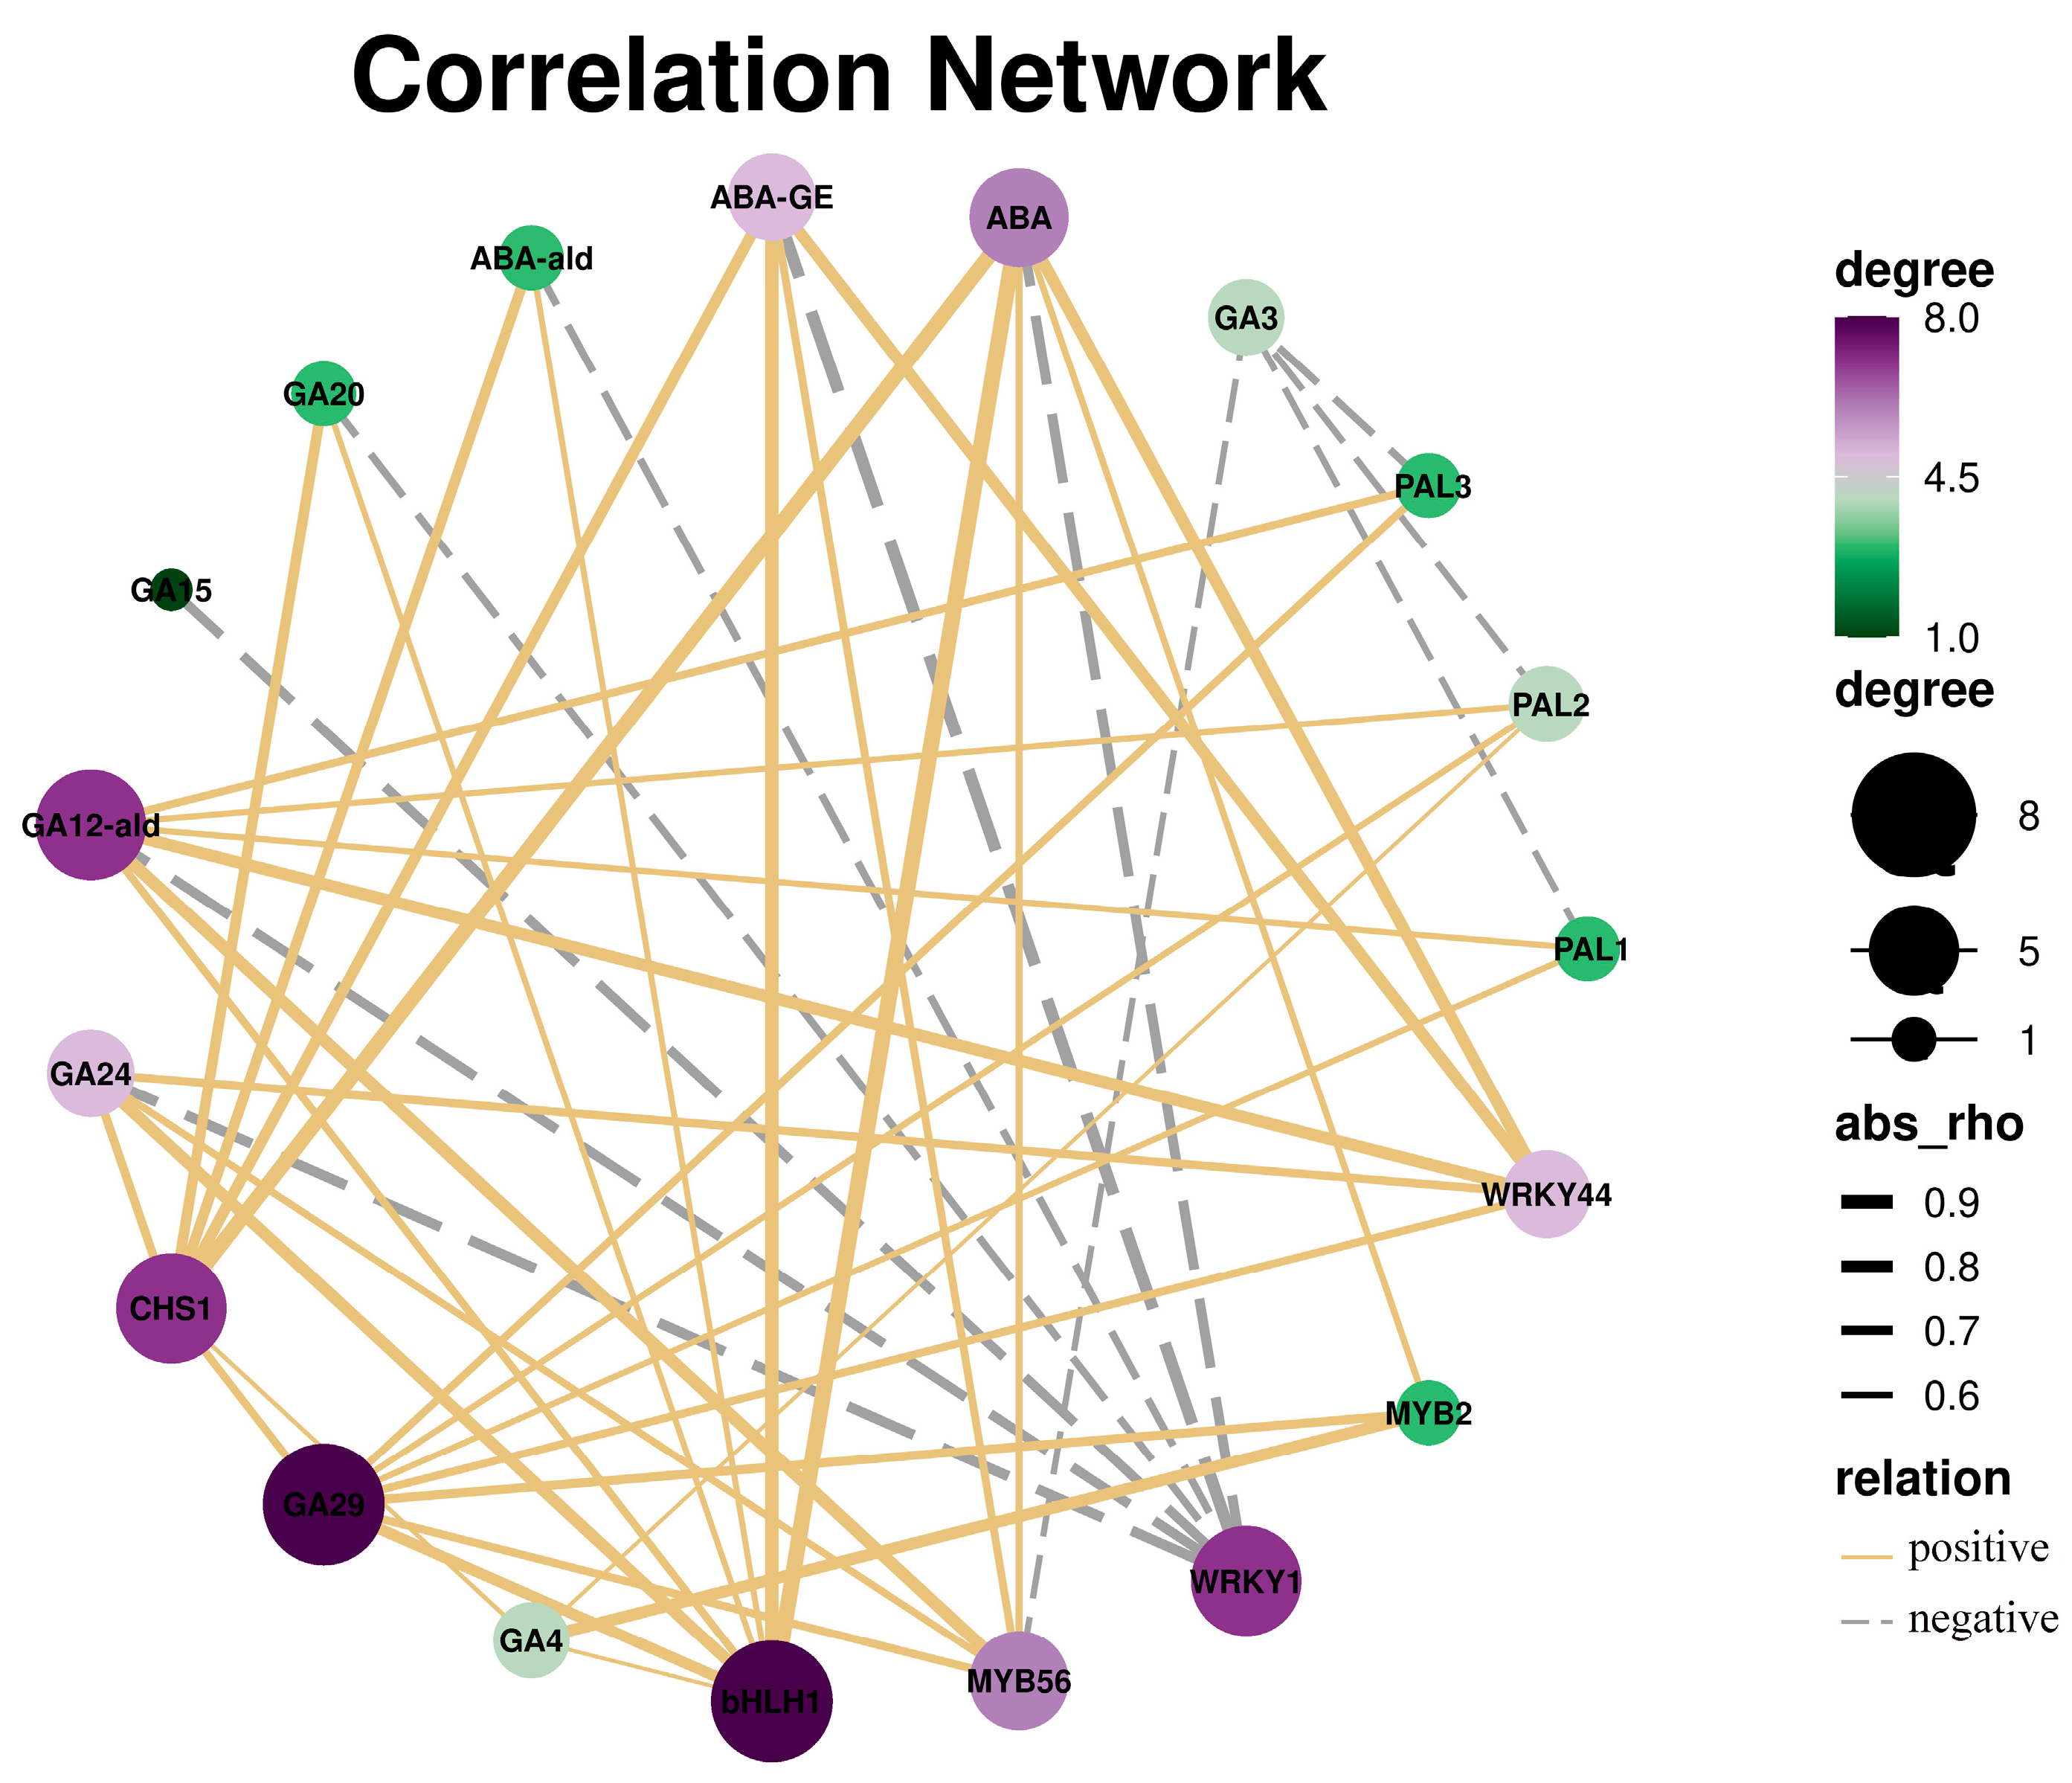
Figure 8.
Phylogenetic tree of the AoMYB56 protein and MYB protein of A. thaliana constructed with the NJ (neighbor-joining) method in MEGA X.
Figure 8.
Phylogenetic tree of the AoMYB56 protein and MYB protein of A. thaliana constructed with the NJ (neighbor-joining) method in MEGA X.
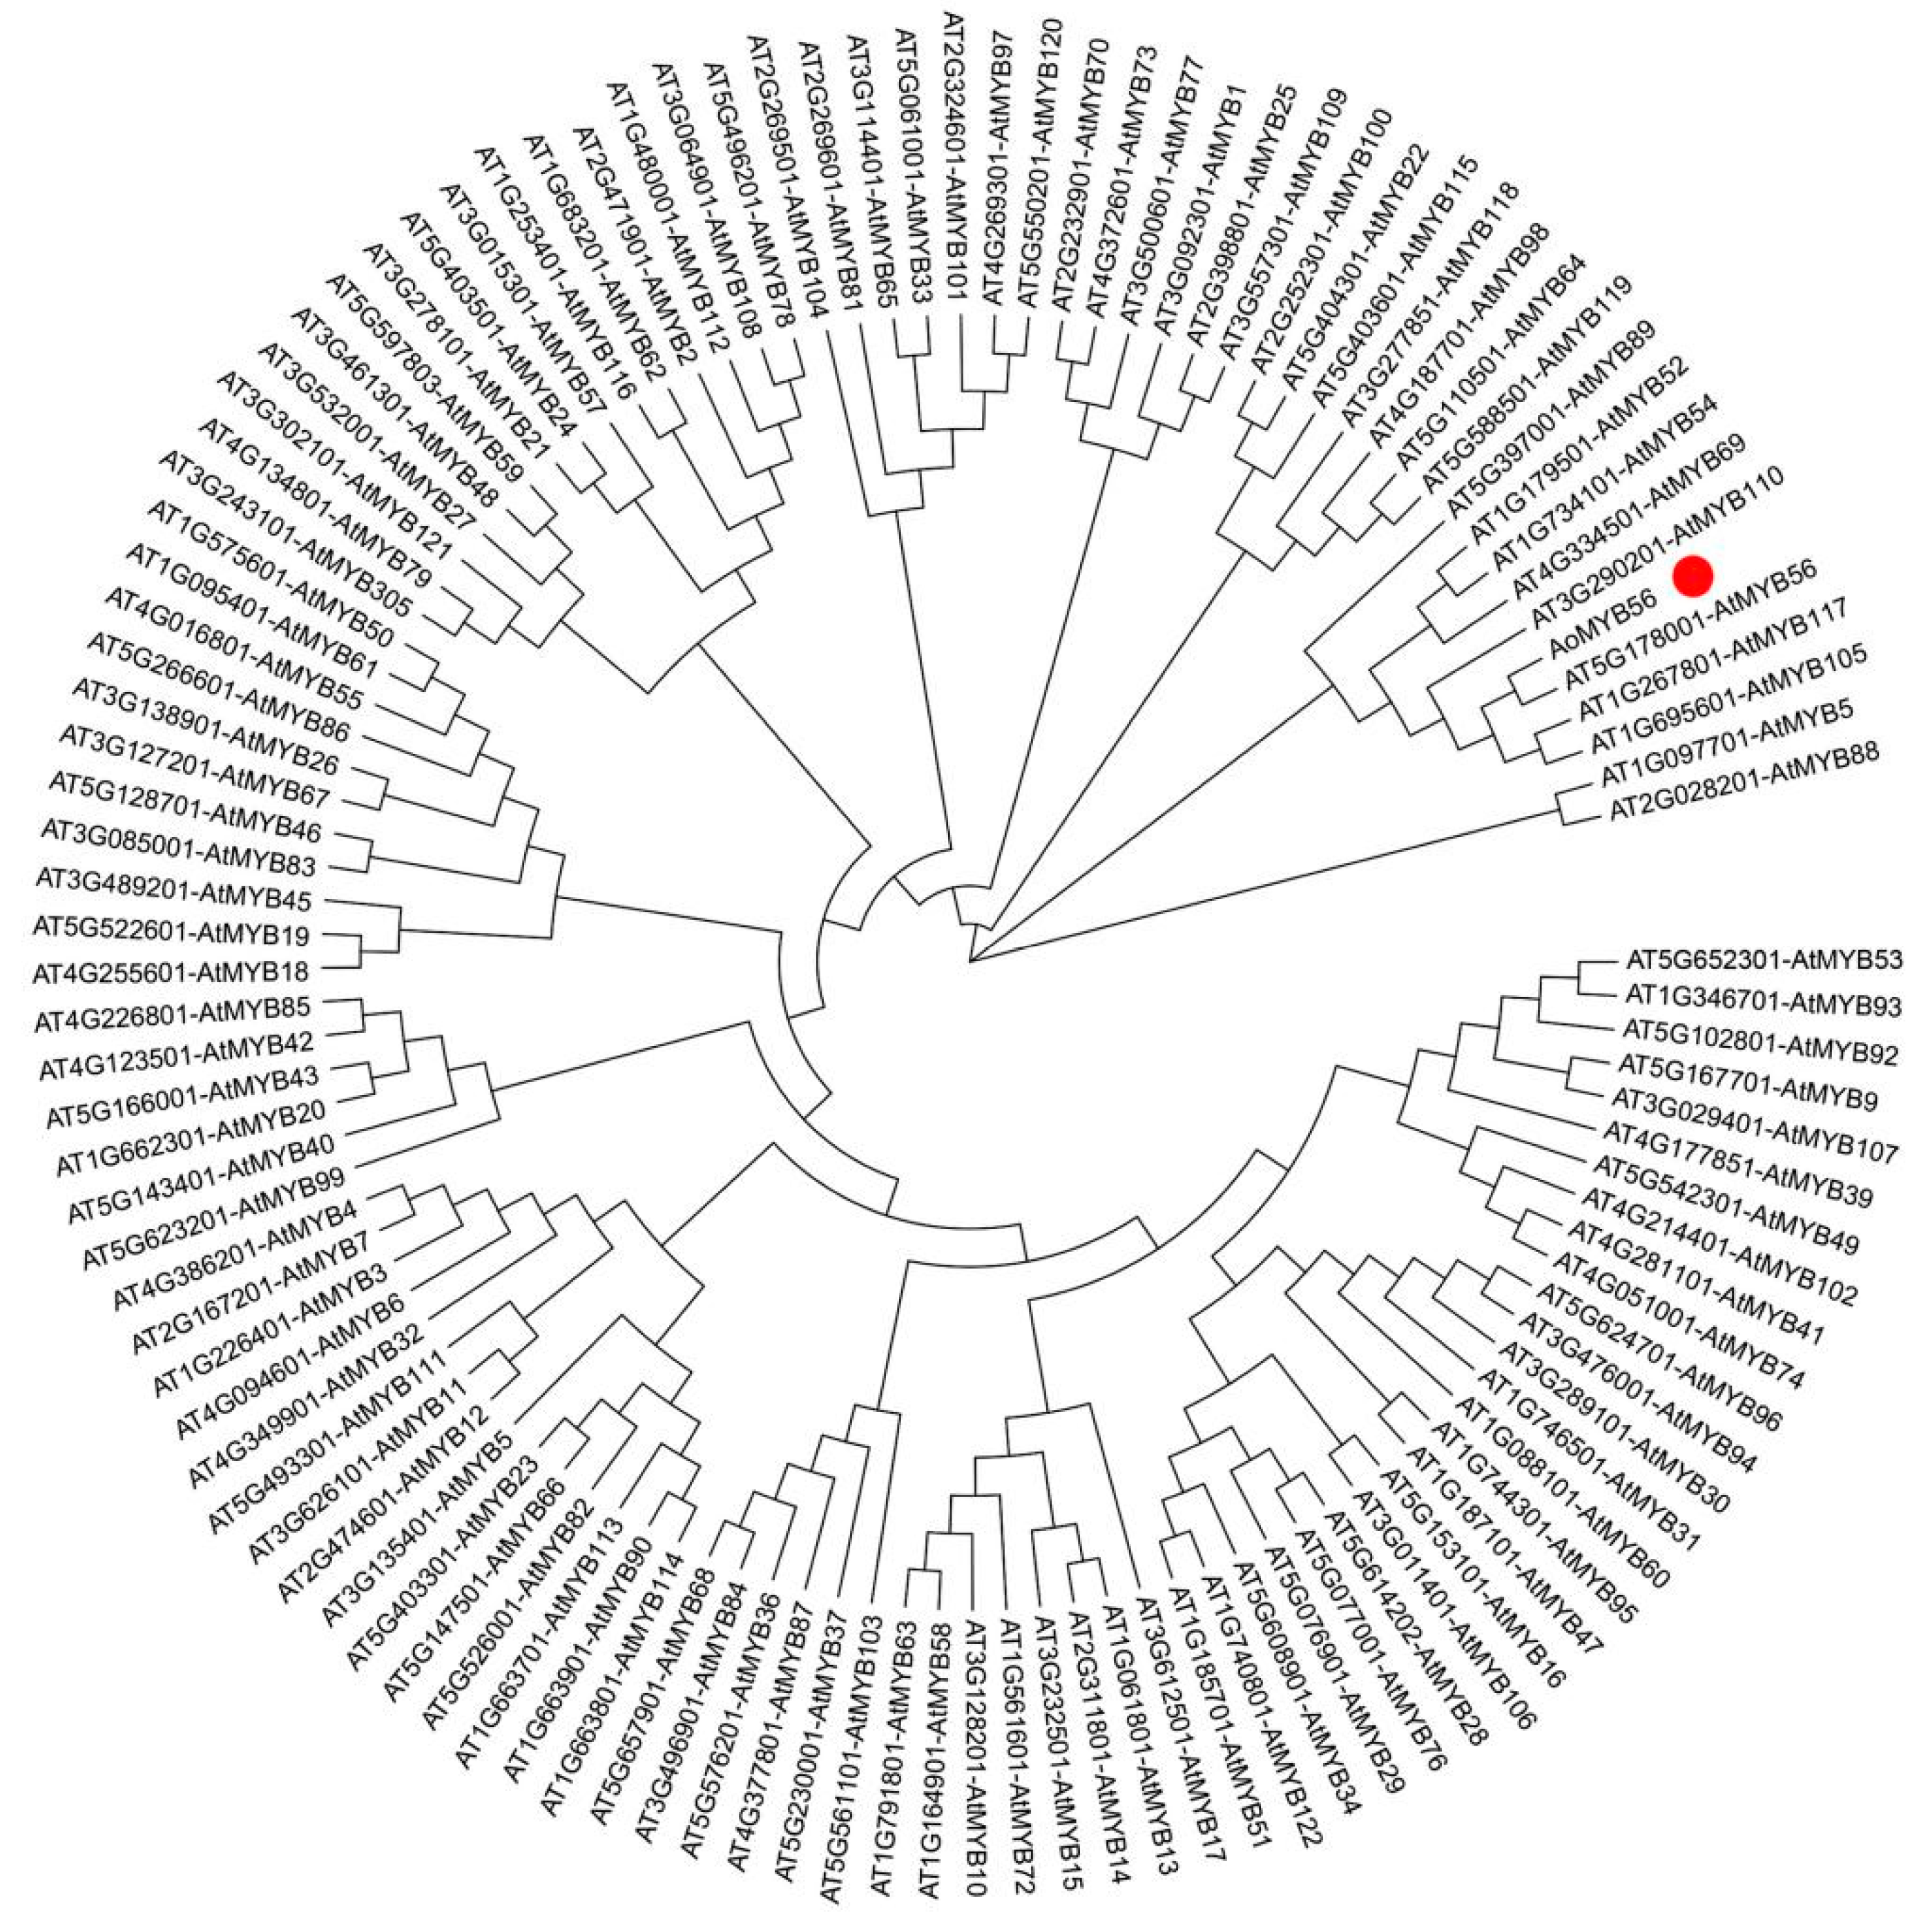
Figure 9.
Subcellular localization analysis of the AoMYB56 protein. Merged: GFP+ Bright; GFP: green fluorescent protein. The control protein is represented by the 35S-GFP fusion. The red line represents a scale bar of 10 μm.
Figure 9.
Subcellular localization analysis of the AoMYB56 protein. Merged: GFP+ Bright; GFP: green fluorescent protein. The control protein is represented by the 35S-GFP fusion. The red line represents a scale bar of 10 μm.

Table 1.
Transcriptome sequencing data in A. officinalis.
| Sample | ReadSum | BaseSum | GC (%) | N (%) | Q20 (%) | Q30 (%) |
|---|---|---|---|---|---|---|
| FM1 | 23,817,457 | 7,145,237,100 | 45.35 | 0 | 98.25 | 94.73 |
| FM2 | 19,199,653 | 5,759,895,900 | 46.01 | 0 | 98.24 | 94.74 |
| FM3 | 20,242,141 | 6,072,642,300 | 45.31 | 0 | 98.1 | 94.4 |
| GM1 | 22,487,796 | 6,746,338,800 | 45.89 | 0 | 98.26 | 94.66 |
| GM2 | 22,890,147 | 6,867,044,100 | 46.61 | 0 | 98.4 | 95.16 |
| GM3 | 24,023,866 | 7,207,159,800 | 45.76 | 0 | 98.28 | 94.8 |
Disclaimer/Publisher’s Note: The statements, opinions and data contained in all publications are solely those of the individual author(s) and contributor(s) and not of MDPI and/or the editor(s). MDPI and/or the editor(s) disclaim responsibility for any injury to people or property resulting from any ideas, methods, instructions or products referred to in the content. |
© 2024 by the authors. Licensee MDPI, Basel, Switzerland. This article is an open access article distributed under the terms and conditions of the Creative Commons Attribution (CC BY) license (https://creativecommons.org/licenses/by/4.0/).
Share and Cite
MDPI and ACS Style
Ye, Y.; Wen, S.; Ying, J.; Cai, Y.; Qian, R. Screening and Preliminary Identification of Asparagus officinalis Varieties under Low-Temperature Stress. Genes 2024, 15, 486. https://doi.org/10.3390/genes15040486
AMA Style
Ye Y, Wen S, Ying J, Cai Y, Qian R. Screening and Preliminary Identification of Asparagus officinalis Varieties under Low-Temperature Stress. Genes. 2024; 15(4):486. https://doi.org/10.3390/genes15040486
Chicago/Turabian StyleYe, Youju, Shuangshuang Wen, Jiali Ying, Yunfei Cai, and Renjuan Qian. 2024. "Screening and Preliminary Identification of Asparagus officinalis Varieties under Low-Temperature Stress" Genes 15, no. 4: 486. https://doi.org/10.3390/genes15040486
Note that from the first issue of 2016, this journal uses article numbers instead of page numbers. See further details here.