
Optical Genome Mapping as a New Tool to Overcome Conventional Cytogenetics Limitations in Patients with Bone Marrow Failure
 , , , and
Abstract
:1. Introduction
2. Materials and Methods
2.1. Cytogenetic Studies
2.2. Data Analysis
3. Results
4. Discussion
5. Conclusions
Supplementary Materials
Author Contributions
Funding
Institutional Review Board Statement
Informed Consent Statement
Data Availability Statement
Conflicts of Interest
References
- Fox, L.C.; Wood, E.M.; Ritchie, D.S.; Blombery, P. Diagnostic evaluation and considerations in hypocellular bone marrow failure—A focus on genomics. Int. J. Lab. Hematol. 2020, 42, 82–89. [Google Scholar] [CrossRef] [PubMed]
- Sahajpal, N.S.; Mondal, A.K.; Tvrdik, T.; Hauenstein, J.; Shi, H.; Deeb, K.K.; Saxe, D.; Hastie, A.R.; Chaubey, A.; Savage, N.M.; et al. Clinical Validation and Diagnostic Utility of Optical Genome Mapping for Enhanced Cytogenomic Analysis of Hematological Neoplasms. J. Mol. Diagn. 2022, 24, 1279–1291. [Google Scholar] [CrossRef] [PubMed]
- Mantere, T.; Neveling, K.; Pebrel-Richard, C.; Benoist, M.; van der Zande, G.; Kater-Baats, E.; Baatout, I.; van Beek, R.; Yammine, T.; Oorsprong, M.; et al. Optical genome mapping enables constitutional chromosomal aberration detection. Am. J. Hum. Genet. 2021, 108, 1409–1422. [Google Scholar] [CrossRef] [PubMed]
- Levy, B.; Baughn, L.B.; Akkari, Y.; Chartrand, S.; LaBarge, B.; Claxton, D.; Lennon, P.A.; Cujar, C.; Kolhe, R.; Kroeger, K.; et al. Optical genome mapping in acute myeloid leukemia: A multicenter evaluation. Blood Adv. 2023, 7, 1297–1307. [Google Scholar] [CrossRef] [PubMed]
- Smith, A.C.; Neveling, K.; Kanagal-Shamanna, R. Optical genome mapping for structural variation analysis in hematologic malignancies. Am. J. Hematol. 2022, 97, 975–982. [Google Scholar] [CrossRef] [PubMed]
- Dremsek, P.; Schwarz, T.; Weil, B.; Malashka, A.; Laccone, F.; Neesen, J. Optical genome mapping in routine human genetic diagnostics—Its advantages and limitations. Genes 2021, 12, 1958. [Google Scholar] [CrossRef]
- Vieler, L.M.; Nilius-Eliliwi, V.; Schroers, R.; Vangala, D.B.; Nguyen, H.P.; Gerding, W.M. Optical Genome Mapping Reveals and Characterizes Recurrent Aberrations and New Fusion Genes in Adult ALL. Genes 2023, 14, 686. [Google Scholar] [CrossRef]
- Valkama, A.; Vorimo, S.; Kumpula, T.A.; Räsänen, H.; Savolainen, E.R.; Pylkäs, K.; Mantere, T. Optical Genome Mapping as an Alternative to FISH-Based Cytogenetic Assessment in Chronic Lymphocytic Leukemia. Cancers 2023, 15, 1294. [Google Scholar] [CrossRef]
- Yang, H.; Garcia-Manero, G.; Sasaki, K.; Montalban-Bravo, G.; Tang, Z.; Wei, Y.; Kadia, T.; Chien, K.; Rush, D.; Nguyen, H.; et al. High-resolution structural variant profiling of myelodysplastic syndromes by optical genome mapping uncovers cryptic aberrations of prognostic and therapeutic significance. Leukemia 2022, 36, 2306–2316. [Google Scholar] [CrossRef]
- Gao, H.; Xu, H.; Wang, C.; Cui, L.; Huang, X.; Li, W.; Yue, Z.; Tian, S.; Zhao, X.; Xue, T.; et al. Optical Genome Mapping for Comprehensive Assessment of Chromosomal Aberrations and Discovery of New Fusion Genes in Pediatric B-Acute Lymphoblastic Leukemia. Cancers 2023, 15, 35. [Google Scholar] [CrossRef]
- Rack, K.A.; van den Berg, E.; Haferlach, C.; Beverloo, H.B.; Costa, D.; Espinet, B.; Foot, N.; Jeffries, S.; Martin, K.; O’Connor, S.; et al. European recommendations and quality assurance for cytogenomic analysis of haematological neoplasms. Leukemia 2019, 33, 1851–1867. [Google Scholar] [CrossRef] [PubMed]
- Aloui, N.; Cuatrecasas, E.; Garrido, M.A.; Jiménez, M.; Pujol, N.; Salido, M.; Verge, A. Análisis Citogenómicos Aplicados a Neoplasias Hematológicas: Recomendaciones Preanalíticas, Analíticas y Postanalíticas [Cytogenomic Analysis Applied to Hematologic Neoplasms: Pre-Analytic, Analytic and Post-Analytic Recommendations], 1st ed.; Espinet, B., Blanco, M.L., Costa, D., Cuatrecasas, E., Ruiz-Xivillé, N., Eds.; Sociedad Española de Hematología y Hemoterapia: Madrid, Spain, 2021. [Google Scholar]
- Woessner, S.; Florensa, L. La Citologia Óptica en el Diagnóstico Hematológico [Optical Cytology in Hematologic Diagnosis], 5th ed.; Acción Médica: Santiago, Dominican Republic, 2006. [Google Scholar]
- Sebert, M.; Gachet, S.; Leblanc, T.; Rousseau, A.; Bluteau, O.; Kim, R.; Abdelali, R.B.; de Fontbrune, F.S.; Maillard, L.; Fedronie, C.; et al. Clonal hematopoiesis driven by chromosome 1q/MDM4 trisomy defines a canonical route toward leukemia in Fanconi anemia. Cell Stem Cell 2023, 30, 153–170.e9. [Google Scholar] [CrossRef] [PubMed]
- Khoury, J.D.; Solary, E.; Abla, O.; Akkari, Y.; Alaggio, R.; Apperley, J.F.; Bejar, R.; Berti, E.; Busque, L.; Chan, J.K.; et al. The 5th edition of the World Health Organization Classification of Haematolymphoid Tumours: Myeloid and Histiocytic/Dendritic Neoplasms. Leukemia 2022, 36, 1703–1719. [Google Scholar] [CrossRef] [PubMed]
- Niemeyer, C.M.; Baumann, I. Classification of Childhood Aplastic Anemia and Myelodysplastic Syndrome. Hematology 2011, 2011, 84–89. [Google Scholar] [CrossRef] [PubMed]
- Marchesi, R.F.; Velloso, E.D.R.P.; Garanito, M.P.; Leal, A.M.; Siqueira, S.A.; Azevedo Neto, R.S.; Rocha, V.; Zerbini, M.C.N. Clinical impact of dysplastic changes in acquired aplastic anemia: A systematic study of bone marrow biopsies in children and adults. Ann. Diagn. Pathol. 2020, 45, 151459. [Google Scholar] [CrossRef] [PubMed]
- Moriwaki, K.; Manabe, A.; Taketani, T.; Kikuchi, A.; Nakahata, T.; Hayashi, Y. Cytogenetics and clinical features of pediatric myelodysplastic syndrome in Japan. Int. J. Hematol. 2014, 100, 478–484. [Google Scholar] [CrossRef] [PubMed]
- Rudelius, M.; Weinberg, O.K.; Niemeyer, C.M.; Shimamura, A.; Calvo, K.R. The International Consensus Classification (ICC) of hematologic neoplasms with germline predisposition, pediatric myelodysplastic syndrome, and juvenile myelomonocytic leukemia. Virchows Arch. 2023, 482, 113–130. [Google Scholar] [CrossRef]
- Sanchez, E.G.; García, J.; Gomez, A.; Giménez, R.; Ruano, D.; Andion, M.; Abad, L.; Castillo, A.; Madero, L.; Orellana, M.R. PB1708: Characterization of global cytogenomics features in childhood acute lymphoblastic leukemia by optical genome mapping. Hemasphere 2023, 7, e8442769. [Google Scholar] [CrossRef]
- Gerding, W.M.; Tembrink, M.; Nilius-Eliliwi, V.; Mika, T.; Dimopoulos, F.; Ladigan-Badura, S.; Eckhardt, M.; Pohl, M.; Wünnenberg, M.; Farshi, P.; et al. Optical genome mapping reveals additional prognostic information compared to conventional cytogenetics in AML/MDS patients. Int. J. Cancer 2022, 150, 1998–2011. [Google Scholar] [CrossRef]
- Balducci, E.; Kaltenbach, S.; Villarese, P.; Duroyon, E.; Zalmai, L.; Friedrich, C.; Suarez, F.; Marcais, A.; Bouscary, D.; Decroocq, J.; et al. Optical genome mapping refines cytogenetic diagnostics, prognostic stratification and provides new molecular insights in adult MDS/AML patients. Blood Cancer J. 2022, 12, 126. [Google Scholar] [CrossRef]
- Vangala, D.B.; Nilius-Eliliwi, V.; Gerding, W.M.; Schroers, R.; Nguyen, H.P. Optical Genome Mapping in MDS and AML as tool for structural variant profiling—Comment and data update on Yang et al.: “High-resolution structural variant profiling of myelodysplastic syndromes by optical genome mapping uncovers cryptic aberrations of prognostic and therapeutic significance”. Leukemia 2023, 37, 248–249. [Google Scholar] [CrossRef] [PubMed]
- Behrens, Y.L.; Göhring, G.; Bawadi, R.; Cöktü, S.; Reimer, C.; Hoffmann, B.; Sänger, B.; Käfer, S.; Thol, F.; Erlacher, M.; et al. A novel classification of hematologic conditions in patients with Fanconi anemia. Haematologica 2021, 106, 3000–3003. [Google Scholar] [CrossRef] [PubMed]
- Nilius-Eliliwi, V.; Gerding, W.M.; Schroers, R.; Nguyen, H.P.; Vangala, D.B. Optical Genome Mapping for Cytogenetic Diagnostics in AML. Cancers 2023, 15, 1684. [Google Scholar] [CrossRef] [PubMed]

| Number of Patients N = 20 | % | |
|---|---|---|
Age (years)
| 9 (5–13.7) | |
Sex:
| 10 10 | 50 50 |
Diagnosis:
| 13 5 2 | 65 25 10 |
BM 1 hypocellularity [13]:
| 7 8 3 2 | 35 40 15 10 |
| Sample ID | Diagnosis | Karyotype | FISH | OGM Results According to ISCN Ogm[GRCh38] |
|---|---|---|---|---|
| ID 1 | Fanconi Anemia | 46,XX[13] | negative | (1–22,X)x2 |
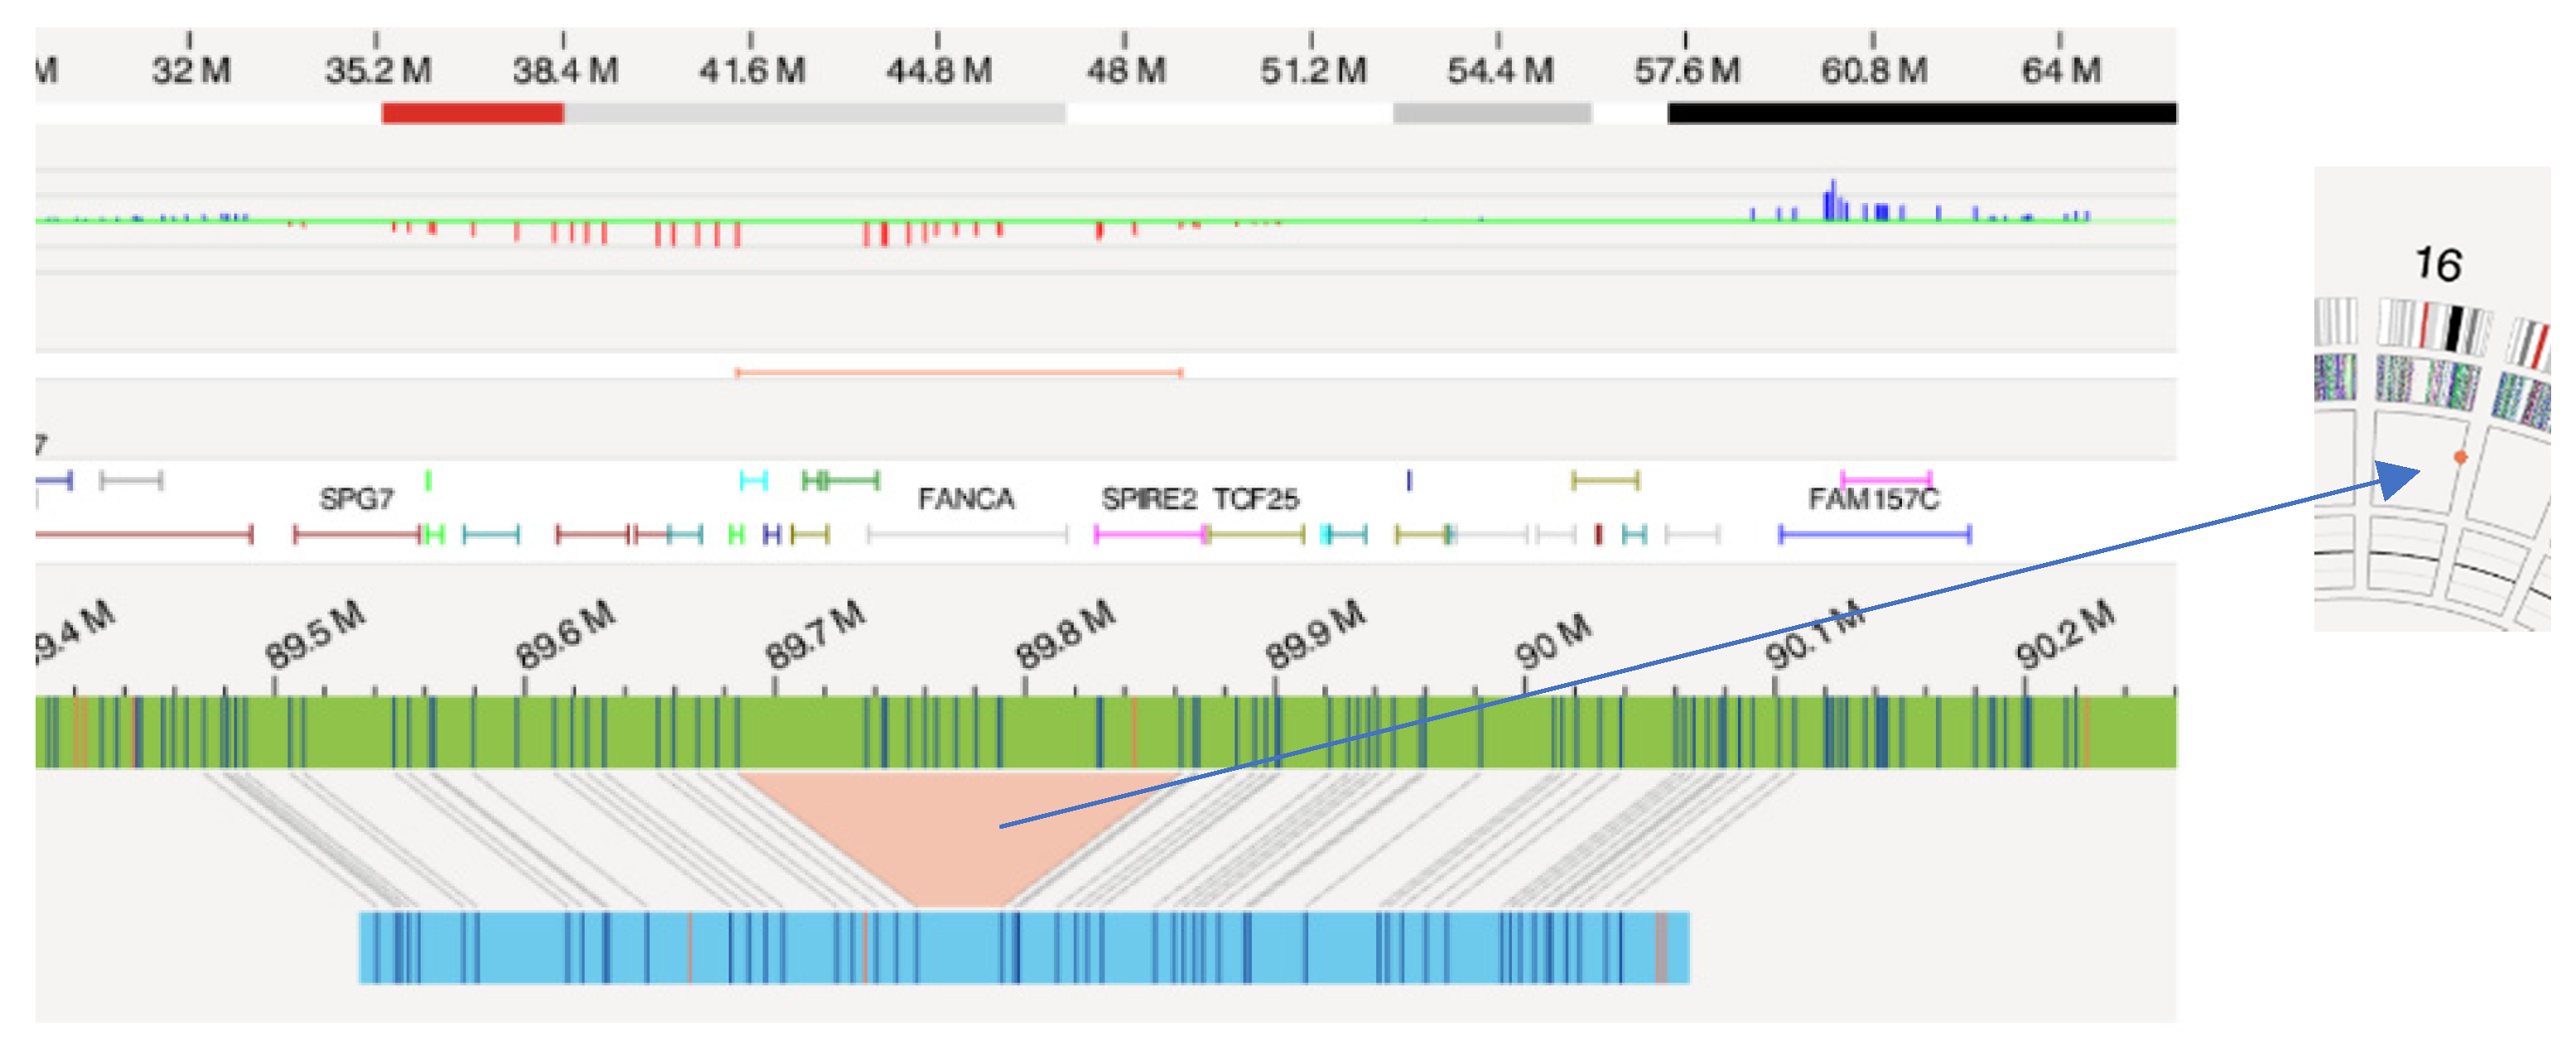
| ID 2 | Fanconi Anemia | 46,XX[10] | negative | 16q24.3(89685110_89862359)x1∼2 |
| ID 3 | Fanconi Anemia | 46,XX[10] | negative | 14q32.33(105710125_105754681)x2∼3 21p11.2(10326071_10766790)x2∼3 |
| ID 4 | Fanconi Anemia | 46,XY[8] | negative | 7q11.23(74,869,402_75214597)x1∼2 9q34.3(135271879_135407027)x2∼3 16p12.3(18262064_18751754)x1 |
| ID 5 | Fanconi Anemia | 46,XY[12] | negative | 13q21.33(71965822_72074078)x1 |
| ID 6 | Fanconi Anemia | 46,XX[10] | negative | 12q24.32(127160989_127467513)x2∼3 |
| ID 7 | Fanconi Anemia | 46,XX[12] | negative | 2p12(81983068_82084517)x2∼3 |
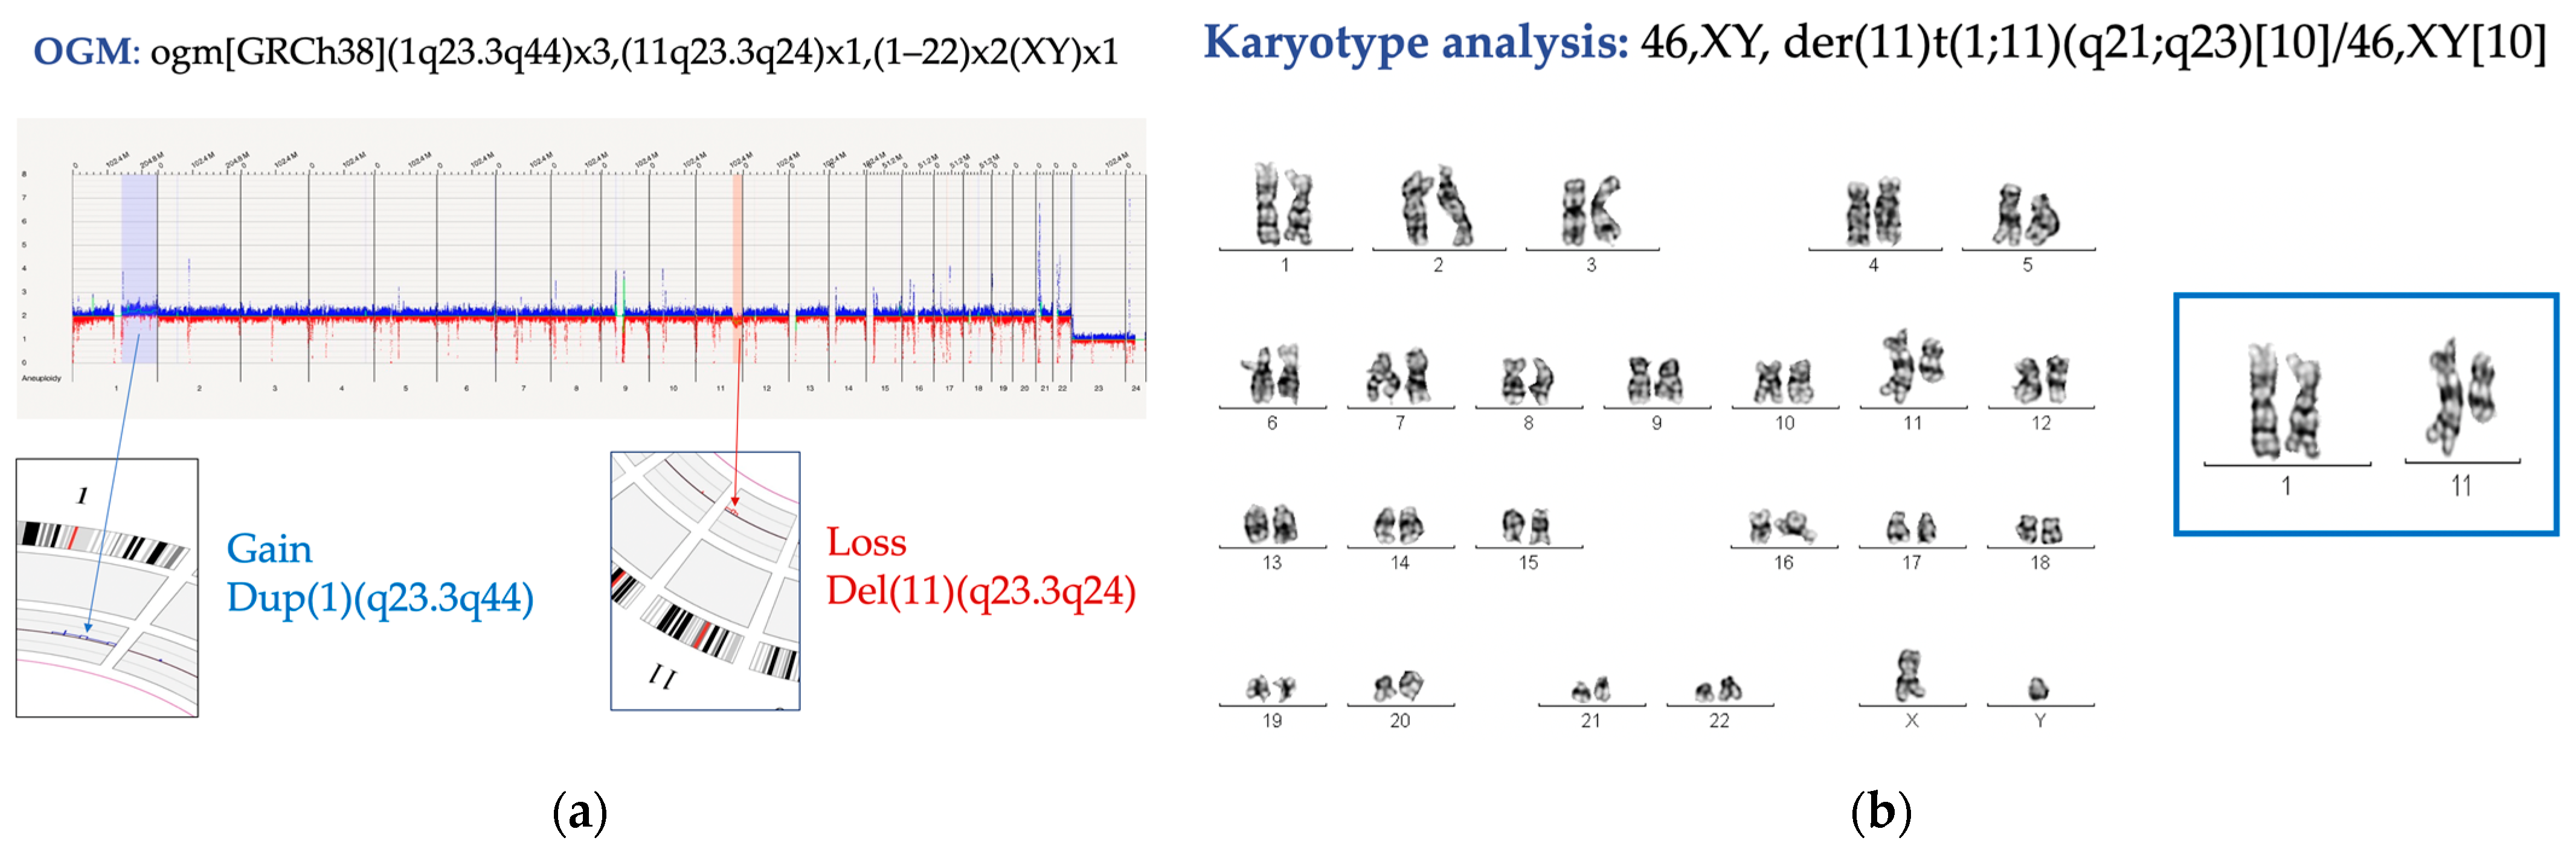
| ID 8 | Fanconi Anemia | 0 metaphases | nuc ish(CDKN2C x2, CKS1B x3) [14/200] | 1q23.3q44(163150928_248943333)x2∼3 11q23.3q24(115535614_121492796)x1 7p12.1(53380529_53527833)x1 |
| ID 9 | Fanconi Anemia | 46,XY[15] | negative | 7q11.23(76804855_77042022)x2∼3 16q23.1(75525291_75543486)x2∼3 |
| ID 10 | Fanconi Anemia | 46,XY[10] | negative | 10q11.21q11.23(47461135_47776804)x2∼3 |
| ID 11 | Fanconi Anemia | 46,XY[8] | negative | 4q13.2(68625142_68669119)x2∼3 |
| ID 12 | Fanconi Anemia | 46,XY[15] | negative | 1q43(238591073_238614424)x2∼3 7q11.21(65486487_65566699)x2∼3 |
| ID 13 | Fanconi Anemia | 46,XY[20] | negative | 1p34.1(45493706_45606883)x2∼3 |
| ID 14 | Acquired Aplastic Anemia | 46,XX[5] | negative | 1q31.3(195372266_195473816)x1 |
| ID 15 | Acquired Aplastic Anemia | 46,XX[10] | negative | 2p24.2(16866735_17121008)x1 |
| ID 16 | Acquired Aplastic Anemia | 46,XX[20] | negative | (1–22,X)x2 |
| ID 17 | Acquired Aplastic Anemia | 46,XX[20] | negative | (1–22,X)x2 |
| ID 18 | Acquired Aplastic Anemia | 46,XX[15] | negative | (1–22,X)x2 |
| ID 19 | Severe Congenital Neutropenia | 46,XY[8] | negative | (1–22,X)x2 |
Disclaimer/Publisher’s Note: The statements, opinions and data contained in all publications are solely those of the individual author(s) and contributor(s) and not of MDPI and/or the editor(s). MDPI and/or the editor(s) disclaim responsibility for any injury to people or property resulting from any ideas, methods, instructions or products referred to in the content. |
© 2024 by the authors. Licensee MDPI, Basel, Switzerland. This article is an open access article distributed under the terms and conditions of the Creative Commons Attribution (CC BY) license (https://creativecommons.org/licenses/by/4.0/).
Share and Cite
Iriondo, J.; Gómez, A.; Zubicaray, J.; Garcia-Martinez, J.; Abad, L.; Matesanz, C.; Giménez, R.; Galán, A.; Sanz, A.; Sebastián, E.; et al. Optical Genome Mapping as a New Tool to Overcome Conventional Cytogenetics Limitations in Patients with Bone Marrow Failure. Genes 2024, 15, 559. https://doi.org/10.3390/genes15050559
Iriondo J, Gómez A, Zubicaray J, Garcia-Martinez J, Abad L, Matesanz C, Giménez R, Galán A, Sanz A, Sebastián E, et al. Optical Genome Mapping as a New Tool to Overcome Conventional Cytogenetics Limitations in Patients with Bone Marrow Failure. Genes. 2024; 15(5):559. https://doi.org/10.3390/genes15050559
Chicago/Turabian StyleIriondo, June, Ana Gómez, Josune Zubicaray, Jorge Garcia-Martinez, Lorea Abad, Carmen Matesanz, Reyes Giménez, Almudena Galán, Alejandro Sanz, Elena Sebastián, and et al. 2024. "Optical Genome Mapping as a New Tool to Overcome Conventional Cytogenetics Limitations in Patients with Bone Marrow Failure" Genes 15, no. 5: 559. https://doi.org/10.3390/genes15050559