
Contribution of Topological Domains and Loop Formation to 3D Chromatin Organization

Abstract
:
1. Introduction

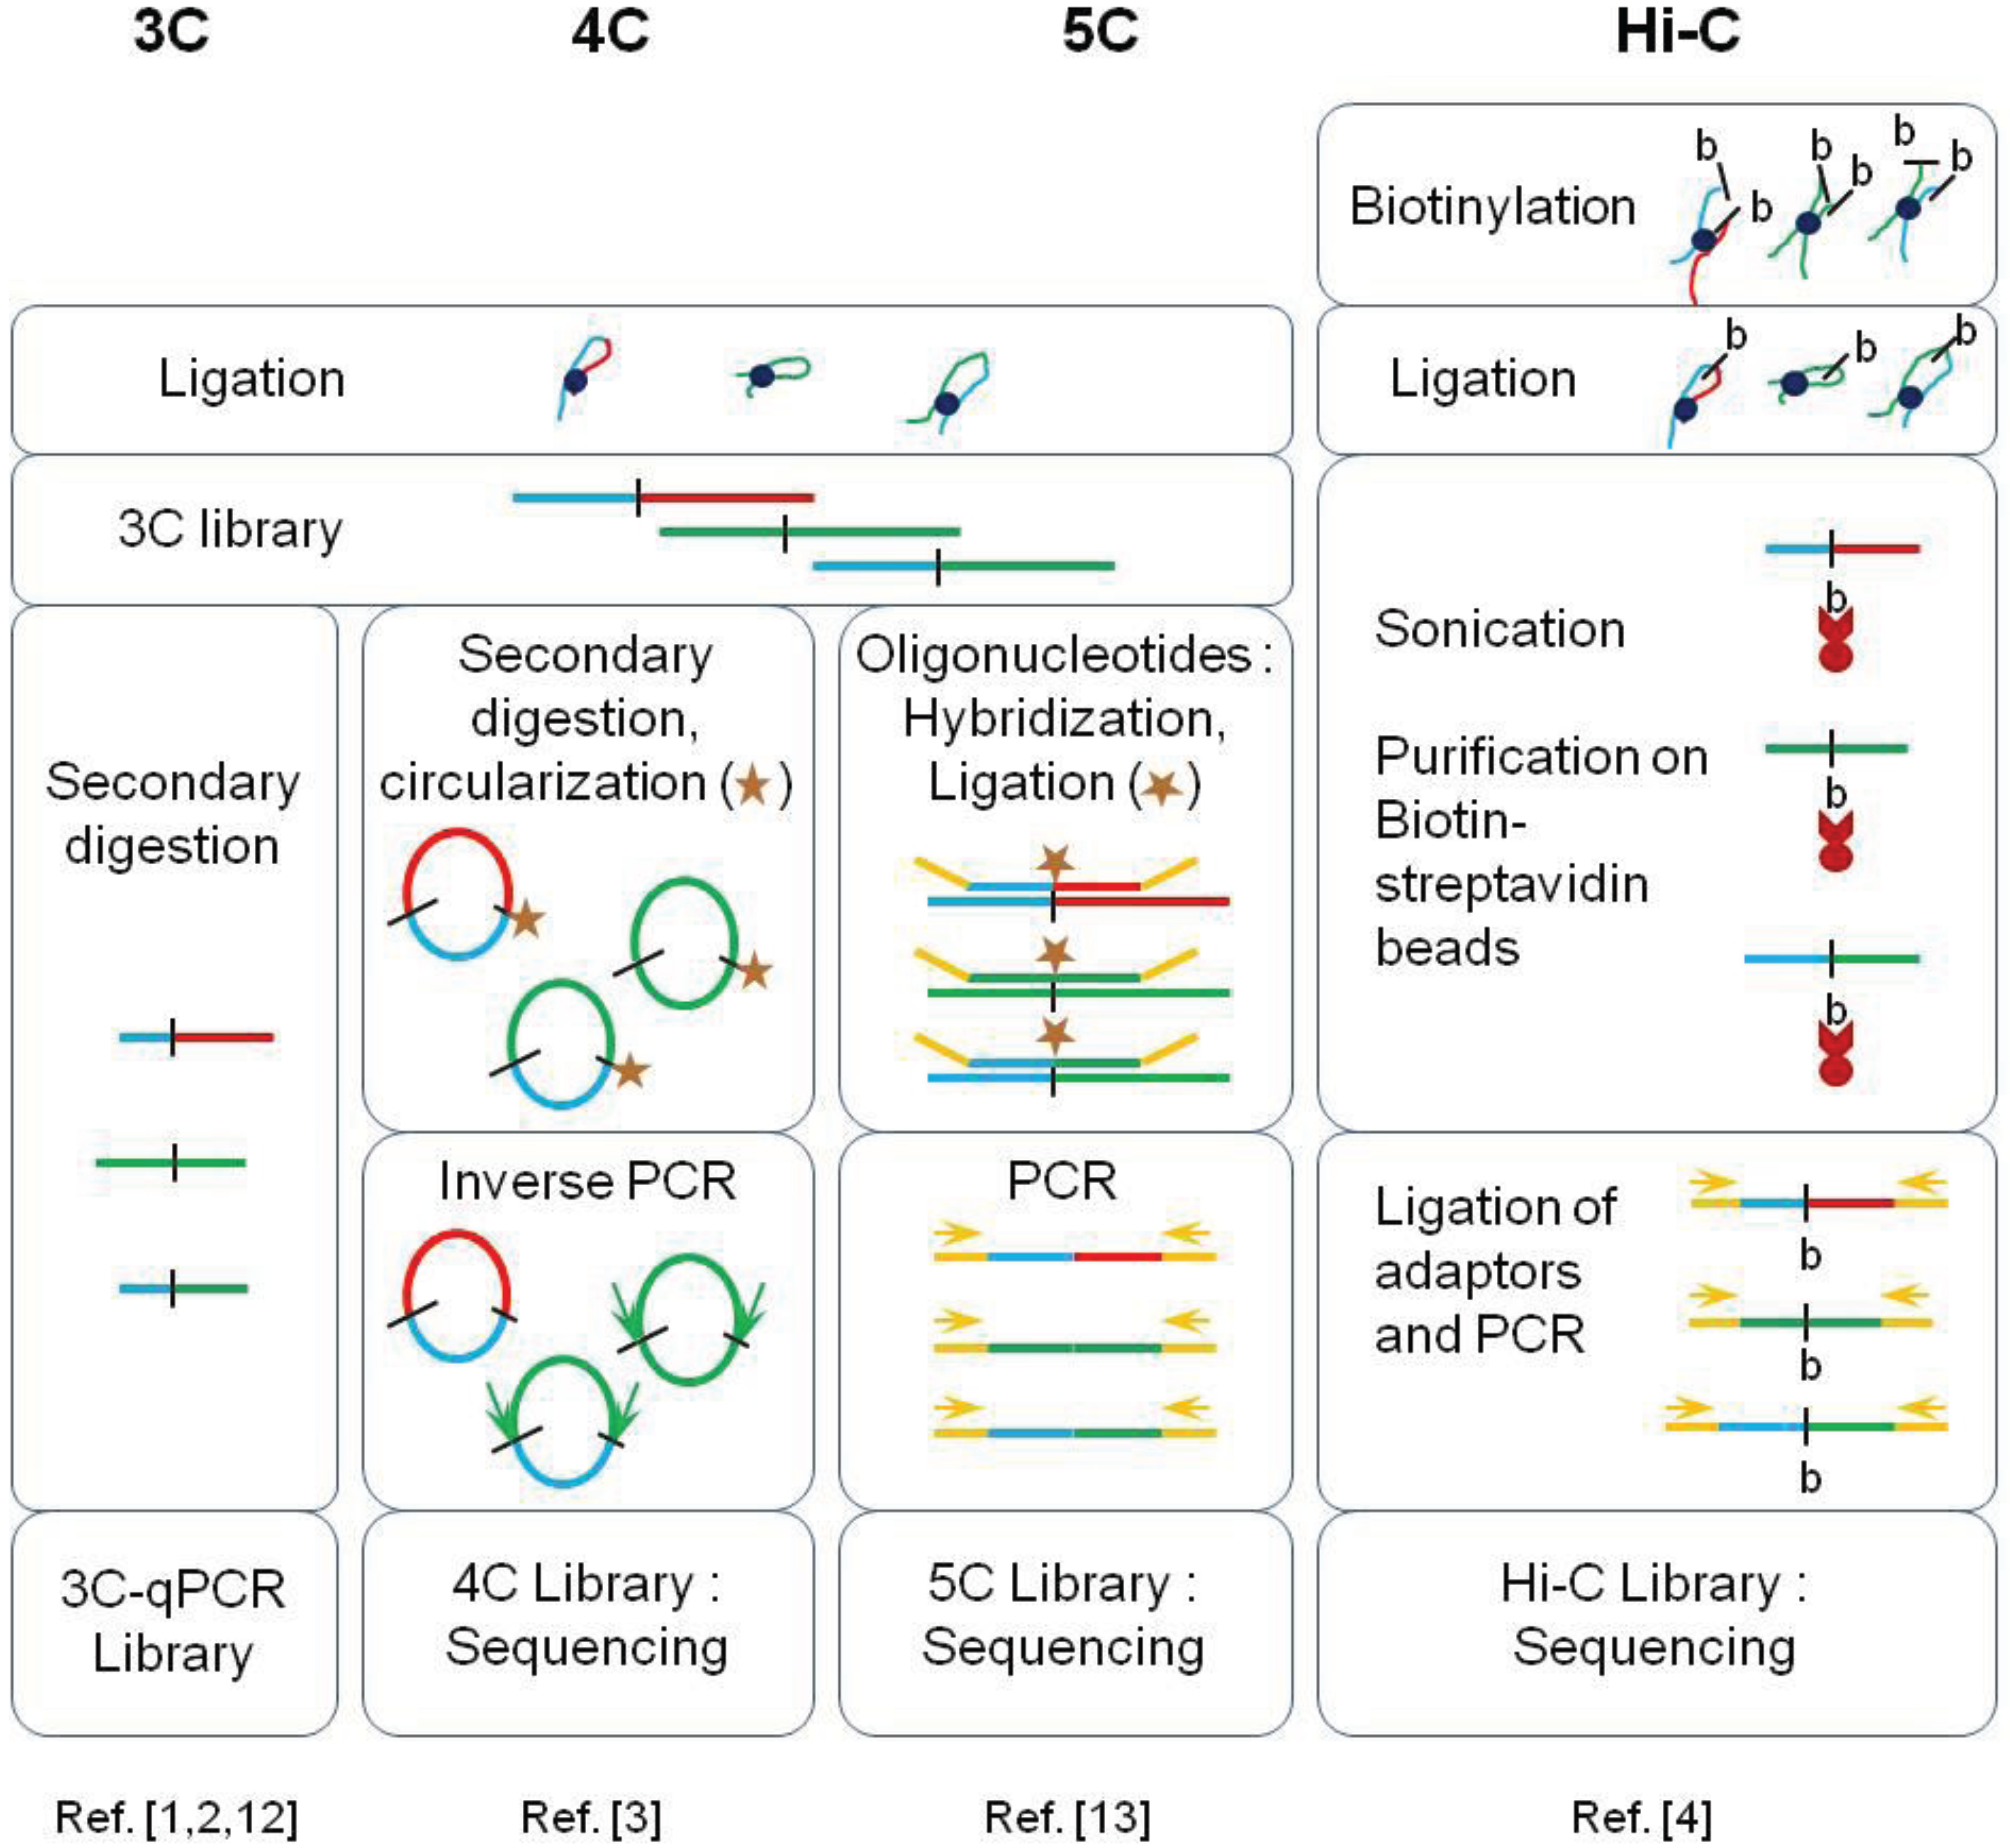
| Method | Genomic Scale Investigated | Advantages | Limits |
|---|---|---|---|
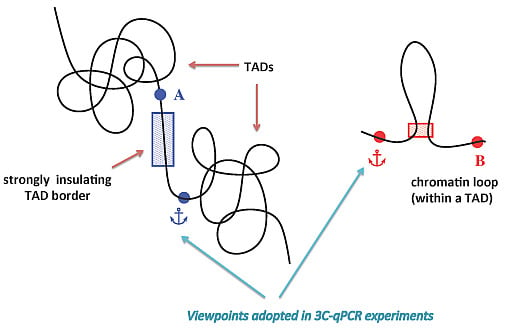
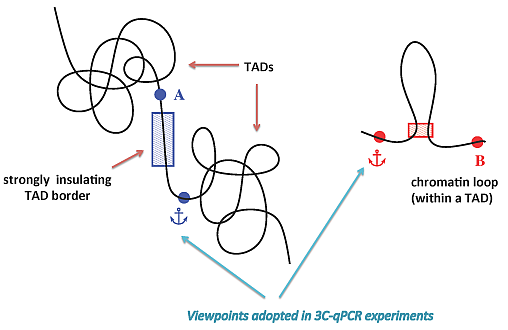
| 3C-qPCR | ~250 kilobases | Very high dynamic range (highly quantitative), easy data analysis | Very low throughput: limited to few viewpoints in a selected region |
| 4C | Complete genome | Good sensitivity at large separation distances | Genome-wide contact map limited to a unique viewpoint (few viewpoints if multiplex sequencing is used) |
| 5C | Few megabases | Good dynamic range, complete contact map (all possible viewpoints) of a specific locus | The contact map obtained is limited to a selected region |
| Hi-C | Complete genome | Very high throughput (complete contact map) | Poor dynamic range, complex data processing |

2. Topologically Associating Domains (TADs)
2.1. Identifications of TADs and Their Conservation across Species
| Organism | Sample or Cell Line | Number of TADs | Median Size (kb) | Mean Size (kb) | Bin Size (kb) | Reference |
|---|---|---|---|---|---|---|
| M. musculus | E14 ESC | 2200 | 880 | 1093 | 20–40 | [15] |
| Cortex | 1518 | 800 | 1063 | |||
| H. sapiens | ESC | 3127 | 680 | 852 | ||
| IMR90 | 2348 | 840 | 1123 | |||
| D. melanogaster | Embryo | 1169 | 62 | 100 | ~10 | [18] |
| Kc167 | 1110 | 61 | 107 | 4 | [16] |
2.2. Characteristics of TADs
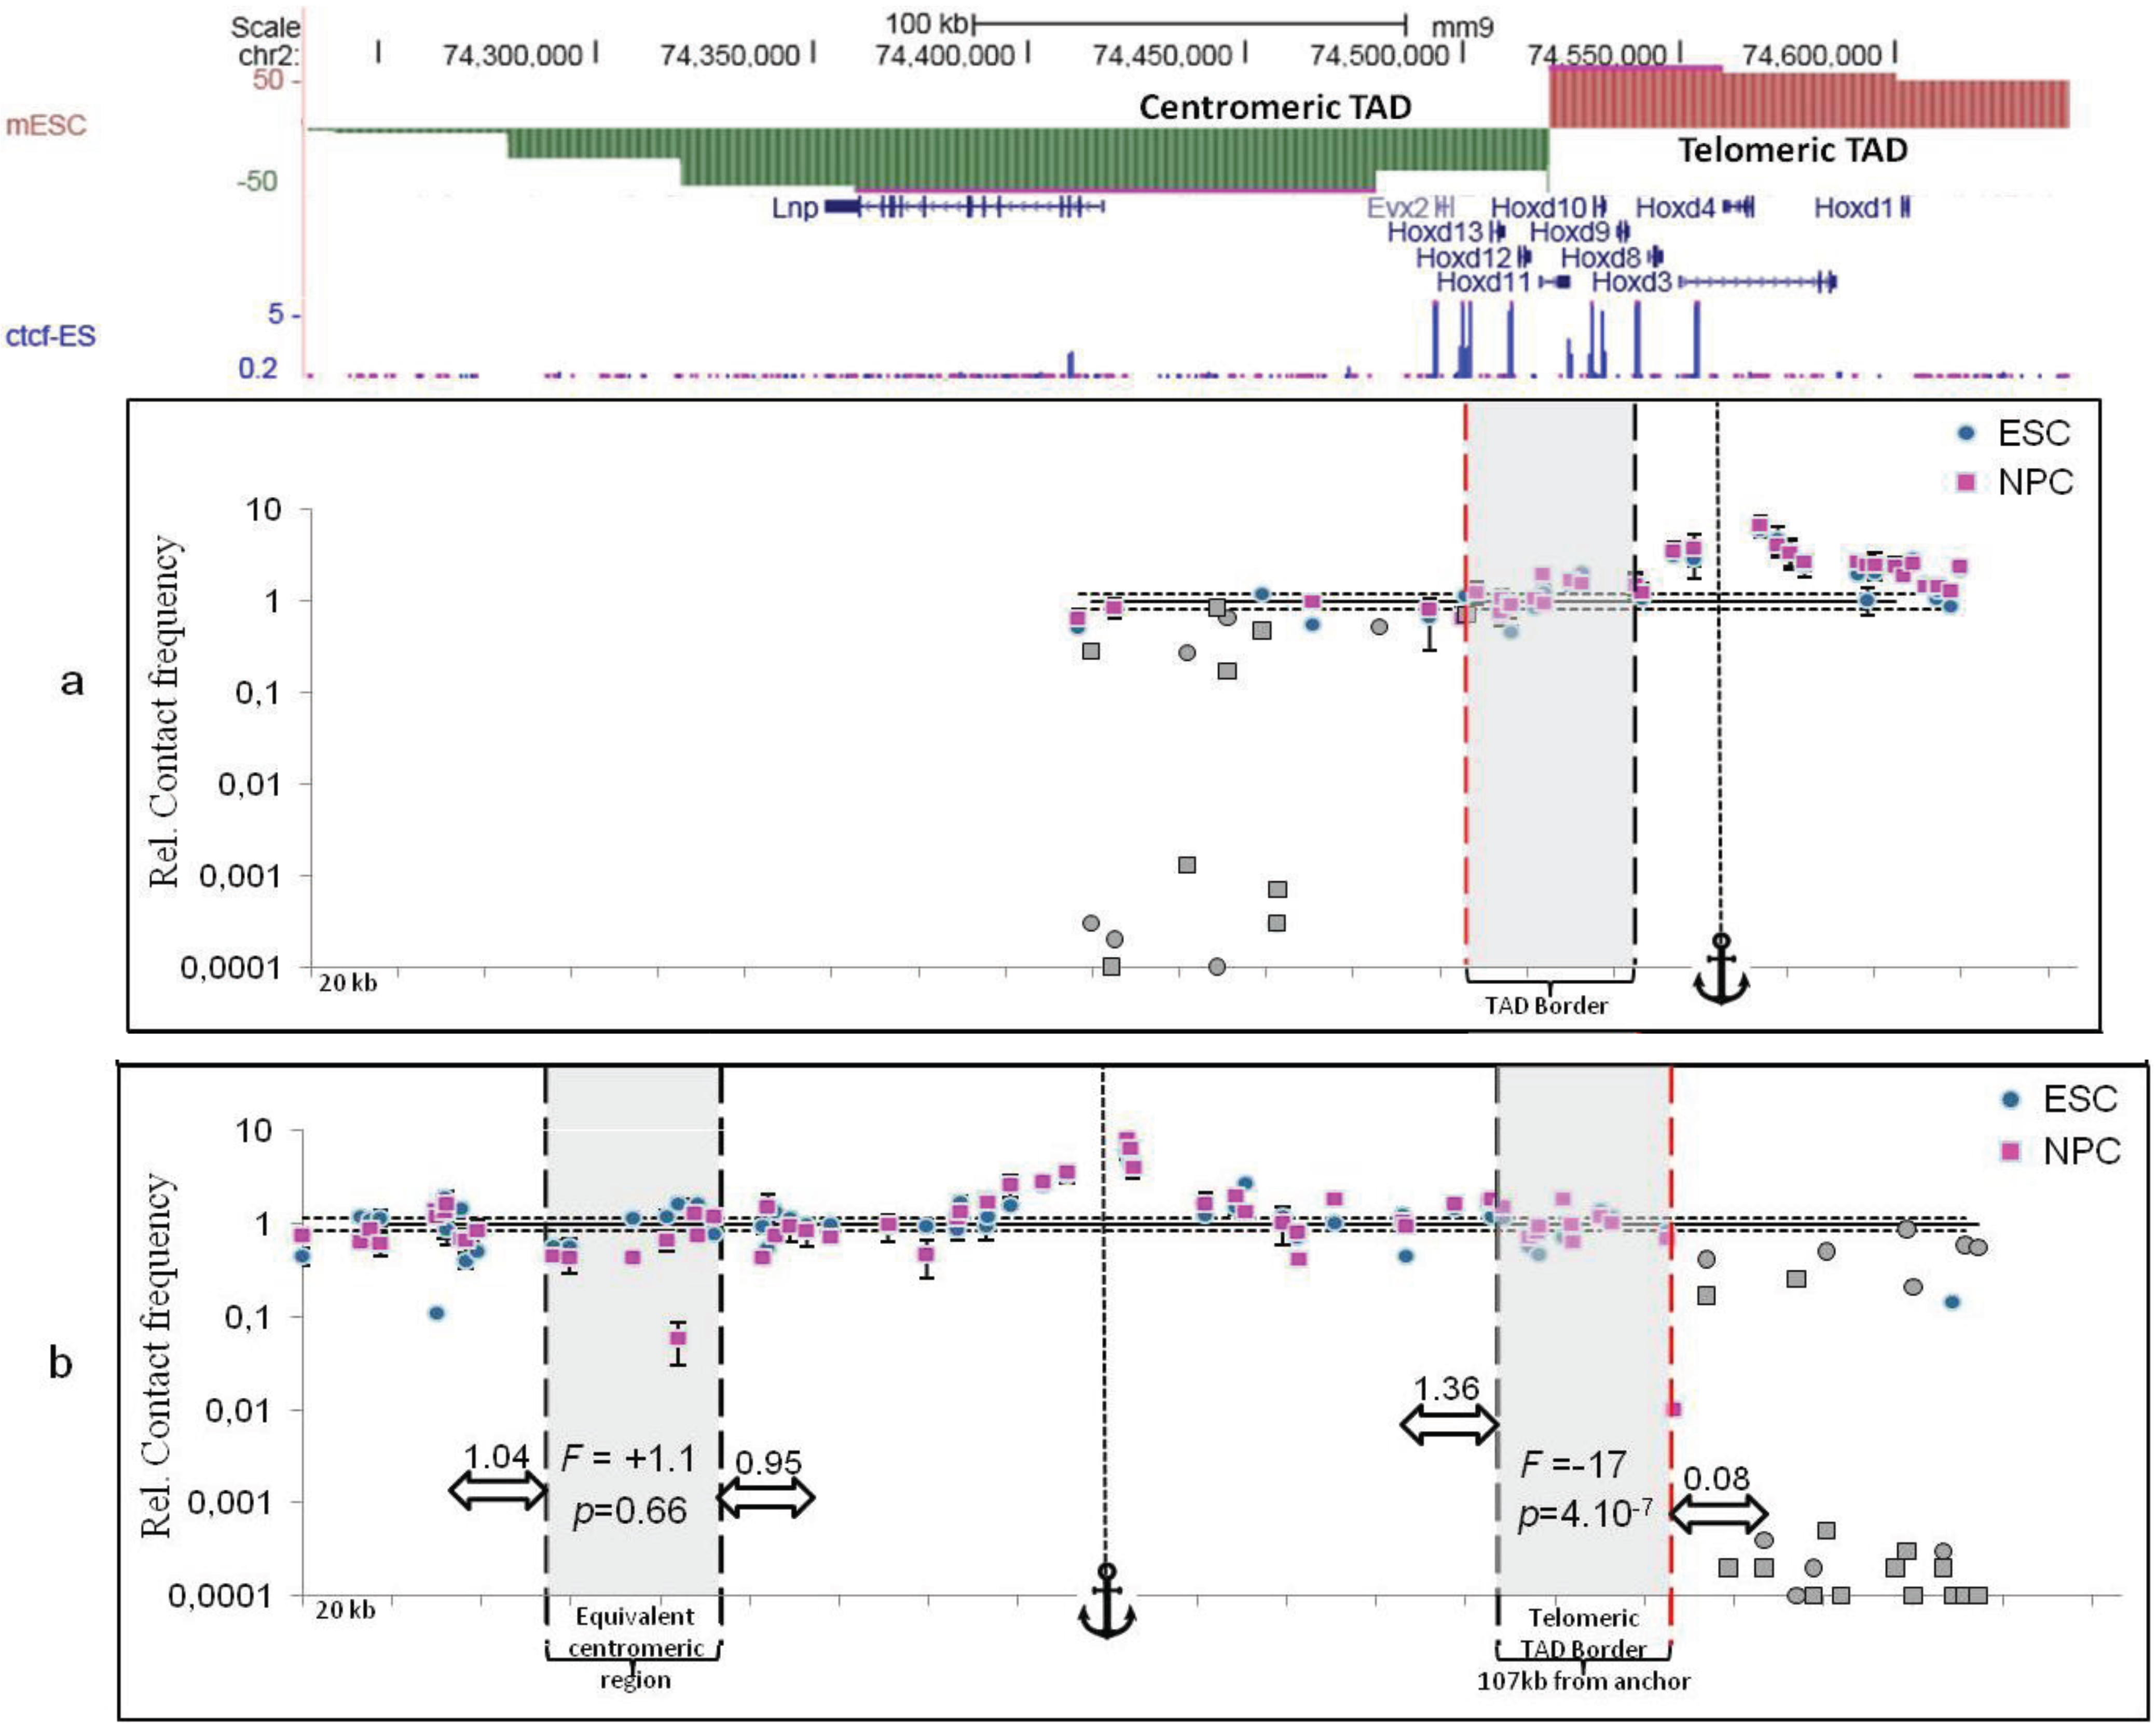
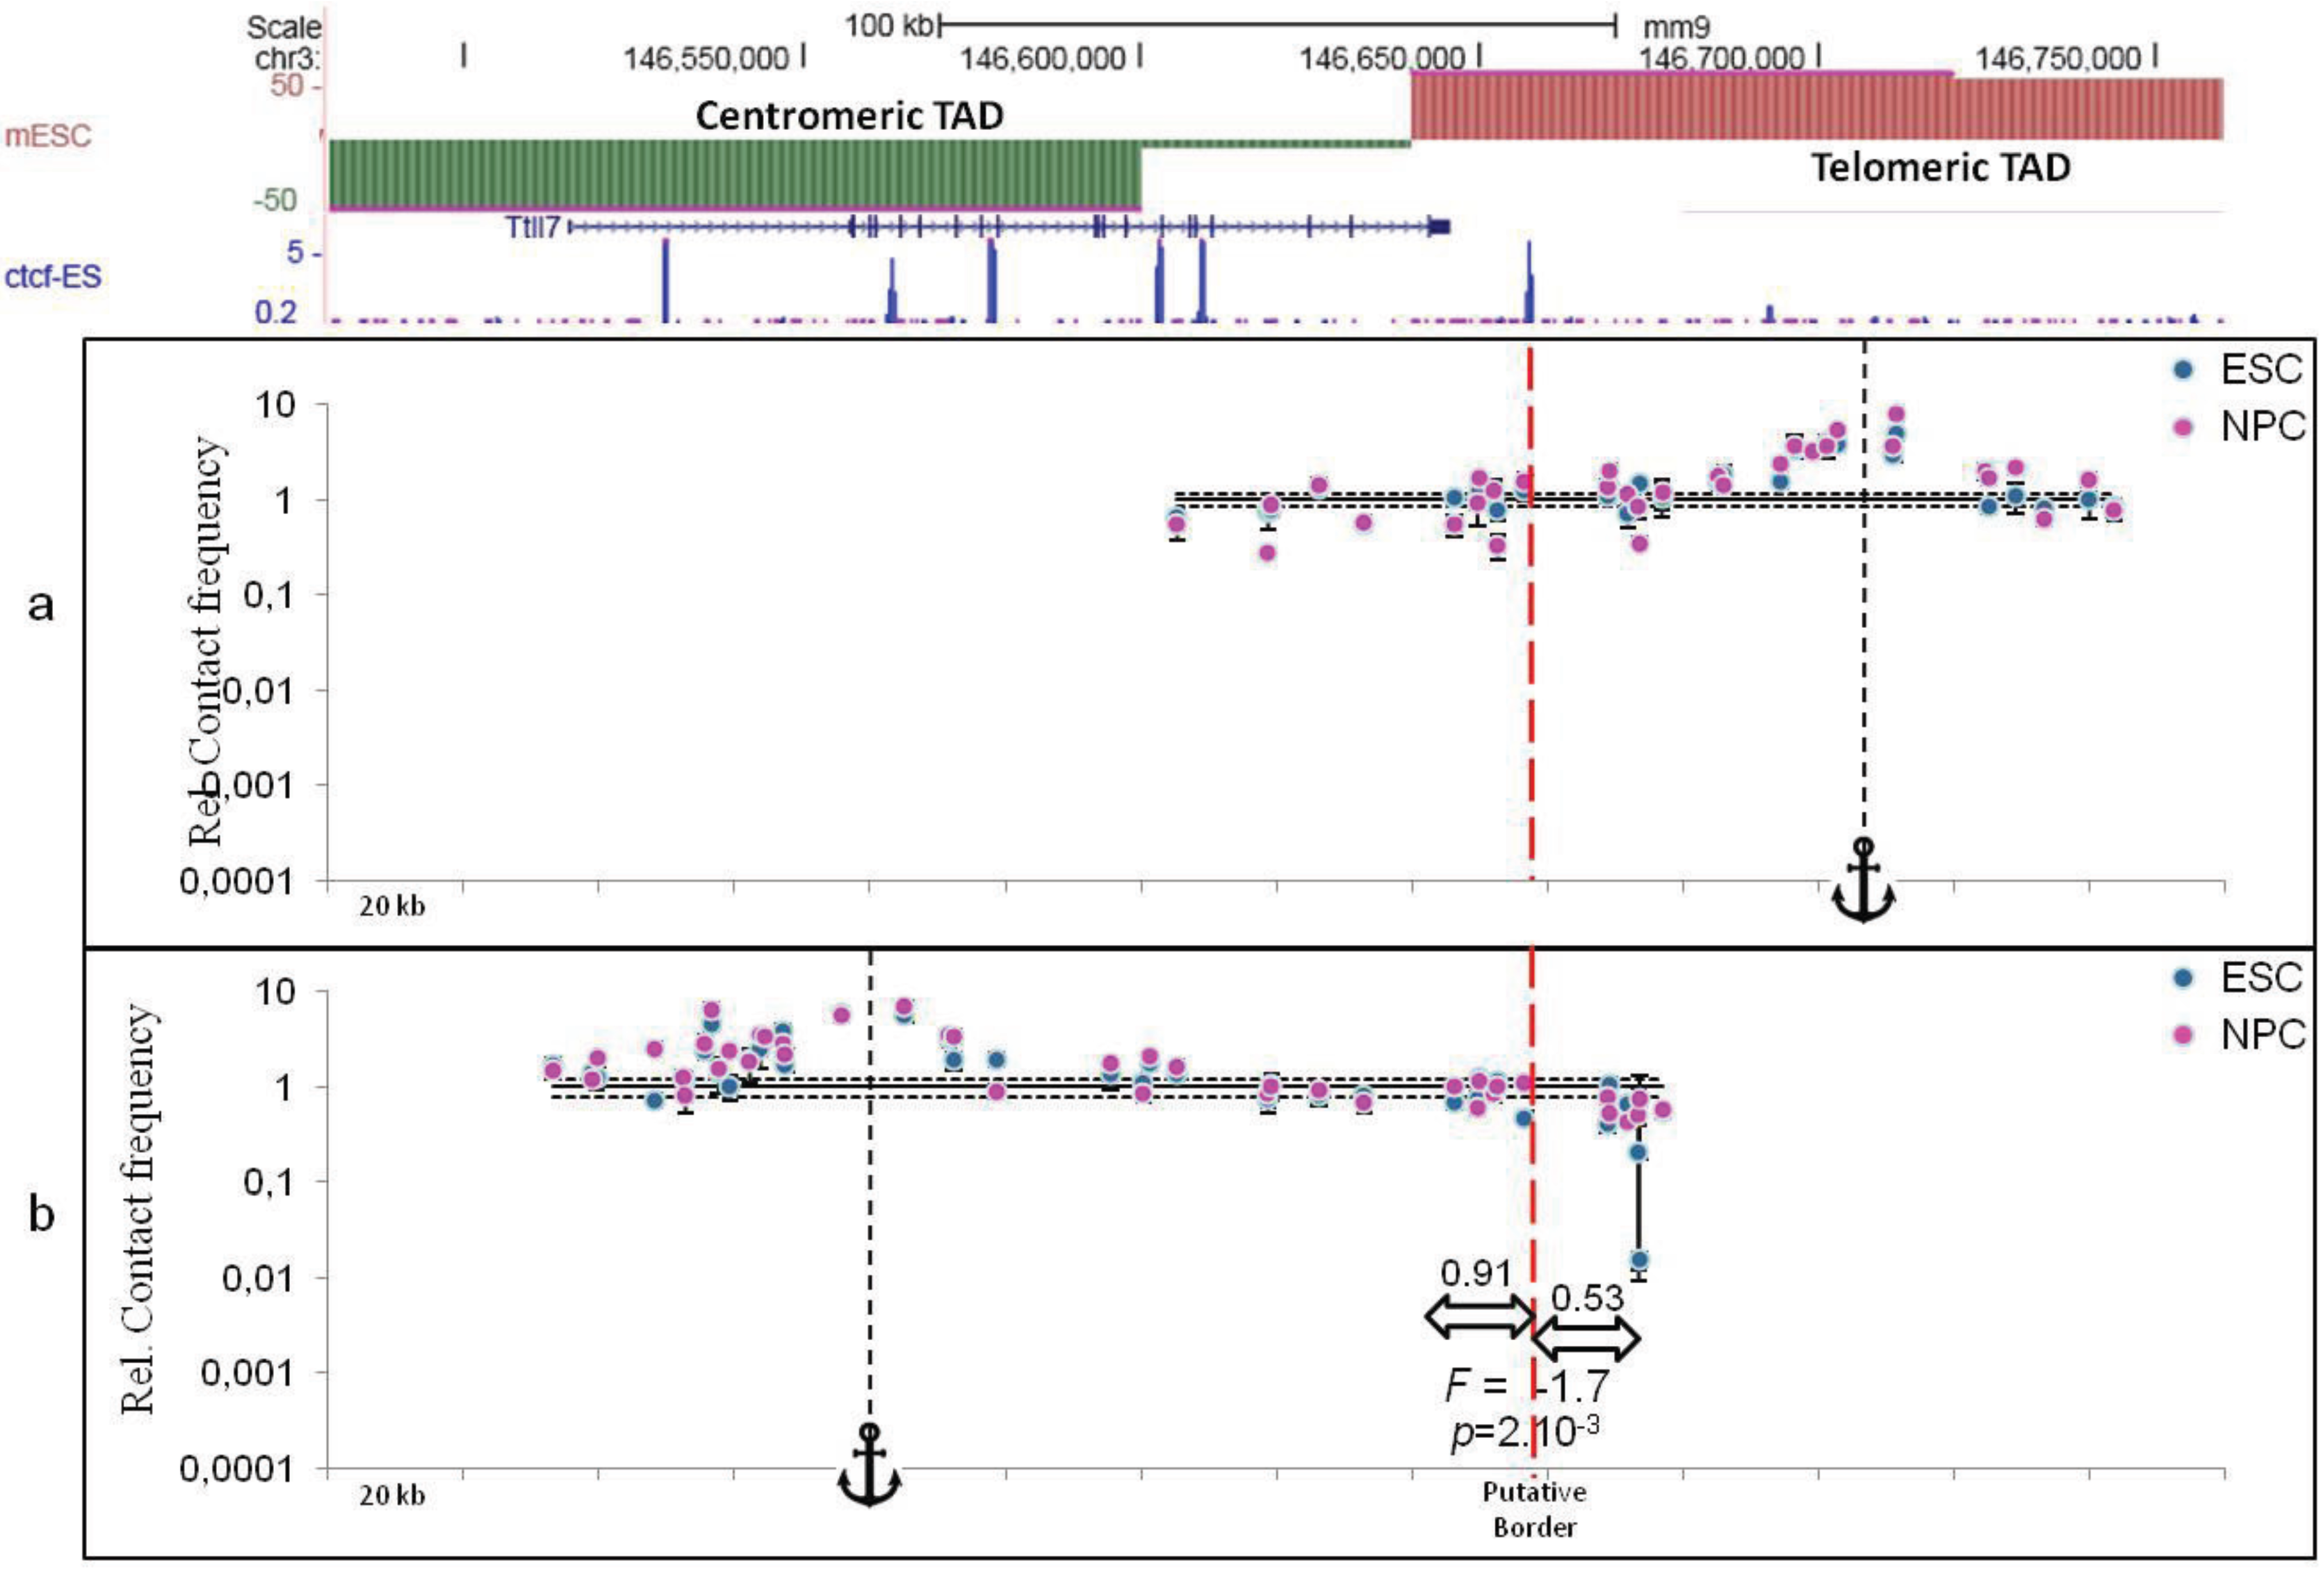
2.3. TAD Borders
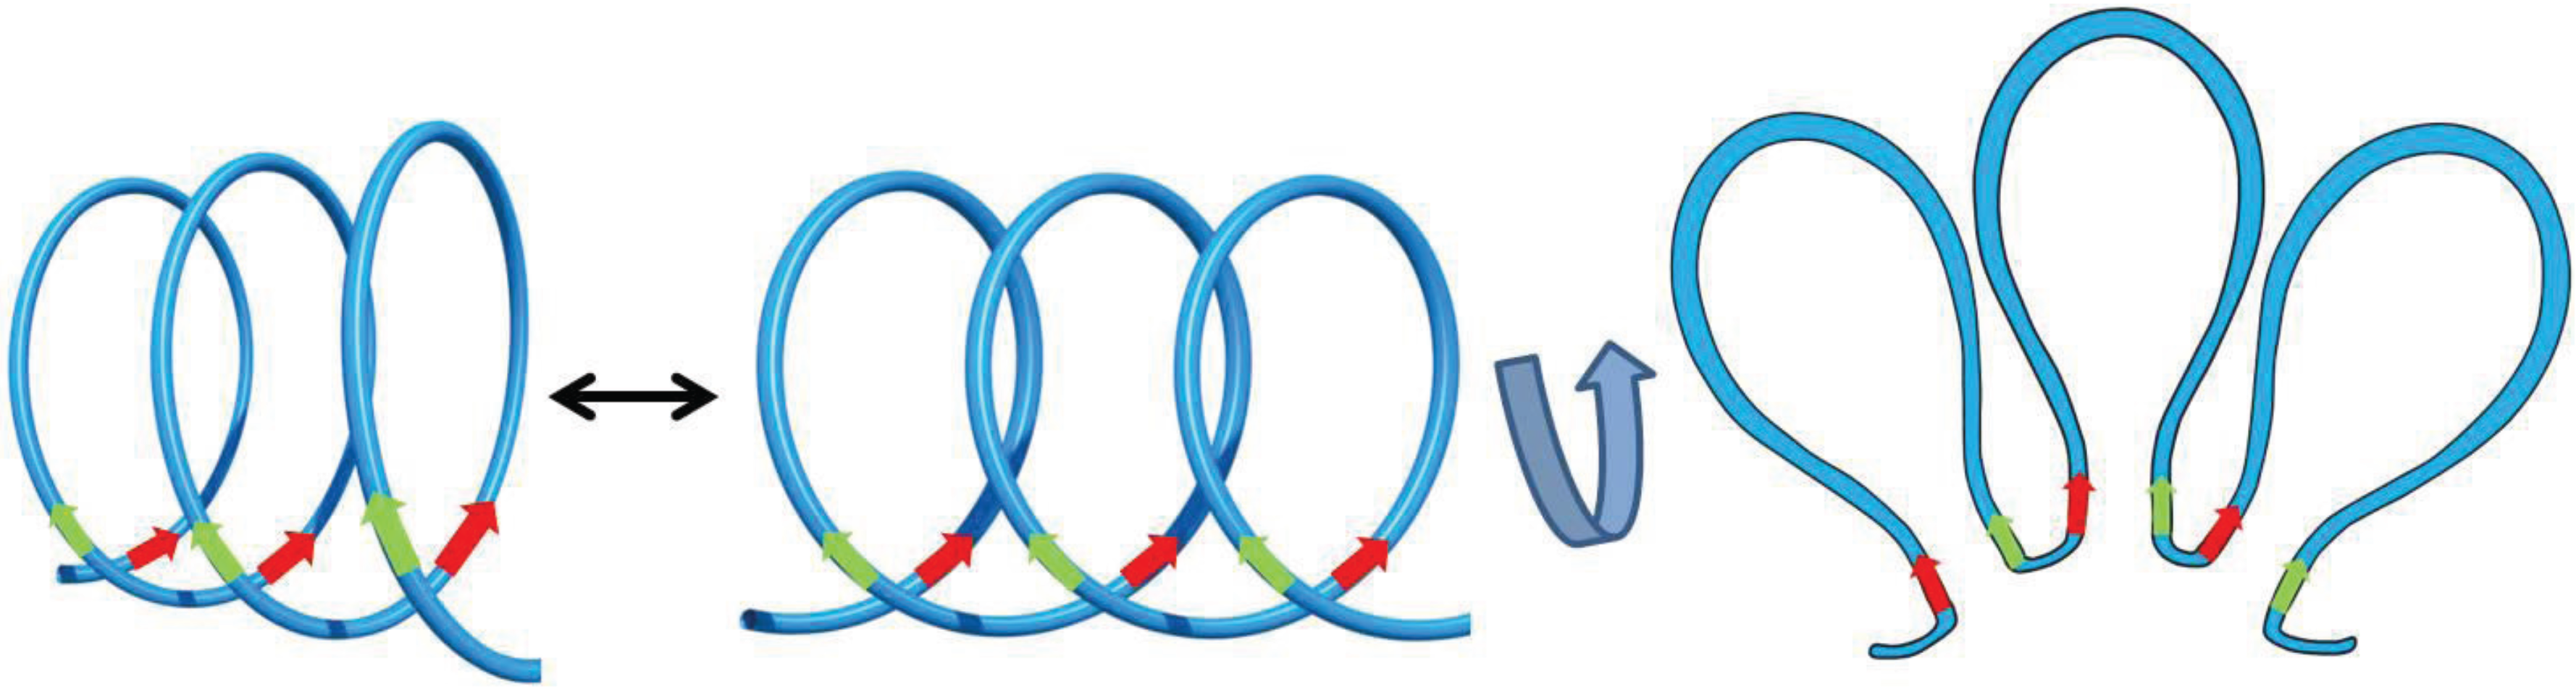
3. Sub-TAD Organization and Contact Domains
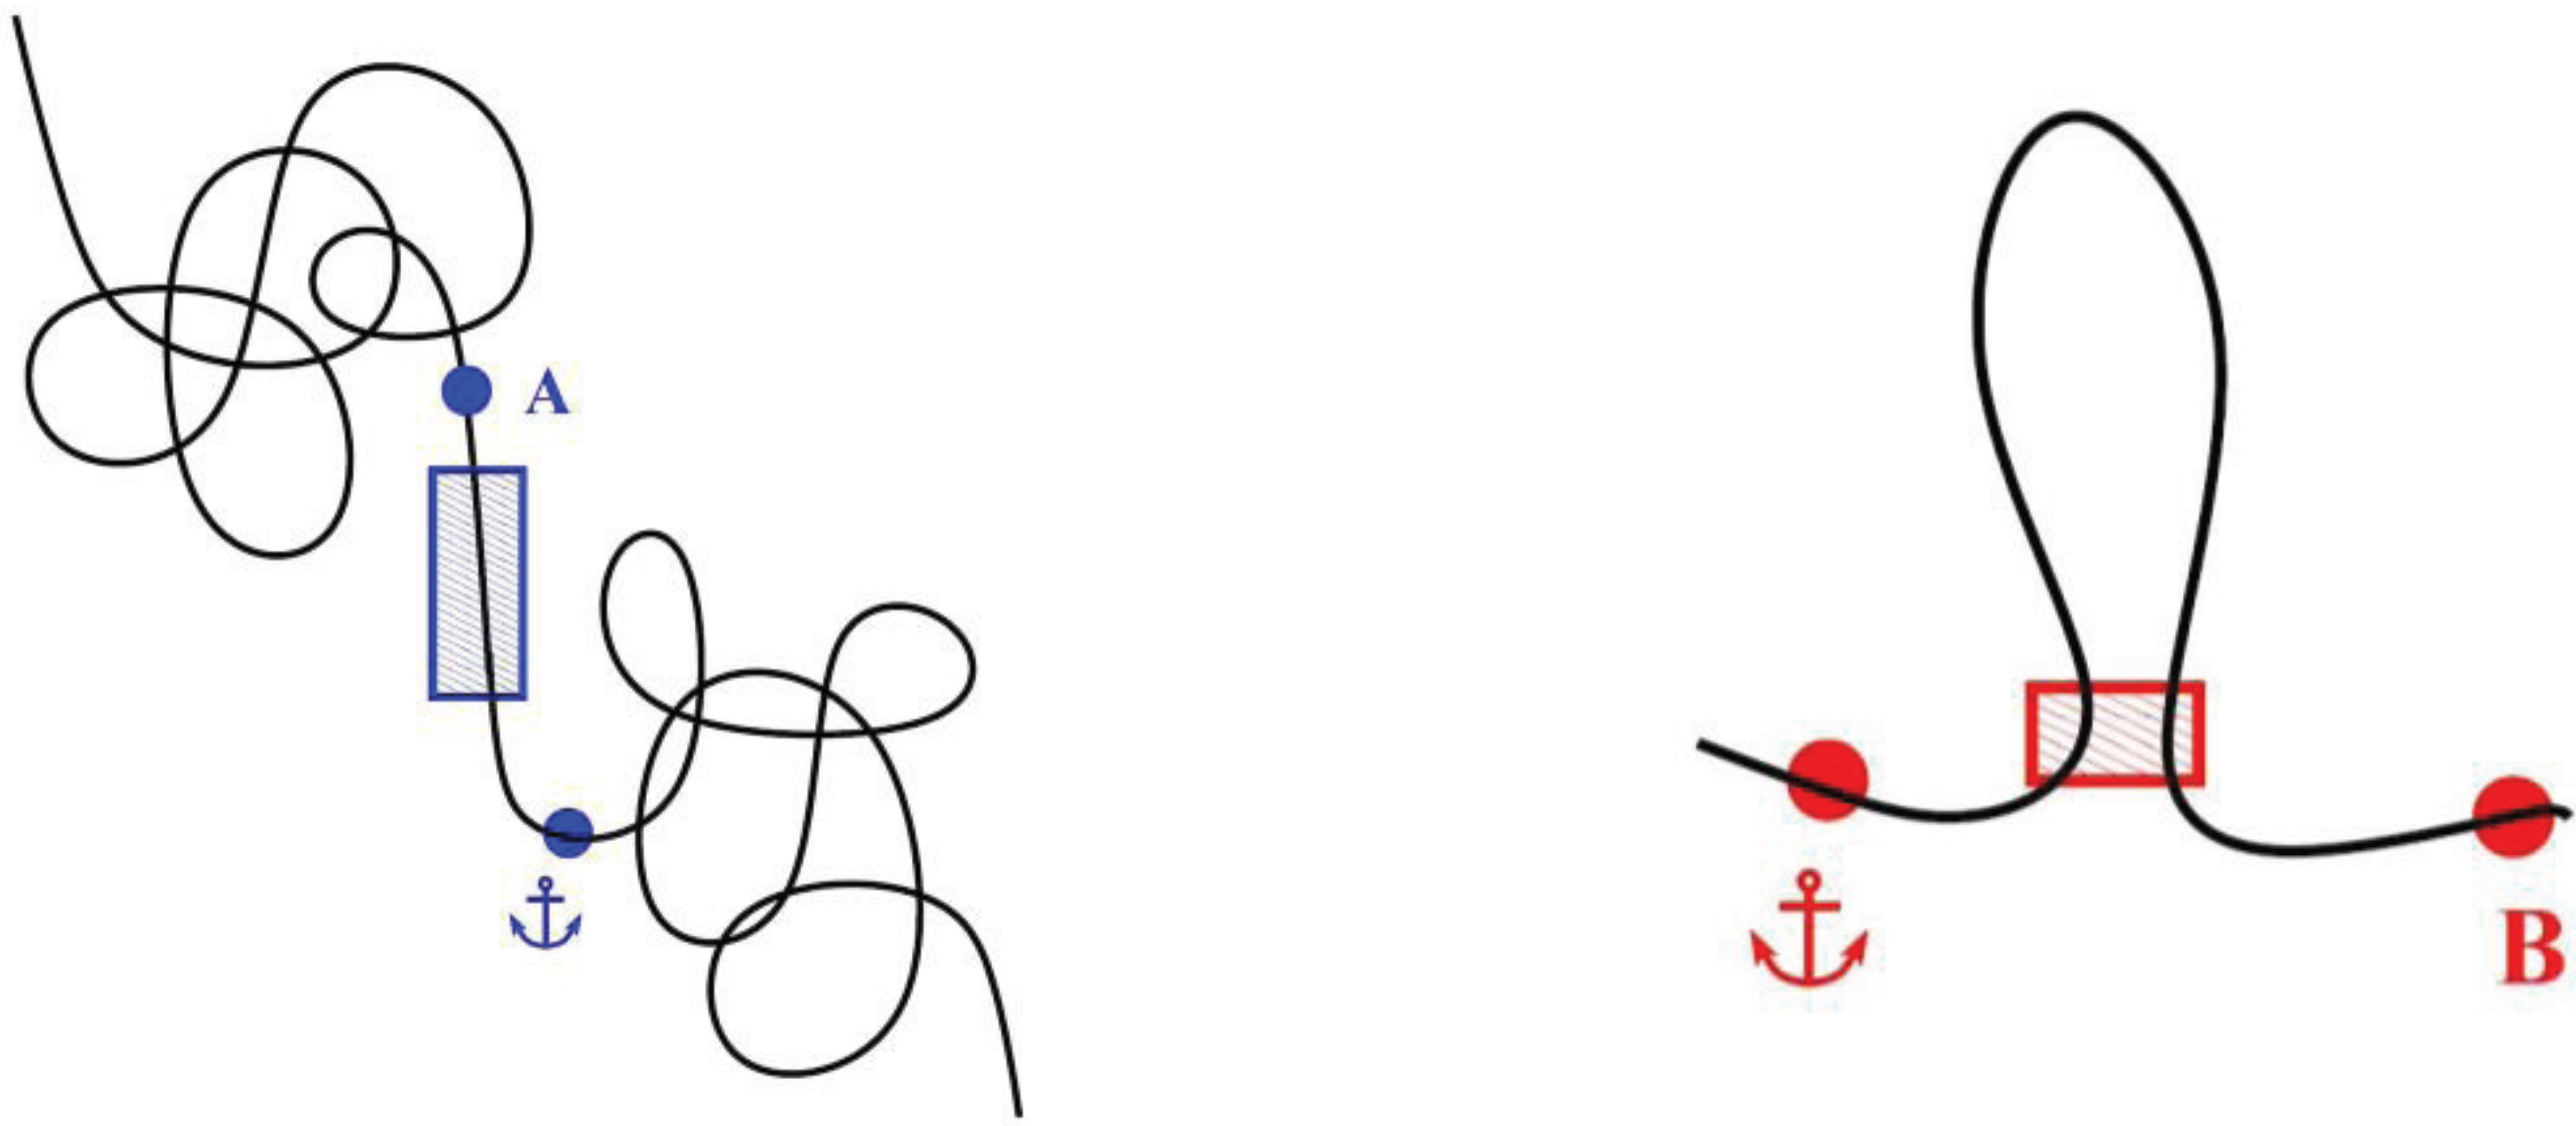
4. Defining TAD Borders vs. Contact Domain Borders and Loop Closures


5. Conclusions
Acknowledgments
Author Contributions
Conflicts of Interest
References
- Dekker, J.; Rippe, K.; Dekker, M.; Kleckner, N. Capturing chromosome conformation. Science 2002, 295, 1306–1311. [Google Scholar] [CrossRef] [PubMed]
- Tolhuis, B.; Palstra, R.J.; Splinter, E.; Grosveld, F.; de Laat, W. Looping and interaction between hypersensitive sites in the active beta-globin locus. Mol. Cell 2002, 10, 1453–1465. [Google Scholar] [CrossRef]
- Simonis, M.; Klous, P.; Splinter, E.; Moshkin, Y.; Willemsen, R.; de Wit, E.; van Steensel, B.; de Laat, W. Nuclear organization of active and inactive chromatin domains uncovered by chromosome conformation capture-on-chip (4c). Nat. Genet. 2006, 38, 1348–1354. [Google Scholar] [CrossRef] [PubMed]
- Lieberman-Aiden, E.; van Berkum, N.L.; Williams, L.; Imakaev, M.; Ragoczy, T.; Telling, A.; Amit, I.; Lajoie, B.R.; Sabo, P.J.; Dorschner, M.O.; et al. Comprehensive mapping of long-range interactions reveals folding principles of the human genome. Science 2009, 326, 289–293. [Google Scholar] [CrossRef] [PubMed]
- Rao, S.S.; Huntley, M.H.; Durand, N.C.; Stamenova, E.K.; Bochkov, I.D.; Robinson, J.T.; Sanborn, A.L.; Machol, I.; Omer, A.D.; Lander, E.S.; et al. A 3D map of the human genome at kilobase resolution reveals principles of chromatin looping. Cell 2014, 159, 1665–1680. [Google Scholar] [CrossRef] [PubMed]
- Kalhor, R.; Tjong, H.; Jayathilaka, N.; Alber, F.; Chen, L. Genome architectures revealed by tethered chromosome conformation capture and population-based modeling. Nat. Biotechnol. 2012, 30, 90–98. [Google Scholar] [CrossRef] [PubMed]
- Lesne, A.; Riposo, J.; Roger, P.; Cournac, A.; Mozziconacci, J. 3D genome reconstruction from chromosomal contacts. Nat. Methods 2014, 11, 1141–1143. [Google Scholar] [CrossRef] [PubMed]
- Kundaje, A.; Meuleman, W.; Ernst, J.; Bilenky, M.; Yen, A.; Heravi-Moussavi, A.; Kheradpour, P.; Zhang, Z.; Wang, J.; Ziller, M.J.; et al. Integrative analysis of 111 reference human epigenomes. Nature 2015, 518, 317–330. [Google Scholar] [CrossRef] [PubMed]
- Shen, Y.; Yue, F.; McCleary, D.F.; Ye, Z.; Edsall, L.; Kuan, S.; Wagner, U.; Dixon, J.; Lee, L.; Lobanenkov, V.V.; et al. A map of the cis-regulatory sequences in the mouse genome. Nature 2012, 488, 116–120. [Google Scholar] [CrossRef] [PubMed]
- Imakaev, M.; Fudenberg, G.; McCord, R.P.; Naumova, N.; Goloborodko, A.; Lajoie, B.R.; Dekker, J.; Mirny, L.A. Iterative correction of Hi-C data reveals hallmarks of chromosome organization. Nat. Methods 2012, 9, 999–1003. [Google Scholar] [CrossRef] [PubMed]
- Gibcus, J.H.; Dekker, J. The hierarchy of the 3D genome. Mol. Cell 2013, 49, 773–782. [Google Scholar] [CrossRef] [PubMed]
- Hagège, H.; Klous, P.; Braem, C.; Splinter, E.; Dekker, J.; Cathala, G.; de Laat, W.; Forné, T. Quantitative analysis of chromosome conformation capture assays (3C-QPCR). Nat. Protoc. 2007, 2, 1722–1733. [Google Scholar] [CrossRef] [PubMed]
- Dostie, J.; Richmond, T.A.; Arnaout, R.A.; Selzer, R.R.; Lee, W.L.; Honan, T.A.; Rubio, E.D.; Krumm, A.; Lamb, J.; Nusbaum, C.; et al. Chromosome Conformation Capture Carbon Copy (5C): A massively parallel solution for mapping interactions between genomic elements. Genome Res. 2006, 16, 1299–1309. [Google Scholar] [CrossRef] [PubMed]
- De Wit, E.; de Laat, W. A decade of 3C technologies: Insights into nuclear organization. Genes Dev. 2012, 26, 11–24. [Google Scholar] [CrossRef] [PubMed]
- Dixon, J.R.; Selvaraj, S.; Yue, F.; Kim, A.; Li, Y.; Shen, Y.; Hu, M.; Liu, J.S.; Ren, B. Topological domains in mammalian genomes identified by analysis of chromatin interactions. Nature 2012, 485, 376–380. [Google Scholar] [CrossRef] [PubMed]
- Hou, C.; Li, L.; Qin, Z.S.; Corces, V.G. Gene density, transcription, and insulators contribute to the partition of the Drosophila genome into physical domains. Mol. Cell 2012, 48, 471–484. [Google Scholar] [CrossRef] [PubMed]
- Nora, E.P.; Lajoie, B.R.; Schulz, E.G.; Giorgetti, L.; Okamoto, I.; Servant, N.; Piolot, T.; van Berkum, N.L.; Meisig, J.; Sedat, J.; et al. Spatial partitioning of the regulatory landscape of the X-inactivation centre. Nature 2012, 485, 381–385. [Google Scholar] [CrossRef] [PubMed]
- Sexton, T.; Yaffe, E.; Kenigsberg, E.; Bantignies, F.; Leblanc, B.; Hoichman, M.; Parrinello, H.; Tanay, A.; Cavalli, G. Three-dimensional folding and functional organization principles of the Drosophila genome. Cell 2012, 148, 458–472. [Google Scholar] [CrossRef] [PubMed]
- Nagano, T.; Lubling, Y.; Stevens, T.J.; Schoenfelder, S.; Yaffe, E.; Dean, W.; Laue, E.D.; Tanay, A.; Fraser, P. Single-cell Hi-C reveals cell-to-cell variability in chromosome structure. Nature 2013, 502, 59–64. [Google Scholar] [CrossRef] [PubMed]
- Duan, Z.; Andronescu, M.; Schutz, K.; McIlwain, S.; Kim, Y.J.; Lee, C.; Shendure, J.; Fields, S.; Blau, C.A.; Noble, W.S. A three-dimensional model of the yeast genome. Nature 2010, 465, 363–367. [Google Scholar] [CrossRef] [PubMed]
- Tanizawa, H.; Iwasaki, O.; Tanaka, A.; Capizzi, J.R.; Wickramasinghe, P.; Lee, M.; Fu, Z.; Noma, K. Mapping of long-range associations throughout the fission yeast genome reveals global genome organization linked to transcriptional regulation. Nucleic Acids Res. 2010, 38, 8164–8177. [Google Scholar] [CrossRef] [PubMed]
- Feng, S.; Cokus, S.J.; Schubert, V.; Zhai, J.; Pellegrini, M.; Jacobsen, S.E. Genome-wide Hi-C analyses in wild-type and mutants reveal high-resolution chromatin interactions in arabidopsis. Mol. Cell 2014, 55, 694–707. [Google Scholar] [CrossRef] [PubMed]
- Grob, S.; Schmid, M.W.; Grossniklaus, U. Hi-C analysis in arabidopsis identifies the knot, a structure with similarities to the flamenco locus of Drosophila. Mol. Cell 2014, 55, 678–693. [Google Scholar] [CrossRef] [PubMed]
- Mizuguchi, T.; Fudenberg, G.; Mehta, S.; Belton, J.M.; Taneja, N.; Folco, H.D.; FitzGerald, P.; Dekker, J.; Mirny, L.; Barrowman, J.; et al. Cohesin-dependent globules and heterochromatin shape 3D genome architecture in S. Pombe. Nature 2014, 516, 432–435. [Google Scholar] [CrossRef] [PubMed]
- Eskeland, R.; Leeb, M.; Grimes, G.R.; Kress, C.; Boyle, S.; Sproul, D.; Gilbert, N.; Fan, Y.; Skoultchi, A.I.; Wutz, A.; et al. Ring1b compacts chromatin structure and represses gene expression independent of histone ubiquitination. Mol. Cell 2010, 38, 452–464. [Google Scholar] [CrossRef] [PubMed]
- Jin, F.; Li, Y.; Dixon, J.R.; Selvaraj, S.; Ye, Z.; Lee, A.Y.; Yen, C.A.; Schmitt, A.D.; Espinoza, C.A.; Ren, B. A high-resolution map of the three-dimensional chromatin interactome in human cells. Nature 2013, 503, 290–294. [Google Scholar] [CrossRef] [PubMed]
- Naumova, N.; Imakaev, M.; Fudenberg, G.; Zhan, Y.; Lajoie, B.R.; Mirny, L.A.; Dekker, J. Organization of the mitotic chromosome. Science 2013, 342, 948–953. [Google Scholar] [CrossRef] [PubMed]
- Sofueva, S.; Yaffe, E.; Chan, W.C.; Georgopoulou, D.; Vietri Rudan, M.; Mira-Bontenbal, H.; Pollard, S.M.; Schroth, G.P.; Tanay, A.; Hadjur, S. Cohesin-mediated interactions organize chromosomal domain architecture. EMBO J. 2013, 32, 3119–3129. [Google Scholar] [CrossRef] [PubMed]
- Zuin, J.; Dixon, J.R.; van der Reijden, M.I.; Ye, Z.; Kolovos, P.; Brouwer, R.W.; van de Corput, M.P.; van de Werken, H.J.; Knoch, T.A.; van, I.W.F.; et al. Cohesin and CTCF differentially affect chromatin architecture and gene expression in human cells. Proc. Natl. Acad. Sci. USA 2014, 111, 996–1001. [Google Scholar] [CrossRef] [PubMed]
- Kagey, M.H.; Newman, J.J.; Bilodeau, S.; Zhan, Y.; Orlando, D.A.; van Berkum, N.L.; Ebmeier, C.C.; Goossens, J.; Rahl, P.B.; Levine, S.S.; et al. Mediator and cohesin connect gene expression and chromatin architecture. Nature 2010, 467, 430–435. [Google Scholar] [CrossRef] [PubMed] [Green Version]
- Liang, J.; Lacroix, L.; Gamot, A.; Cuddapah, S.; Queille, S.; Lhoumaud, P.; Lepetit, P.; Martin, P.G.; Vogelmann, J.; Court, F.; et al. Chromatin immunoprecipitation indirect peaks highlight long-range interactions of insulator proteins and pol ii pausing. Mol. Cell 2014, 53, 672–681. [Google Scholar] [CrossRef] [PubMed]
- Merkenschlager, M.; Odom, D.T. CTCF and cohesin: Linking gene regulatory elements with their targets. Cell 2013, 152, 1285–1297. [Google Scholar] [CrossRef] [PubMed]
- Ong, C.T.; Corces, V.G. CTCF: An architectural protein bridging genome topology and function. Nat. Rev. Genet. 2014, 15, 234–246. [Google Scholar] [CrossRef] [PubMed]
- Spencer, R.J.; del Rosario, B.C.; Pinter, S.F.; Lessing, D.; Sadreyev, R.I.; Lee, J.T. A boundary element between tsix and xist binds the chromatin insulator CTCF and contributes to initiation of X-chromosome inactivation. Genetics 2011, 189, 441–454. [Google Scholar] [CrossRef] [PubMed]
- Shih, H.Y.; Krangel, M.S. Chromatin architecture, ccctc-binding factor, and V(D)J recombination: Managing long-distance relationships at antigen receptor loci. J. Immunol. 2013, 190, 4915–4921. [Google Scholar] [CrossRef] [PubMed]
- Caré, B.R.; Carrivain, P.; Forné, T.; Victor, J.-M.; Lesne, A. Finite-size conformational transitions: A unifying concept underlying chromosome dynamics. Commun. Theor. Phys. 2014, 62, 607–616. [Google Scholar] [CrossRef]
- Court, F.; Baniol, M.; Hagège, H.; Petit, J.S.; Lelay-Taha, M.N.; Carbonell, F.; Weber, M.; Cathala, G.; Forné, T. Long-range chromatin interactions at the mouse Igf2/H19 locus reveal a novel paternally expressed long non-coding RNA. Nucleic Acids Res. 2011, 39, 5893–5906. [Google Scholar] [CrossRef] [PubMed]
- Kurukuti, S.; Tiwari, V.K.; Tavoosidana, G.; Pugacheva, E.; Murrell, A.; Zhao, Z.; Lobanenkov, V.; Reik, W.; Ohlsson, R. CTCF binding at the H19 imprinting control region mediates maternally inherited higher-order chromatin conformation to restrict enhancer access to Igf2. Proc. Natl. Acad. Sci. USA 2006, 103, 10684–10689. [Google Scholar] [CrossRef] [PubMed]
- DeMare, L.E.; Leng, J.; Cotney, J.; Reilly, S.K.; Yin, J.; Sarro, R.; Noonan, J.P. The genomic landscape of cohesin-associated chromatin interactions. Genome Res. 2015, 23, 1224–1234. [Google Scholar] [CrossRef] [PubMed]
- Li, Y.; Huang, W.; Niu, L.; Umbach, D.M.; Covo, S.; Li, L. Characterization of constitutive CTCF/cohesin loci: A possible role in establishing topological domains in mammalian genomes. BMC Genomics 2013. [Google Scholar] [CrossRef] [PubMed]
- Le Gall, A.; Valeri, A.; Nollmann, M. Roles of chromatin insulators in the formation of long-range contacts. Nucleus 2015, 17, 1–5. [Google Scholar] [CrossRef] [PubMed]
- Van Bortle, K.; Nichols, M.H.; Li, L.; Ong, C.T.; Takenaka, N.; Qin, Z.S.; Corces, V.G. Insulator function and topological domain border strength scale with architectural protein occupancy. Genome Biol. 2014. [Google Scholar] [CrossRef] [PubMed]
- Phillips-Cremins, J.E.; Sauria, M.E.; Sanyal, A.; Gerasimova, T.I.; Lajoie, B.R.; Bell, J.S.; Ong, C.T.; Hookway, T.A.; Guo, C.; Sun, Y.; et al. Architectural protein subclasses shape 3D organization of genomes during lineage commitment. Cell 2013, 153, 1281–1295. [Google Scholar] [CrossRef] [PubMed]
- Berlivet, S.; Paquette, D.; Dumouchel, A.; Langlais, D.; Dostie, J.; Kmita, M. Clustering of tissue-specific sub-tads accompanies the regulation of hoxa genes in developing limbs. PLoS Genet. 2013, 9, e1004018. [Google Scholar] [CrossRef] [PubMed]
- Guelen, L.; Pagie, L.; Brasset, E.; Meuleman, W.; Faza, M.B.; Talhout, W.; Eussen, B.H.; de Klein, A.; Wessels, L.; de Laat, W.; et al. Domain organization of human chromosomes revealed by mapping of nuclear lamina interactions. Nature 2008, 453, 948–951. [Google Scholar] [CrossRef] [PubMed]
- Peric-Hupkes, D.; Meuleman, W.; Pagie, L.; Bruggeman, S.W.; Solovei, I.; Brugman, W.; Graf, S.; Flicek, P.; Kerkhoven, R.M.; van Lohuizen, M.; et al. Molecular maps of the reorganization of genome-nuclear lamina interactions during differentiation. Mol. Cell 2010, 38, 603–613. [Google Scholar] [CrossRef] [PubMed]
- Nemeth, A.; Conesa, A.; Santoyo-Lopez, J.; Medina, I.; Montaner, D.; Peterfia, B.; Solovei, I.; Cremer, T.; Dopazo, J.; Langst, G. Initial genomics of the human nucleolus. PLoS Genet. 2010, 6, e1000889. [Google Scholar] [CrossRef] [PubMed]
- Vietri Rudan, M.; Barrington, C.; Henderson, S.; Ernst, C.; Odom, D.T.; Tanay, A.; Hadjur, S. Comparative Hi-C reveals that CTCF underlies evolution of chromosomal domain architecture. Cell Rep. 2015, 10, 1297–1309. [Google Scholar]
- Liu, M.; Maurano, M.T.; Wang, H.; Qi, H.; Song, C.Z.; Navas, P.A.; Emery, D.W.; Stamatoyannopoulos, J.A.; Stamatoyannopoulos, G. Genomic discovery of potent chromatin insulators for human gene therapy. Nat. Biotechnol. 2015, 33, 198–203. [Google Scholar] [CrossRef] [PubMed]
- Nora, E.P.; Dekker, J.; Heard, E. Segmental folding of chromosomes: A basis for structural and regulatory chromosomal neighborhoods? Bioessays 2013, 35, 818–828. [Google Scholar] [CrossRef] [PubMed]
- Mousavi, S.M.J.; Yeganeh, F. Role of chromatin insulators in gene regulation and diseases. Res. Mol. Med. 2013, 1, 1–5. [Google Scholar]
- Salem, T.; Gomard, T.; Court, F.; Moquet-Torcy, G.; Brockly, F.; Forné, T.; Piechaczyk, M. Chromatin loop organization of the junb locus in mouse dendritic cells. Nucleic Acids Res. 2013, 41, 8908–8925. [Google Scholar] [CrossRef] [PubMed]
- Andrey, G.; Montavon, T.; Mascrez, B.; Gonzalez, F.; Noordermeer, D.; Leleu, M.; Trono, D.; Spitz, F.; Duboule, D. A switch between topological domains underlies hoxd genes collinearity in mouse limbs. Science 2013. [Google Scholar] [CrossRef] [PubMed]
- Court, F.; Miro, J.; Braem, C.; Lelay-Taha, M.N.; Brisebarre, A.; Atger, F.; Gostan, T.; Weber, M.; Cathala, G.; Forné, T. Modulated contact frequencies at gene-rich loci support a statistical helix model for mammalian chromatin organization. Genome Biol. 2011. [Google Scholar] [CrossRef] [PubMed]
- Braem, C.; Recolin, B.; Rancourt, R.C.; Angiolini, C.; Barthes, P.; Branchu, P.; Court, F.; Cathala, G.; Ferguson-Smith, A.C.; Forné, T. Genomic matrix attachment region and chromosome conformation capture quantitative real time pcr assays identify novel putative regulatory elements at the imprinted dlk1/gtl2 locus. J. Biol. Chem. 2008, 283, 18612–18620. [Google Scholar] [CrossRef] [PubMed]
- Giorgetti, L.; Galupa, R.; Nora, E.P.; Piolot, T.; Lam, F.; Dekker, J.; Tiana, G.; Heard, E. Predictive polymer modeling reveals coupled fluctuations in chromosome conformation and transcription. Cell 2014, 157, 950–963. [Google Scholar] [CrossRef] [PubMed]
- Kleckner, N. Chiasma formation: Chromatin/axis interplay and the role(s) of the synaptonemal complex. Chromosoma 2006, 115, 175–194. [Google Scholar] [CrossRef] [PubMed]
- Phillips-Cremins, J.E. Unraveling architecture of the pluripotent genome. Curr. Opin. Cell Biol. 2014, 28, 96–104. [Google Scholar] [CrossRef] [PubMed]
- Kleckner, N.; Zickler, D.; Jones, G.H.; Dekker, J.; Padmore, R.; Henle, J.; Hutchinson, J. A mechanical basis for chromosome function. Proc. Natl. Acad. Sci. USA 2004, 101, 12592–12597. [Google Scholar] [CrossRef] [PubMed]
© 2015 by the authors; licensee MDPI, Basel, Switzerland. This article is an open access article distributed under the terms and conditions of the Creative Commons Attribution license (http://creativecommons.org/licenses/by/4.0/).
Share and Cite
Ea, V.; Baudement, M.-O.; Lesne, A.; Forné, T. Contribution of Topological Domains and Loop Formation to 3D Chromatin Organization. Genes 2015, 6, 734-750. https://doi.org/10.3390/genes6030734
Ea V, Baudement M-O, Lesne A, Forné T. Contribution of Topological Domains and Loop Formation to 3D Chromatin Organization. Genes. 2015; 6(3):734-750. https://doi.org/10.3390/genes6030734
Chicago/Turabian StyleEa, Vuthy, Marie-Odile Baudement, Annick Lesne, and Thierry Forné. 2015. "Contribution of Topological Domains and Loop Formation to 3D Chromatin Organization" Genes 6, no. 3: 734-750. https://doi.org/10.3390/genes6030734