
FTO Genotype and Type 2 Diabetes Mellitus: Spatial Analysis and Meta-Analysis of 62 Case-Control Studies from Different Regions

Abstract
:1. Introduction
2. Materials and Methods
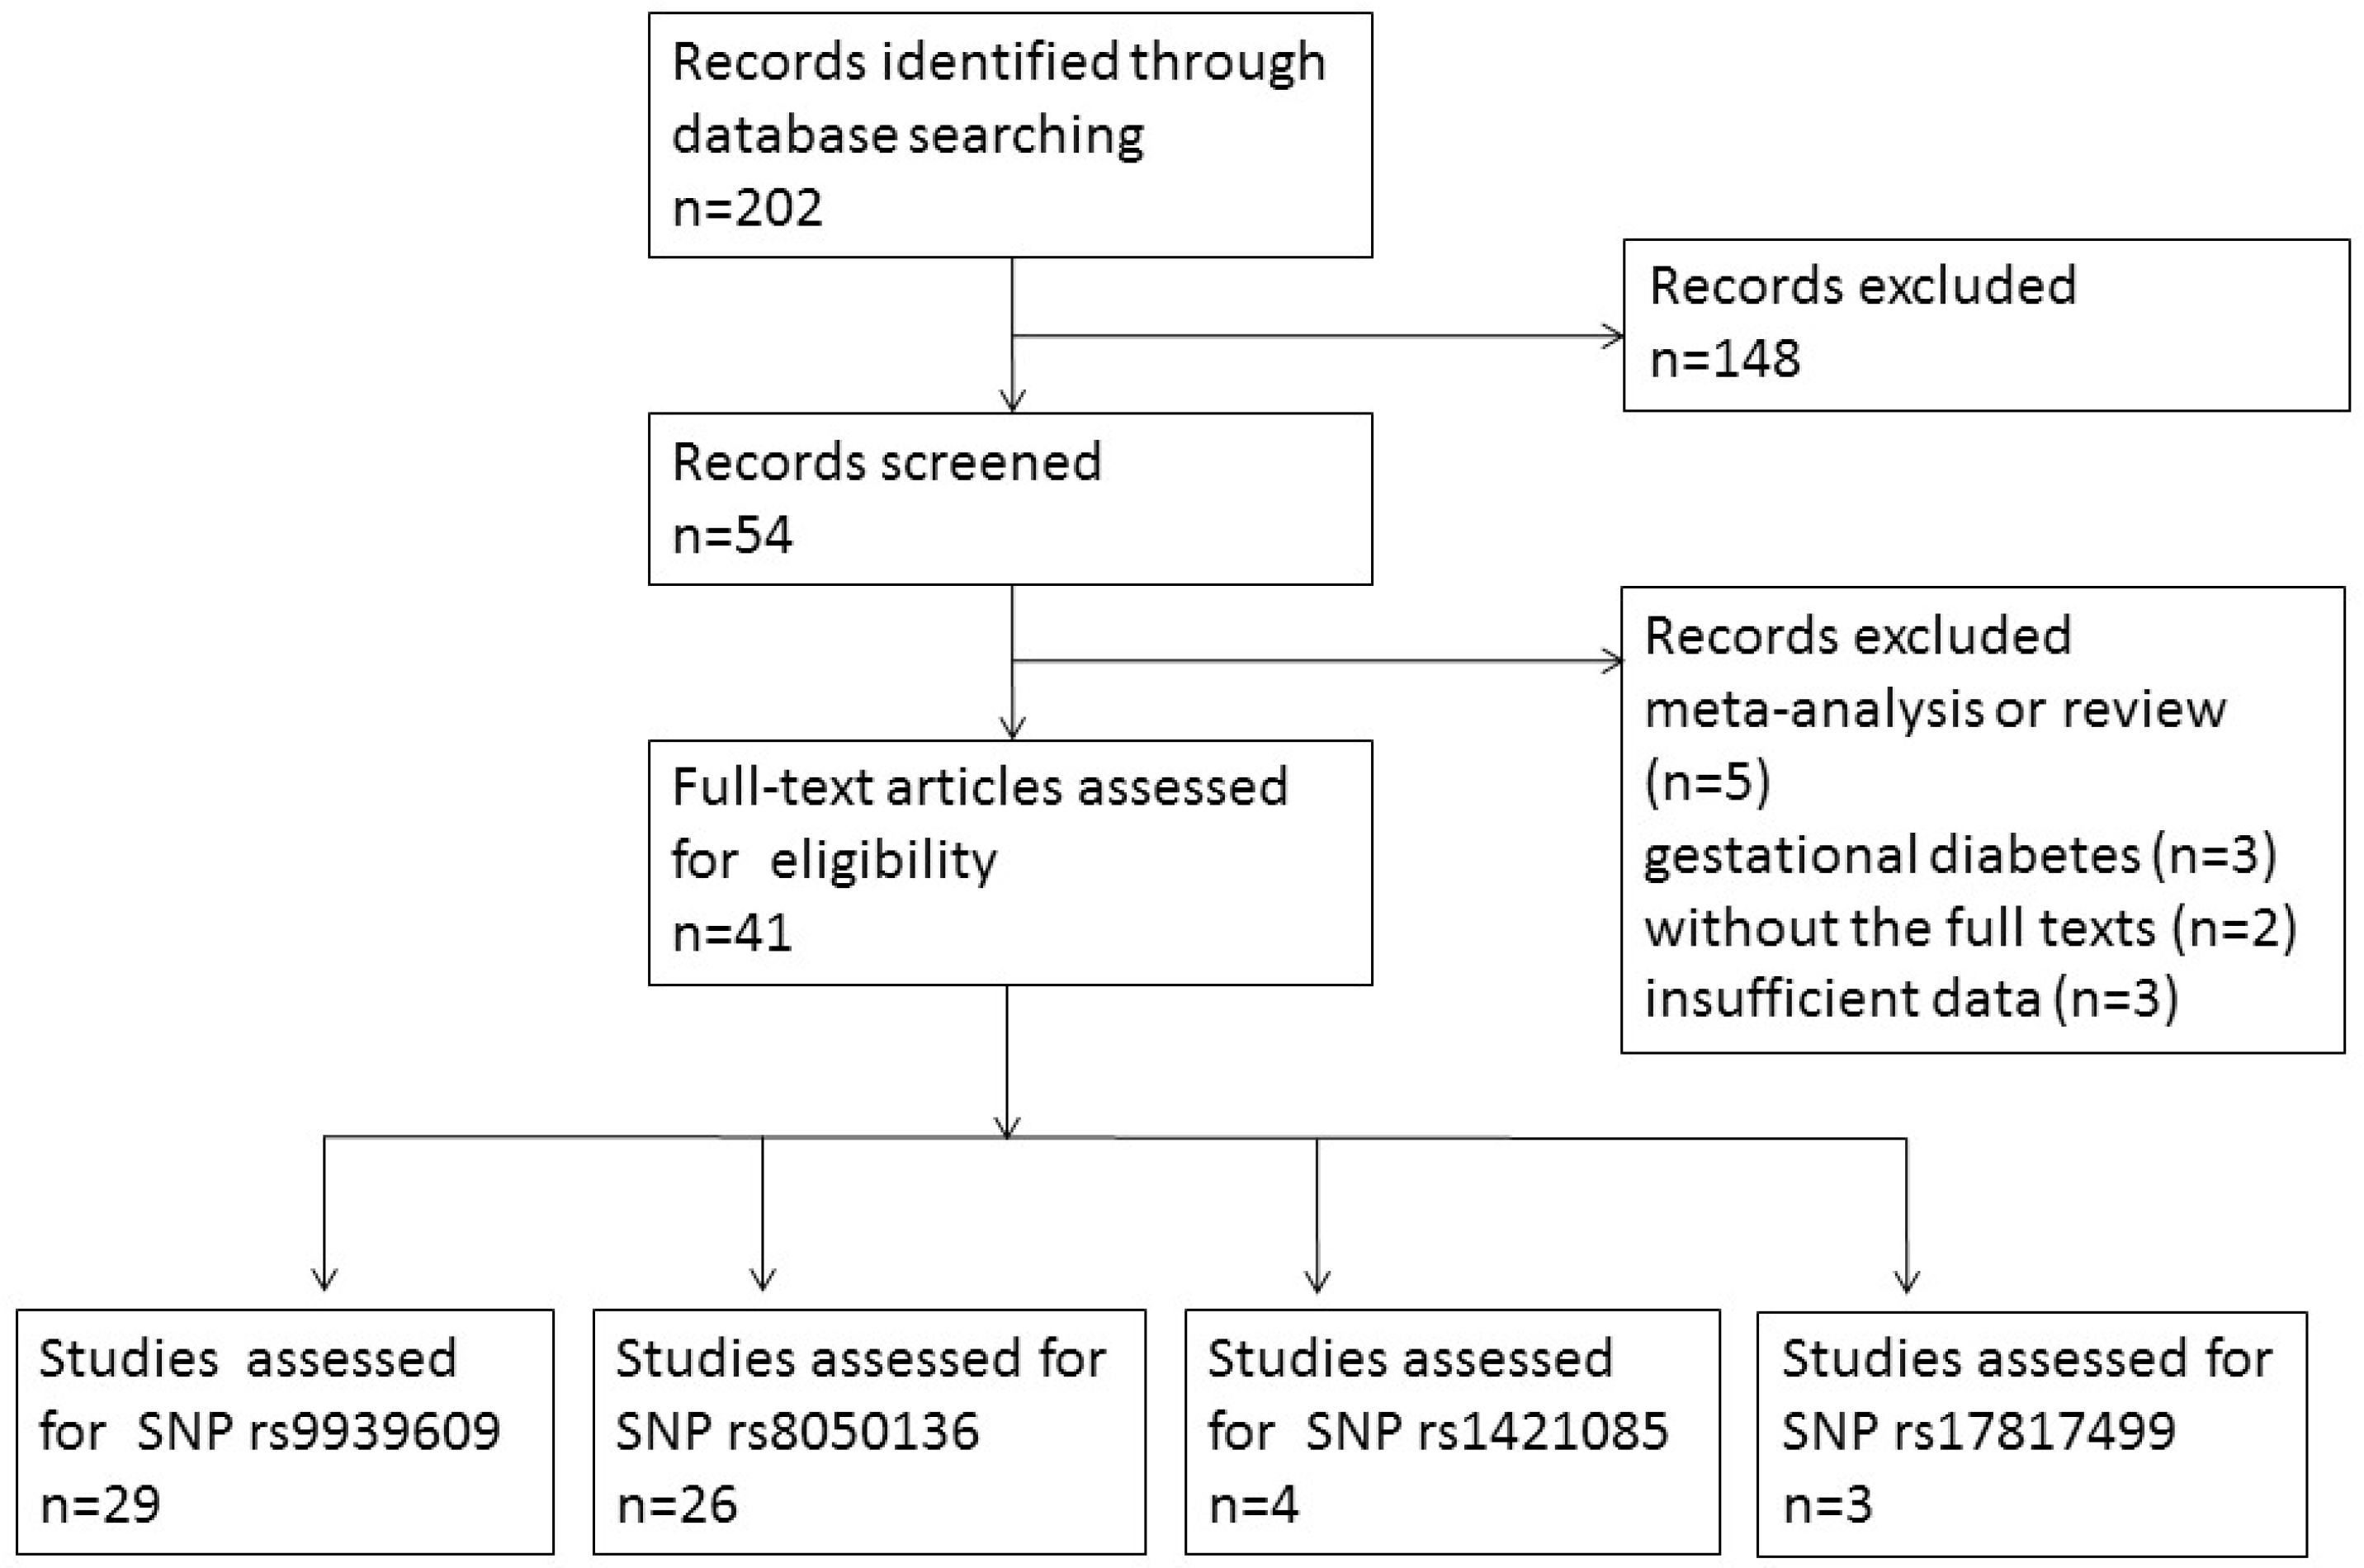
2.1. Search Strategy
2.2. Study Selection Criteria and Data Extraction
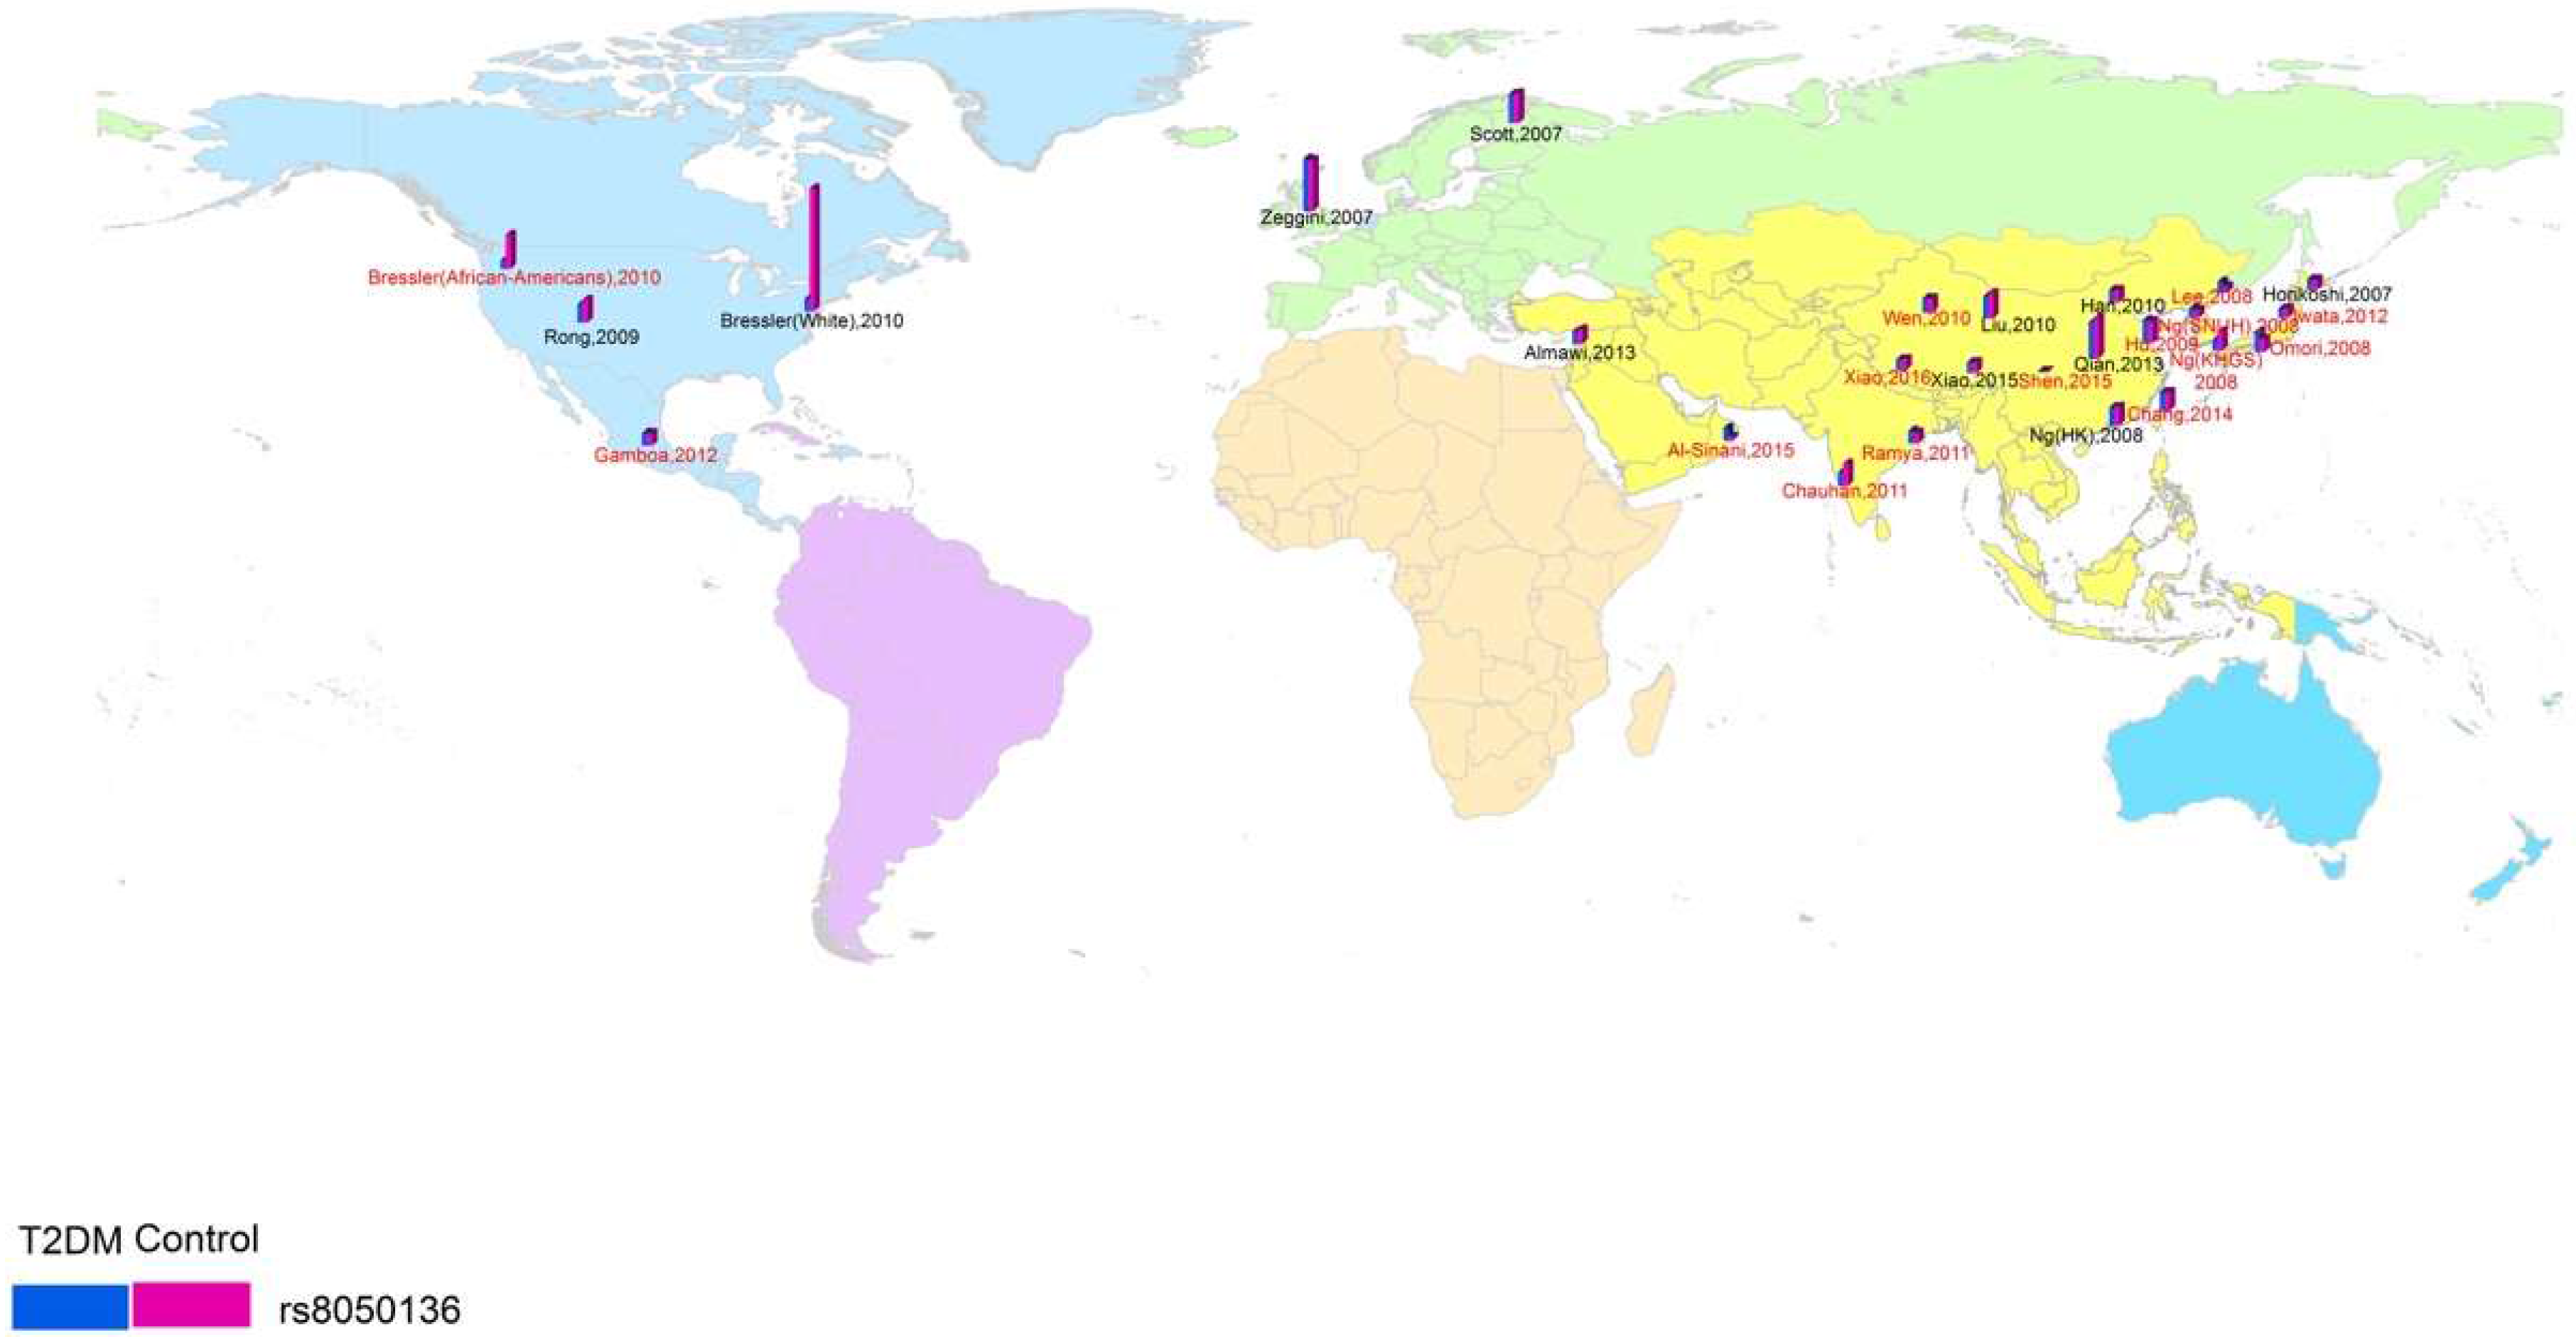
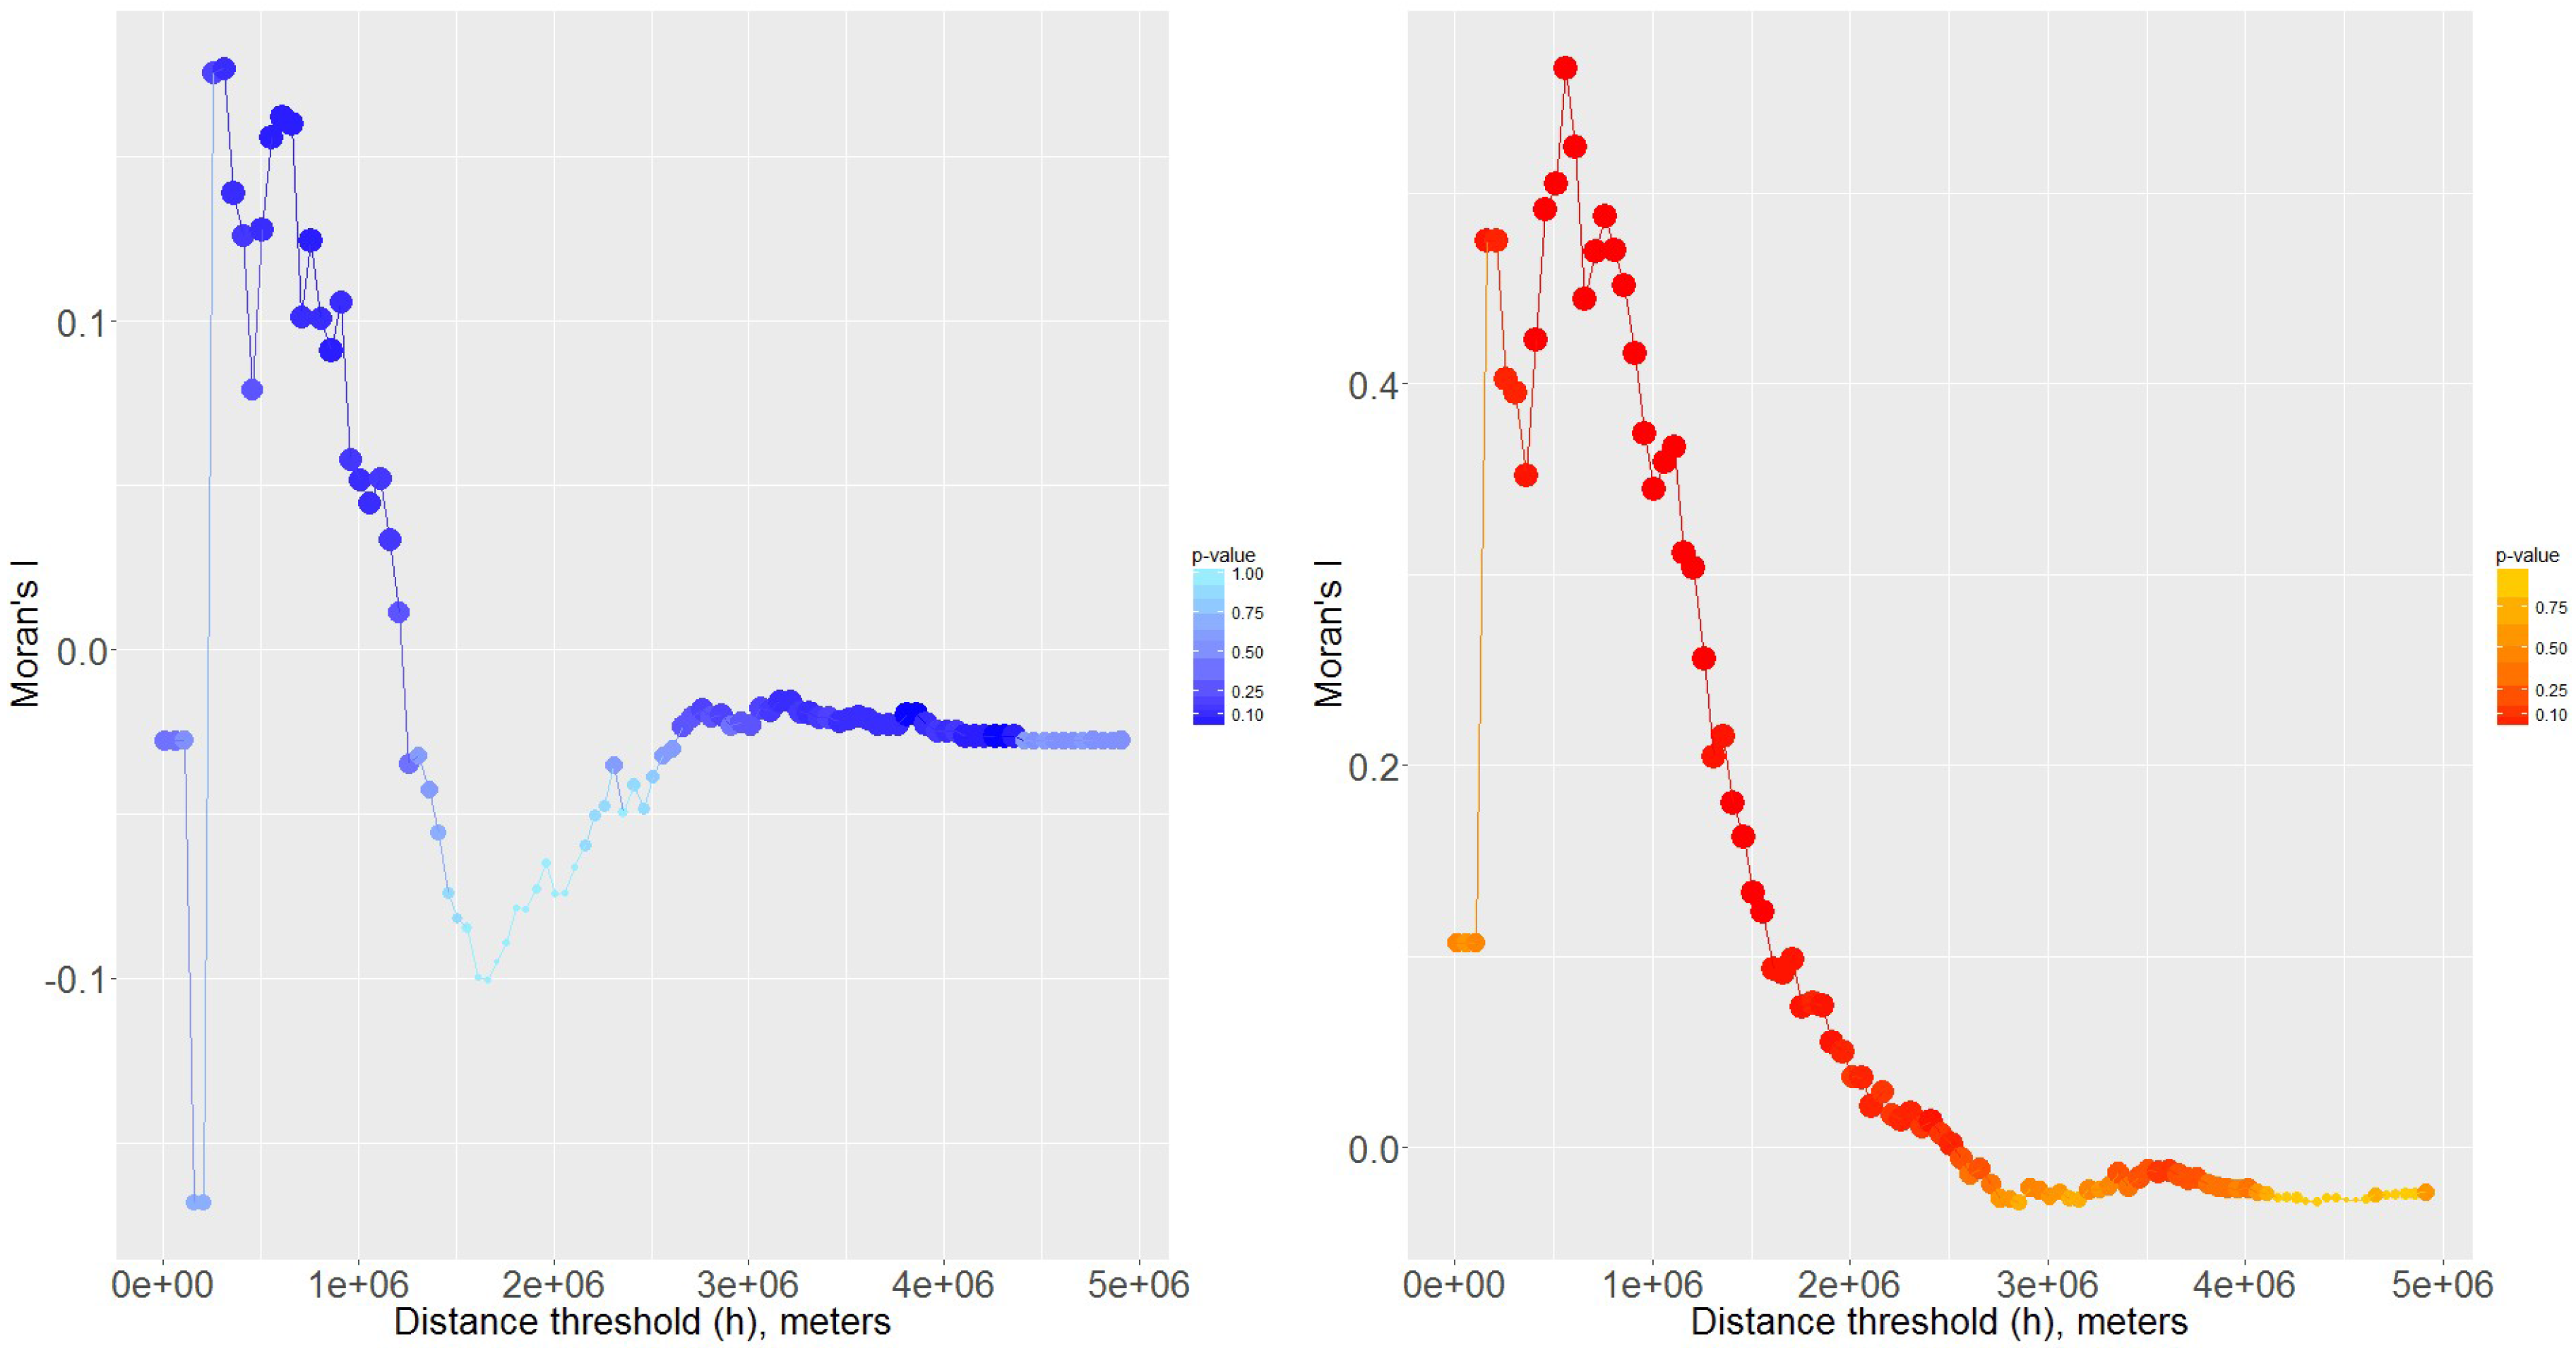
2.3. Spatial Analysis
2.4. Statistical Analysis
3. Results
3.1. Study Characteristics and Quality
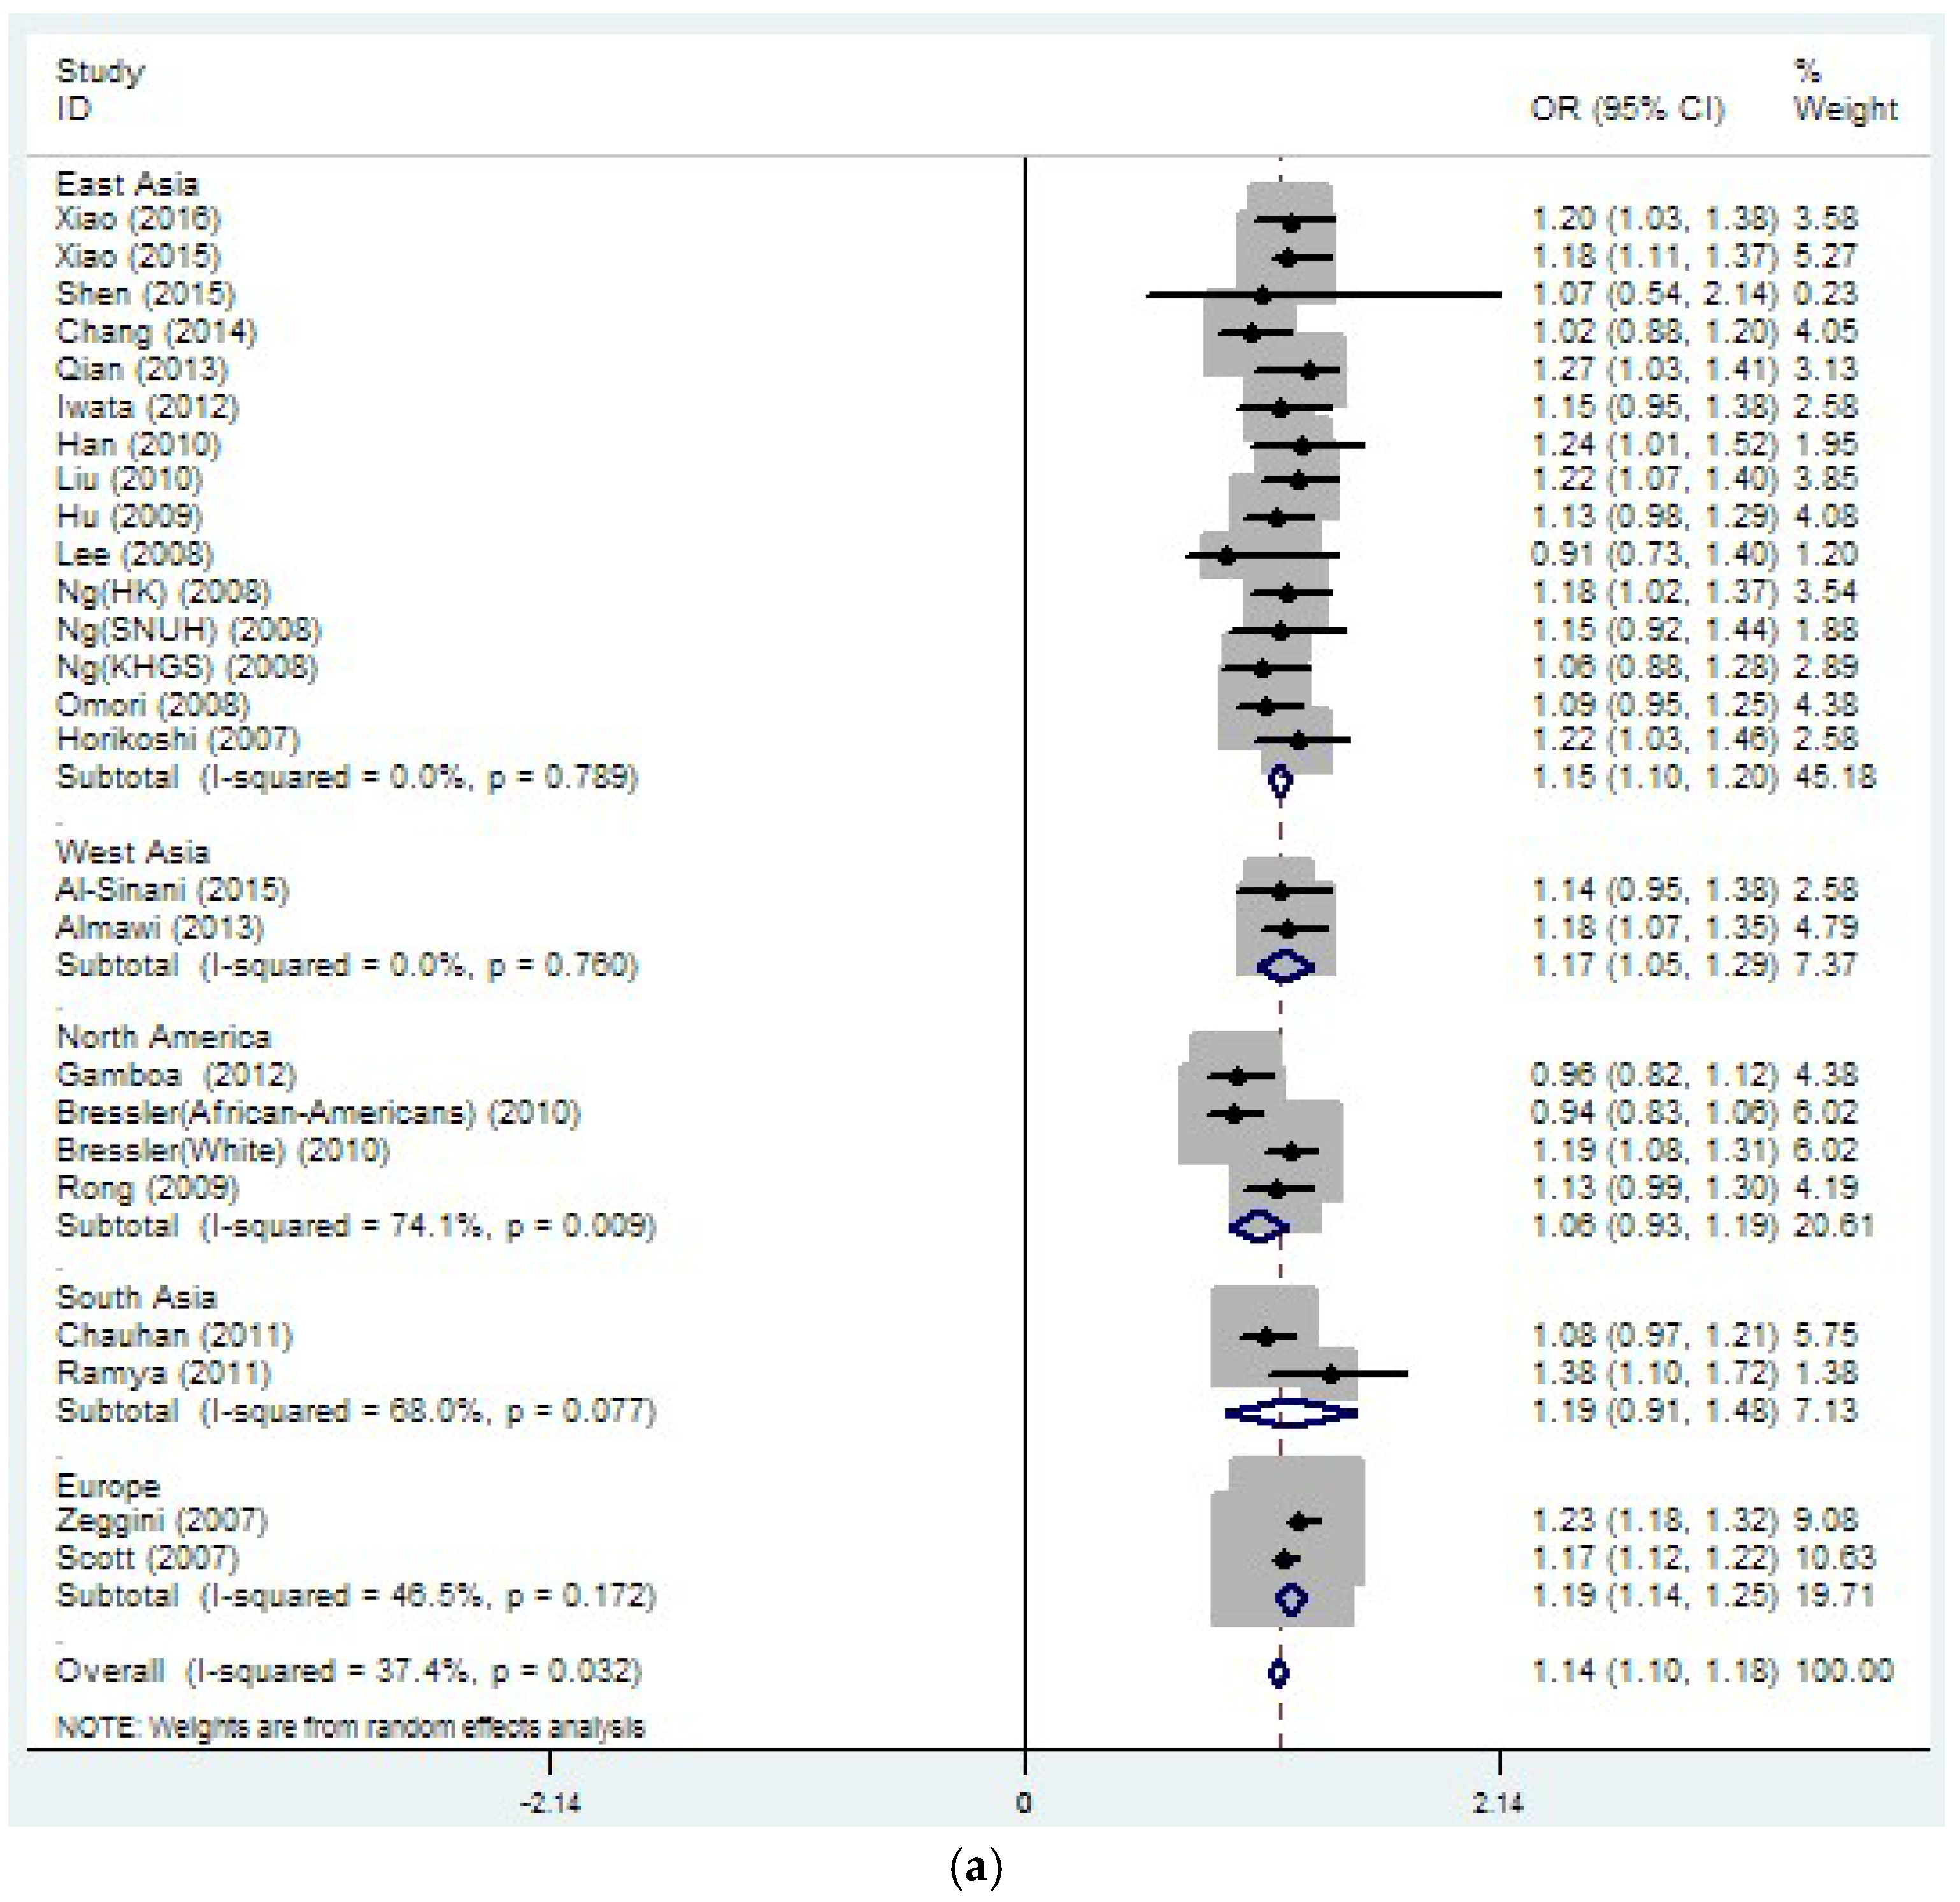
3.2. Region-Related Associations Exist between rs8050136, rs9939609 and T2DM
3.3. Sensitivity Analyses
3.4. Assessment of Publication Bias
4. Discussion
5. Conclusions
Supplementary Material
Acknowledgments
Author Contributions
Conflicts of Interest
References
- Kleinberger, J.W.; Pollin, T.I. Personalized medicine in diabetes mellitus: Current opportunities and future prospects. Ann. N. Y. Acad. Sci. 2015, 1346, 45–56. [Google Scholar] [CrossRef] [PubMed]
- Omori, S.; Tanaka, Y.; Takahashi, A.; Hirose, H.; Kashiwagi, A.; Kaku, K.; Kawamori, R.; Nakamura, Y.; Maeda, S. Association of CDKAL1, IGF2BP2, CDKN2A/B, HHEX, SLC30A8, and KCNJ11 with susceptibility to type 2 diabetes in a Japanese population. Diabetes 2008, 57, 791–795. [Google Scholar] [CrossRef] [PubMed]
- American Diabetes Association. Classification and diagnosis of diabetes. Sec. 2. In standards of medical care in diabetes—2015. Diabetes Care 2015, 38 (Suppl. S1), S8–S16. [Google Scholar]
- O’Rahilly, S.; Barroso, I.; Wareham, N.J. Genetic factors in type 2 diabetes: The end of the beginning? Science 2005, 307, 370–373. [Google Scholar] [CrossRef] [PubMed]
- Dina, C.; Meyre, D.; Gallina, S.; Durand, E.; Korner, A.; Jacobson, P.; Carlsson, L.M.; Kiess, W.; Vatin, V.; Lecoeur, C.; et al. Variation in FTO contributes to childhood obesity and severe adult obesity. Nat. Genet. 2007, 39, 724–726. [Google Scholar] [CrossRef] [PubMed]
- Frayling, T.M.; Timpson, N.J.; Weedon, M.N.; Zeggini, E.; Freathy, R.M.; Lindgren, C.M.; Perry, J.R.; Elliott, K.S.; Lango, H.; Rayner, N.W.; et al. A common variant in the FTO gene is associated with body mass index and predisposes to childhood and adult obesity. Science 2007, 316, 889–894. [Google Scholar] [CrossRef] [PubMed]
- Phani, N.M.; Vohra, M.; Rajesh, S.; Adhikari, P.; Nagri, S.K.; D’Souza, S.C.; Satyamoorthy, K.; Rai, P.S. Implications of critical PPARγ2, ADIPOQ and FTO gene polymorphisms in type 2 diabetes and obesity-mediated susceptibility to type 2 diabetes in an Indian population. Mol. Genet. Genomics 2016, 291, 193–204. [Google Scholar] [CrossRef] [PubMed]
- Xiao, S.; Zeng, X.; Quan, L.; Zhu, J. Correlation between polymorphism of FTO gene and type 2 diabetes mellitus in Uygur people from Northwest China. Int. J. Clin. Exp. Med. 2015, 8, 9744–9750. [Google Scholar] [PubMed]
- Shen, F.; Huang, W.; Huang, J.T.; Xiong, J.; Yang, Y.; Wu, K.; Jia, G.F.; Chen, J.; Feng, Y.Q.; Yuan, B.F.; et al. Decreased N6-methyladenosine in peripheral blood rna from diabetic patients is associated with FTO expression rather than ALKBH5. J. Clin. Endocrinol. Metab. 2015, 100, E148–E154. [Google Scholar] [CrossRef] [PubMed]
- Bazzi, M.D.; Nasr, F.A.; Alanazi, M.S.; Alamri, A.; Turjoman, A.A.; Moustafa, A.S.; Alfadda, A.A.; Pathan, A.A.; Parine, N.R. Association between FTO, MC4R, SLC30A8, and KCNQ1 gene variants and type 2 diabetes in Saudi population. Genet. Mol. Res. 2014, 13, 10194–10203. [Google Scholar] [CrossRef] [PubMed]
- Li, H.; Kilpelainen, T.O.; Liu, C.; Zhu, J.; Liu, Y.; Hu, C.; Yang, Z.; Zhang, W.; Bao, W.; Cha, S.; et al. Association of genetic variation in FTO with risk of obesity and type 2 diabetes with data from 96,551 East and South Asians. Diabetologia 2012, 55, 981–995. [Google Scholar] [CrossRef] [PubMed] [Green Version]
- Hertel, J.K.; Johansson, S.; Sonestedt, E.; Jonsson, A.; Lie, R.T.; Platou, C.G.; Nilsson, P.M.; Rukh, G.; Midthjell, K.; Hveem, K.; et al. FTO, type 2 diabetes, and weight gain throughout adult life: A meta-analysis of 41,504 subjects from the Scandinavian HUNT, MDC, and MPP studies. Diabetes 2011, 60, 1637–1644. [Google Scholar] [CrossRef] [PubMed]
- Xi, B.; Takeuchi, F.; Meirhaeghe, A.; Kato, N.; Chambers, J.C.; Morris, A.P.; Cho, Y.S.; Zhang, W.; Mohlke, K.L.; Kooner, J.S.; et al. Associations of genetic variants in/near body mass index-associated genes with type 2 diabetes: A systematic meta-analysis. Clin. Endocrinol. 2014, 81, 702–710. [Google Scholar] [CrossRef] [PubMed]
- Vasan, S.K.; Karpe, F.; Gu, H.F.; Brismar, K.; Fall, C.H.; Ingelsson, E.; Fall, T. FTO genetic variants and risk of obesity and type 2 diabetes: A meta-analysis of 28,394 Indians. Obesity 2014, 22, 964–970. [Google Scholar] [CrossRef] [PubMed]
- Hipp, J.A.; Chalise, N. Spatial analysis and correlates of county-level diabetes prevalence, 2009–2010. Prev. Chronic Dis. 2015, 12, E08. [Google Scholar] [CrossRef] [PubMed]
- Moran, P.A.P. The interpretation of statistical maps. J. R. Stat. Soc. 1947, 10, 243–251. [Google Scholar]
- Moran, P.A. A test for the serial independence of residuals. Biometrika 1950, 37, 178–181. [Google Scholar] [CrossRef] [PubMed]
- DerSimonian, R.; Laird, N. Meta-analysis in clinical trials. Control. Clin. Trials 1986, 7, 177–188. [Google Scholar] [CrossRef]
- Mantel, N.; Haenszel, W. Statistical aspects of the analysis of data from retrospective studies of disease. J. Natl. Cancer Inst. 1959, 22, 719–748. [Google Scholar] [PubMed]
- Begg, C.B.; Mazumdar, M. Operating characteristics of a rank correlation test for publication bias. Biometrics 1994, 50, 1088–1101. [Google Scholar] [CrossRef] [PubMed]
- Egger, M.; Davey Smith, G.; Schneider, M.; Minder, C. Bias in meta-analysis detected by a simple, graphical test. BMJ 1997, 315, 629–634. [Google Scholar] [CrossRef] [PubMed]
- Xiao, S.; Zeng, X.; Fan, Y.; Su, Y.; Ma, Q.; Zhu, J.; Yao, H. Gene polymorphism association with type 2 diabetes and related gene-gene and gene-environment interactions in a Uyghur population. Med. Sci. Monit. 2016, 22, 474–487. [Google Scholar] [PubMed]
- Al-Sinani, S.; Woodhouse, N.; Al-Mamari, A.; Al-Shafie, O.; Al-Shafaee, M.; Al-Yahyaee, S.; Hassan, M.; Jaju, D.; Al-Hashmi, K.; Al-Abri, M.; et al. Association of gene variants with susceptibility to type 2 diabetes among Omanis. World J. Diabetes 2015, 6, 358–366. [Google Scholar] [CrossRef] [PubMed]
- Fawwad, A.; Siddiqui, I.A.; Zeeshan, N.F.; Shahid, S.M.; Basit, A. Association of snp rs9939609 in FTO gene with metabolic syndrome in type 2 diabetic subjects, rectruited from a tertiary care unit of Karachi, Pakistan. Pak. J. Med. Sci. 2015, 31, 140–145. [Google Scholar] [PubMed]
- Raza, S.T.; Abbas, S.; Ahmad, A.; Ahmed, F.; Zaidi, Z.H.; Mahdi, F. Association of glutathione-s-transferase (GSTM1 and GSTT1) and FTO gene polymorphisms with type 2 diabetes mellitus cases in Northern India. Balk. J. Med. Genet. 2014, 17, 47–54. [Google Scholar]
- Kalnina, I.; Zaharenko, L.; Vaivade, I.; Rovite, V.; Nikitina-Zake, L.; Peculis, R.; Fridmanis, D.; Geldnere, K.; Jacobsson, J.A.; Almen, M.S.; et al. Polymorphisms in FTO and near TMEM18 associate with type 2 diabetes and predispose to younger age at diagnosis of diabetes. Gene 2013, 527, 462–468. [Google Scholar] [CrossRef] [PubMed]
- Ali, S.; Chopra, R.; Manvati, S.; Singh, Y.P.; Kaul, N.; Behura, A.; Mahajan, A.; Sehajpal, P.; Gupta, S.; Dhar, M.K.; et al. Replication of type 2 diabetes candidate genes variations in three geographically unrelated Indian population groups. PLoS ONE 2013, 8, e58881. [Google Scholar] [CrossRef] [PubMed]
- Binh, T.Q.; Phuong, P.T.; Nhung, B.T.; Thoang, D.D.; Lien, H.T.; Thanh, D.V. Association of the common FTO-rs9939609 polymorphism with type 2 diabetes, independent of obesity-related traits in a Vietnamese population. Gene 2013, 513, 31–35. [Google Scholar] [CrossRef] [PubMed]
- Iwata, M.; Maeda, S.; Kamura, Y.; Takano, A.; Kato, H.; Murakami, S.; Higuchi, K.; Takahashi, A.; Fujita, H.; Hara, K.; et al. Genetic risk score constructed using 14 susceptibility alleles for type 2 diabetes is associated with the early onset of diabetes and may predict the future requirement of insulin injections among Japanese individuals. Diabetes Care 2012, 35, 1763–1770. [Google Scholar] [CrossRef] [PubMed]
- Rees, S.D.; Islam, M.; Hydrie, M.Z.I.; Chaudhary, B.; Bellary, S.; Hashmi, S.; O’Hare, J.P.; Kumar, S.; Sanghera, D.K.; Chaturvedi, N.; et al. An FTO variant is associated with type 2 diabetes in South Asian populations after accounting for body mass index and waist circumference. Diabet. Med. 2011, 28, 673–680. [Google Scholar] [CrossRef] [PubMed]
- Huang, W.; Sun, Y.; Sun, J. Combined effects of FTO rs9939609 and MC4R rs17782313 on obesity and BMI in Chinese Han populations. Endocrine 2011, 39, 69–74. [Google Scholar] [CrossRef] [PubMed]
- Chauhan, G.; Tabassum, R.; Mahajan, A.; Dwivedi, O.P.; Mahendran, Y.; Kaur, I.; Nigam, S.; Dubey, H.; Varma, B.; Madhu, S.V.; et al. Common variants of FTO and the risk of obesity and type 2 diabetes in Indians. J. Hum. Genet. 2011, 56, 720–726. [Google Scholar] [CrossRef] [PubMed]
- Cruz, M.; Valladares-Salgado, A.; Garcia-Mena, J.; Ross, K.; Edwards, M.; Angeles-Martinez, J.; Ortega-Camarillo, C.; de la Pena, J.E.; Burguete-Garcia, A.I.; Wacher-Rodarte, N.; et al. Candidate gene association study conditioning on individual ancestry in patients with type 2 diabetes and metabolic syndrome from Mexico City. Diabetes Metab. Res. Rev. 2010, 26, 261–270. [Google Scholar] [CrossRef] [PubMed]
- Bressler, J.; Kao, W.H.; Pankow, J.S.; Boerwinkle, E. Risk of type 2 diabetes and obesity is differentially associated with variation in FTO in Whites and African-Americans in the ARIC study. PLoS ONE 2010, 5, e10521. [Google Scholar] [CrossRef] [PubMed]
- Liu, Y.; Liu, Z.; Song, Y.; Zhou, D.; Zhang, D.; Zhao, T.; Chen, Z.; Yu, L.; Yang, Y.; Feng, G.; et al. Meta-analysis added power to identify variants in FTO associated with type 2 diabetes and obesity in the Asian population. Obesity 2010, 18, 1619–1624. [Google Scholar] [CrossRef] [PubMed]
- Yajnik, C.S.; Janipalli, C.S.; Bhaskar, S.; Kulkarni, S.R.; Freathy, R.M.; Prakash, S.; Mani, K.R.; Weedon, M.N.; Kale, S.D.; Deshpande, J.; et al. FTO gene variants are strongly associated with type 2 diabetes in South Asian Indians. Diabetologia 2009, 52, 247–252. [Google Scholar] [CrossRef] [PubMed]
- Legry, V.; Cottel, D.; Ferrieres, J.; Arveiler, D.; Andrieux, N.; Bingham, A.; Wagner, A.; Ruidavets, J.B.; Ducimetiere, P.; Amouyel, P.; et al. Effect of an FTO polymorphism on fat mass, obesity, and type 2 diabetes mellitus in the French MONICA study. Metabolism 2009, 58, 971–975. [Google Scholar] [CrossRef] [PubMed]
- Sanghera, D.K.; Ortega, L.; Han, S.; Singh, J.; Ralhan, S.K.; Wander, G.S.; Mehra, N.K.; Mulvihill, J.J.; Ferrell, R.E.; Nath, S.K.; et al. Impact of nine common type 2 diabetes risk polymorphisms in Asian Indian Sikhs: PPARG2 (Pro12Ala), IGF2BP2, TCF7L2 and FTO variants confer a significant risk. BMC Med. Genet. 2008, 9, 59. [Google Scholar] [CrossRef] [PubMed]
- Horikawa, Y.; Miyake, K.; Yasuda, K.; Enya, M.; Hirota, Y.; Yamagata, K.; Hinokio, Y.; Oka, Y.; Iwasaki, N.; Iwamoto, Y.; et al. Replication of genome-wide association studies of type 2 diabetes susceptibility in Japan. J. Clin. Endocrinol. Metab. 2008, 93, 3136–3141. [Google Scholar] [CrossRef] [PubMed]
- Chang, Y.C.; Liu, P.H.; Lee, W.J.; Chang, T.J.; Jiang, Y.D.; Li, H.Y.; Kuo, S.S.; Lee, K.C.; Chuang, L.M. Common variation in the fat mass and obesity-associated (FTO) gene confers risk of obesity and modulates BMI in the Chinese population. Diabetes 2008, 57, 2245–2252. [Google Scholar] [CrossRef] [PubMed]
- Horikoshi, M.; Hara, K.; Ito, C.; Shojima, N.; Nagai, R.; Ueki, K.; Froguel, P.; Kadowaki, T. Variations in the HHEX gene are associated with increased risk of type 2 diabetes in the Japanese population. Diabetologia 2007, 50, 2461–2466. [Google Scholar] [CrossRef] [PubMed]
- Zeggini, E.; Weedon, M.N.; Lindgren, C.M.; Frayling, T.M.; Elliott, K.S.; Lango, H.; Timpson, N.J.; Perry, J.R.; Rayner, N.W.; Freathy, R.M.; et al. Replication of genome-wide association signals in UK samples reveals risk loci for type 2 diabetes. Science 2007, 316, 1336–1341. [Google Scholar] [CrossRef] [PubMed]
- Chang, Y.C.; Liu, P.H.; Yu, Y.H.; Kuo, S.S.; Chang, T.J.; Jiang, Y.D.; Nong, J.Y.; Hwang, J.J.; Chuang, L.M. Validation of type 2 diabetes risk variants identified by genome-wide association studies in Han Chinese population: A replication study and meta-analysis. PLoS ONE 2014, 9, e95045. [Google Scholar] [CrossRef] [PubMed]
- Almawi, W.Y.; Nemr, R.; Keleshian, S.H.; Echtay, A.; Saldanha, F.L.; AlDoseri, F.A.; Racoubian, E. A replication study of 19 GWAS-validated type 2 diabetes at-risk variants in the Lebanese population. Diabetes Res. Clin. Pract. 2013, 102, 117–122. [Google Scholar] [CrossRef] [PubMed]
- Qian, Y.; Liu, S.J.; Lu, F.; Li, H.Z.; Dong, M.H.; Lin, Y.D.; Du, J.B.; Lin, Y.; Gong, J.H.; Jin, G.F.; et al. Genetic variant in fat mass and obesity-associated gene associated with type 2 diabetes risk in Han Chinese. BMC Genet. 2013, 14, 86. [Google Scholar] [CrossRef] [PubMed]
- Gamboa-Melendez, M.A.; Huerta-Chagoya, A.; Moreno-Macias, H.; Vazquez-Cardenas, P.; Ordonez-Sanchez, M.L.; Rodriguez-Guillen, R.; Riba, L.; Rodriguez-Torres, M.; Guerra-Garcia, M.T.; Guillen-Pineda, L.E.; et al. Contribution of common genetic variation to the risk of type 2 diabetes in the Mexican Mestizo population. Diabetes 2012, 61, 3314–3321. [Google Scholar] [CrossRef] [PubMed]
- Ramya, K.; Radha, V.; Ghosh, S.; Majumder, P.P.; Mohan, V. Genetic variations in the FTO gene are associated with type 2 diabetes and obesity in South Indians (cures-79). Diabetes Technol. Ther. 2011, 13, 33–42. [Google Scholar] [CrossRef] [PubMed]
- Han, X.; Luo, Y.; Ren, Q.; Zhang, X.; Wang, F.; Sun, X.; Zhou, X.; Ji, L. Implication of genetic variants near SLC30A8, HHEX, CDKAL1, CDKN2A/B, IGF2BP2, FTO, TCF2, KCNQ1, and WFS1 in type 2 diabetes in a Chinese population. BMC Med. Genet. 2010, 11, 81. [Google Scholar] [CrossRef] [PubMed]
- Wen, J.; Ronn, T.; Olsson, A.; Yang, Z.; Lu, B.; Du, Y.; Groop, L.; Ling, C.; Hu, R. Investigation of type 2 diabetes risk alleles support CDKN2A/B, CDKAL1, and TCF7L2 as susceptibility genes in a Han Chinese cohort. PLoS ONE 2010, 5, e9153. [Google Scholar] [CrossRef] [PubMed]
- Hu, C.; Zhang, R.; Wang, C.; Wang, J.; Ma, X.; Lu, J.; Qin, W.; Hou, X.; Wang, C.; Bao, Y.; et al. PPARG, KCNJ11, CDKAL1, CDKN2A-CDKN2B, IDE-KIF11-HHEX, IGF2BP2 and SLC30A8 are associated with type 2 diabetes in a Chinese population. PLoS ONE 2009, 4, e7643. [Google Scholar] [CrossRef] [PubMed]
- Rong, R.; Hanson, R.L.; Ortiz, D.; Wiedrich, C.; Kobes, S.; Knowler, W.C.; Bogardus, C.; Baier, L.J. Association analysis of variation in/near FTO, CDKAL1, SLC30A8, HHEX, EXT2, IGF2BP2, LOC387761, and CDKN2B with type 2 diabetes and related quantitative traits in Pima Indians. Diabetes 2009, 58, 478–488. [Google Scholar] [CrossRef] [PubMed]
- Lee, Y.H.; Kang, E.S.; Kim, S.H.; Han, S.J.; Kim, C.H.; Kim, H.J.; Ahn, C.W.; Cha, B.S.; Nam, M.; Nam, C.M.; et al. Association between polymorphisms in SLC30A8, HHEX, CDKN2A/B, IGF2BP2, FTO, WFS1, CDKAL1, KCNQ1 and type 2 diabetes in the Korean population. J. Hum. Genet. 2008, 53, 991–998. [Google Scholar] [CrossRef] [PubMed]
- Ng, M.C.Y.; Park, K.S.; Oh, B.; Tam, C.H.T.; Cho, Y.M.; Shin, H.D.; Lam, V.K.L.; Ma, R.C.W.; So, W.Y.; Cho, Y.S.; et al. Implication of genetic variants near TCF7L2, SLC30A8, HHEX, CDKAL1, CDKN2A/B, IGF2BP2, and FTO in type 2 diabetes and obesity in 6719 Asians. Diabetes 2008, 57, 2226–2233. [Google Scholar] [CrossRef] [PubMed]
- Scott, L.J.; Mohlke, K.L.; Bonnycastle, L.L.; Willer, C.J.; Li, Y.; Duren, W.L.; Erdos, M.R.; Stringham, H.M.; Chines, P.S.; Jackson, A.U.; et al. A genome-wide association study of type 2 diabetes in Finns detects multiple susceptibility variants. Science 2007, 316, 1341–1345. [Google Scholar] [CrossRef] [PubMed]
- Cauchi, S.; Ezzidi, I.; El Achhab, Y.; Mtiraoui, N.; Chaieb, L.; Salah, D.; Nejjari, C.; Labrune, Y.; Yengo, L.; Beury, D.; et al. European genetic variants associated with type 2 diabetes in North African Arabs. Diabetes Metab. 2012, 38, 316–323. [Google Scholar] [CrossRef] [PubMed]
- Tobler, A.W.R. A computer movie simulation urban growth in Detroit region. Econ. Geogr. 1970, 46, 234–240. [Google Scholar]
- Anselin, L. Local indicators of spatial association LISA. Geogr. Anal. 1995, 27, 93–115. [Google Scholar] [CrossRef]
- Merkestein, M.; Laber, S.; McMurray, F.; Andrew, D.; Sachse, G.; Sanderson, J.; Li, M.; Usher, S.; Sellayah, D.; Ashcroft, F.M.; et al. FTO influences adipogenesis by regulating mitotic clonal expansion. Nat. Commun. 2015, 6, 6792. [Google Scholar] [CrossRef] [PubMed]
- Smemo, S.; Tena, J.J.; Kim, K.H.; Gamazon, E.R.; Sakabe, N.J.; Gomez-Marin, C.; Aneas, I.; Credidio, F.L.; Sobreira, D.R.; Wasserman, N.F.; et al. Obesity-associated variants within FTO form long-range functional connections with IRX3. Nature 2014, 507, 371–375. [Google Scholar] [CrossRef] [PubMed]
- Bravard, A.; Vial, G.; Chauvin, M.A.; Rouille, Y.; Bailleul, B.; Vidal, H.; Rieusset, J. FTO contributes to hepatic metabolism regulation through regulation of leptin action and SAT3 signalling in liver. Cell Commun. Signal. 2014, 12, 4. [Google Scholar] [CrossRef] [PubMed]
- Guo, F.; Zhang, Y.; Zhang, C.; Wang, S.; Ni, Y.; Zhao, R. Fatmass and obesity associated (FTO) gene regulates gluconeogenesis in chicken embryo fibroblast cells. Comp. Biochem. Physiol. A Mol. Integr. Physiol. 2015, 179, 149–156. [Google Scholar] [CrossRef] [PubMed]
- Mizuno, T.M.; Lew, P.S.; Luo, Y.; Leckstrom, A. Negative regulation of hepatic fat mass and obesity associated (Fto) gene expression by insulin. Life Sci. 2017, 170, 50–55. [Google Scholar] [CrossRef] [PubMed]
- Speakman, J.R. FTO effect on energy demand versus food intake. Nature 2010, 464, E1. [Google Scholar] [CrossRef] [PubMed]
- Cai, X.; Liu, C.; Mou, S. Association between fat mass- and obesity-associated (FTO) gene polymorphism and polycystic ovary syndrome: A meta-analysis. PLoS ONE 2014, 9, e86972. [Google Scholar] [CrossRef] [PubMed]
- Li, G.; Chen, Q.; Wang, L.; Ke, D.; Yuan, Z. Association between FTO gene polymorphism and cancer risk: Evidence from 16,277 cases and 31,153 controls. Tumour. Biol. 2012, 33, 1237–1243. [Google Scholar] [CrossRef] [PubMed]


| First Author | Year | Region | Sample Size | Risk Allele Frequency | HWE | Ref. | ||
|---|---|---|---|---|---|---|---|---|
| T2DM | Control | T2DM | Control | |||||
| rs9939609 | ||||||||
| Phani | 2016 | South Asia | 518 | 518 | 0.54 | 0.59 | NA | [7] |
| Xiao | 2016 | East Asia | 879 | 895 | 0.341 | 0.295 | yes | [22] |
| Xiao | 2015 | East Asia | 849 | 873 | 0.336 | 0.292 | yes | [8] |
| Shen | 2015 | East Asia | 81 | 80 | 0.125 | 0.106 | yes | [9] |
| Al-Sinani | 2015 | West Asia | 992 | 294 | 0.48 | 0.435 | yes | [23] |
| Fawwad | 2015 | South Asia | 296 | 198 | 0.588 | 0.391 | yes | [24] |
| Raza | 2014 | South Asia | 101 | 97 | 0.406 | 0.376 | NA | [25] |
| Bazzi | 2014 | South Asia | 81 | 95 | 0.525 | 0.542 | yes | [10] |
| Kalnina | 2013 | Europe | 974 | 1075 | 0.501 | 0.438 | yes | [26] |
| Ali | 2013 | South Asia | 1583 | 1317 | 0.362 | 0.304 | yes | [27] |
| Binh | 2012 | East Asia | 98 | 251 | 0.255 | 0.181 | yes | [28] |
| Iwata | 2012 | East Asia | 722 | 758 | 0.206 | 0.182 | yes | [29] |
| Rees(COBRA) | 2011 | South Asia | 385 | 1281 | 0.336 | 0.294 | yes | [30] |
| Rees(UKADS/DGP) | 2011 | South Asia | 1568 | 1177 | 0.329 | 0.298 | yes | [30] |
| Huang | 2011 | East Asia | 591 | 1200 | 0.299 | 0.305 | yes | [31] |
| Chauhan | 2011 | South Asia | 2361 | 2755 | 0.35 | 0.34 | yes | [32] |
| Cruz | 2010 | North America | 519 | 547 | 0.252 | 0.212 | yes | [33] |
| Bressler | 2010 | North America | 655 | 2685 | 0.463 | 0.483 | yes | [34] |
| (African-American) | ||||||||
| Bressler(white) | 2010 | North America | 988 | 9915 | 0.465 | 0.443 | yes | [34] |
| Liu | 2010 | East Asia | 1774 | 1984 | 0.136 | 0.117 | yes | [35] |
| Yajnik | 2009 | South Asia | 1453 | 1361 | 0.353 | 0.3 | yes | [36] |
| Legry | 2009 | Europe | 283 | 2601 | 0.456 | 0.42 | yes | [37] |
| Sanghera | 2008 | South Asia | 513 | 353 | 0.363 | 0.31 | yes | [38] |
| Horikawa | 2008 | East Asia | 1849 | 1578 | 0.209 | 0.205 | yes | [39] |
| Chang | 2008 | East Asia | 735 | 726 | 0.132 | 0.127 | yes | [40] |
| Omori | 2008 | East Asia | 1621 | 1053 | 0.209 | 0.195 | yes | [2] |
| Horikoshi | 2007 | East Asia | 864 | 864 | 0.216 | 0.192 | yes | [41] |
| Zeggini. | 2007 | Europe | 5681 | 8284 | 0.435 | 0.394 | yes | [42] |
| Frayling | 2007 | Europe | 3757 | 5346 | NA | NA | yes | [6] |
| rs8050136 | ||||||||
| Xiao | 2016 | East Asia | 879 | 895 | 0.313 | 0.275 | yes | [22] |
| Xiao | 2015 | East Asia | 849 | 873 | 0.308 | 0.274 | yes | [8] |
| Shen | 2015 | East Asia | 88 | 80 | 0.114 | 0.106 | yes | [9] |
| Al-Sinani | 2015 | West Asia | 992 | 294 | 0.458 | 0.425 | yes | [23] |
| Chang | 2014 | East Asia | 1502 | 1518 | 0.127 | 0.124 | yes | [43] |
| Almawi | 2013 | West Asia | 995 | 1195 | 0.487 | 0.551 | yes | [44] |
| Qian | 2013 | East Asia | 2898 | 3262 | 0.127 | 0.103 | yes | [45] |
| Gamboa | 2012 | North America | 1027 | 990 | 0.194 | 0.2 | yes | [46] |
| Iwata | 2012 | East Asia | 724 | 763 | 0.205 | 0.183 | yes | [29] |
| Chauhan | 2011 | South Asia | 1106 | 1800 | 0.35 | 0.34 | yes | [32] |
| Ramya | 2011 | South Asia | 1001 | 851 | 0.14 | 0.107 | yes | [47] |
| Han | 2010 | East Asia | 1007 | 995 | 0.13 | 0.11 | yes | [48] |
| Bressler | 2010 | North America | 657 | 2728 | 0.425 | 0.44 | yes | [34] |
| (African-American) | ||||||||
| Bressler(White) | 2010 | North America | 984 | 9873 | 0.444 | 0.402 | yes | [34] |
| Wen | 2010 | East Asia | 1165 | 1136 | 0.134 | 0.119 | yes | [49] |
| Liu | 2010 | East Asia | 1748 | 2015 | 0.139 | 0.117 | yes | [35] |
| Hu | 2009 | East Asia | 1849 | 1785 | 0.13 | 0.118 | yes | [50] |
| Rong | 2009 | North America | 1472 | 1825 | 0.151 | 0.136 | yes | [51] |
| Lee | 2008 | East Asia | 886 | 501 | 0.129 | 0.14 | yes | [52] |
| Ng(HK) | 2008 | East Asia | 1481 | 1530 | 0.156 | 0.136 | yes | [53] |
| Ng(SNUH) | 2008 | East Asia | 761 | 632 | 0.138 | 0.122 | yes | [53] |
| Ng(KHGS) | 2008 | East Asia | 799 | 1516 | 0.124 | 0.118 | yes | [53] |
| Omori | 2008 | East Asia | 1616 | 1060 | 0.208 | 0.194 | yes | [2] |
| Horikoshi | 2007 | East Asia | 857 | 861 | 0.238 | 0.2 | yes | [41] |
| Zeggini | 2007 | Europe | 4207 | 4111 | 0.44 | 0.39 | yes | [42] |
| Scott | 2007 | Europe | 2339 | 2401 | 0.406 | 0.381 | yes | [54] |
| rs1421085 | ||||||||
| Cauchi(Morocco) | 2012 | North Africa | 1193 | 1095 | 0.395 | 0.356 | yes | [55] |
| Cauchi(Tunisia) | 2012 | North Africa | 1446 | 942 | 0.41 | 0.407 | yes | [55] |
| Bressler | 2010 | North America | 657 | 2725 | 0.084 | 0.112 | yes | [34] |
| (African-American) | ||||||||
| Bressler(White) | 2010 | North America | 989 | 9893 | 0.451 | 0.41 | yes | [34] |
| rs17817499 | ||||||||
| Almawi | 2013 | West Asia | 995 | 1195 | 0.517 | 0.557 | yes | [44] |
| Bressler | 2010 | North America | 653 | 2700 | 0.376 | 0.396 | yes | [34] |
| (African-American) | ||||||||
| Bressler(White) | 2010 | North America | 986 | 9948 | 0.443 | 0.403 | yes | [34] |
| SNP | No. of Study (T2DM/Control) | Without BMI Adjustment | With BMI Adjustment | ||||||
|---|---|---|---|---|---|---|---|---|---|
| OR | pz a | I2 (%) | PH b | OR | pz a | I2 (%) | PH b | ||
| (95% CI) | (95% CI) | ||||||||
| All | |||||||||
| rs9939609 | 29 | 1.15 | 0 | 53.2 | 0 | 1.11 | 0 | 56.1 | 0.003 |
| (32771/50161) | (1.11–1.19) | (1.05–1.17) | |||||||
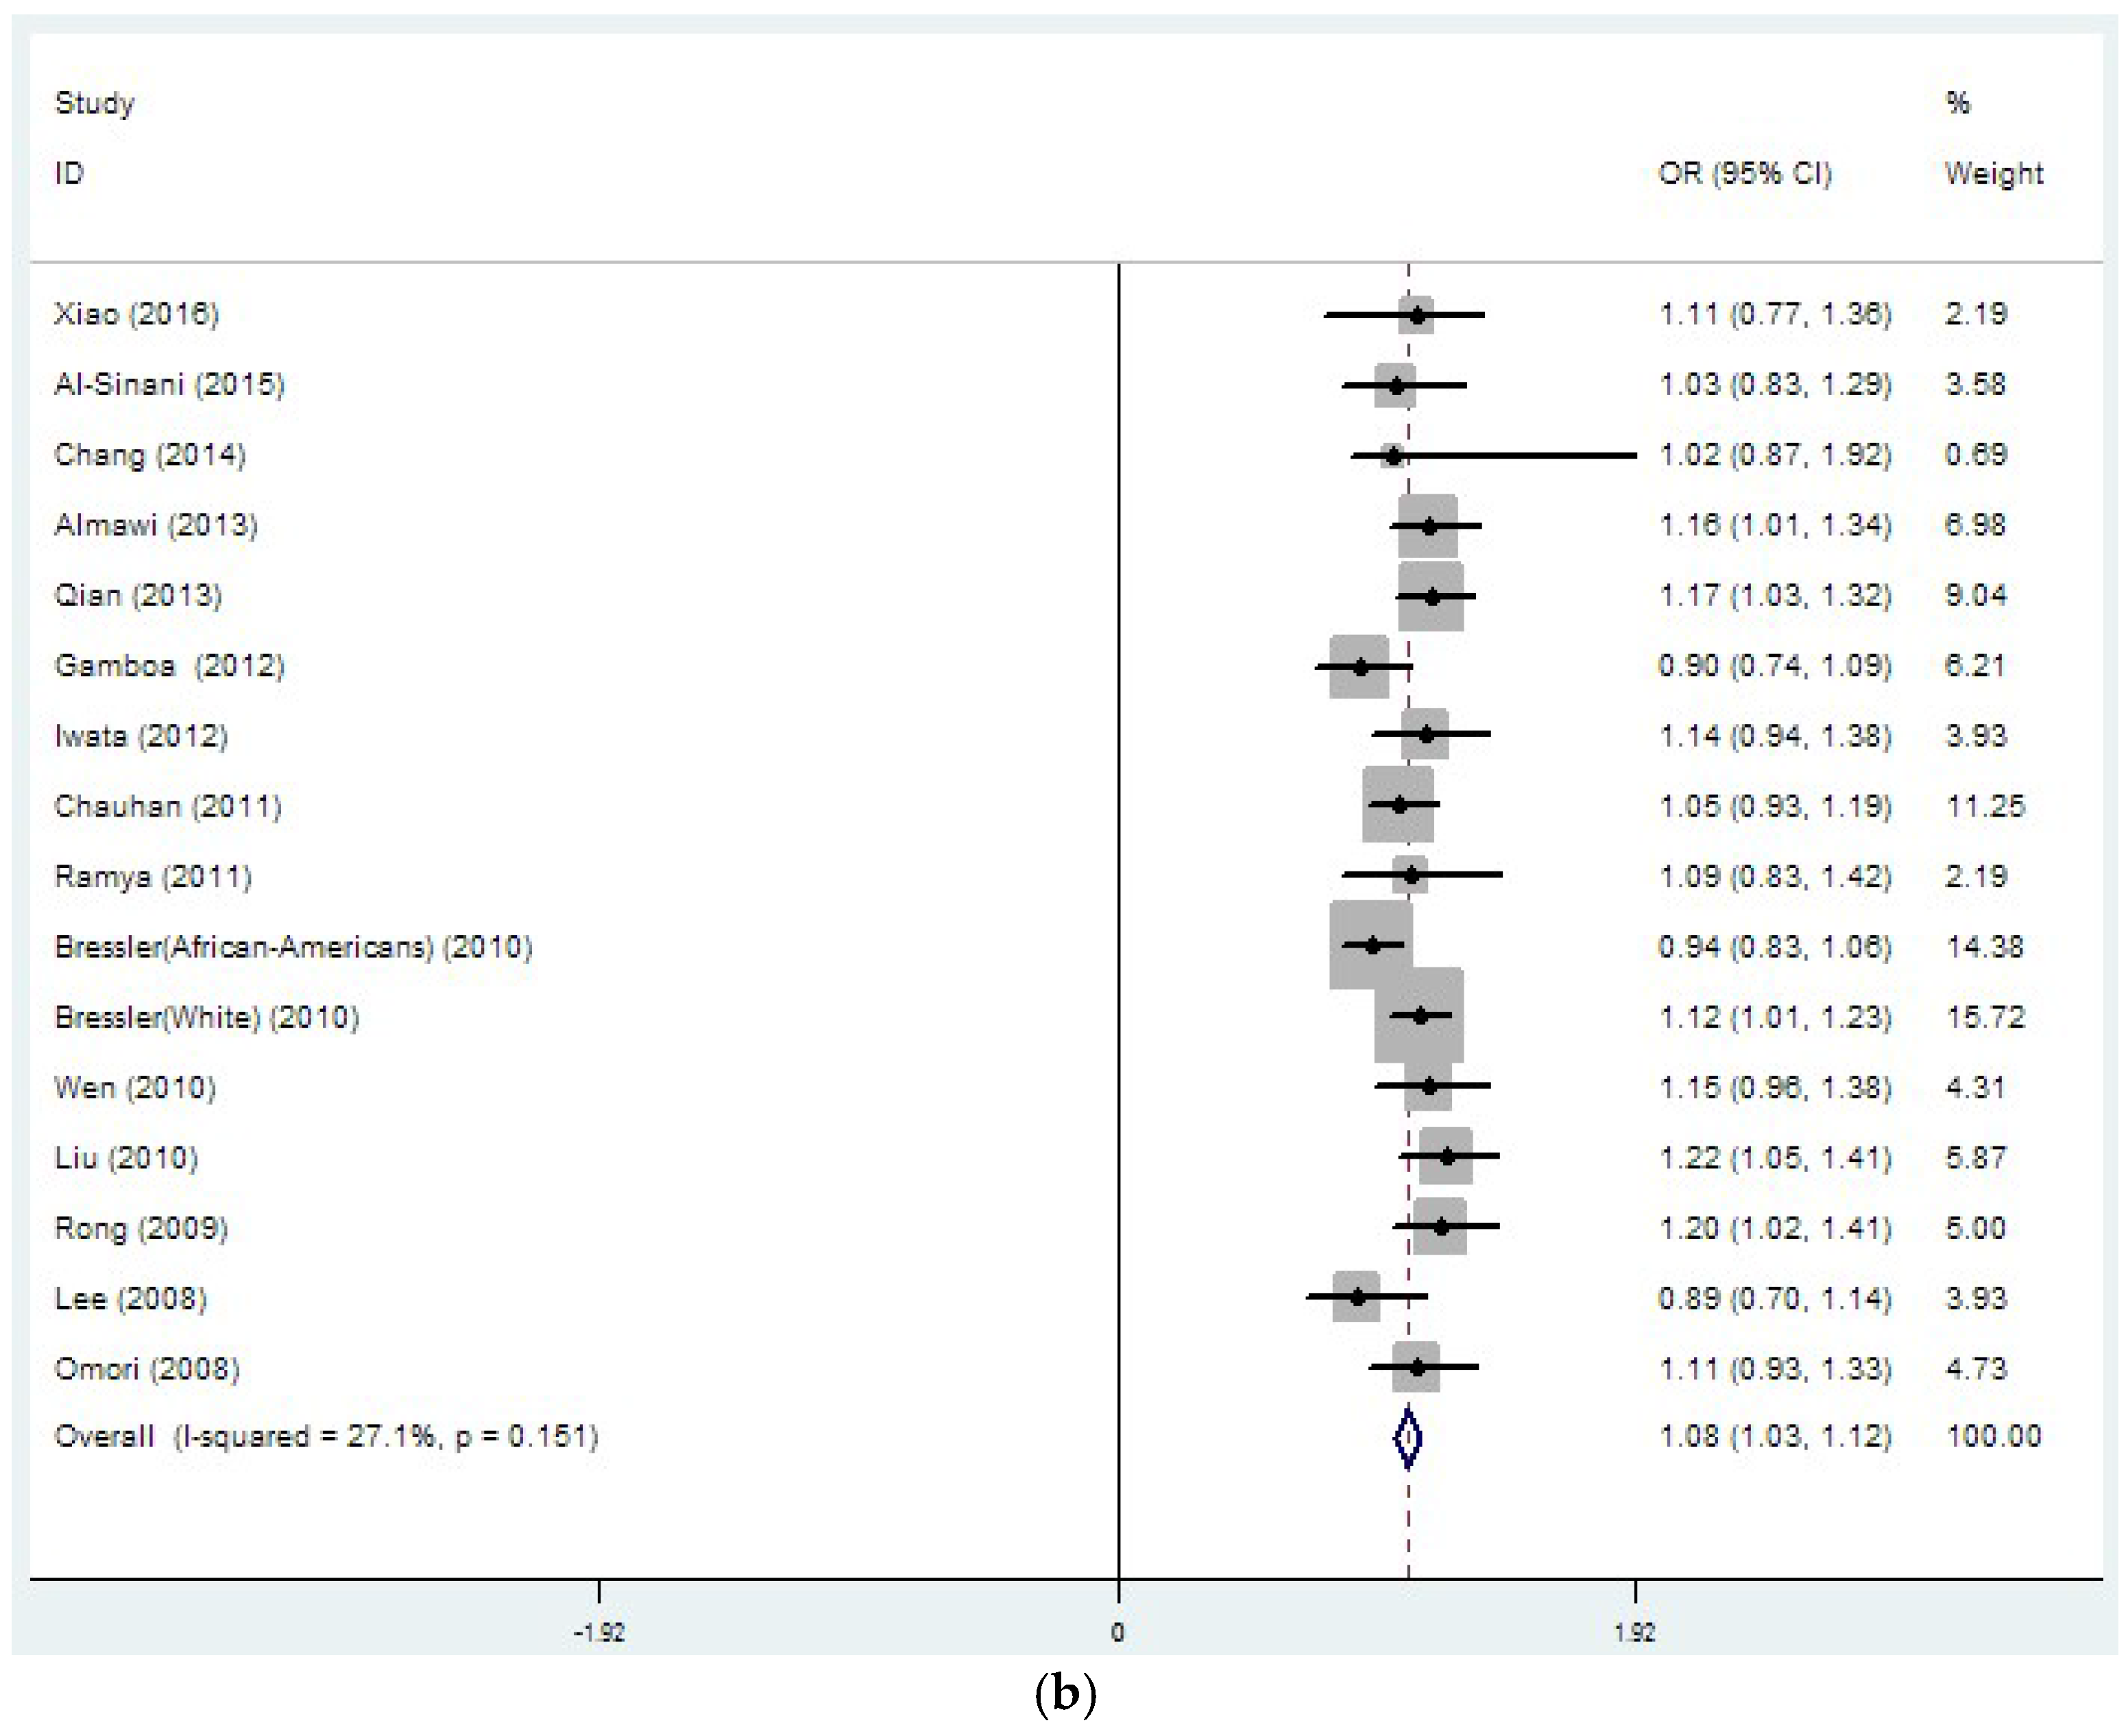
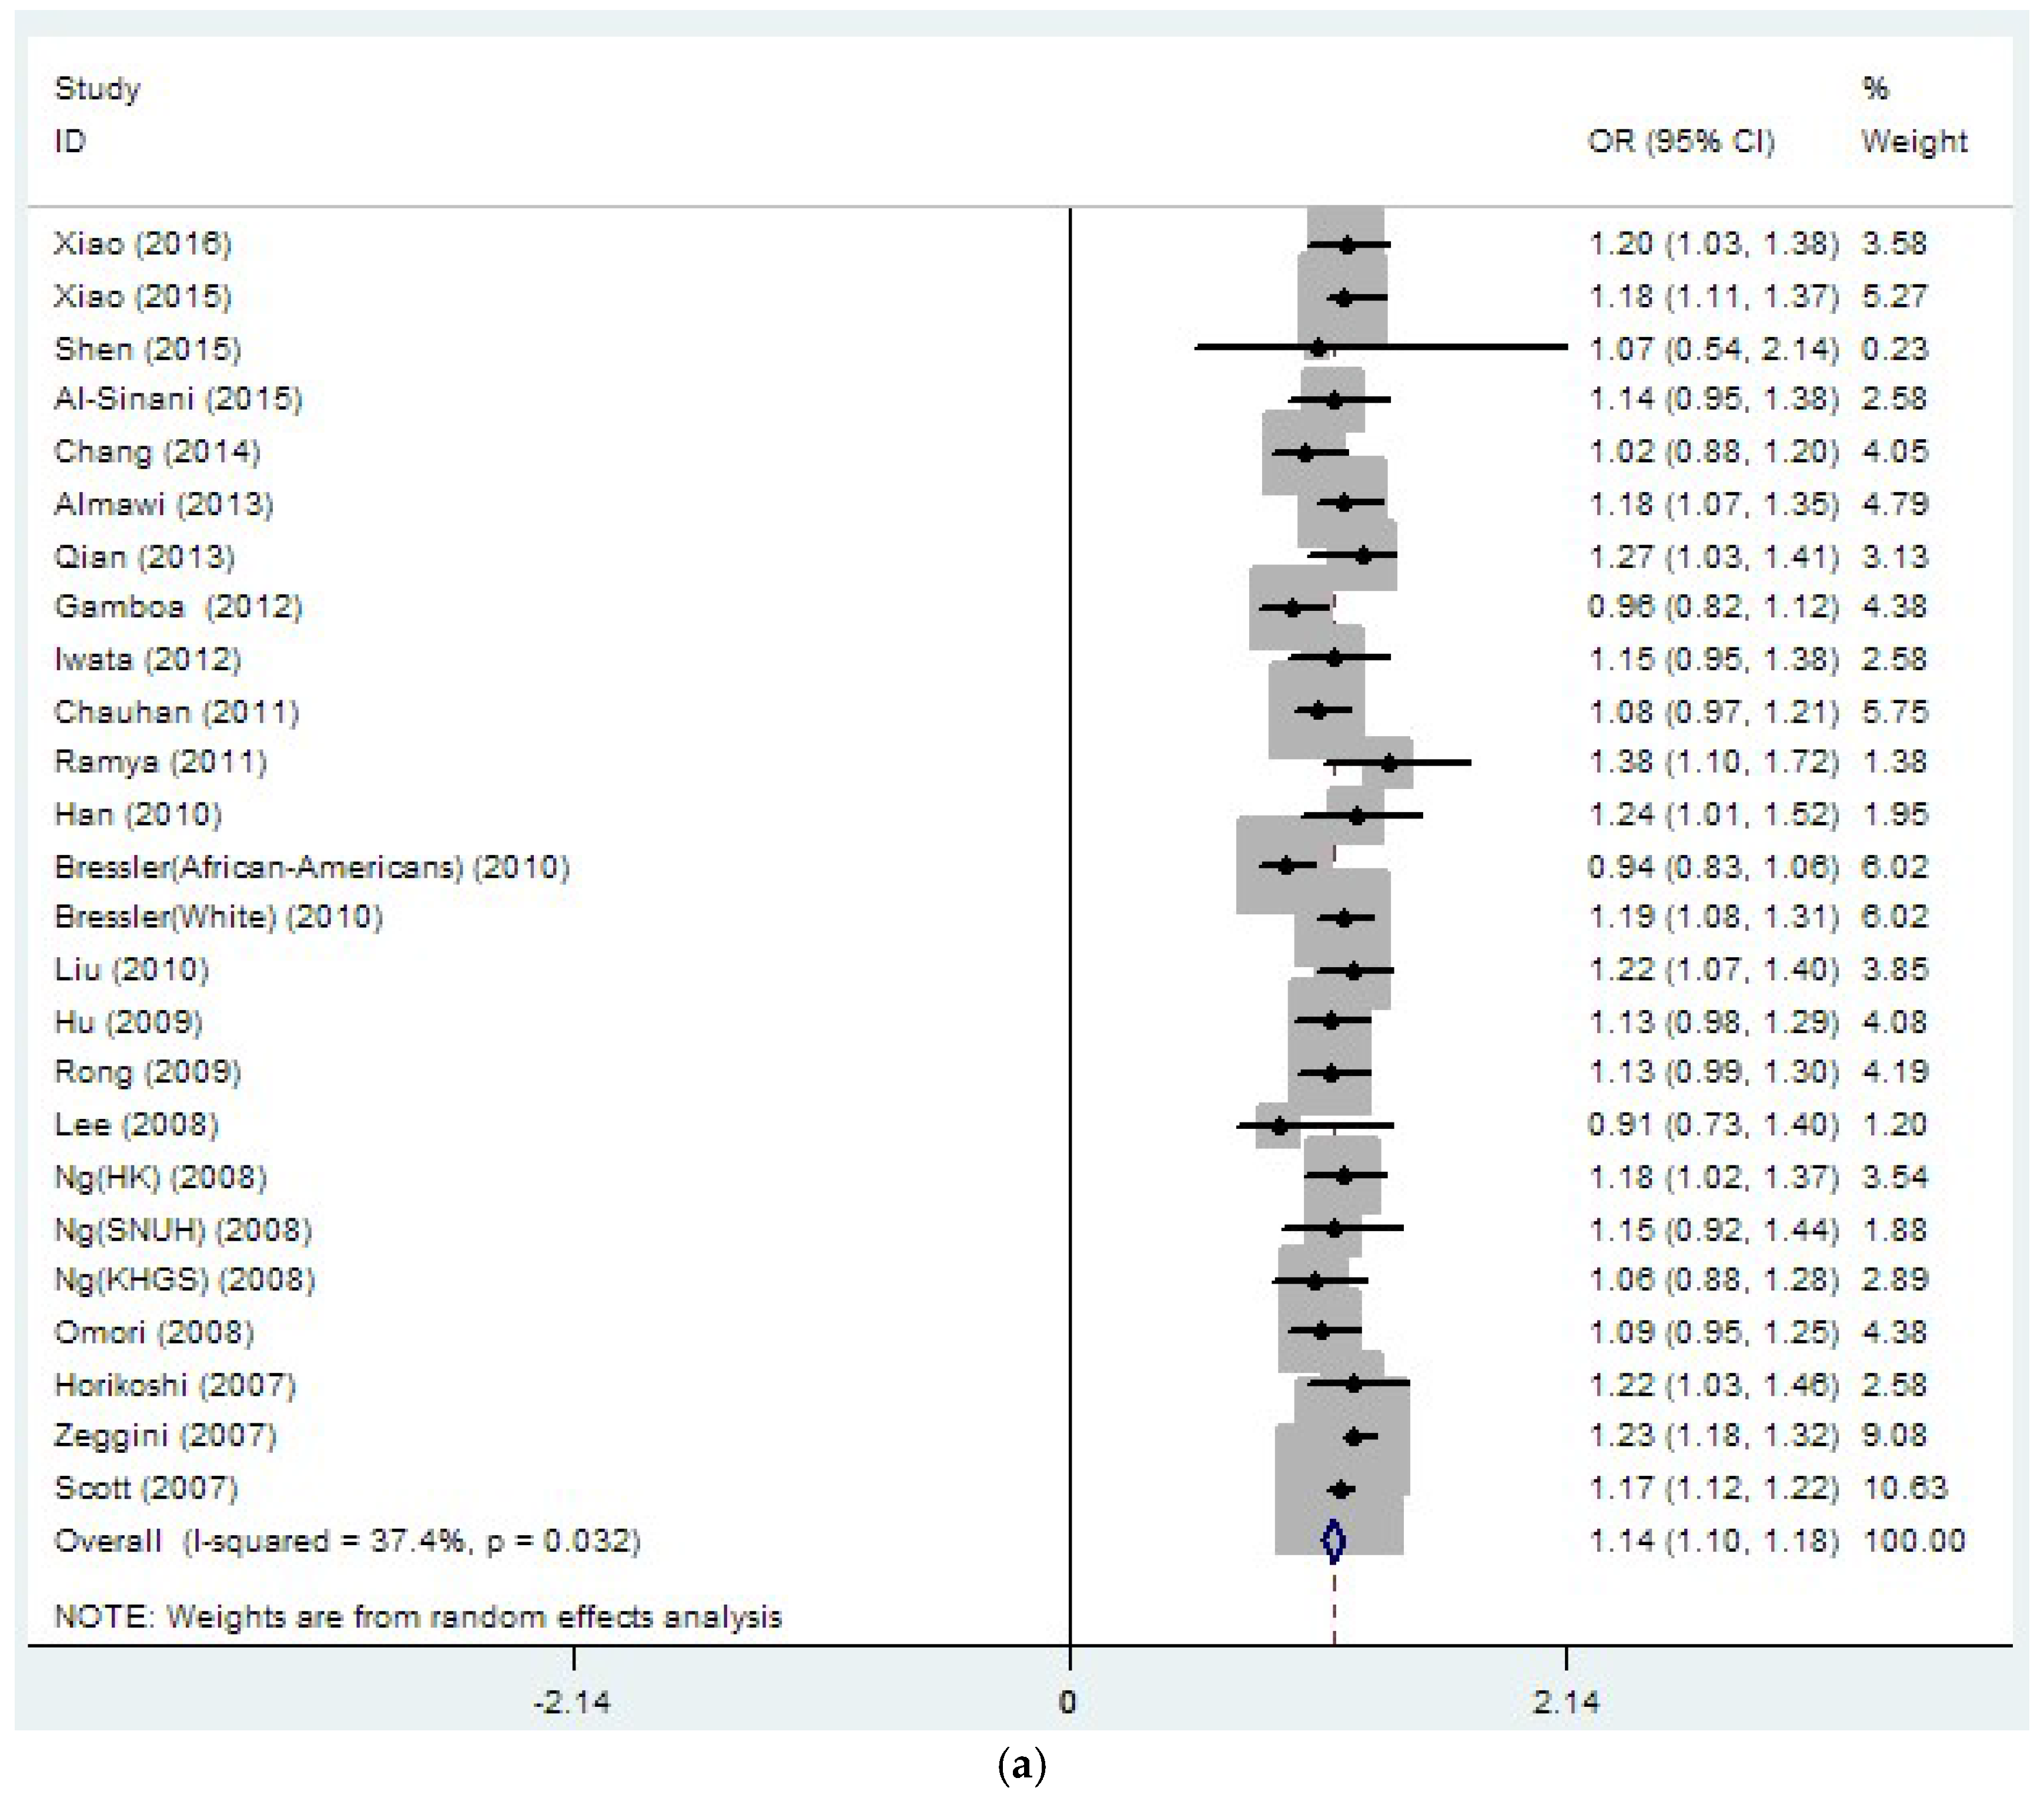
| rs8050136 | 26 | 1.14 | 0 | 37.4 | 0.032 | 1.08 | 0 | 27.1 | 0.151 |
| (33889/45490) | (1.10–1.18) | (1.03–1.12) | |||||||
| rs1421085 | 4 | 1.05 | 0.48 | 80.6 | 0.001 | 1.02 | 0.755 | 78.2 | 0.003 |
| (4285/16279) | (0.91–1.21)) | (0.88–1.19) | |||||||
| rs17817499 | 3 | 1.09 | 0.271 | 82.7 | 0.003 | 1.05 | 0.539 | 80 | 0.007 |
| (2634/15482) | (0.93–1.28) | (0.90–1.23) | |||||||
| East Asia | |||||||||
| rs9939609 | 11 | 1.11 | 0 | 19.5 | 0.257 | 1.11 | 0 | 0 | 0.535 |
| (10063/10262) | (1.05–1.17) | (1.02–1.20) | |||||||
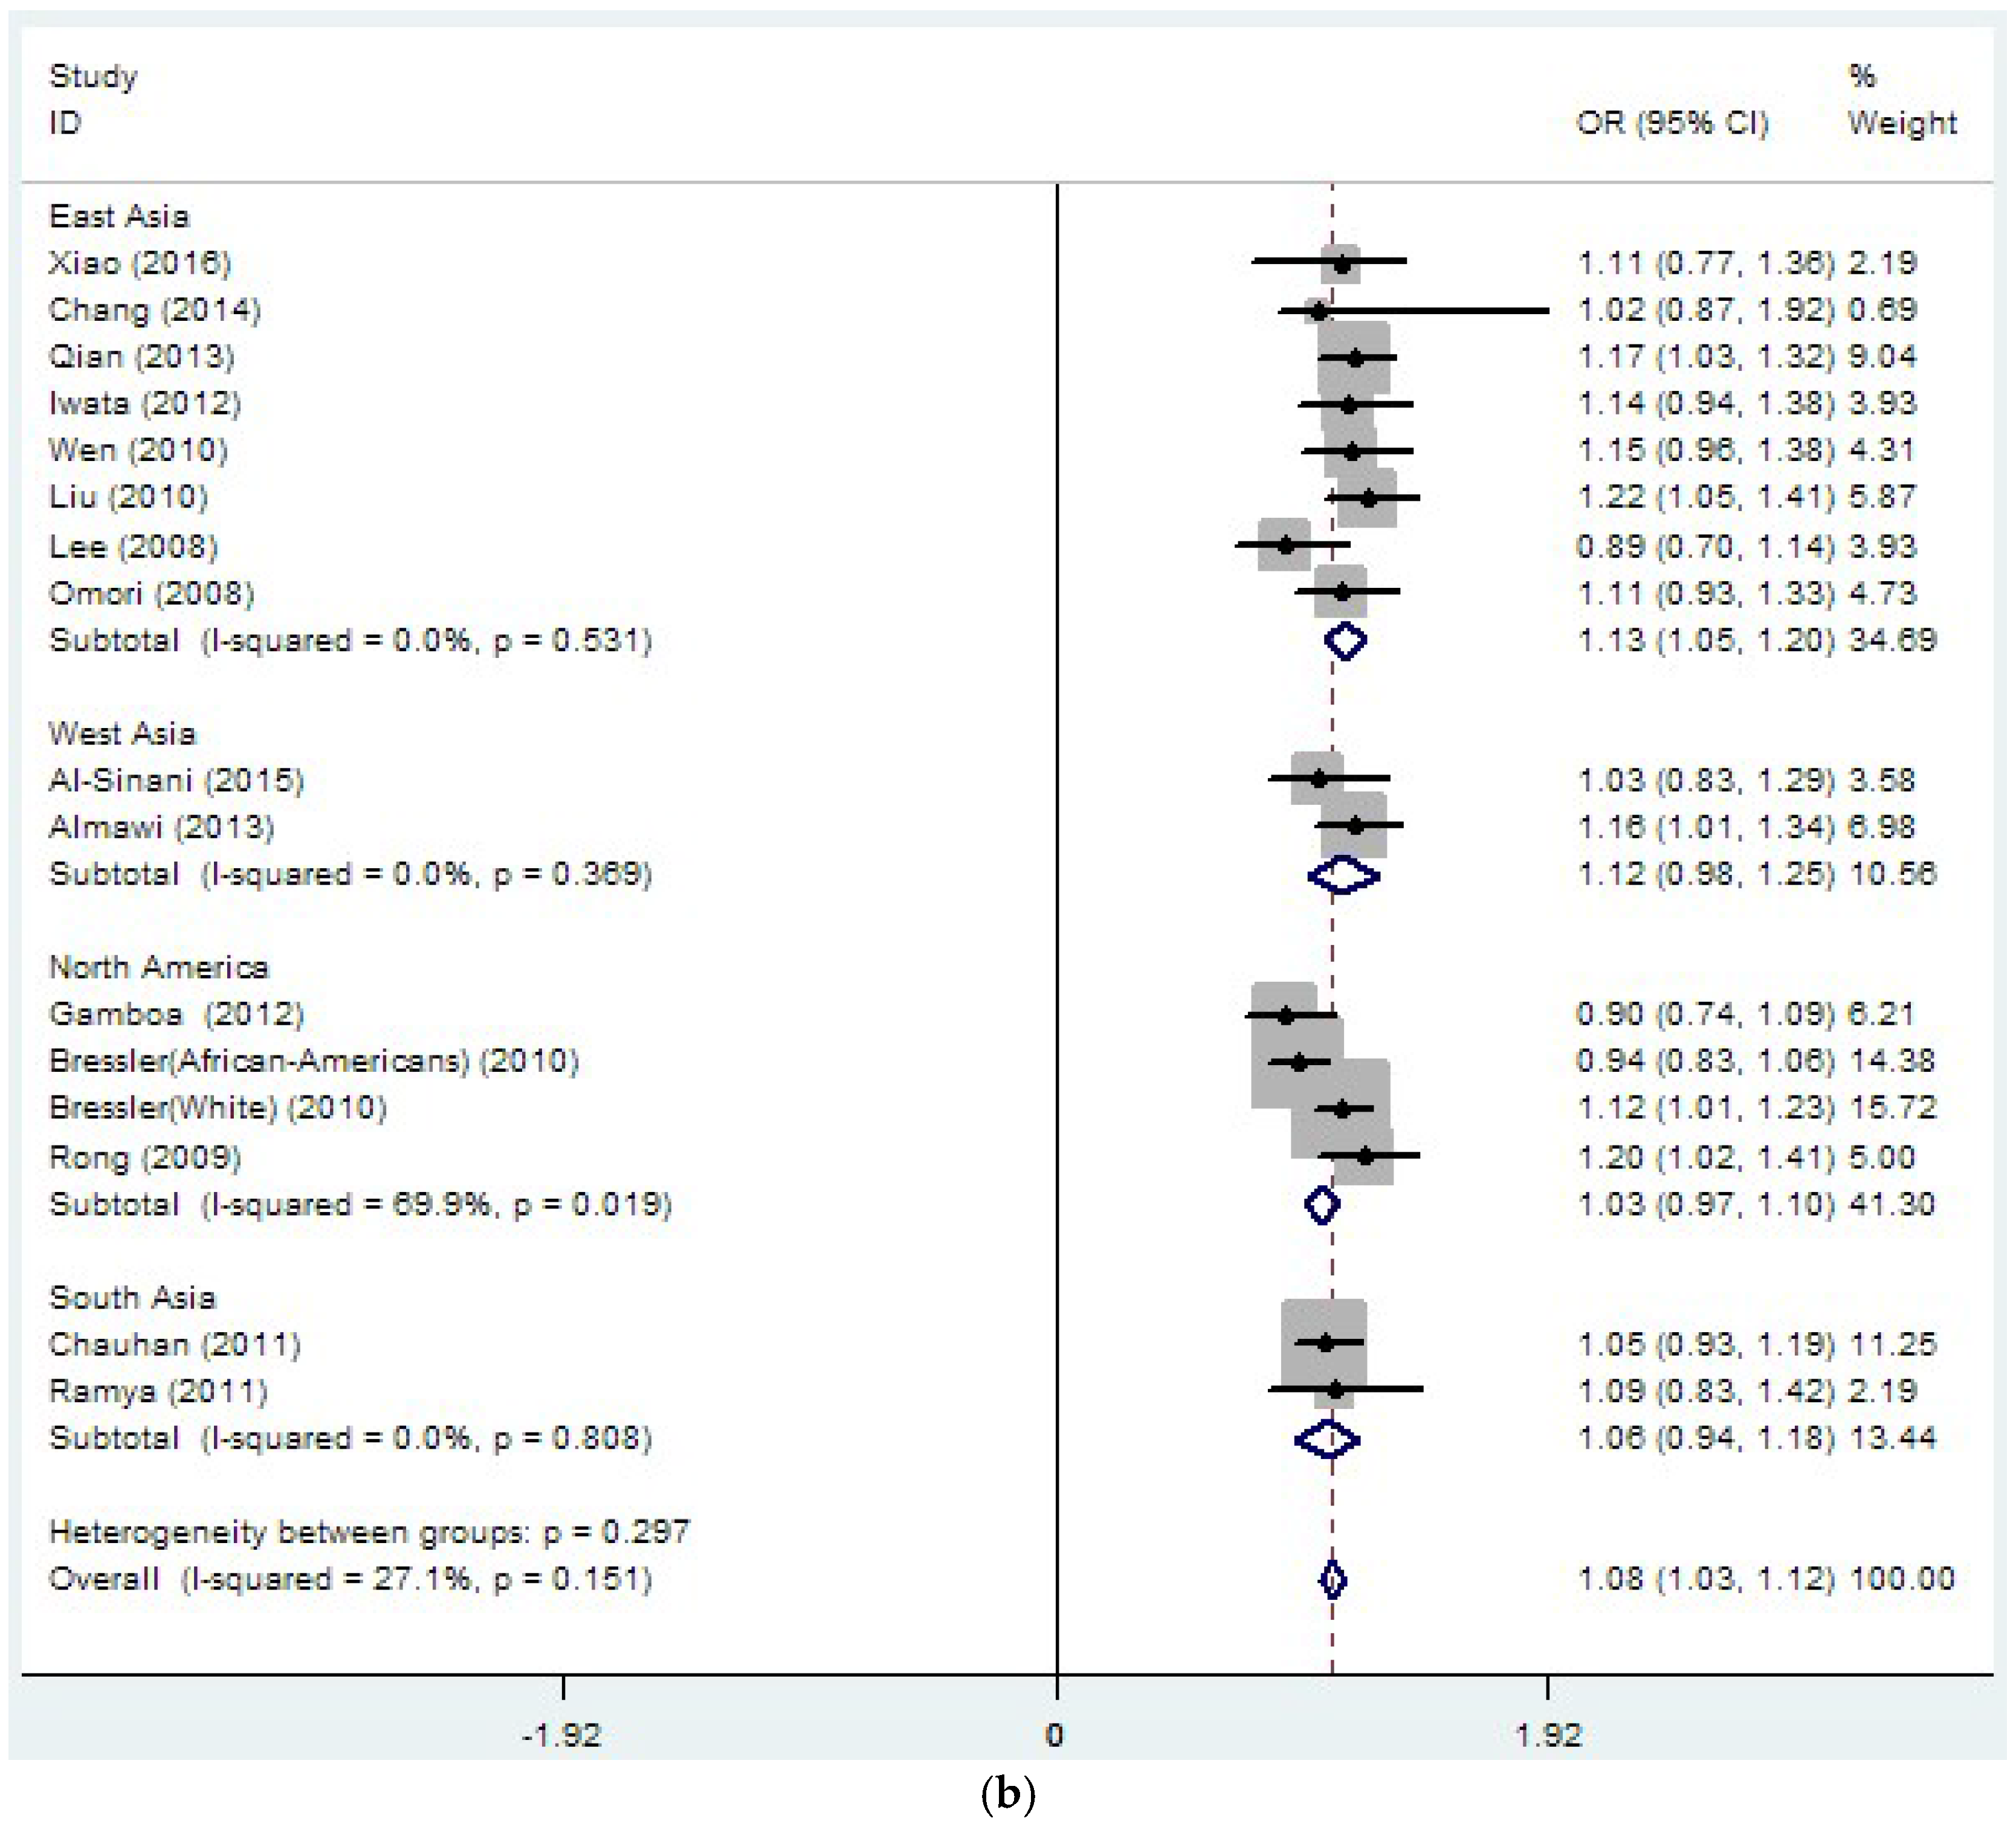
| rs8050136 | 15 | 1.15 | 0 | 0 | 0.789 | 1.13 | 0 | 0 | 0.531 |
| (19109/19422) | (1.10–1.20) | (1.05–1.20) | |||||||
| North America | |||||||||
| rs9939609 | 3 | 1.11 | 0 | 85.4 | 0.001 | 1.02 | 0 | 85.7 | 0.008 |
| (2162/14790) | (0.89–1.32) | (0.81–1.22) | |||||||
| rs8050136 | 4 | 1.06 | 0 | 74.1 | 0.009 | 1.03 | 0 | 69.9 | 0.019 |
| (4140/17082) | (0.93–1.19) | (0.97–1.10) | |||||||
| Europe | |||||||||
| rs9939609 | 4 | 1.18 | 0 | 0 | 0.49 | 1.11 | 0 | 75.6 | 0.043 |
| (10695/17306) | (1.14–1.22) | (0.93–1.29) | |||||||
| rs8050136 | 2 | 1.19 | 0 | 46.5 | 0.172 | NA | NA | NA | NA |
| (8020/10685) | (1.14–1.25) | ||||||||
| South Asia | |||||||||
| rs9939609 | 10 | 1.19 | 0 | 58.6 | 0.01 | 1.19 | 0 | 69.7 | 0.01 |
| (8859/9152) | (1.10–1.29) | (1.06–1.31) | |||||||
| rs8050136 | 2 | 1.19 | 0 | 68 | 0.077 | 1.06 | 0 | 0 | 0.808 |
| (2107/2651) | (0.91–1.48) | (0.94–1.18) | |||||||
| West Asia | |||||||||
| rs8050136 | 2 | 1.17 | 0 | 0 | 0.76 | 1.12 | 0 | 0 | 0.369 |
| (1987/1489) | (1.05–1.29) | (0.98–1.25) | |||||||
© 2017 by the authors. Licensee MDPI, Basel, Switzerland. This article is an open access article distributed under the terms and conditions of the Creative Commons Attribution (CC BY) license ( http://creativecommons.org/licenses/by/4.0/).
Share and Cite
Yang, Y.; Liu, B.; Xia, W.; Yan, J.; Liu, H.-Y.; Hu, L.; Liu, S.-M. FTO Genotype and Type 2 Diabetes Mellitus: Spatial Analysis and Meta-Analysis of 62 Case-Control Studies from Different Regions. Genes 2017, 8, 70. https://doi.org/10.3390/genes8020070
Yang Y, Liu B, Xia W, Yan J, Liu H-Y, Hu L, Liu S-M. FTO Genotype and Type 2 Diabetes Mellitus: Spatial Analysis and Meta-Analysis of 62 Case-Control Studies from Different Regions. Genes. 2017; 8(2):70. https://doi.org/10.3390/genes8020070
Chicago/Turabian StyleYang, Ying, Boyang Liu, Wei Xia, Jing Yan, Huan-Yu Liu, Ling Hu, and Song-Mei Liu. 2017. "FTO Genotype and Type 2 Diabetes Mellitus: Spatial Analysis and Meta-Analysis of 62 Case-Control Studies from Different Regions" Genes 8, no. 2: 70. https://doi.org/10.3390/genes8020070