Profiling Cellular Processes in Adipose Tissue during Weight Loss Using Time Series Gene Expression

 , , and
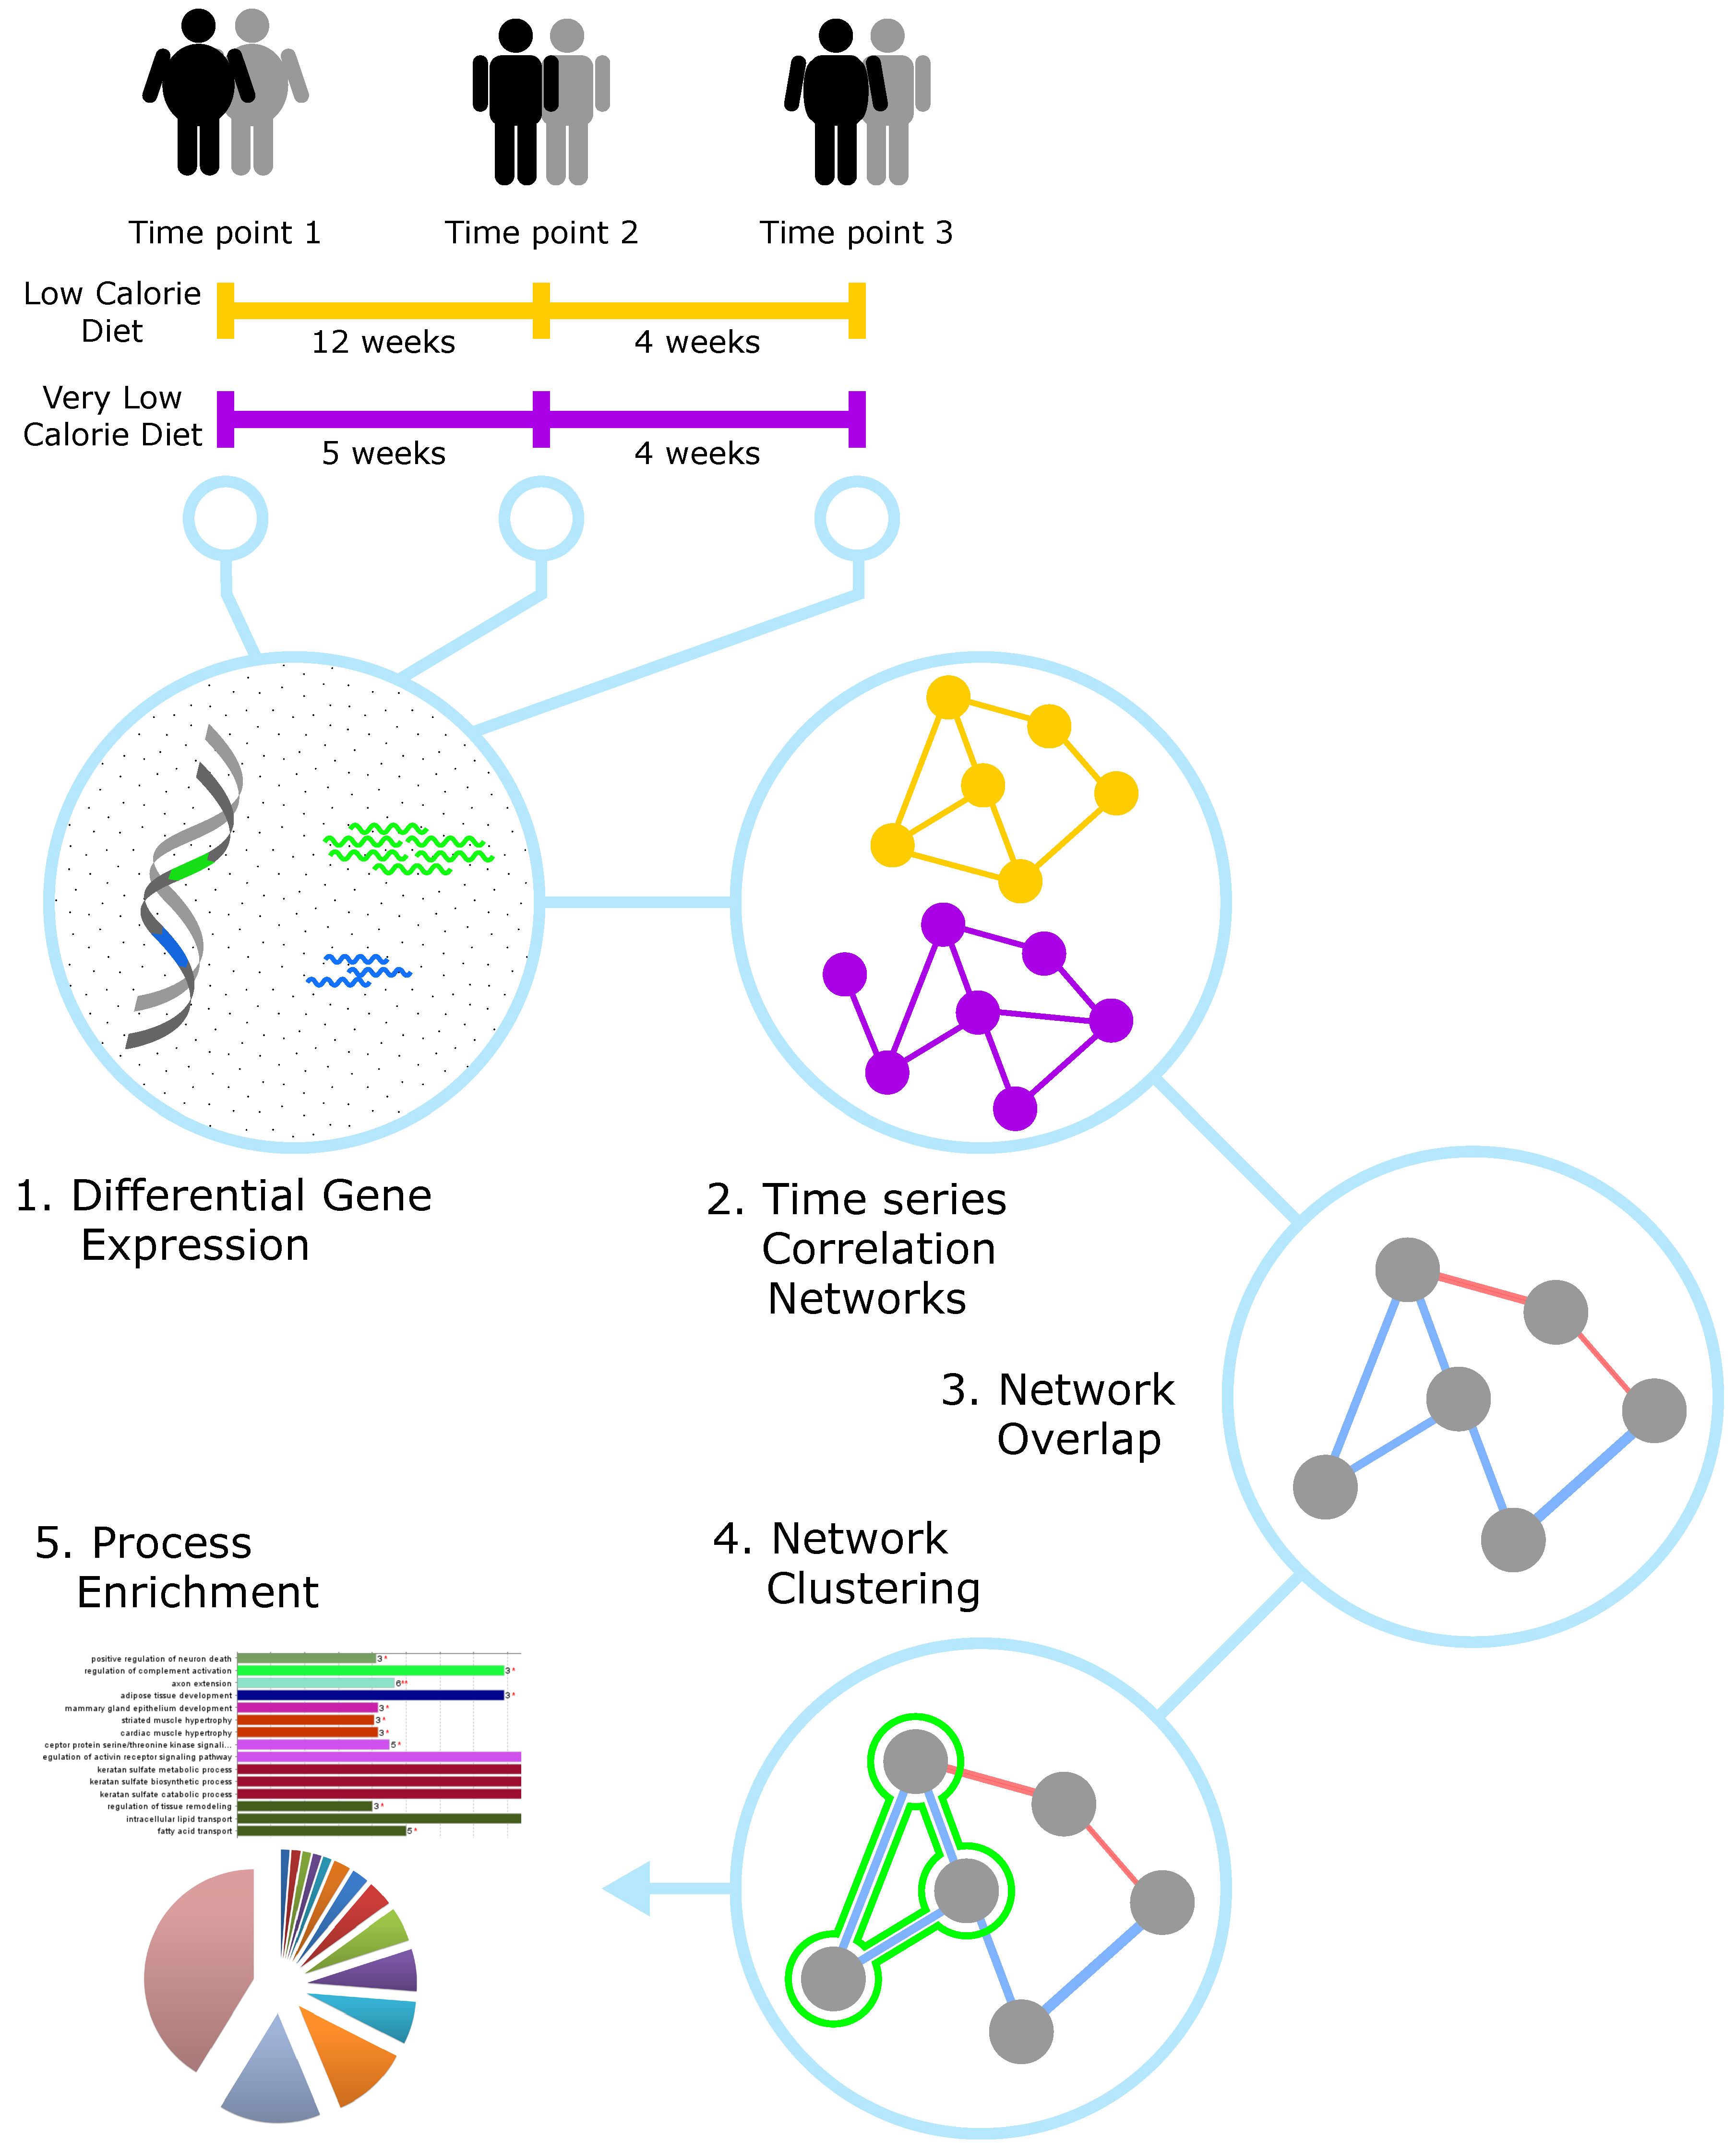
Abstract
:1. Introduction
2. Materials and Methods
2.1. Analysis Workflow
2.2. Dataset
2.3. Data Quality Control and Filtration of Background Expression
2.4. Differential Expression Analysis
2.5. Network Inference and Clustering
2.6. Gene Ontology and Pathway Enrichment
2.7. Software and Libraries
2.8. Data Availability
3. Results
3.1. Data Normalisation and Filtration
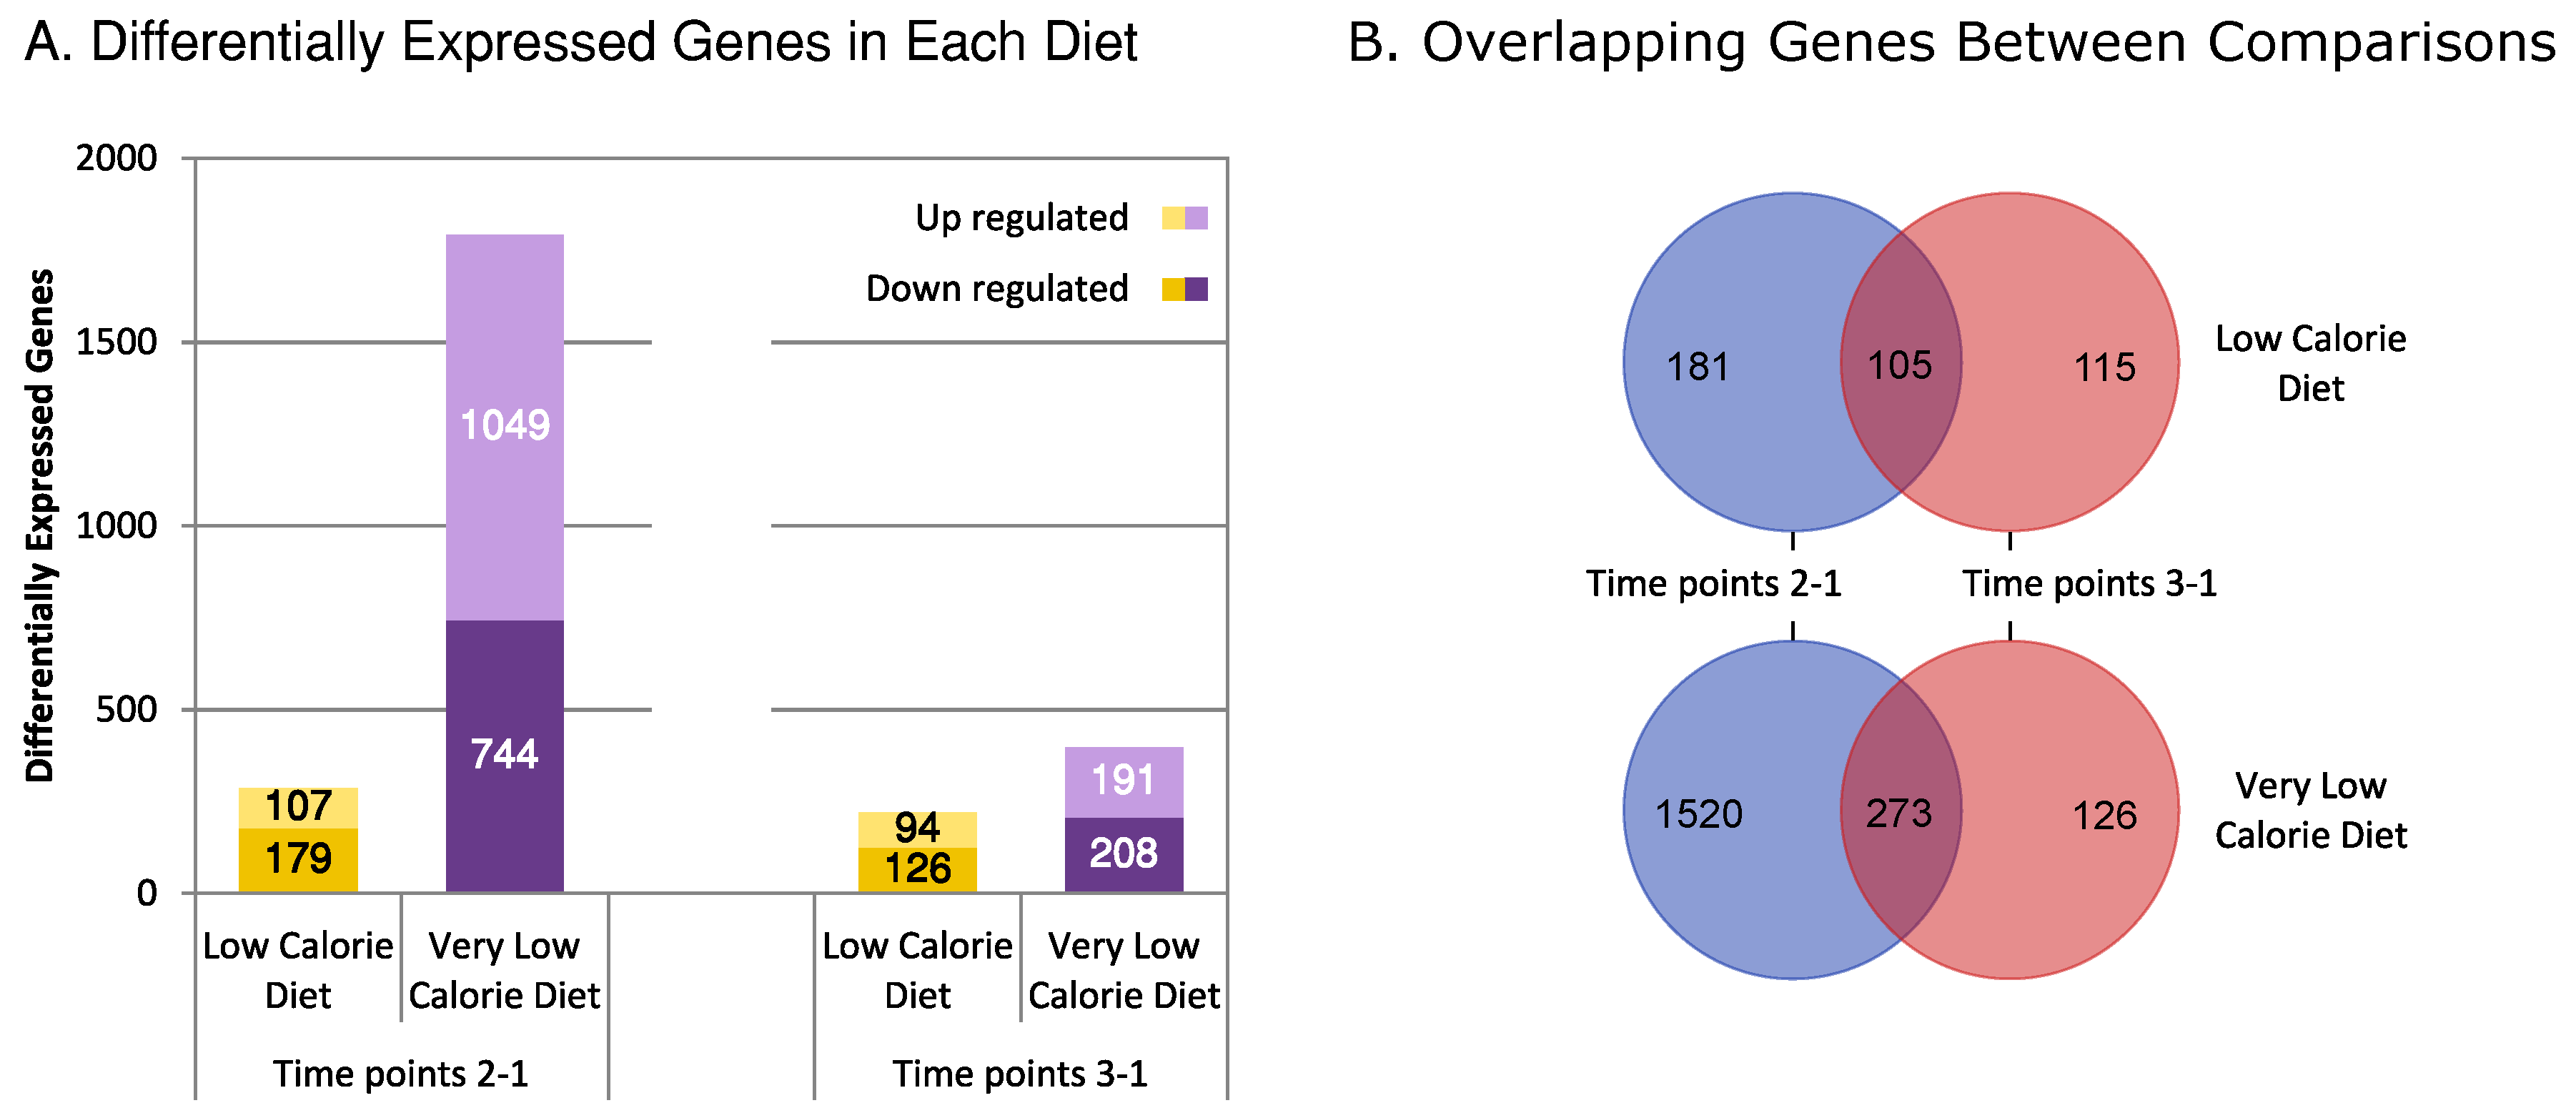
3.2. Differential Expression
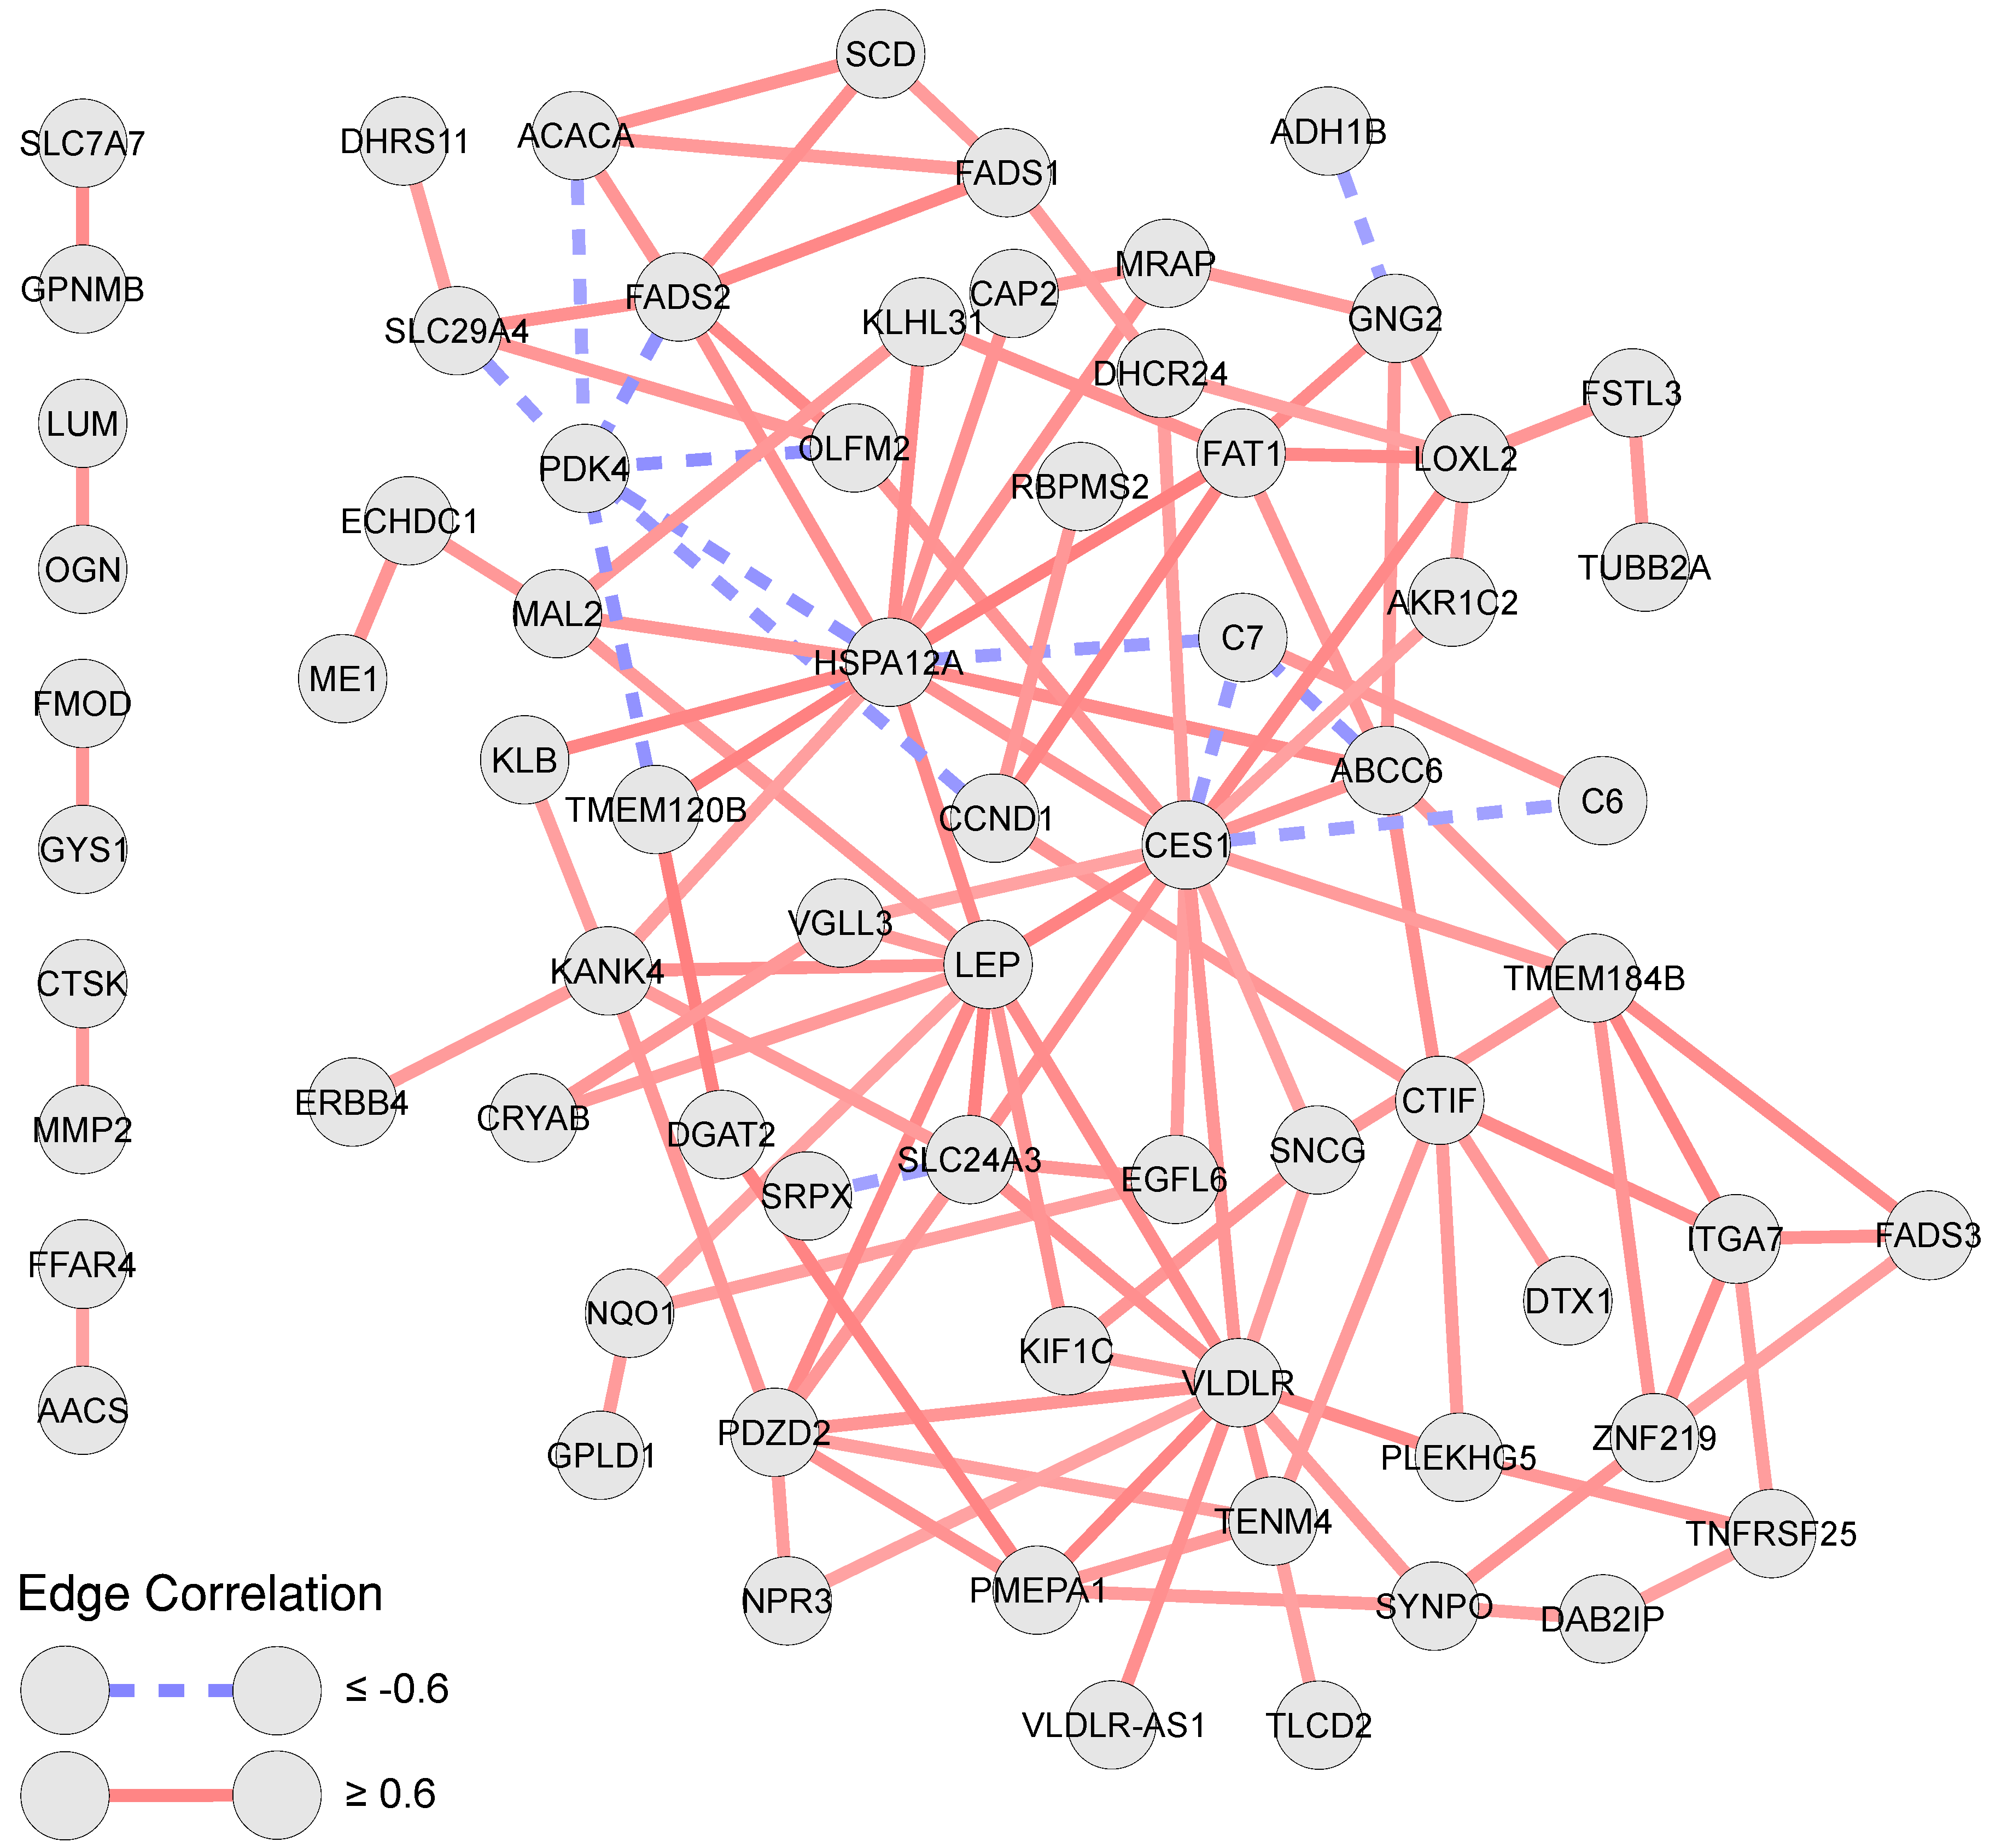
3.3. Correlation and Overlap Networks
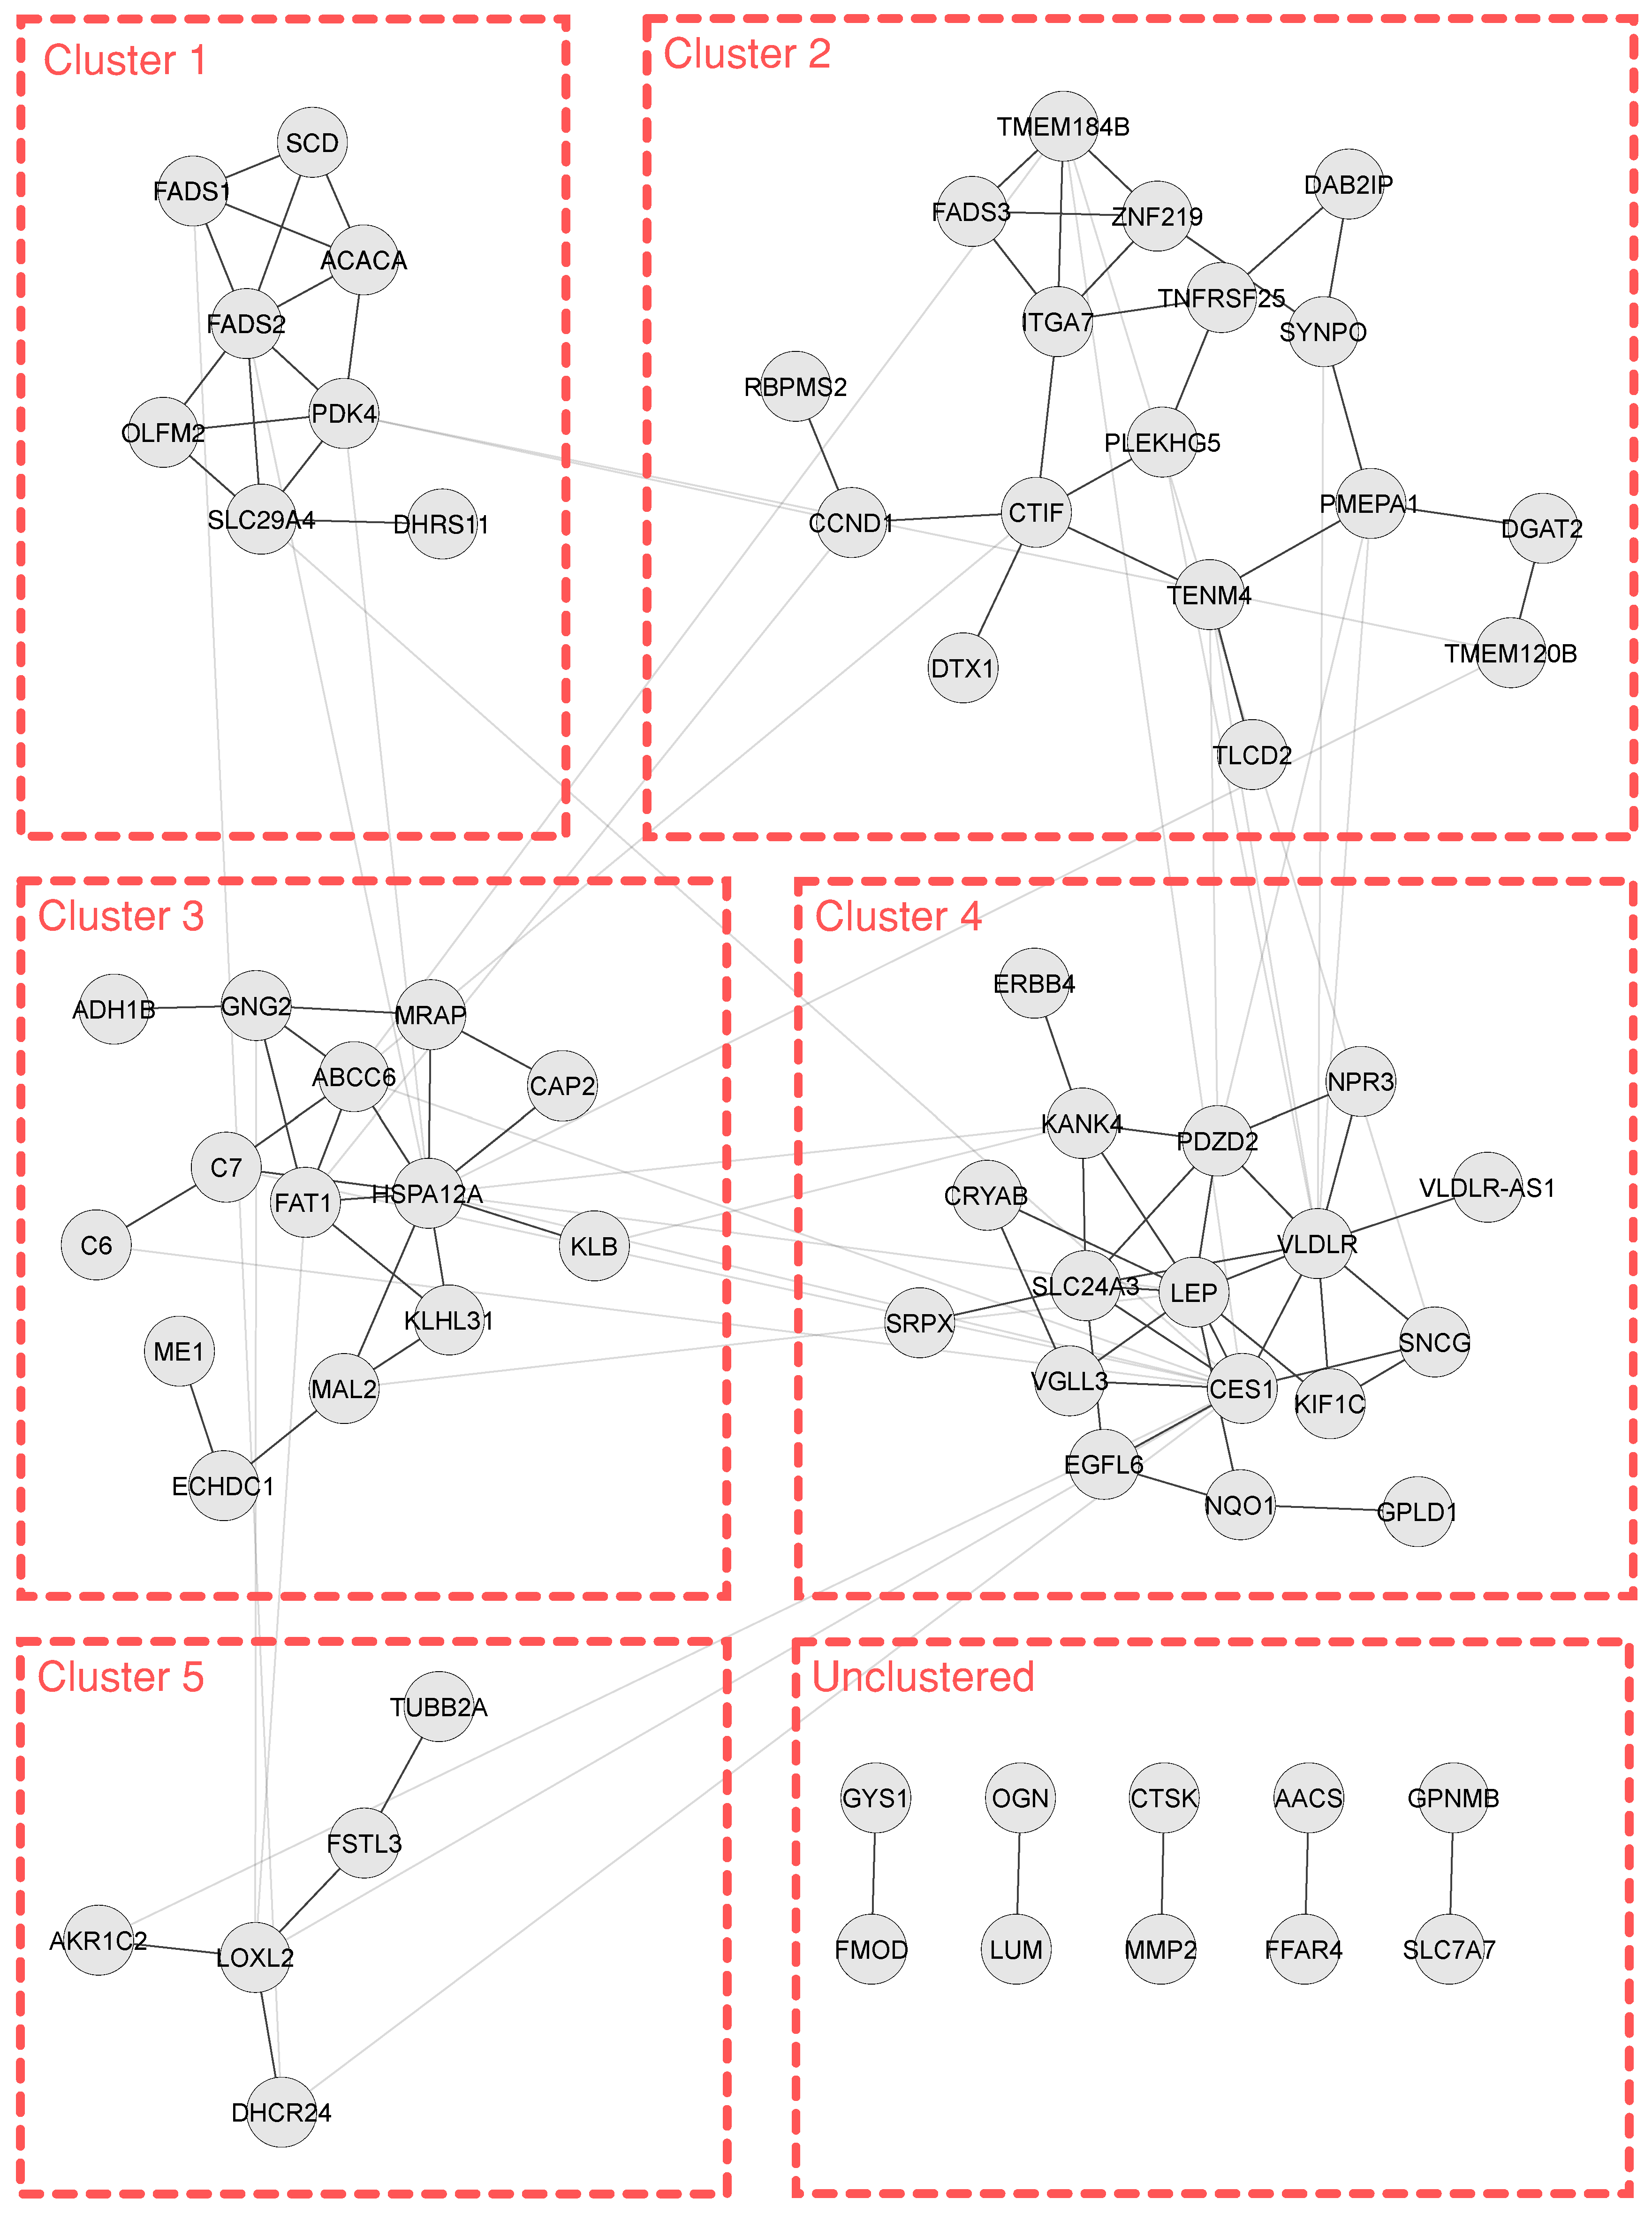
3.4. Enrichment and Clustering Results
4. Discussion
5. Conclusions
Supplementary Materials
Author Contributions
Funding
Acknowledgments
Conflicts of Interest
References
- World Health Organization. Global Status Report on Noncommunicable Diseases 2014; Technical Report; World Health Organization: Geneva, Switzerland, 2014. [Google Scholar]
- Power, C.; Pereira, S.M.P.; Law, C.; Ki, M. Obesity and risk factors for cardiovascular disease and type 2 diabetes: Investigating the role of physical activity and sedentary behaviour in mid-life in the 1958 British cohort. Atherosclerosis 2014, 233, 363–369. [Google Scholar] [CrossRef] [PubMed]
- Van Gaal, L.F.; Mertens, I.L.; De Block, C.E. Mechanisms linking obesity with cardiovascular disease. Nature 2006, 444, 875–880. [Google Scholar] [CrossRef] [PubMed]
- Kaur, J. A comprehensive review on metabolic syndrome. Cardiol. Res. Pract. 2014, 2014, 943162. [Google Scholar] [CrossRef] [PubMed]
- Lavie, C.J.; Milani, R.V.; Ventura, H.O. Obesity and cardiovascular disease risk factor, paradox, and impact of weight loss. J. Am. Coll. Cardiol. 2009, 53, 1925–1932. [Google Scholar] [CrossRef] [PubMed]
- Klein, S.; Sheard, N.F.; Pi-Sunyer, X.; Daly, A.; Wylie-Rosett, J.; Kulkarni, K.; Clark, N.G. Weight management through lifestyle modification for the prevention and management of type 2 Diabetes: Rationale and strategies. Diabetes Care 2004, 27, 2067–2073. [Google Scholar] [CrossRef] [PubMed]
- World Health Organization. Diet, Nutrition and the Prevention of Chronic Diseases; Report of the Joint WHO/FAO Expert Consultation (WHO Technical Report Series), No. 916 (TRS 916); Technical Report; World Health Organization: Geneva, Switzerland, 2003. [Google Scholar]
- Leyvraz, C.; Verdumo, C.; Suter, M.; Paroz, A.; Calmes, J.M.; Marques-Vidal, P.M.; Giusti, V. Changes in gene expression profile in human subcutaneous adipose tissue during significant weight loss. Obes. Facts 2012, 5, 440–451. [Google Scholar] [CrossRef] [PubMed]
- Campbell, K.L.; Foster-Schubert, K.E.; Makar, K.W.; Kratz, M.; Hagman, D.; Schur, E.A.; Habermann, N.; Horton, M.; Abbenhardt, C.; Kuan, L.Y.; et al. Gene expression changes in adipose tissue with diet- and/or exercise-induced weight loss. Cancer Prev. Res. 2013, 6, 217–231. [Google Scholar] [CrossRef] [PubMed]
- Kern, P.A.; Ranganathan, S.; Li, C.; Wood, L.; Ranganathan, G. Adipose tissue tumor necrosis factor and interleukin-6 expression in human obesity and insulin resistance. Am. J. Physiol. Endocrinol. Metab. 2001, 280, E745–E751. [Google Scholar] [CrossRef] [PubMed]
- Bar-Joseph, Z.; Gitter, A.; Simon, I. Studying and modelling dynamic biological processes using time-series gene expression data. Nat. Rev. Genet. 2012, 13, 552–564. [Google Scholar] [CrossRef] [PubMed]
- García-Campos, M.A.; Espinal-Enríquez, J.; Hernández-Lemus, E. Pathway Analysis: State of the art. Front. Physiol. 2015, 6, 383. [Google Scholar] [CrossRef] [PubMed]
- Khatri, P.; Sirota, M.; Butte, A.J. Ten years of pathway analysis: Current aproaches and outstanding challenges. PLoS Comput. Biol. 2012, 8, 1–10. [Google Scholar] [CrossRef] [PubMed]
- Eijssen, L.M.T.; Jaillard, M.; Adriaens, M.E.; Gaj, S.; de Groot, P.J.; Müller, M.; Evelo, C.T. User-friendly solutions for microarray quality control and pre-processing on ArrayAnalysis.org. Nucleic Acids Res. 2013, 41, W71–W76. [Google Scholar] [CrossRef] [PubMed] [Green Version]
- R Development Core Team. R: A Language and Environment for Statistical Computing; R Foundation for Statistical Computing: Vienna, Austria, 2008; ISBN 3-900051-07-0. [Google Scholar]
- Shannon, P.; Markiel, A.; Ozier, O.; Baliga, N.S.; Wang, J.T.; Ramage, D.; Amin, N.; Schwikowski, B.; Ideker, T. Cytoscape: A software environment for integrated models of biomolecular interaction networks. Genome Res. 2003, 13, 2498–2504. [Google Scholar] [CrossRef] [PubMed]
- Vink, R.G.; Roumans, N.J.T.; Arkenbosch, L.A.J.; Mariman, E.C.M.; van Baak, M.A. The effect of rate of weight loss on long-term weight regain in adults with overweight and obesity. Obesity 2016, 24, 321–327. [Google Scholar] [CrossRef] [PubMed] [Green Version]
- Storey, J.D.; Bass, A.J.; Dabney, A.; Robinson, D. qvalue: Q-Value Estimation for False Discovery Rate Control. R Package Version 2.8.0. 2015. Available online: https://bioconductor.org/packages/release/bioc/html/qvalue.html (accessed on 22 October 2018).
- Elo, L.L.; Schwikowski, B. Analysis of time-resolved gene expression measurements across individuals. PLoS ONE 2013, 8, e82340. [Google Scholar] [CrossRef] [PubMed]
- Su, G.; Kuchinsky, A.; Morris, J.H.; States, D.J.; Meng, F. GLay: Community structure analysis of biological networks. Bioinformatics 2010, 26, 3135–3137. [Google Scholar] [CrossRef] [PubMed]
- Morris, J.H.; Apeltsin, L.; Newman, A.M.; Baumbach, J.; Wittkop, T.; Su, G.; Bader, G.D.; Ferrin, T.E. clusterMaker: A multi-algorithm clustering plugin for Cytoscape. BMC Bioinf. 2011, 12, 436. [Google Scholar] [CrossRef] [PubMed]
- Bindea, G.; Mlecnik, B.; Hackl, H.; Charoentong, P.; Tosolini, M.; Kirilovsky, A.; Fridman, W.H.; Pagès, F.; Trajanoski, Z.; Galon, J. ClueGO: A Cytoscape plug-in to decipher functionally grouped gene ontology and pathway annotation networks. Bioinformatics 2009, 25, 1091–1093. [Google Scholar] [CrossRef] [PubMed]
- Kamburov, A.; Wierling, C.; Lehrach, H.; Herwig, R. ConsensusPathDB—A database for integrating human functional interaction networks. Nucleic Acids Res. 2009, 37, D623–D628. [Google Scholar] [CrossRef] [PubMed]
- Ritchie, M.E.; Phipson, B.; Wu, D.; Hu, Y.; Law, C.W.; Shi, W.; Smyth, G.K. limma powers differential expression analyses for RNA-sequencing and microarray studies. Nucleic Acids Res. 2015, 43, e47. [Google Scholar] [CrossRef] [PubMed]
- Kamburov, A.; Stelzl, U.; Lehrach, H.; Herwig, R. The ConsensusPathDB interaction database: 2013 update. Nucleic Acids Res. 2013, 41, D793–D800. [Google Scholar] [CrossRef] [PubMed]
- Kamburov, A.; Pentchev, K.; Galicka, H.; Wierling, C.; Lehrach, H.; Herwig, R. ConsensusPathDB: Toward a more complete picture of cell biology. Nucleic Acids Res. 2011, 39, D712–D717. [Google Scholar] [CrossRef] [PubMed]
- Vink, R.G.; Roumans, N.J.; Fazelzadeh, P.; Tareen, S.H.; Boekschoten, M.V.; van Baak, M.A.; Mariman, E.C. Adipose tissue gene expression is differentially regulated with different rates of weight loss in overweight and obese humans. Int. J. Obes. 2016. [Google Scholar] [CrossRef] [PubMed]
- Menendez, J.A.; Vazquez-Martin, A.; Ortega, F.J.; Fernandez-Real, J.M. Fatty acid synthase: Association with insulin resistance, type 2 diabetes, and cancer. Clin. Chem. 2009, 55, 425–438. [Google Scholar] [CrossRef] [PubMed]
- Dharuri, H.; AC’t Hoen, P.; van Klinken, J.B.; Henneman, P.; Laros, J.F.J.; Lips, M.A.; el Bouazzaoui, F.; van Ommen, G.J.B.; Janssen, I.; et al. Downregulation of the acetyl-CoA metabolic network in adipose tissue of obese diabetic individuals and recovery after weight loss. Diabetologia 2014, 57, 2384–2392. [Google Scholar] [CrossRef] [PubMed]
- Mackenzie, R.W.; Elliott, B.T. Akt/PKB activation and insulin signaling: A novel insulin signaling pathway in the treatment of type 2 diabetes. Diabetes Metab. Syndr. Obes. Targets Ther. 2014, 7, 55–64. [Google Scholar] [CrossRef] [PubMed]
- Hardie, D.G. Role of AMP-activated protein kinase in the metabolic syndrome and in heart disease. FEBS Lett. 2008, 582, 81–89. [Google Scholar] [CrossRef] [PubMed]
- Tyagi, S.; Gupta, P.; Saini, A.; Kaushal, C.; Sharma, S. The peroxisome proliferator-activated receptor: A family of nuclear receptors role in various diseases. J. Adv. Pharm. Technol. Res. 2011, 2, 236–240. [Google Scholar] [CrossRef] [PubMed]
- Leonardini, A.; Laviola, L.; Perrini, S.; Natalicchio, A.; Giorgino, F. Cross-talk between PPARγ and insulin signaling and modulation of insulin sensitivity. PPAR Res. 2009, 2009, 1–12. [Google Scholar] [CrossRef] [PubMed]
- Albracht-Schulte, K.; Kalupahana, N.S.; Ramalingam, L.; Wang, S.; Rahman, S.M.; Robert-McComb, J.; Moustaid-Moussa, N. Omega-3 fatty acids in obesity and metabolic syndrome: A mechanistic update. J. Nutr. Biochem. 2018, 58, 1–16. [Google Scholar] [CrossRef] [PubMed]
- Tortosa-Caparrós, E.; Navas-Carrillo, D.; Marín, F.; Orenes-Piñero, E. Anti-inflammatory effects of omega 3 and omega 6 polyunsaturated fatty acids in cardiovascular disease and metabolic syndrome. Crit. Rev. Food Sci. Nutr. 2017, 57, 3421–3429. [Google Scholar] [CrossRef] [PubMed]
- Simopoulos, A.P. An increase in the Omega-6/Omega-3 fatty acid ratio increases the risk for obesity. Nutrients 2016, 8, 128. [Google Scholar] [CrossRef] [PubMed]
- Moreno-Navarrete, J.M.; Fernández-Real, J.M. The complement system is dysfunctional in metabolic disease: Evidences in plasma and adipose tissue from obese and insulin resistant subjects. Semin. Cell Dev. Biol. 2017. [Google Scholar] [CrossRef] [PubMed]
- Attia, R.R.; Sharma, P.; Janssen, R.C.; Friedman, J.E.; Deng, X.; Lee, J.S.; Elam, M.B.; Cook, G.A.; Park, E.A. Regulation of pyruvate dehydrogenase kinase 4 (PDK4) by CCAAT/Enhancer-binding protein β (C/EBPβ). J. Biol. Chem. 2011, 286, 23799–23807. [Google Scholar] [CrossRef] [PubMed]
- Colbert, C.L.; Kim, C.W.; Moon, Y.A.; Henry, L.; Palnitkar, M.; McKean, W.B.; Fitzgerald, K.; Deisenhofer, J.; Horton, J.D.; Kwon, H.J. Crystal structure of Spot 14, a modulator of fatty acid synthesis. Proc. Natl. Acad. Sci. USA 2010, 107, 18820–18825. [Google Scholar] [CrossRef] [PubMed] [Green Version]
- Kalupahana, N.S.; Jayalath, T.; Wang, S.; Moustaid-Moussa, N. Regulation and Metabolic Functions of White Adipose Tissue Stearoyl-CoA Desaturase. In Stearoyl-CoA Desaturase Genes in Lipid Metabolism; Springer: New York, NY, USA, 2013; pp. 49–60. [Google Scholar]
- Haim, Y.; Blüher, M.; Slutsky, N.; Goldstein, N.; Klöting, N.; Harman-Boehm, I.; Kirshtein, B.; Ginsberg, D.; Gericke, M.; Jurado, E.G.; et al. Elevated autophagy gene expression in adipose tissue of obese humans: A potential non-cell-cycle-dependent function of E2F1. Autophagy 2015, 11, 2074–2088. [Google Scholar] [CrossRef] [PubMed] [Green Version]
- Batrakou, D.G.; de las Heras, J.I.; Czapiewski, R.; Mouras, R.; Schirmer, E.C. TMEM120A and B: Nuclear envelope transmembrane proteins important for adipocyte differentiation. PLoS ONE 2015, 10, e0127712. [Google Scholar] [CrossRef] [PubMed]
- Phieler, J.; Garcia-Martin, R.; Lambris, J.D.; Chavakis, T. The role of the complement system in metabolic organs and metabolic diseases. Semin. Immunol. 2013, 25, 47–53. [Google Scholar] [CrossRef] [PubMed] [Green Version]
- Kaye, S.; Lokki, A.I.; Hanttu, A.; Nissilä, E.; Heinonen, S.; Hakkarainen, A.; Lundbom, J.; Lundbom, N.; Saarinen, L.; Tynninen, O.; et al. Upregulation of early and downregulation of terminal pathway complement genes in subcutaneous adipose tissue and adipocytes in acquired obesity. Front. Immunol. 2017, 8, 545. [Google Scholar] [CrossRef] [PubMed]
- Perfilyev, A.; Dahlman, I.; Gillberg, L.; Rosqvist, F.; Iggman, D.; Volkov, P.; Nilsson, E.; Risérus, U.; Ling, C. Impact of polyunsaturated and saturated fat overfeeding on the DNA-methylation pattern in human adipose tissue: A randomized controlled trial. Am. J. Clin. Nutr. 2017, 105, 991–1000. [Google Scholar] [CrossRef] [PubMed]
- Moisan, A.; Lee, Y.K.; Zhang, J.D.; Hudak, C.S.; Meyer, C.A.; Prummer, M.; Zoffmann, S.; Truong, H.H.; Ebeling, M.; Kiialainen, A.; et al. White-to-brown metabolic conversion of human adipocytes by JAK inhibition. Nat. Cell Biol. 2015, 17, 57–67. [Google Scholar] [CrossRef] [PubMed]
- Lee, D.V.; Li, D.; Yan, Q.; Zhu, Y.; Goodwin, B.; Calle, R.; Brenner, M.B.; Talukdar, S. Fibroblast growth factor 21 improves insulin sensitivity and synergizes with insulin in human adipose stem cell-derived (hASC) adipocytes. PLoS ONE 2014, 9, e111767. [Google Scholar] [CrossRef] [PubMed]
- Zhou, Y.; Rui, L. Leptin signaling and leptin resistance. Front. Med. 2013, 7, 207–222. [Google Scholar] [CrossRef] [PubMed]
- Yang, R.; Barouch, L.A. Leptin signaling and obesity. Circ. Res. 2007, 101, 545–559. [Google Scholar] [CrossRef] [PubMed]
- Hajer, G.R.; van Haeften, T.W.; Visseren, F.L. Adipose tissue dysfunction in obesity, diabetes, and vascular diseases. Eur. Heart J. 2008, 29, 2959. [Google Scholar] [CrossRef] [PubMed]
- Makki, K.; Froguel, P.; Wolowczuk, I. Adipose tissue in obesity-related inflammation and insulin resistance: Cells, cytokines, and chemokines. Int. Sch. Res. Not. Inflamm. 2013, 2013, 12. [Google Scholar] [CrossRef] [PubMed]
- Clemente-Postigo, M.; Queipo-Ortuño, M.I.; Fernandez-Garcia, D.; Gomez-Huelgas, R.; Tinahones, F.J.; Cardona, F. Adipose tissue gene expression of factors related to lipid processing in obesity. PLoS ONE 2011, 6, e24783. [Google Scholar] [CrossRef] [PubMed]
- Nguyen, A.; Tao, H.; Metrione, M.; Hajri, T. Very low density lipoprotein receptor (VLDLR) expression is a determinant factor in adipose tissue inflammation and adipocyte-macrophage interaction. J. Biol. Chem. 2014, 289, 1688–1703. [Google Scholar] [CrossRef] [PubMed]
- Dunn, T.N.; Akiyama, T.; Lee, H.W.; Kim, J.B.; Knotts, T.A.; Smith, S.R.; Sears, D.D.; Carstens, E.; Adams, S.H. Evaluation of the Synuclein-γ (SNCG) gene as a PPARγ target in murine adipocytes, dorsal root ganglia somatosensory neurons, and human adipose tissue. PLoS ONE 2015, 10, e0115830. [Google Scholar] [CrossRef] [PubMed]
- Wang, G.X.; Zhao, X.Y.; Lin, J.D. The brown fat secretome: Metabolic functions beyond thermogenesis. Trends Endocrinol. Metab. 2015, 26, 231–237. [Google Scholar] [CrossRef] [PubMed]
- Ma, Y.; Gao, M.; Liu, D. Preventing high fat diet-induced obesity and improving insulin sensitivity through neuregulin 4 gene transfer. Sci. Rep. 2016, 6, 26242. [Google Scholar] [CrossRef] [PubMed]
- Brown, M.L.; Bonomi, L.; Ungerleider, N.; Zina, J.; Kimura, F.; Mukherjee, A.; Sidis, Y.; Schneyer, A. Follistatin and follistatin like-3 differentially regulate adiposity and glucose homeostasis. Obesity 2011, 19, 1940–1949. [Google Scholar] [CrossRef] [PubMed]
- Berisha, S.Z.; Serre, D.; Schauer, P.; Kashyap, S.R.; Smith, J.D. Changes in whole blood gene expression in obese subjects with type 2 diabetes following bariatric surgery: A pilot study. PLoS ONE 2011, 6, e16729. [Google Scholar] [CrossRef] [PubMed]
- Kim, Y.M.; Kim, E.C.; Kim, Y. The human lysyl oxidase-like 2 protein functions as an amine oxidase toward collagen and elastin. Mol. Biol. Rep. 2011, 38, 145–149. [Google Scholar] [CrossRef] [PubMed]
- Wake, D.J.; Strand, M.; Rask, E.; Westerbacka, J.; Livingstone, D.E.W.; Soderberg, S.; Andrew, R.; Yki-Jarvinen, H.; Olsson, T.; Walker, B.R. Intra-adipose sex steroid metabolism and body fat distribution in idiopathic human obesity. Clin. Endocrinol. 2007, 66, 440–446. [Google Scholar] [CrossRef] [PubMed]
- Bouwman, F.G.; Boer, J.M.A.; Imholz, S.; Wang, P.; Verschuren, W.M.M.; Dollé, M.E.T.; Mariman, E.C.M. Gender-specific genetic associations of polymorphisms in ACE, AKR1C2, FTO and MMP2 with weight gain over a 10-year period. Genes Nutr. 2014, 9, 434. [Google Scholar] [CrossRef] [PubMed]
- Bouwman, F.G.; Claessens, M.; van Baak, M.A.; Noben, J.P.; Wang, P.; Saris, W.H.M.; Mariman, E.C.M. The physiologic effects of caloric restriction are reflected in the in vivo adipocyte-enriched proteome of overweight/obese subjects. J. Proteome Res. 2009, 8, 5532–5540. [Google Scholar] [CrossRef] [PubMed]


© 2018 by the authors. Licensee MDPI, Basel, Switzerland. This article is an open access article distributed under the terms and conditions of the Creative Commons Attribution (CC BY) license (http://creativecommons.org/licenses/by/4.0/).
Share and Cite
Tareen, S.H.K.; Adriaens, M.E.; Arts, I.C.W.; De Kok, T.M.; Vink, R.G.; Roumans, N.J.T.; Van Baak, M.A.; Mariman, E.C.M.; Evelo, C.T.; Kutmon, M. Profiling Cellular Processes in Adipose Tissue during Weight Loss Using Time Series Gene Expression. Genes 2018, 9, 525. https://doi.org/10.3390/genes9110525
Tareen SHK, Adriaens ME, Arts ICW, De Kok TM, Vink RG, Roumans NJT, Van Baak MA, Mariman ECM, Evelo CT, Kutmon M. Profiling Cellular Processes in Adipose Tissue during Weight Loss Using Time Series Gene Expression. Genes. 2018; 9(11):525. https://doi.org/10.3390/genes9110525
Chicago/Turabian StyleTareen, Samar H. K., Michiel E. Adriaens, Ilja C. W. Arts, Theo M. De Kok, Roel G. Vink, Nadia J. T. Roumans, Marleen A. Van Baak, Edwin C. M. Mariman, Chris T. Evelo, and Martina Kutmon. 2018. "Profiling Cellular Processes in Adipose Tissue during Weight Loss Using Time Series Gene Expression" Genes 9, no. 11: 525. https://doi.org/10.3390/genes9110525