Two-State Co-Expression Network Analysis to Identify Genes Related to Salt Tolerance in Thai Rice

 , and
, and
Abstract
:1. Introduction
2. Materials and Methods
2.1. Plant Material Preparation
2.2. RNA Extraction and Sequencing
2.3. Construction of a Gene Go-Expression Network
2.4. Local Node and Network Properties
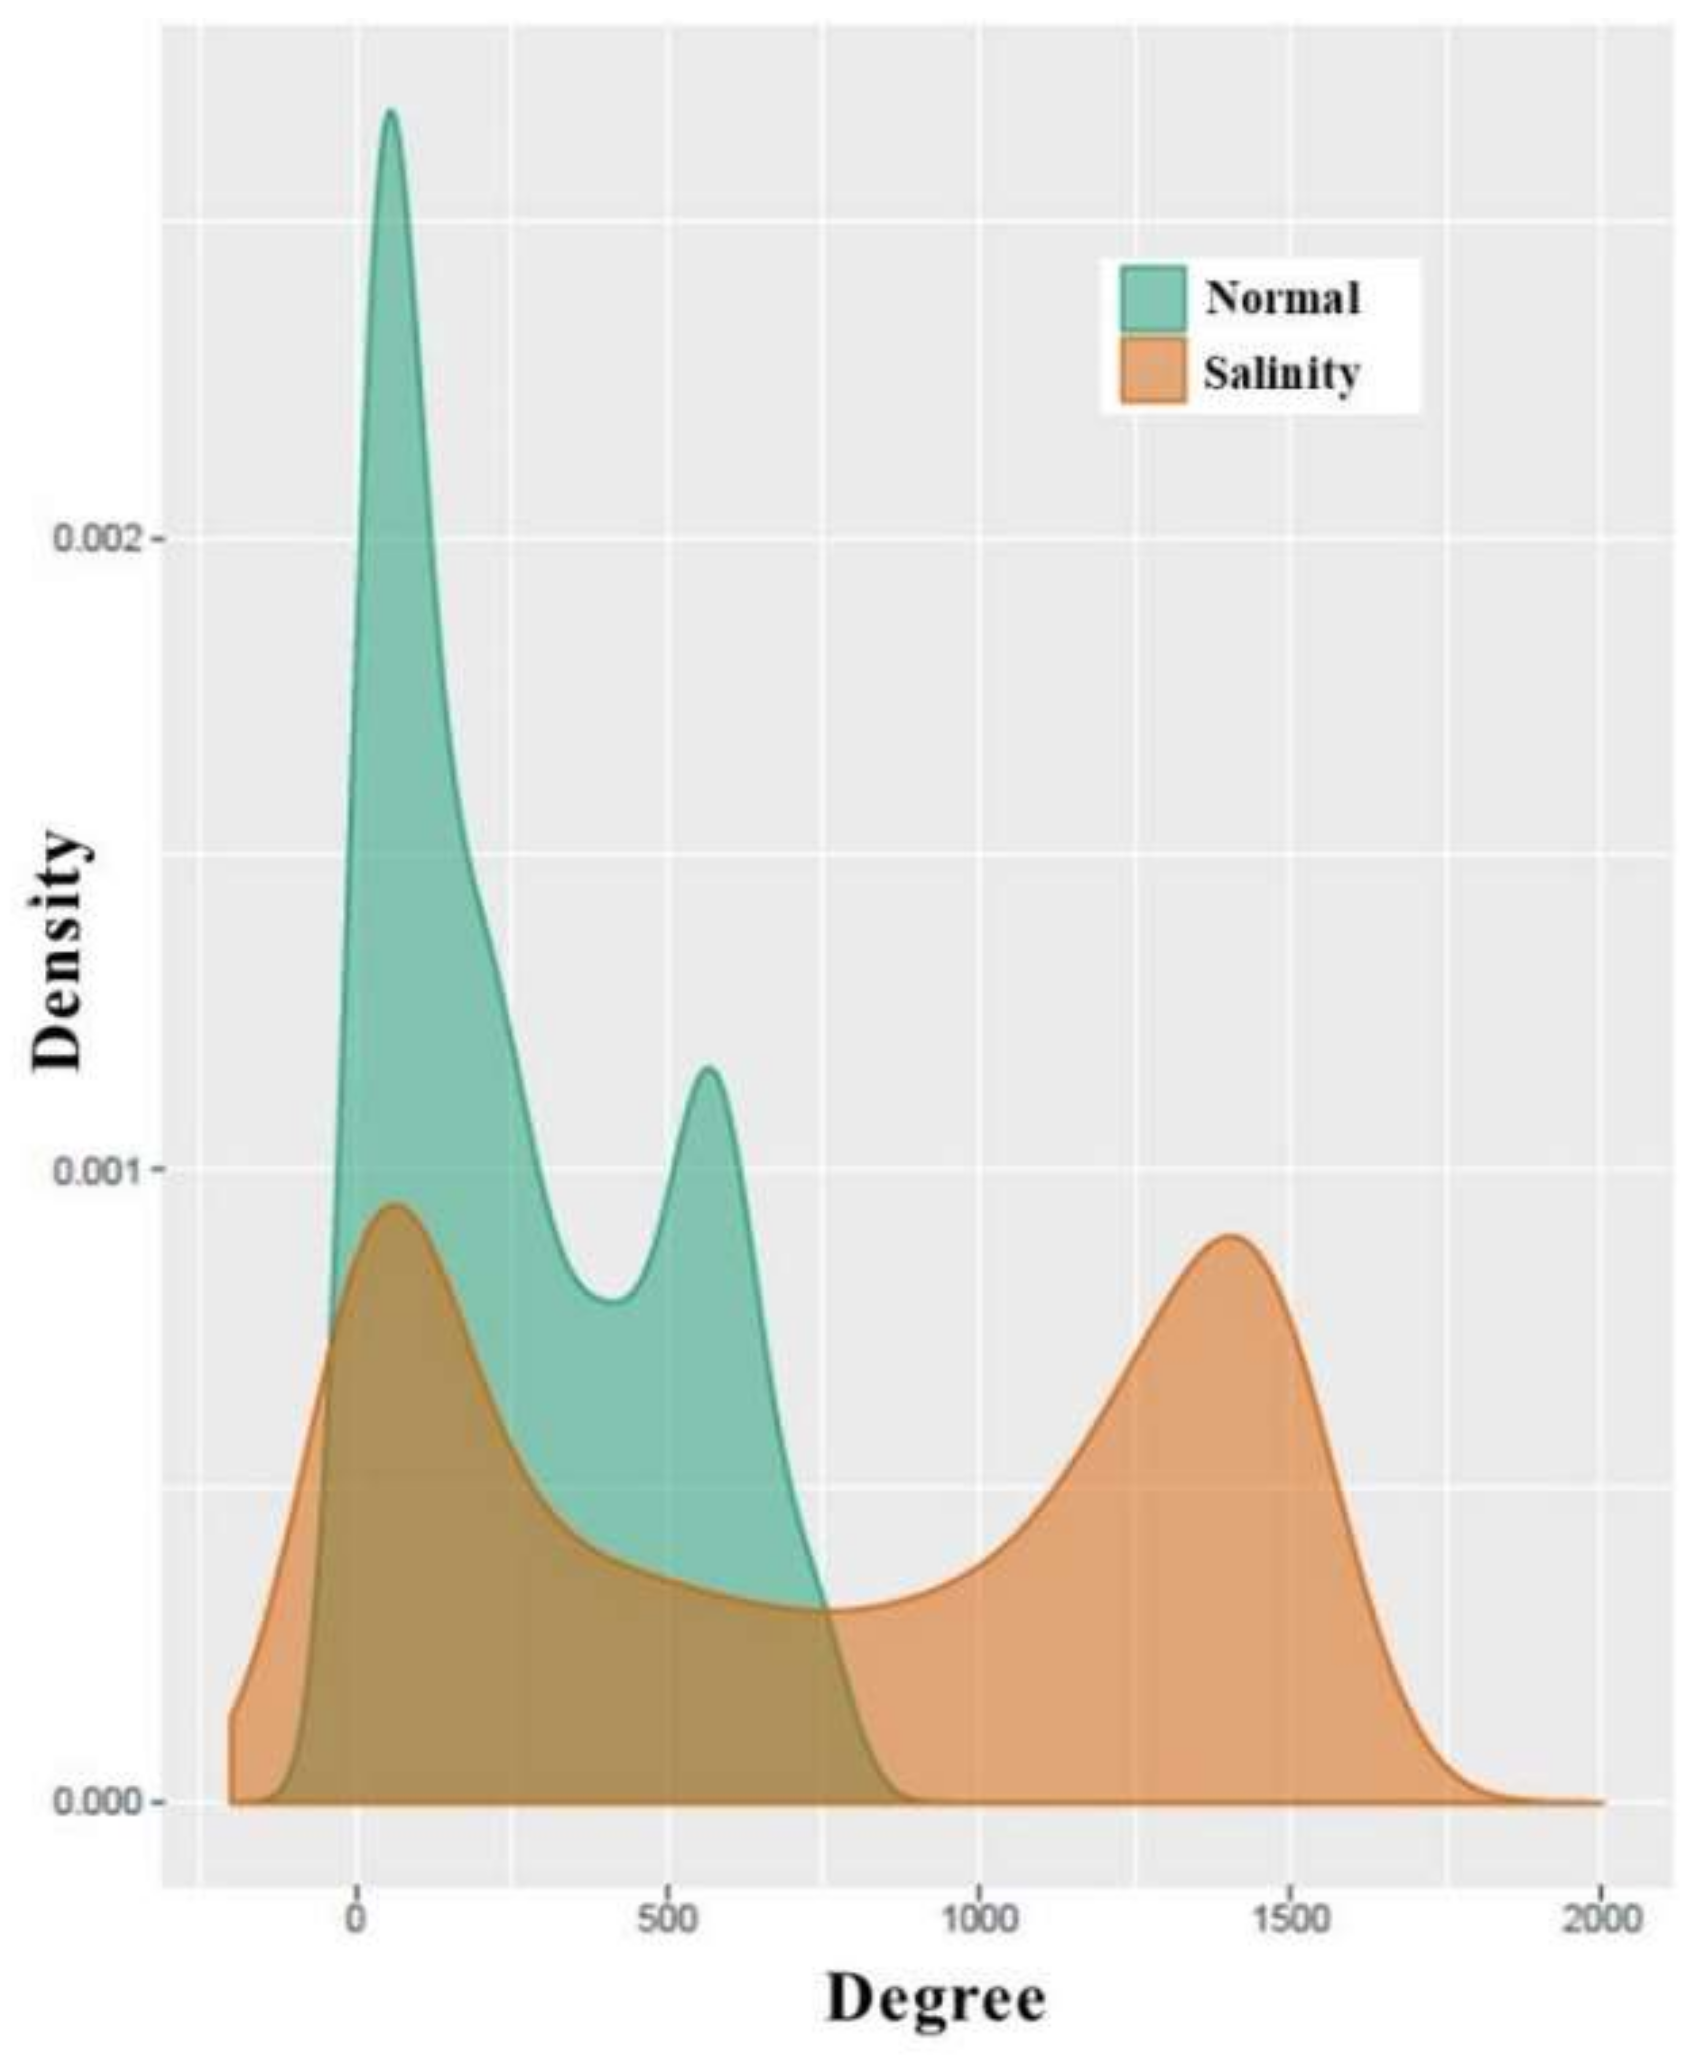
2.4.1. Degree and Degree Assortativity
2.4.2. Diameter Length
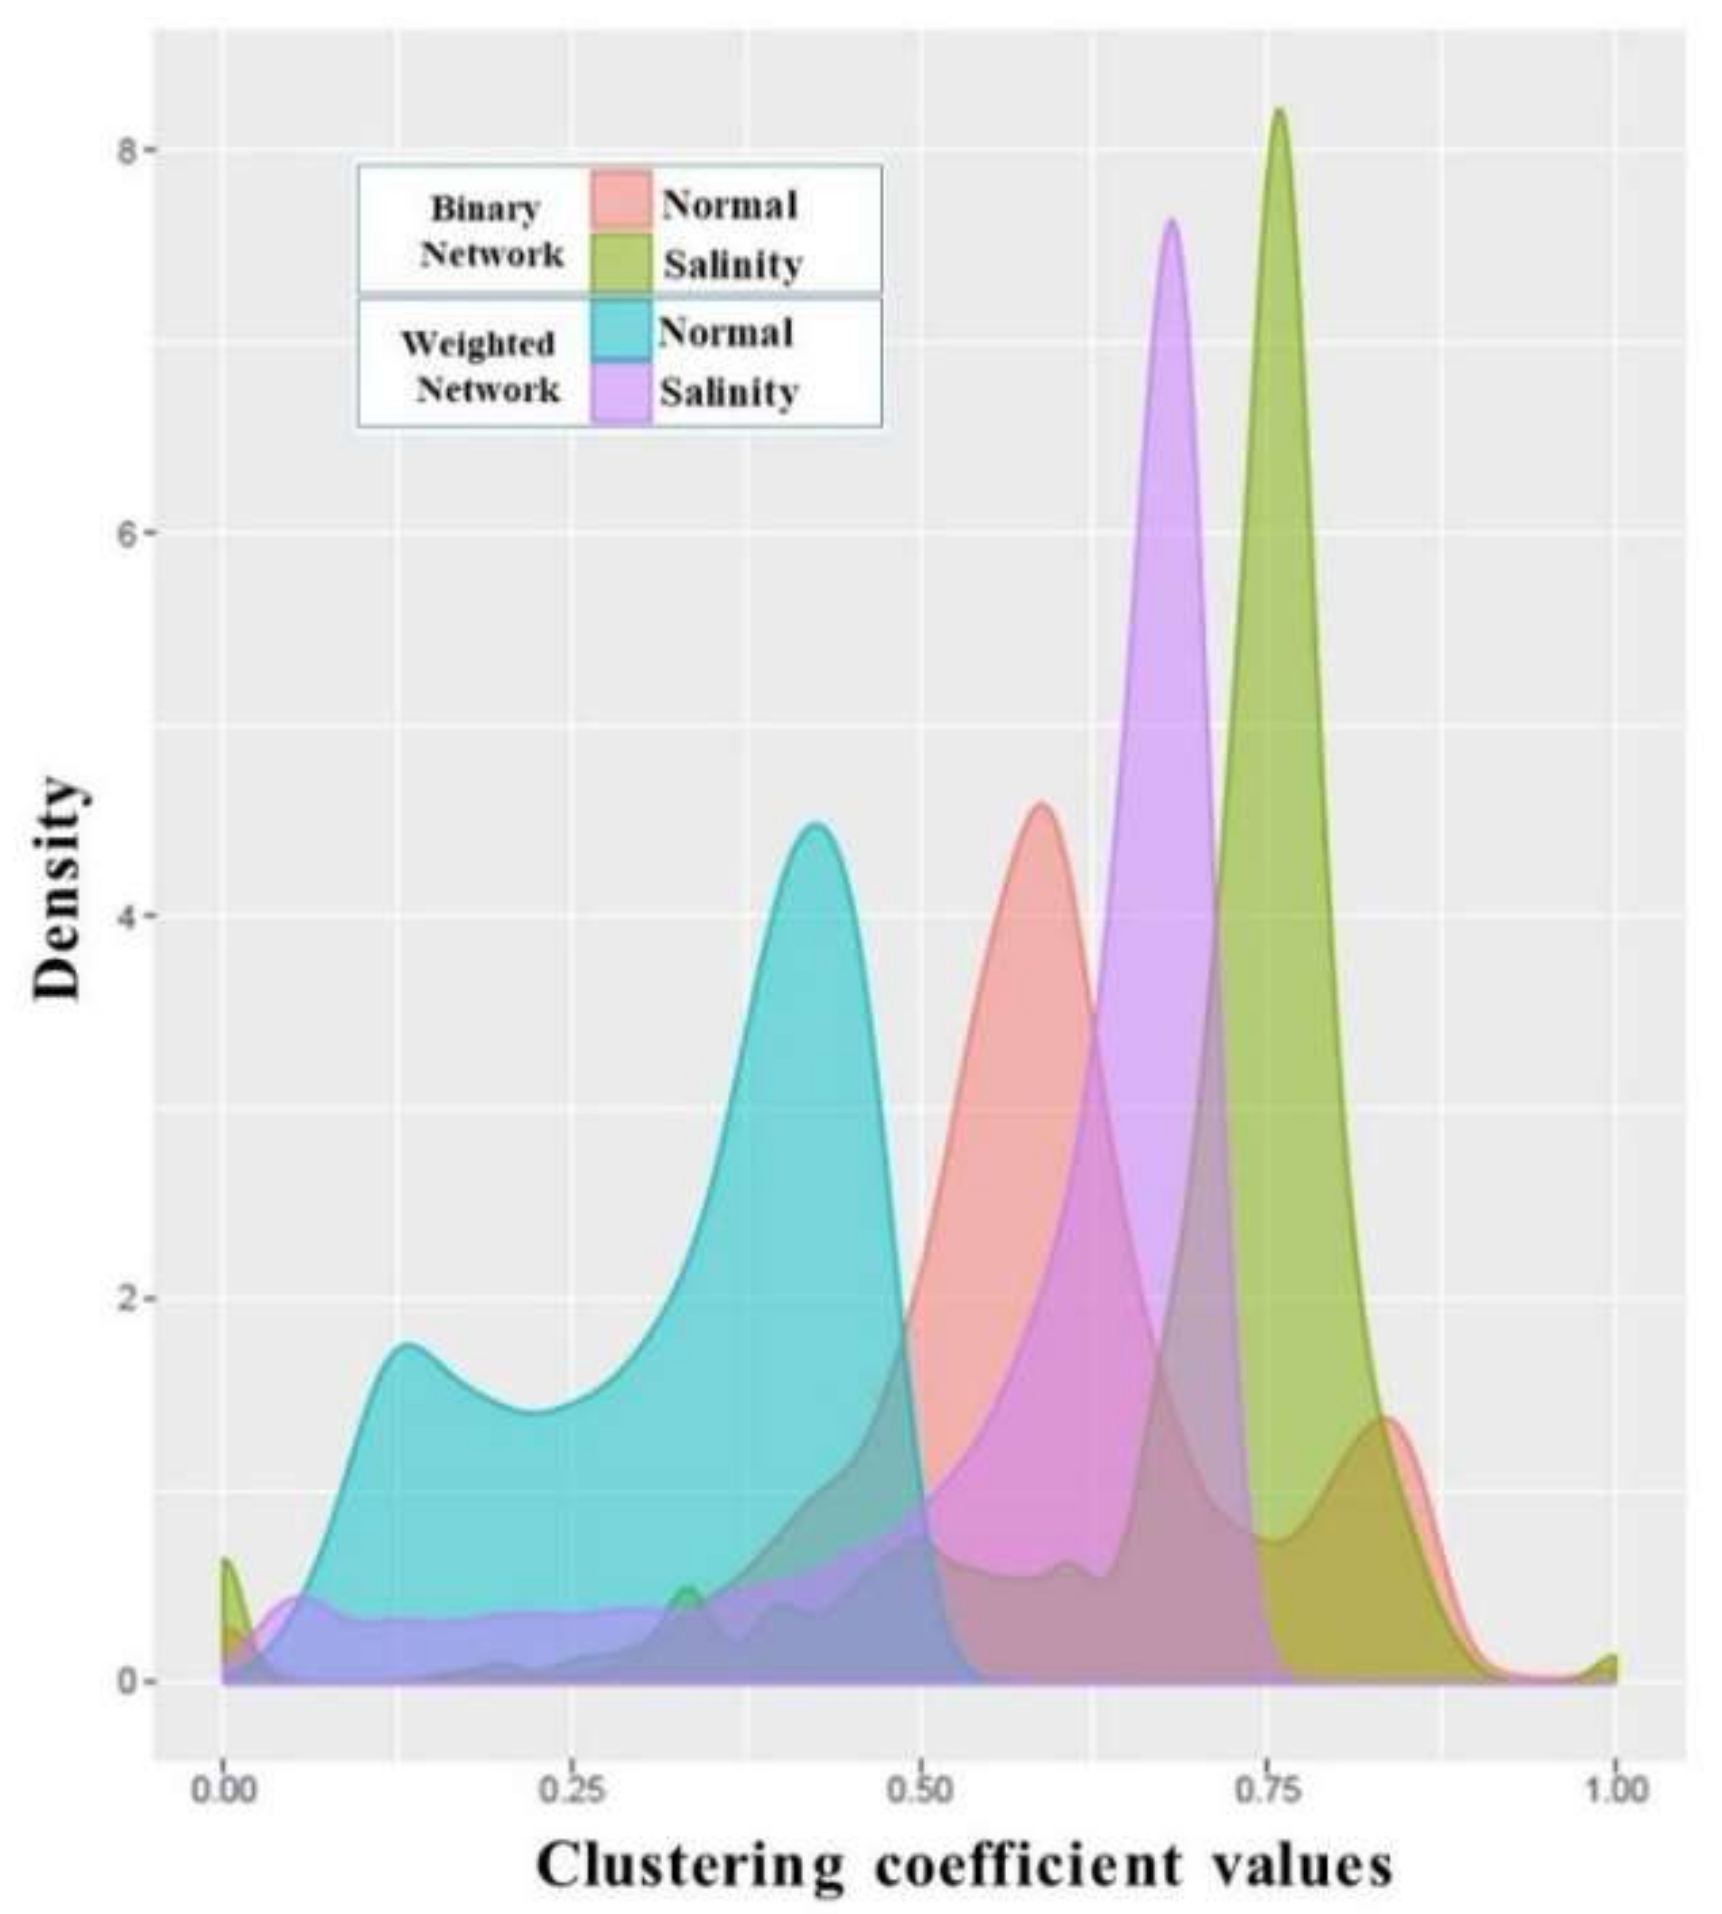
2.4.3. Clustering Coefficient
3. Results
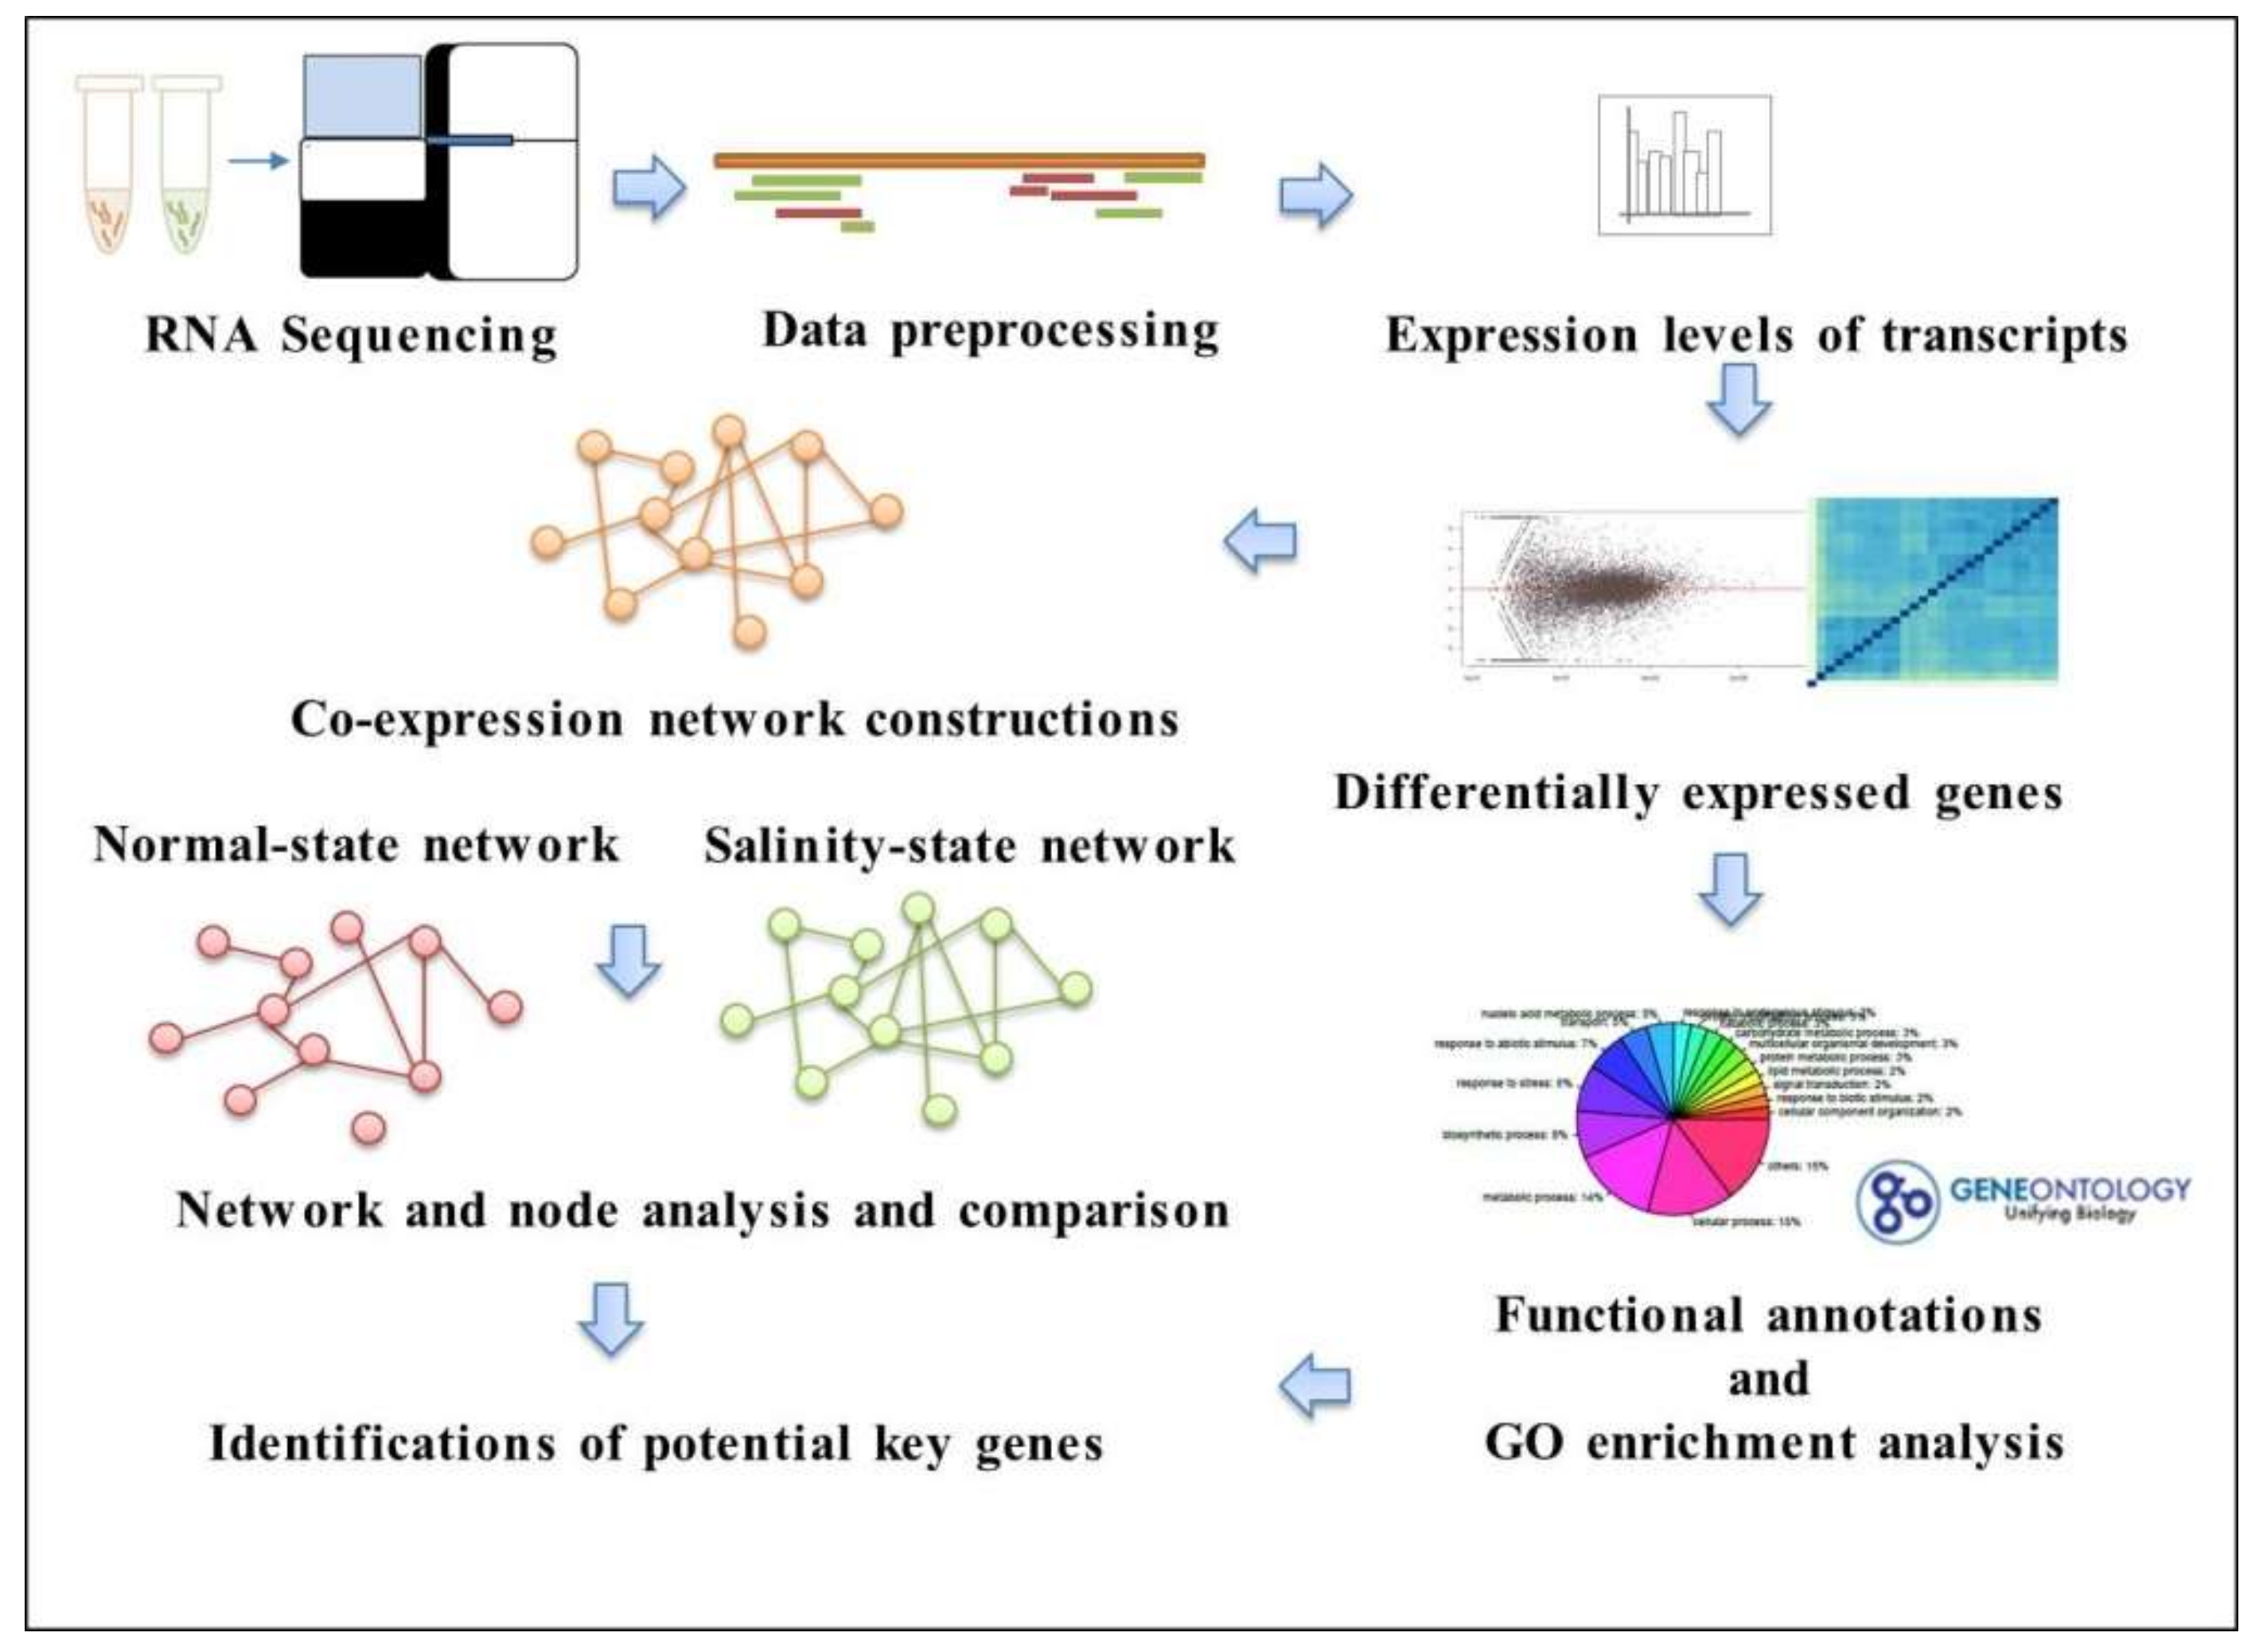
3.1. Overview of the Workflow
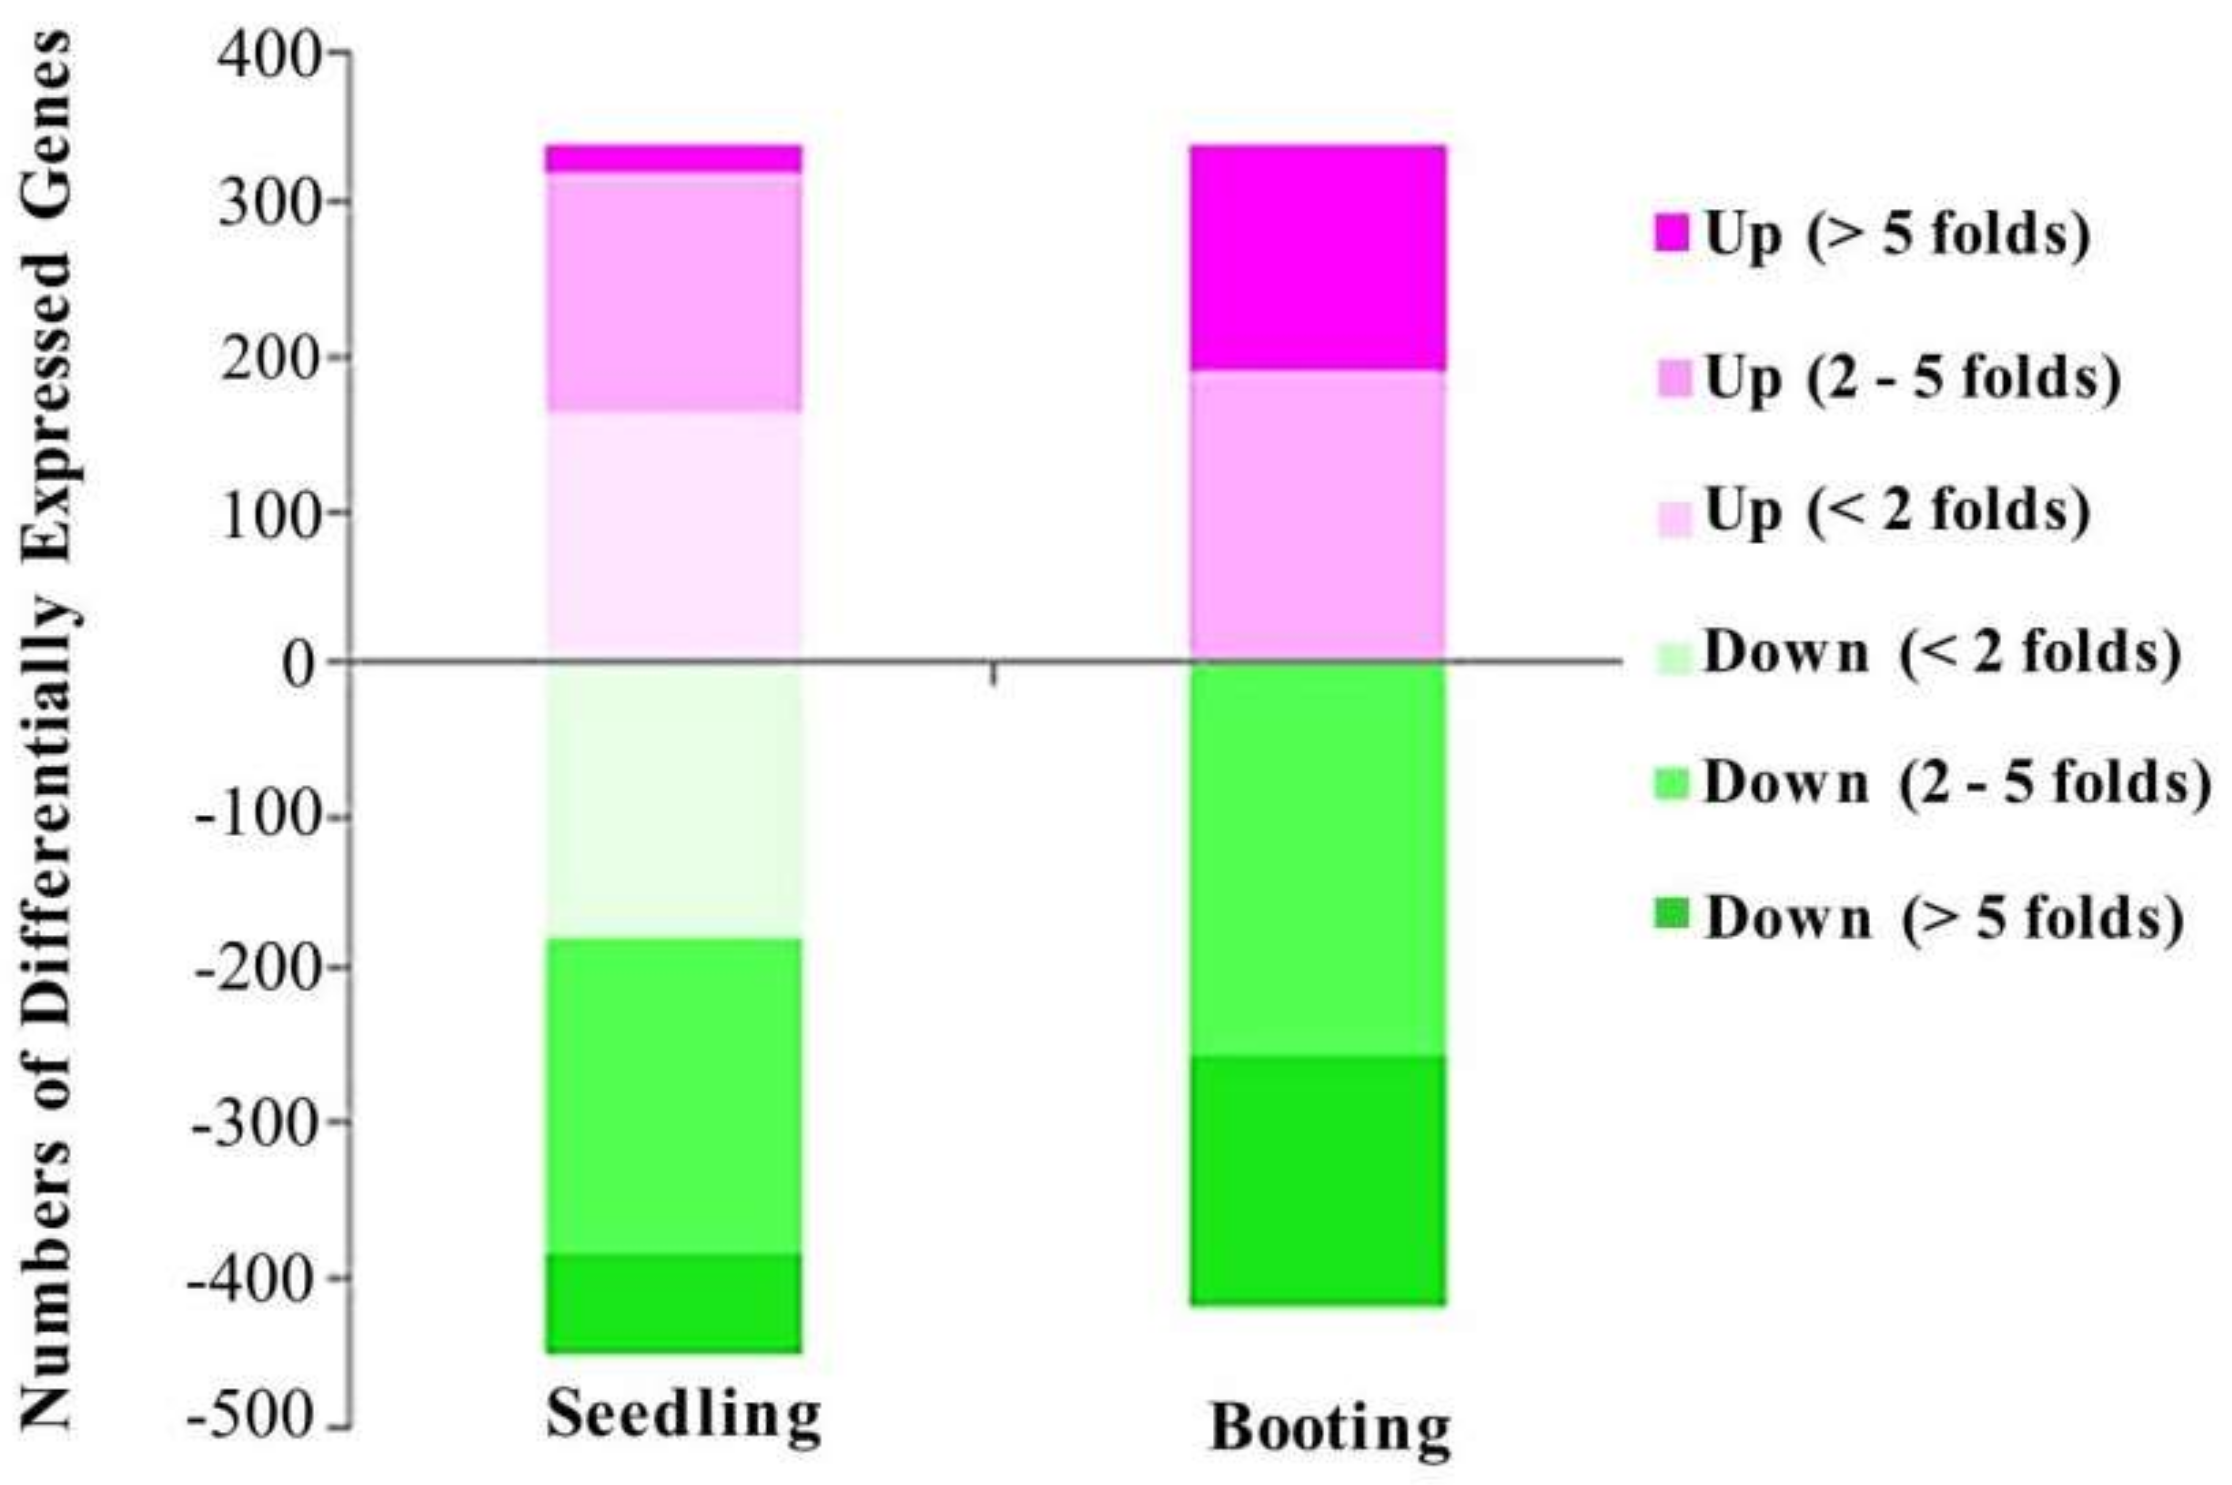
3.2. Identify Differentially Expressed Genes Sensitive to Salinity in Rice
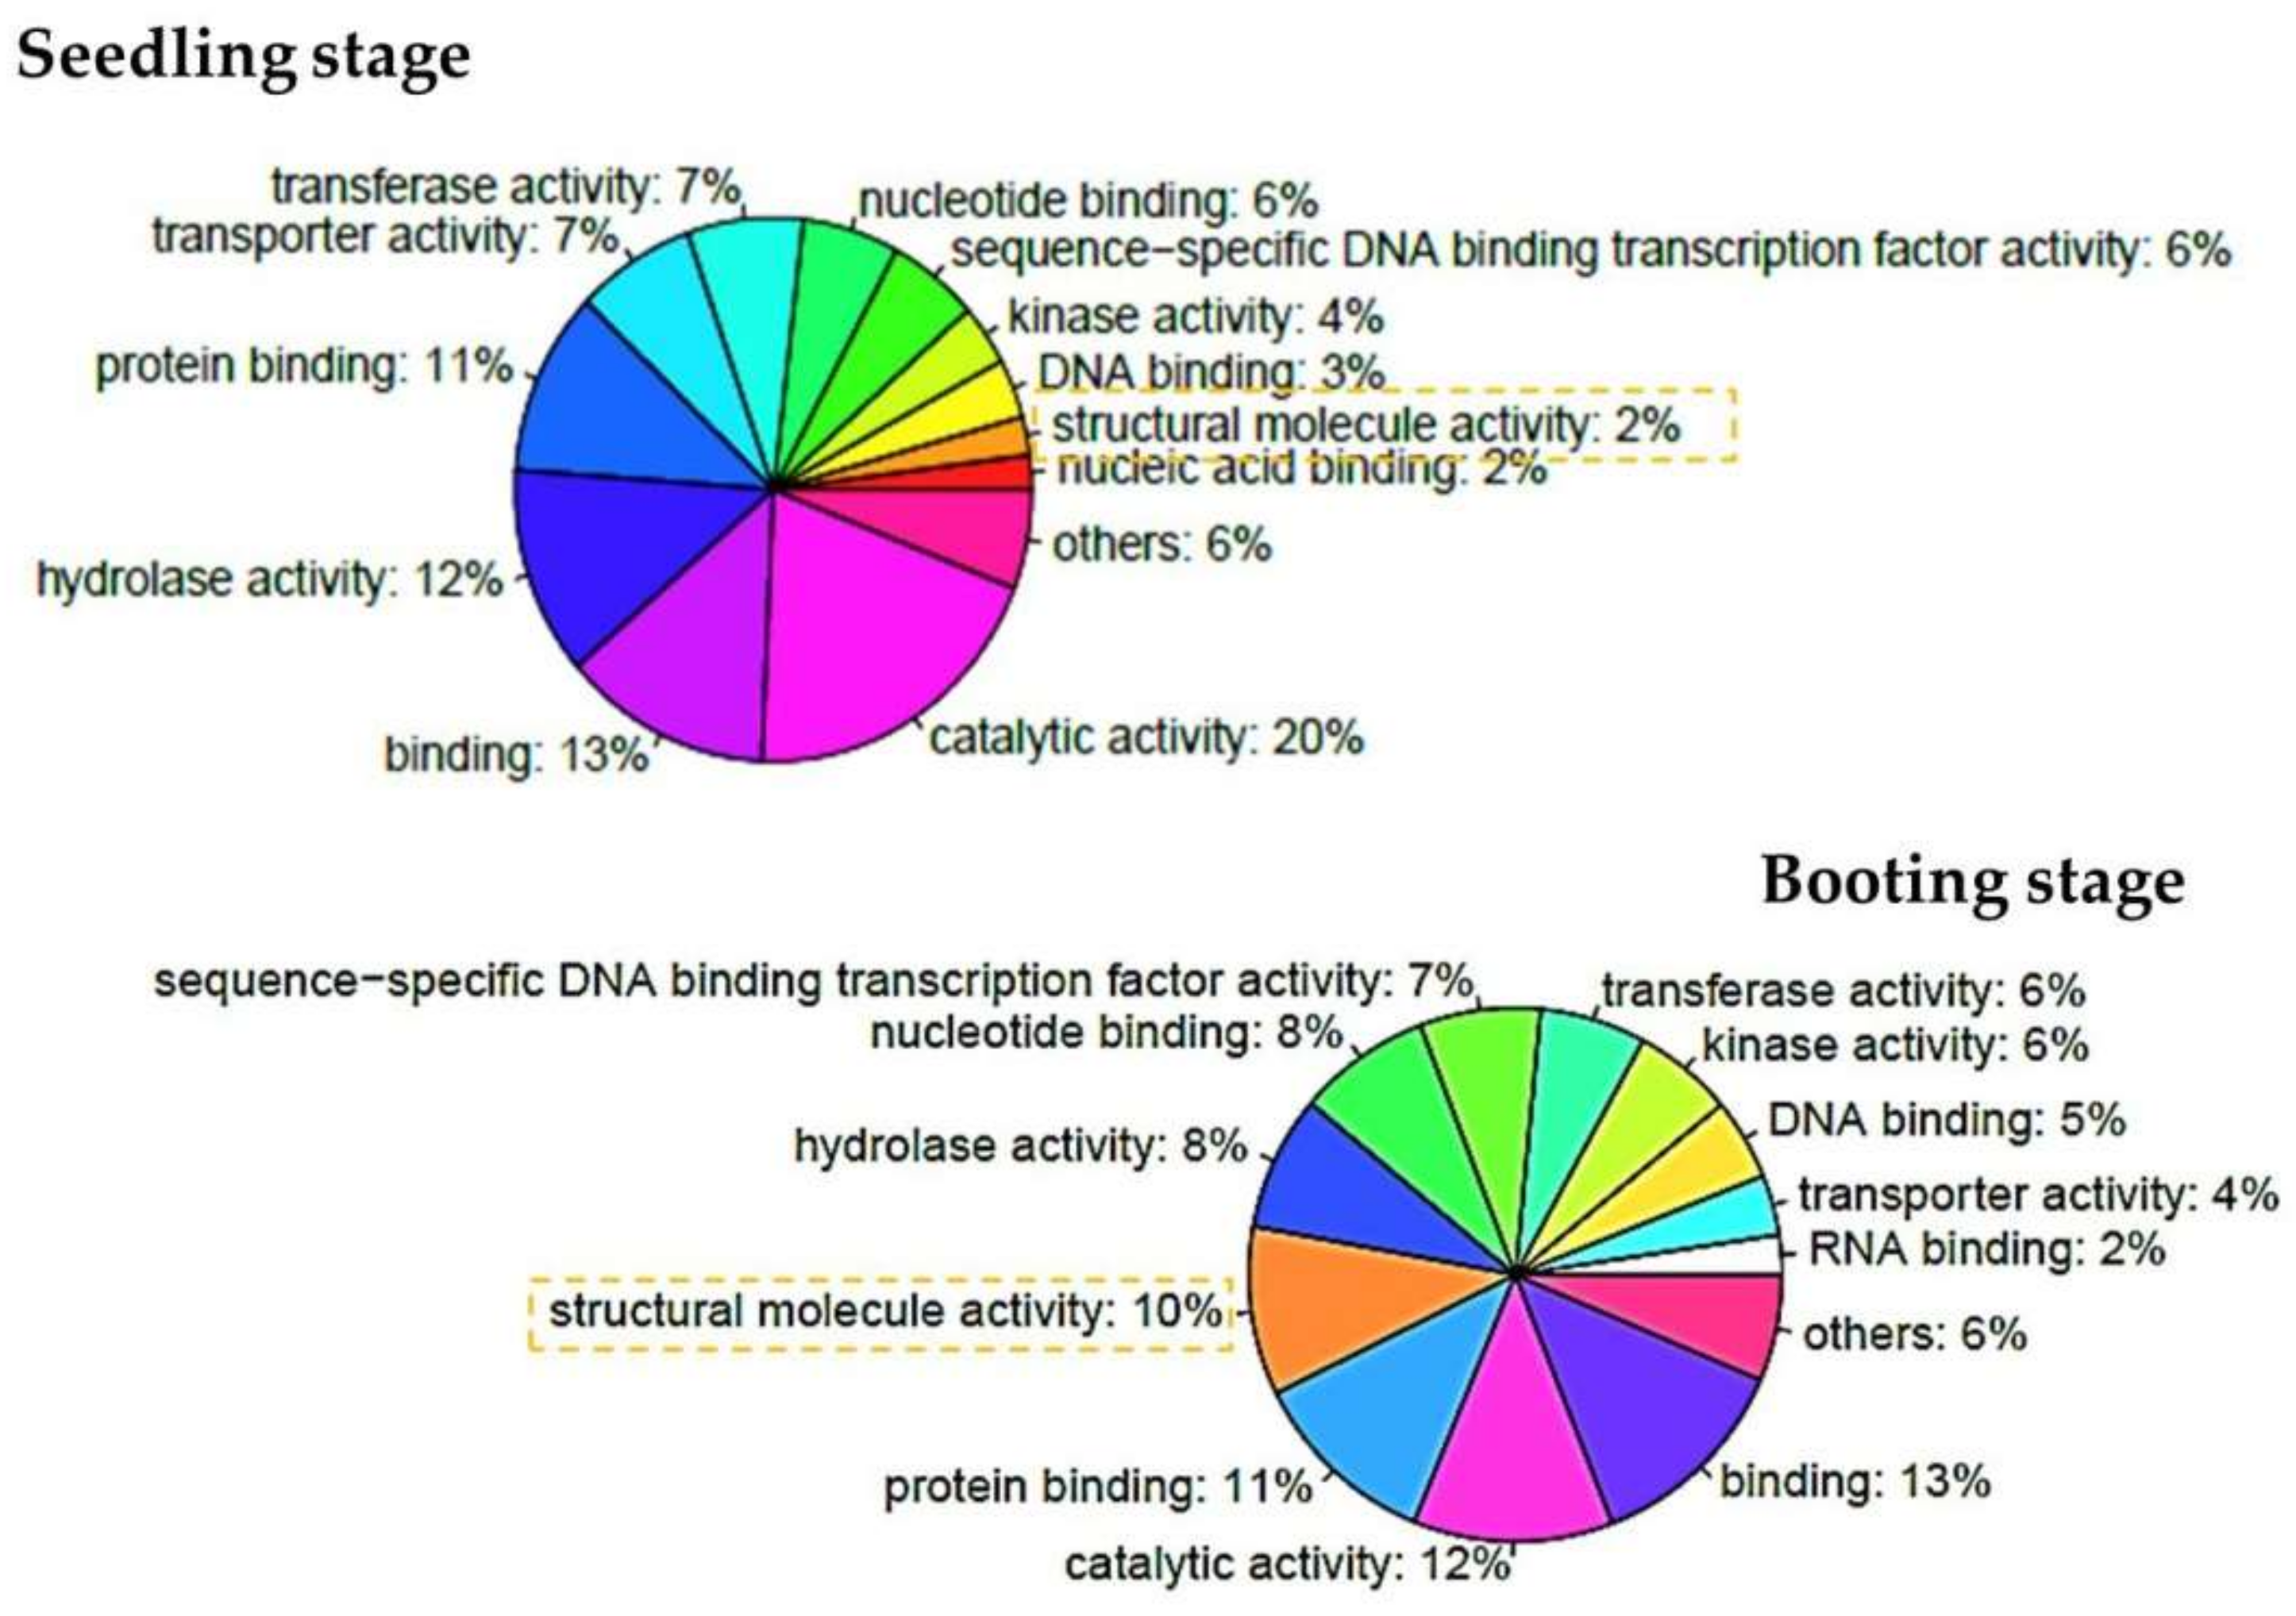
3.3. Functional Annotations of Differentially Expressed Genes
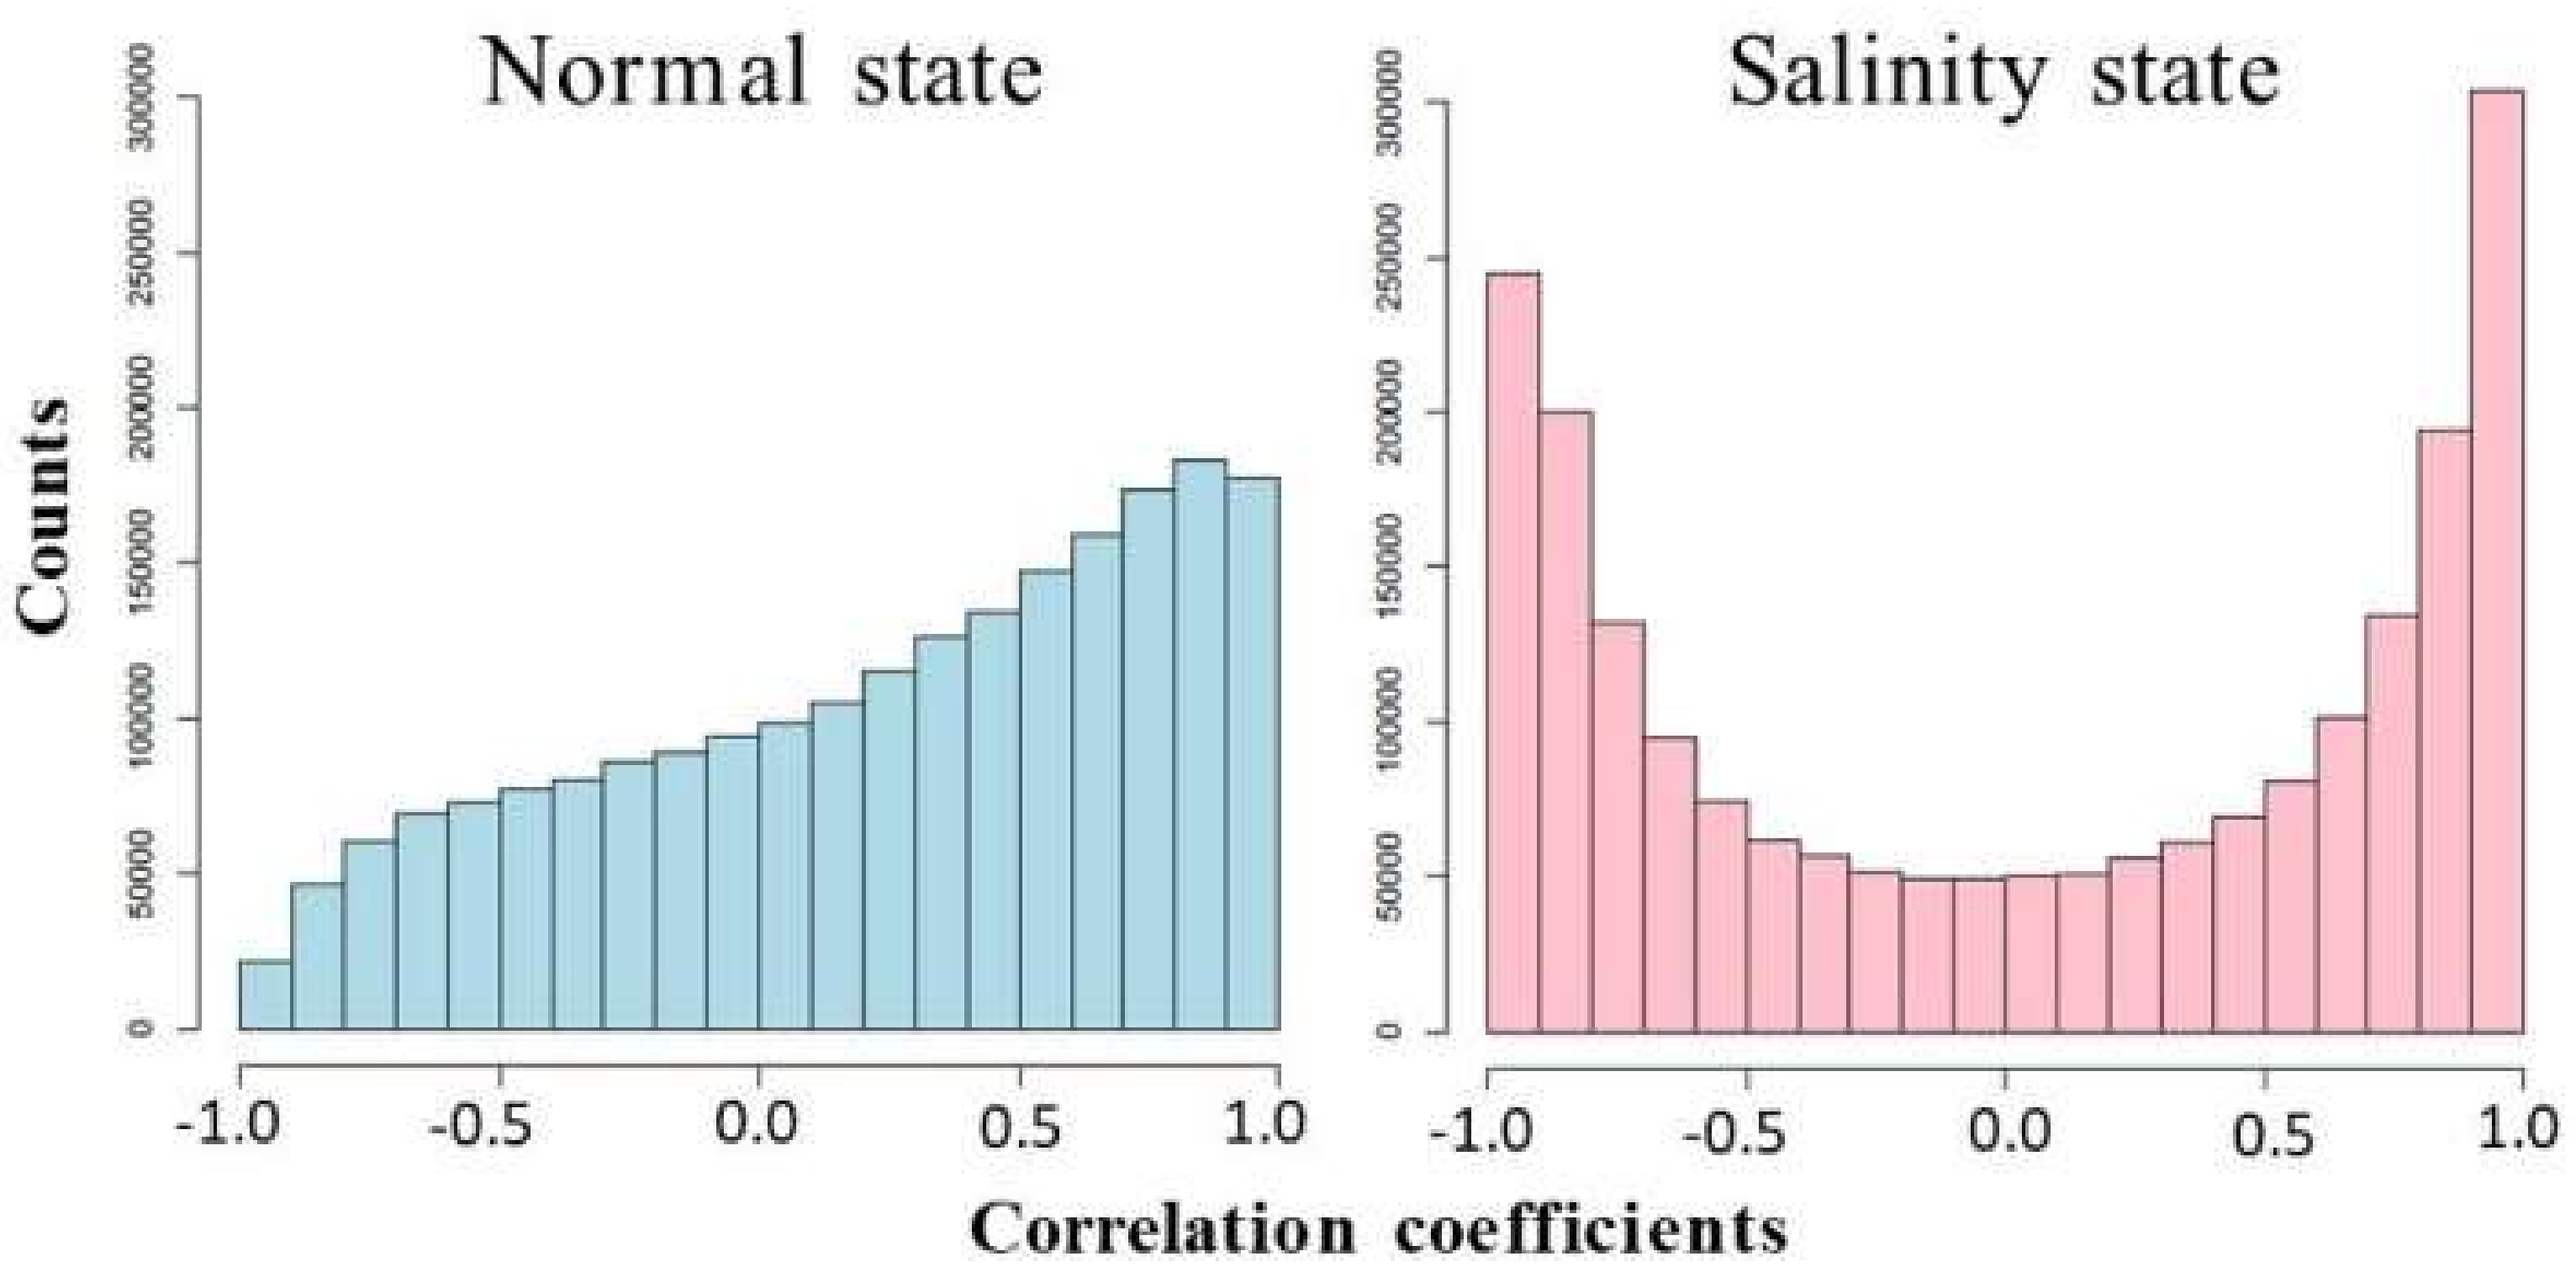
3.4. Analysis of Co-Expression Networks in the Comparison of Salinity and Normal States of Rice
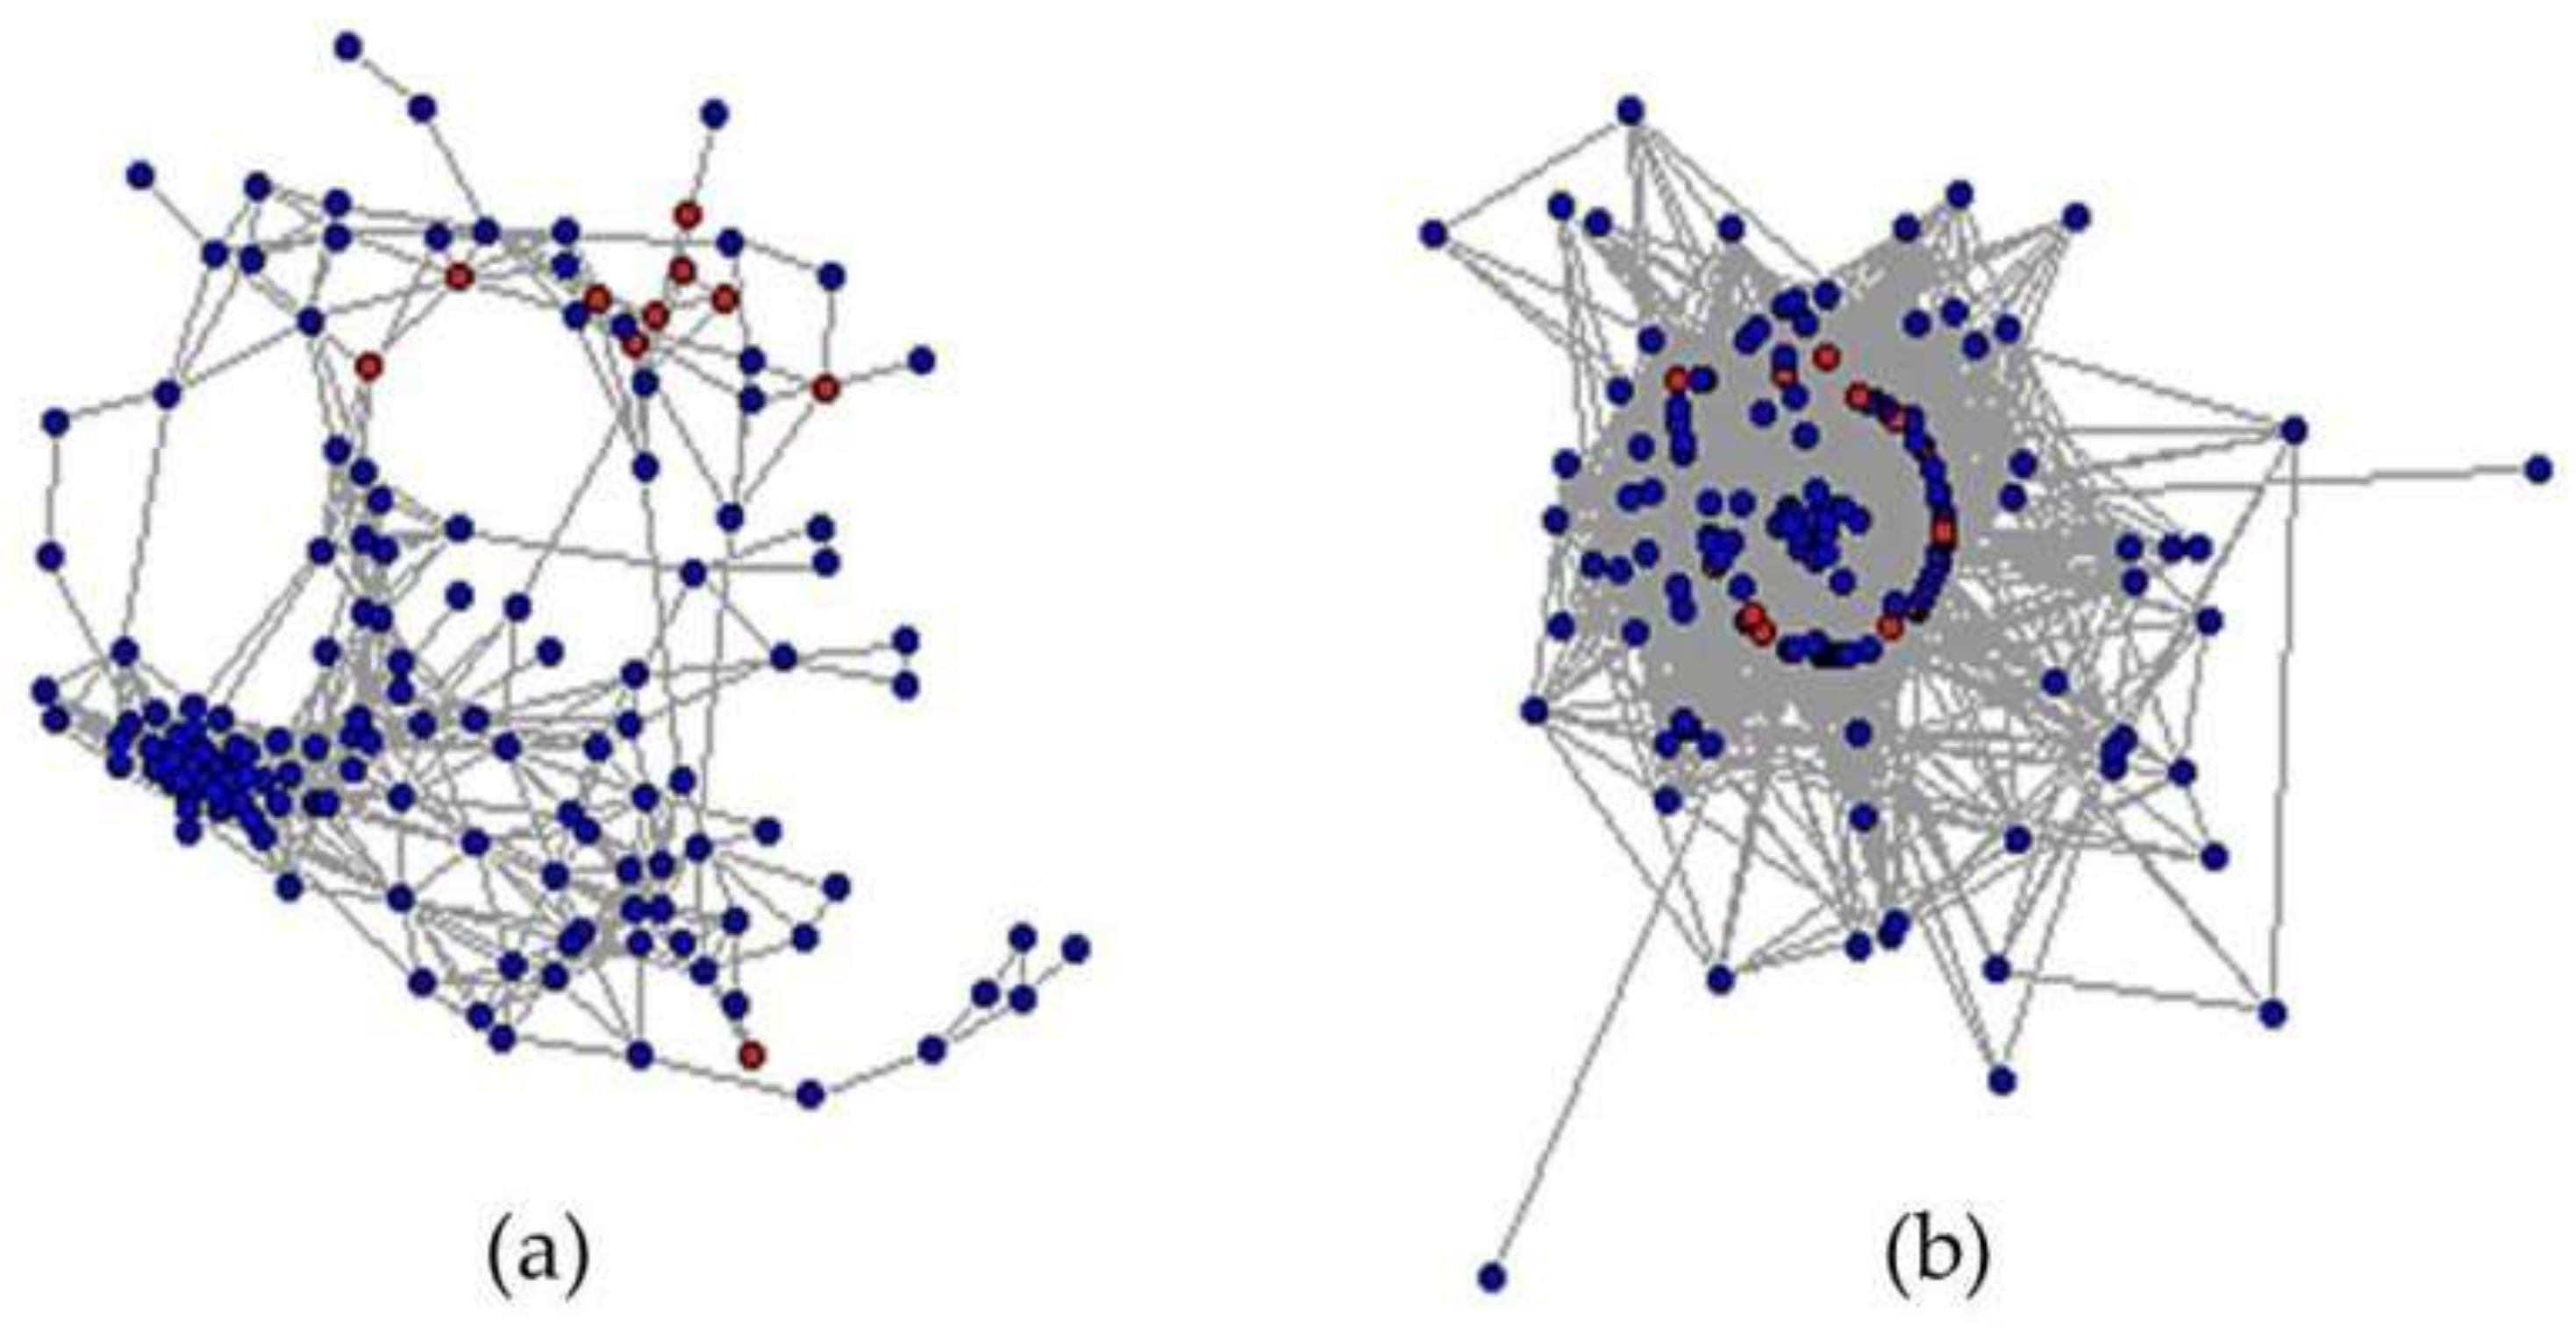
3.5. Candidate Genes Responding to the Salinity Are Less Cooperative in the Normal
4. Discussion and Conclusions
Supplementary Materials
Author Contributions
Funding
Conflicts of Interest
References
- Chunthaburee, S.; Dongsansuk, A.; Sanitchon, J.; Pattanagul, W.; Theerakulpisut, P. Physiological and biochemical parameters for evaluation and clustering of rice cultivars differing in salt tolerance at seedling stage. Saudi J. Biol. Sci. 2016, 23, 467–477. [Google Scholar] [CrossRef] [PubMed]
- Cloonan, N.; Grimmond, S.M. Transcriptome content and dynamics at single-nucleotide resolution. Genome Biol. 2008, 9, 234. [Google Scholar] [CrossRef] [PubMed] [Green Version]
- Zhang, X.; Jiang, H.; Wang, H.; Cui, J.; Wang, J.; Hu, J.; Guo, L.; Qian, Q.; Xue, D. Transcriptome analysis of rice seedling roots in response to potassium deficiency. Sci. Rep. 2017, 7, 5523. [Google Scholar] [CrossRef] [PubMed]
- Oshlack, A.; Robinson, M.D.; Young, M.D. From RNA-seq reads to differential expression results. Genome Biol. 2010, 11, 220. [Google Scholar] [CrossRef] [PubMed] [Green Version]
- Postnikova, O.A.; Shao, J.; Nemchinov, L.G. Analysis of the alfalfa root transcriptome in response to salinity stress. Plant Cell Physiol. 2013, 54, 1041–1055. [Google Scholar] [CrossRef] [PubMed]
- Yang, W.; Yoon, J.; Choi, H.; Fan, Y.; Chen, R.; An, G. Transcriptome analysis of nitrogen-starvation-responsive genes in rice. BMC Plant Biol. 2015, 15, 31. [Google Scholar] [CrossRef] [PubMed]
- Zeng, J.; He, X.; Wu, D.; Zhu, B.; Cai, S.; Nadira, U.A.; Jabeen, Z.; Zhang, G. Comparative transcriptome profiling of two Tibetan wild barley genotypes in responses to low potassium. PLoS ONE 2014, 9, e100567. [Google Scholar] [CrossRef] [PubMed]
- Zeng, X.Q.; Luo, X.M.; Wang, Y.L.; Xu, Q.J.; Bai, L.J.; Yuan, H.J.; Tashi, N. Transcriptome sequencing in a Tibetan barley landrace with high resistance to powdery mildew. Sci. World J. 2014, 2014, 594579. [Google Scholar] [CrossRef] [PubMed]
- Chen, P.; Wang, F.; Feng, J.; Zhou, R.; Chang, Y.; Liu, J.; Zhao, Q. Co-expression network analysis identified six hub genes in association with metastasis risk and prognosis in hepatocellular carcinoma. Oncotarget 2017, 8, 48948–48958. [Google Scholar] [CrossRef] [PubMed]
- Li, J.; Zhou, D.; Qiu, W.; Shi, Y.; Yang, J.J.; Chen, S.; Wang, Q.; Pan, H. Application of weighted gene co-expression network analysis for data from paired design. Sci Rep. 2018, 8, 622. [Google Scholar] [CrossRef] [PubMed]
- Li, Y.; Kikuchi, M.; Li, X.; Gao, Q.; Xiong, Z.; Ren, Y.; Zhao, R.; Mao, B.; Kondo, M.; Irie, N.; et al. Weighted gene co-expression network analysis reveals potential genes involved in early metamorphosis process in sea cucumber Apostichopus japonicus. Biochem. Biophys. Res. Commun. 2018, 495, 1395–1402. [Google Scholar] [CrossRef] [PubMed]
- Luo, J.; Wu, J. A new algorithm for essential proteins identification based on the integration of protein complex co-expression information and edge clustering coefficient. Int. J. Data Min. Bioinform. 2015, 12, 257–274. [Google Scholar] [CrossRef] [PubMed]
- Plaimas, K.; Eils, R.; Konig, R. Identifying essential genes in bacterial metabolic networks with machine learning methods. BMC Syst. Biol. 2010, 4, 56. [Google Scholar] [CrossRef] [PubMed]
- Plaimas, K.; Mallm, J.P.; Oswald, M.; Svara, F.; Sourjik, V.; Eils, R.; Konig, R. Machine learning based analyses on metabolic networks supports high-throughput knockout screens. BMC Syst. Biol. 2008, 2, 67. [Google Scholar] [CrossRef] [PubMed]
- Proost, S.; Krawczyk, A.; Mutwil, M. LSTrAP: Efficiently combining RNA sequencing data into co-expression networks. BMC Bioinform. 2017, 18, 444. [Google Scholar] [CrossRef] [PubMed]
- Ruan, J.; Dean, A.K.; Zhang, W. A general co-expression network-based approach to gene expression analysis: Comparison and applications. BMC Syst. Biol. 2010, 4, 8. [Google Scholar] [CrossRef] [PubMed]
- Zhang, B.; Horvath, S. A general framework for weighted gene co-expression network analysis. Stat. Appl. Genet. Mol. Biol. 2005, 4, 17. [Google Scholar] [CrossRef] [PubMed]
- Ekman, D.; Light, S.; Bjorklund, A.K.; Elofsson, A. What properties characterize the hub proteins of the protein-protein interaction network of Saccharomyces cerevisiae? Genome Biol. 2006, 7, R45. [Google Scholar] [CrossRef] [PubMed]
- The International Cancer Genome Consortium; Hudson, T.J.; Anderson, W.; Artez, A.; Barker, A.D.; Bell, C.; Bernabe, R.R.; Bhan, M.K.; Calvo, F.; Eerola, I.; et al. International network of cancer genome projects. Nature 2010, 464, 993–998. [Google Scholar] [CrossRef] [PubMed] [Green Version]
- Chan, K.Y.; Vitevitch, M.S. The influence of the phonological neighborhood clustering coefficient on spoken word recognition. J. Exp. Psychol. Hum. Percept. Perform. 2009, 35, 1934–1949. [Google Scholar] [CrossRef] [PubMed]
- Goldstein, R.; Vitevitch, M.S. The influence of clustering coefficient on word-learning: How groups of similar sounding words facilitate acquisition. Front. Psychol. 2014, 5, 1307. [Google Scholar] [CrossRef] [PubMed]
- Hao, D.; Ren, C.; Li, C. Revisiting the variation of clustering coefficient of biological networks suggests new modular structure. BMC Syst. Biol. 2012, 6, 34. [Google Scholar] [CrossRef] [PubMed]
- Kalna, G.; Higham, D.J. A clustering coefficient for weighted networks, with application to gene expression data. AI Commun. Netw. Anal. Nat. Sci. Eng. 2007, 20, 263–271. [Google Scholar]
- Lakizadeh, A.; Jalili, S.; Marashi, S.A. CAMWI: Detecting protein complexes using weighted clustering coefficient and weighted density. Comput. Biol. Chem. 2015, 58, 231–240. [Google Scholar] [CrossRef] [PubMed]
- Lin, C.C.; Lee, C.H.; Fuh, C.S.; Juan, H.F.; Huang, H.C. Link clustering reveals structural characteristics and biological contexts in signed molecular networks. PLoS ONE 2013, 8, e67089. [Google Scholar] [CrossRef] [PubMed]
- Fatumo, S.; Plaimas, K.; Mallm, J.P.; Schramm, G.; Adebiyi, E.; Oswald, M.; Eils, R.; Konig, R. Estimating novel potential drug targets of Plasmodium falciparum by analysing the metabolic network of knock-out strains in silico. Infect. Genet. Evol. 2009, 9, 351–358. [Google Scholar] [CrossRef] [PubMed]
- Saramaki, J.; Kivela, M.; Onnela, J.P.; Kaski, K.; Kertesz, J. Generalizations of the clustering coefficient to weighted complex networks. Phys. Rev. E Stat. Nonlinear Soft Matter Phys. 2007, 75, 027105. [Google Scholar] [CrossRef] [PubMed]
- Onnela, J.; Saramäki, J.; Kertész, J.; Kaski, K. Intensity and coherence of motifs in weighted complex networks. Phys. Rev. E 2005, 71, 065103(R). [Google Scholar] [CrossRef] [PubMed]
- Huang, L.; Wang, G.; Wang, Y.; Blanzieri, E.; Su, C. Link clustering with extended link similarity and EQ evaluation division. PLoS ONE 2013, 8, e66005. [Google Scholar] [CrossRef] [PubMed]
- Kuperman, M.N.; Risau-Gusman, S. Relationship between clustering coefficient and the success of cooperation in networks. Phys. Rev. E Stat. Nonlinear Soft Matter Phys. 2012, 86, 016104. [Google Scholar] [CrossRef] [PubMed]
- Mcassey, M.P.; Bijma, F. A clustering coefficient for complete weighted networks. Netw. Sci. 2015, 3, 183–195. [Google Scholar] [CrossRef]
- Rodriguez-Mendez, V.; Ser-Giacomi, E.; Hernandez-Garcia, E. Clustering coefficient and periodic orbits in flow networks. Chaos 2017, 27, 035803. [Google Scholar] [CrossRef] [PubMed] [Green Version]
- Song, Y.; Qiao, Y.; Wu, Y. lustering analysis of karyotype resemblance-near coefficient for 6 Bupleurum species. Zhongguo Zhong Yao Za Zhi 2012, 37, 1157–1160. [Google Scholar] [PubMed]
- Udomchalothorn, T.; Plaimas, K.; Sripinyowanich, S.; Boonchai, C.; Kojonna, T.; Chutimanukul, P.; Comai, L.; Buaboocha, T.; Chadchawan, S. OsNucleolin1-L expression in Arabidopsis enhances photosynthesis via transcriptome modification under salt stress conditions. Plant Cell Physiol. 2017, 58, 717–734. [Google Scholar] [CrossRef] [PubMed]
- Kawahara, Y.; de la Bastide, M.; Hamilton, J.P.; Kanamori, H.; McCombie, W.R.; Ouyang, S.; Schwartz, D.C.; Tanaka, T.; Wu, J.; Zhou, S.; et al. Improvement of the Oryza sativa Nipponbare reference genome using next generation sequence and optical map data. Rice (N. Y.) 2013, 6, 4. [Google Scholar] [CrossRef] [PubMed]
- Missirian, V.; Henry, I.; Comai, L.; Filkov, V. POPE: Pipeline of Parentally-Biased Expression. In Bioinformatics Research and Applications; Lecture Notes in Computer Science; Springer: Berlin/Heidelberg, Germany, 2012; pp. 177–188. [Google Scholar]
- Missirian, V.; Comai, L.; Filkov, V. Statistical mutation calling from sequenced overlapping DNA pools in TILLING experiments. BMC Bioinform. 2011, 12, 287. [Google Scholar] [CrossRef] [PubMed]
- Langmead, B.; Salzberg, S.L. Fast gapped-read alignment with Bowtie 2. Nat. Methods 2012, 9, 357–359. [Google Scholar] [CrossRef] [PubMed] [Green Version]
- Trapnell, C.; Pachter, L.; Salzberg, S.L. TopHat: Discovering splice junctions with RNA-seq. Bioinformatics 2009, 25, 1105–1111. [Google Scholar] [CrossRef] [PubMed]
- Anders, S.; Huber, W. Differential expression analysis for sequence count data. Genome Biol. 2010, 11, R106. [Google Scholar] [CrossRef] [PubMed]
- Newman, M.E. Assortative mixing in networks. Phys. Rev. Lett. 2002, 89, 208701. [Google Scholar] [CrossRef] [PubMed]
- West, D.B. Introduction to Graph Theory, 2nd ed.; Prentice Hall: Upper Saddle River, NJ, USA, 2001; 588p. [Google Scholar]
- Watts, D.J.; Strogatz, S.H. Collective dynamics of ‘small-world’ networks. Nature 1998, 393, 440–442. [Google Scholar] [CrossRef] [PubMed]
- Cui, X.Y.; Du, Y.T.; Fu, J.D.; Yu, T.F.; Wang, C.T.; Chen, M.; Chen, J.; Ma, Y.Z.; Xu, Z.S. Wheat CBL-interacting protein kinase 23 positively regulates drought stress and ABA responses. BMC Plant Biol. 2018, 18, 93. [Google Scholar] [CrossRef] [PubMed]
- Egea, I.; Pineda, B.; Ortiz-Atienza, A.; Plasencia, F.A.; Drevensek, S.; Garcia-Sogo, B.; Yuste-Lisbona, F.J.; Barrero-Gil, J.; Atares, A.; Flores, F.B.; et al. The SlCBL10 calcineurin B-like protein ensures plant growth under salt stress by regulating Na+ and Ca2+ homeostasis. Plant Physiol. 2018, 176, 1676–1693. [Google Scholar] [CrossRef] [PubMed]
- Jung, H.; Kayum, M.A.; Thamilarasan, S.K.; Nath, U.K.; Park, J.; Chung, M.; Nou, I. Molecular characterisation and expression profiling of calcineurin B-like (CBL) genes in chinese cabbage under abiotic stresses. Funct. Plant. Biol. 2017, 44, 739–750. [Google Scholar] [CrossRef]
- Hima Kumari, P.; Anil Kumar, S.; Ramesh, K.; Sudhakar Reddy, P.; Nagaraju, M.; Bhanu Prakash, A.; Shah, T.; Henderson, A.; Srivastava, R.K.; Rajasheker, G.; et al. Genome-wide identification and analysis of Arabidopsis sodium proton antiporter (NHX) and human sodium proton exchanger (NHE) homologs in sorghum bicolor. Genes 2018, 9, 236. [Google Scholar] [CrossRef] [PubMed]
- Li, J.; Jiang, M.M.; Ren, L.; Liu, Y.; Chen, H.Y. Identification and characterization of CBL and CIPK gene families in eggplant (Solanum melongena L.). Mol. Genet. Genomics 2016, 291, 1769–1781. [Google Scholar] [CrossRef] [PubMed]
- Luo, Q.; Wei, Q.; Wang, R.; Zhang, Y.; Zhang, F.; He, Y.; Zhou, S.; Feng, J.; Yang, G.; He, G. BdCIPK31, a calcineurin B-like protein-interacting protein kinase, regulates plant response to drought and salt stress. Front. Plant Sci. 2017, 8, 1184. [Google Scholar] [CrossRef] [PubMed]
- Miranda, R.S.; Alvarez-Pizarro, J.C.; Costa, J.H.; Paula, S.O.; Prisco, J.T.; Gomes-Filho, E. Putative role of glutamine in the activation of CBL/CIPK signalling pathways during salt stress in sorghum. Plant Signal. Behav. 2017, 12, e1361075. [Google Scholar] [CrossRef] [PubMed]
- Mo, C.; Wan, S.; Xia, Y.; Ren, N.; Zhou, Y.; Jiang, X. Expression patterns and identified protein-protein interactions suggest that cassava CBL-CIPK signal networks function in responses to abiotic stresses. Front. Plant Sci. 2018, 9, 269. [Google Scholar] [CrossRef] [PubMed]
- Sui, J.; Jiang, P.; Qin, G.; Gai, S.; Zhu, D.; Qiao, L.; Wang, J. Transcriptome profiling and digital gene expression analysis of genes associated with salinity resistance in peanut. Electron. J. Biotechnol. 2018, 32, 19–25. [Google Scholar] [CrossRef]
- Wang, J.J.; Lu, X.K.; Yin, Z.J.; Mu, M.; Zhao, X.J.; Wang, D.L.; Wang, S.; Fan, W.L.; Guo, L.X.; Ye, W.W.; et al. Genome-wide identification and expression analysis of CIPK genes in diploid cottons. Genet. Mol. Res. 2016, 15. [Google Scholar] [CrossRef] [PubMed]
- Xu, L.; Zhang, D.; Xu, Z.; Huang, Y.; He, X.; Wang, J.; Gu, M.; Li, J.; Shao, H. Comparative expression analysis of Calcineurin B-like family gene CBL10A between salt-tolerant and salt-sensitive cultivars in B. oleracea. Sci. Total Environ. 2016, 571, 1–10. [Google Scholar] [CrossRef] [PubMed]
- Yin, X.; Wang, Q.; Chen, Q.; Xiang, N.; Yang, Y.; Yang, Y. Genome-wide identification and functional analysis of the calcineurin B-like protein and calcineurin B-like protein-interacting protein kinase gene families in turnip (Brassica rapa var. rapa). Front. Plant Sci. 2017, 8, 1191. [Google Scholar] [CrossRef] [PubMed]
- Zhang, F.; Li, L.; Jiao, Z.; Chen, Y.; Liu, H.; Chen, X.; Fu, J.; Wang, G.; Zheng, J. Characterization of the calcineurin B-Like (CBL) gene family in maize and functional analysis of ZmCBL9 under abscisic acid and abiotic stress treatments. Plant Sci. 2016, 253, 118–129. [Google Scholar] [CrossRef] [PubMed]
- Zhang, Y.; Linghu, J.; Wang, D.; Liu, X.; Yu, A.; Li, F.; Zhao, T. Foxtail millet CBL4 (SiCBL4) interacts with SiCIPK24, modulates plant salt stress tolerance. Plant Mol. Biol. Report. 2017, 35, 634–646. [Google Scholar] [CrossRef]
- Chen, H.; Liu, L.; Wang, L.; Wang, S.; Cheng, X. VrDREB2A, a DREB-binding transcription factor from Vigna radiata, increased drought and high-salt tolerance in transgenic Arabidopsis thaliana. J. Plant Res. 2016, 129, 263–273. [Google Scholar] [CrossRef] [PubMed]
- Dong, L.; Cheng, Y.; Wu, J.; Cheng, Q.; Li, W.; Fan, S.; Jiang, L.; Xu, Z.; Kong, F.; Zhang, D.; et al. Overexpression of GmERF5, a new member of the soybean EAR motif-containing ERF transcription factor, enhances resistance to Phytophthora sojae in soybean. J. Exp. Bot. 2015, 66, 2635–2647. [Google Scholar] [CrossRef] [PubMed]
- Duan, Y.B.; Li, J.; Qin, R.Y.; Xu, R.F.; Li, H.; Yang, Y.C.; Ma, H.; Li, L.; Wei, P.C.; Yang, J.B. Identification of a regulatory element responsible for salt induction of rice OsRAV2 through ex situ and in situ promoter analysis. Plant Mol. Biol. 2016, 90, 49–62. [Google Scholar] [CrossRef] [PubMed]
- Ebrahimi, M.; Abdullah, S.N.A.; Aziz, M.A.; Namasivayam, P. A novel CBF that regulates abiotic stress response and the ripening process in oil palm (Elaeis guineensis) fruits. Tree Genet. Genomes 2015, 11. [Google Scholar] [CrossRef]
- Gao, W.; He, M.; Liu, J.; Ma, X.; Zhang, Y.; Dai, S.; Zhou, Y. Overexpression of Chrysanthemum lavandulifolium ClCBF1 in Chrysanthemum morifolium ‘White Snow’ improves the level of salinity and drought tolerance. Plant Physiol. Biochem. 2018, 124, 50–58. [Google Scholar] [CrossRef] [PubMed]
- Gumi, A.M.; Guha, P.K.; Mazumder, A.; Jayaswal, P.; Mondal, T.K. Characterization of OglDREB2A gene from African rice (Oryza glaberrima), comparative analysis and its transcriptional regulation under salinity stress. 3 Biotech 2018, 8, 91. [Google Scholar] [CrossRef] [PubMed]
- Jin, B.L.; Xue, N.D.; Zhi, L.; Yong, L.L.; Pei, Y.Y.; Fei, T.; Liang, Z.; Shi, G.L.; Lin, F.D.; Ji, R.S.; Yan, M.W.; et al. Simultaneous overexpression of the HhERF2 and PeDREB2a genes enhanced tolerances to salt and drought in transgenic cotton. Protein Pept. Lett. 2016, 23, 450–458. [Google Scholar]
- Li, X.J.; Li, M.; Zhou, Y.; Hu, S.; Hu, R.; Chen, Y.; Li, X.B. Overexpression of cotton RAV1 gene in Arabidopsis confers transgenic plants high salinity and drought sensitivity. PLoS ONE 2015, 10, e0118056. [Google Scholar] [CrossRef] [PubMed]
- Mondini, L.; Nachit, M.M.; Pagnotta, M.A. Allelic variants in durum wheat (Triticum turgidum L. var. durum) DREB genes conferring tolerance to abiotic stresses. Mol. Genet. Genomics 2015, 290, 531–544. [Google Scholar] [CrossRef] [PubMed]
- Peng, Y.L.; Wang, Y.S.; Cheng, H.; Wang, L.Y. Characterization and expression analysis of a gene encoding CBF/DREB1 transcription factor from mangrove Aegiceras corniculatum. Ecotoxicology 2015, 24, 1733–1743. [Google Scholar] [CrossRef] [PubMed]
- Tang, M.; Liu, X.; Deng, H.; Shen, S. Over-expression of JcDREB, a putative AP2/EREBP domain-containing transcription factor gene in woody biodiesel plant Jatropha curcas, enhances salt and freezing tolerance in transgenic Arabidopsis thaliana. Plant Sci. 2011, 181, 623–631. [Google Scholar] [CrossRef] [PubMed]
- Yang, G.; Chen, X.; Tang, T.; Zhou, R.; Chen, S.; Li, W.; Shi, S. Comparative genomics of two ecologically differential populations of Hibiscus tiliaceus under salt stress. Funct. Plant Biol. 2011, 38, 199–208. [Google Scholar] [CrossRef]
- Yang, S.; Luo, C.; Song, Y.; Wang, J. Two groups of Thellungiella salsuginea RAVs exhibit distinct responses and sensitivity to salt and ABA in transgenic Arabidopsis. PLoS ONE 2016, 11, e0153517. [Google Scholar] [CrossRef] [PubMed]
- Chen, Z.; Li, M.; Yuan, Y.; Hu, J.; Yang, Y.; Pang, J.; Wang, L. Ectopic expression of cucumber (Cucumis sativus L.) CsTIR/AFB genes enhance salt tolerance in transgenic arabidopsis. Plant Cell Tissue Organ Cult. 2017, 131, 107–118. [Google Scholar] [CrossRef]
- Li, W.; Zhao, F.; Fang, W.; Xie, D.; Hou, J.; Yang, X.; Zhao, Y.; Tang, Z.; Nie, L.; Lv, S. Identification of early salt stress responsive proteins in seedling roots of upland cotton (Gossypium hirsutum L.) employing iTRAQ-based proteomic technique. Front. Plant Sci. 2015, 6, 732. [Google Scholar] [CrossRef] [PubMed]
- Park, S.; Moon, J.C.; Park, Y.C.; Kim, J.H.; Kim, D.S.; Jang, C.S. Molecular dissection of the response of a rice leucine-rich repeat receptor-like kinase (LRR-RLK) gene to abiotic stresses. J. Plant Physiol. 2014, 171, 1645–1653. [Google Scholar] [CrossRef] [PubMed]
- Reza, K.A.; Sharmin, S.; Moosa, M.M.; Mahmood, N.; Ghosh, A.; Begum, R.A.; Khan, H. Identification and molecular characterization of a receptor-like protein kinase gene from Corchorus capsularis. Turkish J. Biol. 2013, 37, 11–17. [Google Scholar] [CrossRef]
- Shi, C.C.; Feng, C.C.; Yang, M.M.; Li, J.L.; Li, X.X.; Zhao, B.C.; Huang, Z.J.; Ge, R.C. Overexpression of the receptor-like protein kinase genes AtRPK1 and OsRPK1 reduces the salt tolerance of Arabidopsis thaliana. Plant Sci. 2014, 217–218, 63–70. [Google Scholar] [CrossRef] [PubMed]
- Shumayla; Sharma, S.; Kumar, R.; Mendu, V.; Singh, K.; Upadhyay, S.K. Genomic dissection and expression profiling revealed functional divergence in Triticum aestivum leucine rich repeat receptor like kinases (TaLRRKs). Front. Plant Sci. 2016, 7, 1374. [Google Scholar] [CrossRef]
- Van der Does, D.; Boutrot, F.; Engelsdorf, T.; Rhodes, J.; McKenna, J.F.; Vernhettes, S.; Koevoets, I.; Tintor, N.; Veerabagu, M.; Miedes, E.; et al. The Arabidopsis leucine-rich repeat receptor kinase MIK2/LRR-KISS connects cell wall integrity sensing, root growth and response to abiotic and biotic stresses. PLoS Genet. 2017, 13, e1006832. [Google Scholar] [CrossRef] [PubMed]
- Wang, J.; Li, C.; Yao, X.; Liu, S.; Zhang, P.; Chen, K. The Antarctic moss leucine-rich repeat receptor-like kinase (PnLRR-RLK2) functions in salinity and drought stress adaptation. Polar Biol. 2018, 41, 353–364. [Google Scholar] [CrossRef]
- Wang, J.; Liu, S.; Li, C.; Wang, T.; Zhang, P.; Chen, K. PnLRR-RLK27, a novel leucine-rich repeats receptor-like protein kinase from the Antarctic moss Pohlia nutans, positively regulates salinity and oxidation-stress tolerance. PLoS ONE 2017, 12, e0172869. [Google Scholar] [CrossRef] [PubMed]
- Wang, J.; Zhang, P.; Liu, S.; Cong, B.; Chen, K. A leucine-rich repeat receptor-like kinase from the Antarctic moss Pohlia nutans confers salinity and ABA stress tolerance. Plant Mol. Biol. Report. 2016, 34, 1136–1145. [Google Scholar] [CrossRef]
- Wu, F.; Sheng, P.; Tan, J.; Chen, X.; Lu, G.; Ma, W.; Heng, Y.; Lin, Q.; Zhu, S.; Wang, J.; et al. Plasma membrane receptor-like kinase leaf panicle 2 acts downstream of the DROUGHT AND SALT TOLERANCE transcription factor to regulate drought sensitivity in rice. J. Exp. Bot. 2015, 66, 271–281. [Google Scholar] [CrossRef] [PubMed]
- Yuan, N.; Yuan, S.; Li, Z.; Zhou, M.; Wu, P.; Hu, Q.; Mendu, V.; Wang, L.; Luo, H. STRESS INDUCED FACTOR 2, a leucine-rich repeat kinase regulates basal plant pathogen defense. Plant Physiol. 2018, 176, 3062–3080. [Google Scholar] [CrossRef] [PubMed]
- Zhang, Z.; Pei, C.; Ma, J. Screening of candidate salt tolerance-related genes in alfalfa based on transcriptome-proteome correlation research techniques. Zhiwu Shengli Xuebao/Plant Physiol. J. 2016, 52, 317–324. [Google Scholar] [CrossRef]
- Huo, D.; Zheng, W.; Li, P.; Xu, Z.; Zhou, Y.; Chen, M.; Zhang, X. Identification, classification, and drought response of F-box gene family in foxtail millet. Acta Agron. Sin. (China) 2014, 40, 1585–1594. [Google Scholar] [CrossRef]
- Jia, Q.; Xiao, Z.X.; Wong, F.L.; Sun, S.; Liang, K.J.; Lam, H.M. Genome-wide analyses of the soybean F-box gene family in response to salt stress. Int. J. Mol. Sci. 2017, 18, 818. [Google Scholar] [CrossRef] [PubMed]
- Kim, Y.Y.; Cui, M.H.; Noh, M.S.; Jung, K.W.; Shin, J.S. The FBA motif-containing protein AFBA1 acts as a novel positive regulator of ABA response in Arabidopsis. Plant Cell Physiol. 2017, 58, 574–586. [Google Scholar] [CrossRef] [PubMed]
- Koops, P.; Pelser, S.; Ignatz, M.; Klose, C.; Marrocco-Selden, K.; Kretsch, T. EDL3 is an F-box protein involved in the regulation of abscisic acid signalling in Arabidopsis thaliana. J. Exp. Bot. 2011, 62, 5547–5560. [Google Scholar] [CrossRef] [PubMed]
- Song, J.B.; Wang, Y.X.; Li, H.B.; Li, B.W.; Zhou, Z.S.; Gao, S.; Yang, Z.M. The F-box family genes as key elements in response to salt, heavy mental, and drought stresses in Medicago truncatula. Funct. Integr. Genomics 2015, 15, 495–507. [Google Scholar] [CrossRef] [PubMed]
- Xu, J.; Xing, S.; Cui, H.; Chen, X.; Wang, X. Genome-wide identification and characterization of the apple (Malus domestica) HECT ubiquitin-protein ligase family and expression analysis of their responsiveness to abiotic stresses. Mol. Genet. Genomics 2016, 291, 635–646. [Google Scholar] [CrossRef] [PubMed]
- Guo, T.; Chen, K.; Dong, N.Q.; Shi, C.L.; Ye, W.W.; Gao, J.P.; Shan, J.X.; Lin, H.X. GRAIN SIZE AND NUMBER1 negatively regulates the OsMKKK10-OsMKK4-OsMPK6 cascade to coordinate the trade-off between grain number per panicle and grain size in rice. Plant Cell 2018, 30, 871–888. [Google Scholar] [CrossRef] [PubMed]
- Katou, S.; Kuroda, K.; Seo, S.; Yanagawa, Y.; Tsuge, T.; Yamazaki, M.; Miyao, A.; Hirochika, H.; Ohashi, Y. A calmodulin-binding mitogen-activated protein kinase phosphatase is induced by wounding and regulates the activities of stress-related mitogen-activated protein kinases in rice. Plant Cell Physiol. 2007, 48, 332–344. [Google Scholar] [CrossRef] [PubMed]
- Mikami, K.; Katagiri, T.; Iuchi, S.; Yamaguchi-Shinozaki, K.; Shinozaki, K. A gene encoding phosphatidylinositol-4-phosphate 5-kinase is induced by water stress and abscisic acid in Arabidopsis thaliana. Plant J. 1998, 15, 563–568. [Google Scholar] [CrossRef] [PubMed]
- Ueda, A.; Shi, W.; Nakamura, T.; Takabe, T. Analysis of salt-inducible genes in barley roots by differential display. J. Plant Res. 2002, 115, 119–130. [Google Scholar] [CrossRef] [PubMed]
- Liu, X.; Li, R.; Dai, Y.; Chen, X.; Wang, X. Genome-wide identification and expression analysis of the B-box gene family in the apple (Malus domestica Borkh.) genome. Mol. Genet. Genomics 2018, 293, 303–315. [Google Scholar] [CrossRef] [PubMed]
- Gao, H.; Song, A.; Zhu, X.; Chen, F.; Jiang, J.; Chen, Y.; Sun, Y.; Shan, H.; Gu, C.; Li, P.; et al. The heterologous expression in Arabidopsis of a chrysanthemum Cys2/His2 zinc finger protein gene confers salinity and drought tolerance. Planta 2012, 235, 979–993. [Google Scholar] [CrossRef] [PubMed]
- Kielbowicz-Matuk, A.; Rey, P.; Rorat, T. Interplay between circadian rhythm, time of the day and osmotic stress constraints in the regulation of the expression of a Solanum Double B-box gene. Ann. Bot. 2014, 113, 831–842. [Google Scholar] [CrossRef] [PubMed]
- Kobayashi, M.; Horiuchi, H.; Fujita, K.; Takuhara, Y.; Suzuki, S. Characterization of grape C-repeat-binding factor 2 and B-box-type zinc finger protein in transgenic Arabidopsis plants under stress conditions. Mol. Biol. Rep. 2012, 39, 7933–7939. [Google Scholar] [CrossRef] [PubMed]
- Min, J.H.; Chung, J.S.; Lee, K.H.; Kim, C.S. The CONSTANS-like 4 transcription factor, AtCOL4, positively regulates abiotic stress tolerance through an abscisic acid-dependent manner in Arabidopsis. J. Integr. Plant Biol. 2015, 57, 313–324. [Google Scholar] [CrossRef] [PubMed]
- Sakamoto, H.; Araki, T.; Meshi, T.; Iwabuchi, M. Expression of a subset of the Arabidopsis Cys2/His2-type zinc-finger protein gene family under water stress. Gene 2000, 248, 23–32. [Google Scholar] [CrossRef]
- Tian, Z.D.; Zhang, Y.; Liu, J.; Xie, C.H. Novel potato C2H2-type zinc finger protein gene, StZFP1, which responds to biotic and abiotic stress, plays a role in salt tolerance. Plant Biol. (Stuttg.) 2010, 12, 689–697. [Google Scholar] [CrossRef] [PubMed]
- Gray, J.; Bevan, M.; Brutnell, T.; Buell, C.R.; Cone, K.; Hake, S.; Jackson, D.; Kellogg, E.; Lawrence, C.; McCouch, S.; et al. A recommendation for naming transcription factor proteins in the grasses. Plant Physiol. 2009, 149, 4–6. [Google Scholar] [CrossRef] [PubMed]
- Cao, H.; Wang, L.; Qian, W.; Hao, X.; Yang, Y.; Wang, X. Positive regulation of CsbZIP4 transcription factor on salt stress response in transgenic Arabidopsis. Acta Agron. Sin. (China) 2017, 43, 1012–1020. [Google Scholar] [CrossRef]
- Castro, P.H.; Lilay, G.H.; Munoz-Merida, A.; Schjoerring, J.K.; Azevedo, H.; Assuncao, A.G.L. Phylogenetic analysis of F-bZIP transcription factors indicates conservation of the zinc deficiency response across land plants. Sci. Rep. 2017, 7, 3806. [Google Scholar] [CrossRef] [PubMed]
- Kumar, J.; Singh, S.; Singh, M.; Srivastava, P.K.; Mishra, R.K.; Singh, V.P.; Prasad, S.M. Transcriptional regulation of salinity stress in plants: A short review. Plant Gene 2017, 11, 160–169. [Google Scholar] [CrossRef]
- Lapham, R.; Lee, L.Y.; Tsugama, D.; Lee, S.; Mengiste, T.; Gelvin, S.B. VIP1 and its homologs are not required for Agrobacterium-mediated transformation, but play a role in Botrytis and salt stress responses. Front. Plant Sci. 2018, 9, 749. [Google Scholar] [CrossRef] [PubMed]
- Li, Y.; Chen, Q.; Nan, H.; Li, X.; Lu, S.; Zhao, X.; Liu, B.; Guo, C.; Kong, F.; Cao, D. Overexpression of GmFDL19 enhances tolerance to drought and salt stresses in soybean. PLoS ONE 2017, 12, e0179554. [Google Scholar] [CrossRef] [PubMed]
- Liu, C.; Mao, B.; Ou, S.; Wang, W.; Liu, L.; Wu, Y.; Chu, C.; Wang, X. Correction to: OsbZIP71, a bZIP transcription factor, confers salinity and drought tolerance in rice. Plant Mol. Biol. 2018, 97, 467–468. [Google Scholar] [CrossRef] [PubMed]
- Pan, Y.; Hu, X.; Li, C.; Xu, X.; Su, C.; Li, J.; Song, H.; Zhang, X.; Pan, Y. SlbZIP38, a tomato bZIP family gene downregulated by abscisic acid, is a negative regulator of drought and salt stress tolerance. Genes 2017, 8, 402. [Google Scholar] [CrossRef] [PubMed]
- Sunitha, M.; Srinath, T.; Reddy, V.D.; Rao, K.V. Expression of cold and drought regulatory protein (CcCDR) of pigeonpea imparts enhanced tolerance to major abiotic stresses in transgenic rice plants. Planta 2017, 245, 1137–1148. [Google Scholar] [CrossRef] [PubMed]
- Wang, C.; Lu, G.; Hao, Y.; Guo, H.; Guo, Y.; Zhao, J.; Cheng, H. ABP9, a maize bZIP transcription factor, enhances tolerance to salt and drought in transgenic cotton. Planta 2017, 246, 453–469. [Google Scholar] [CrossRef] [PubMed]
- Wang, L.; Zhu, J.; Li, X.; Wang, S.; Wu, J. Salt and drought stress and ABA responses related to bZIP genes from V. radiata and V. angularis. Gene 2018, 651, 152–160. [Google Scholar] [CrossRef] [PubMed]
- Xie, R.; Pan, X.; Zhang, J.; Ma, Y.; He, S.; Zheng, Y.; Ma, Y. Effect of salt-stress on gene expression in citrus roots revealed by RNA-seq. Funct. Integr. Genomics 2018, 18, 155–173. [Google Scholar] [CrossRef] [PubMed]
- Xie, R.; Zhang, J.; Ma, Y.; Pan, X.; Dong, C.; Pang, S.; He, S.; Deng, L.; Yi, S.; Zheng, Y.; et al. Combined analysis of mRNA and miRNA identifies dehydration and salinity responsive key molecular players in citrus roots. Sci. Rep. 2017, 7, 42094. [Google Scholar] [CrossRef] [PubMed] [Green Version]
- Zhang, L.; Zhang, L.; Xia, C.; Gao, L.; Hao, C.; Zhao, G.; Jia, J.; Kong, X. A novel wheat C-bZIP gene, TabZIP14-B, participates in salt and freezing tolerance in transgenic plants. Front. Plant Sci. 2017, 8, 710. [Google Scholar] [CrossRef] [PubMed]
- Zhang, Y.; Lian, C.; Duan, H.; Lu, X.; Xia, X.; Yin, W. Analysis of PebZIP26 and PebZIP33 transcription factors from populus euphratica. Beijing Linye Daxue Xuebao/J. Beijing For. Univ. 2017, 39, 18–30. [Google Scholar] [CrossRef]
- Zhu, M.; Meng, X.; Cai, J.; Li, G.; Dong, T.; Li, Z. Basic leucine zipper transcription factor SlbZIP1 mediates salt and drought stress tolerance in tomato. BMC Plant Biol. 2018, 18, 83. [Google Scholar] [CrossRef] [PubMed]
- Figueiredo, D.D.; Barros, P.M.; Cordeiro, A.M.; Serra, T.S.; Lourenco, T.; Chander, S.; Oliveira, M.M.; Saibo, N.J. Seven zinc-finger transcription factors are novel regulators of the stress responsive gene OsDREB1B. J. Exp. Bot. 2012, 63, 3643–3656. [Google Scholar] [CrossRef] [PubMed]
- Hu, J.; Gao, Y.; Zhao, T.; Li, J.; Yao, M.; Xu, X. Genome-wide identification and expression pattern analysis of zinc-finger homeodomain transcription factors in tomato under abiotic stress. J. Am. Soc. Hortic. Sci. 2018, 143, 14–22. [Google Scholar] [CrossRef]
- An, J.; Liu, X.; Song, L.; You, C.; Wang, X.; Hao, Y. Apple RING finger E3 ubiquitin ligase MdMIEL1 negatively regulates salt and oxidative stresses tolerance. J. Plant Biol. 2017, 60, 137–145. [Google Scholar] [CrossRef]
- Chapagain, S.; Park, Y.C.; Kim, J.H.; Jang, C.S. Oryza sativa salt-induced RING E3 ligase 2 (OsSIRP2) acts as a positive regulator of transketolase in plant response to salinity and osmotic stress. Planta 2018, 247, 925–939. [Google Scholar] [CrossRef] [PubMed]
- Hwang, S.G.; Chapagain, S.; Han, A.R.; Park, Y.C.; Park, H.M.; Kim, Y.H.; Jang, C.S. Molecular characterization of rice arsenic-induced RING finger E3 ligase 2 (OsAIR2) and its heterogeneous overexpression in Arabidopsis thaliana. Physiol. Plant. 2017, 161, 372–384. [Google Scholar] [CrossRef] [PubMed]
- Hwang, S.G.; Kim, J.J.; Lim, S.D.; Park, Y.C.; Moon, J.C.; Jang, C.S. Molecular dissection of Oryza sativa salt-induced RING Finger Protein 1 (OsSIRP1): Possible involvement in the sensitivity response to salinity stress. Physiol. Plant. 2016, 158, 168–179. [Google Scholar] [CrossRef] [PubMed]
- Hwang, S.G.; Park, H.M.; Han, A.R.; Jang, C.S. Molecular characterization of Oryza sativa arsenic-induced RING E3 ligase 1 (OsAIR1): Expression patterns, localization, functional interaction, and heterogeneous overexpression. J. Plant Physiol. 2016, 191, 140–148. [Google Scholar] [CrossRef] [PubMed]
- Lim, S.D.; Jung, C.G.; Park, Y.C.; Lee, S.C.; Lee, C.; Lim, C.W.; Kim, D.S.; Jang, C.S. Molecular dissection of a rice microtubule-associated RING finger protein and its potential role in salt tolerance in Arabidopsis. Plant Mol. Biol. 2015, 89, 365–384. [Google Scholar] [CrossRef] [PubMed]
- Liu, Y.; Zhang, X.; Zhu, S.; Zhang, H.; Li, Y.; Zhang, T.; Sun, J. Overexpression of GhSARP1 encoding a E3 ligase from cotton reduce the tolerance to salt in transgenic Arabidopsis. Biochem. Biophys. Res. Commun. 2016, 478, 1491–1496. [Google Scholar] [CrossRef] [PubMed]
- Park, Y.C.; Chapagain, S.; Jang, C.S. A negative regulator in response to salinity in rice: Oryza sativa Salt-, ABA- and drought-induced RING Finger Protein 1 (OsSADR1). Plant Cell Physiol. 2018, 59, 575–589. [Google Scholar] [CrossRef] [PubMed]
- Park, Y.C.; Moon, J.-C.; Chapagain, S.; Oh, D.G.; Kim, J.J.; Jang, C.S. Role of salt-induced RING finger protein 3 (OsSIRP3), a negative regulator of salinity stress response by modulating the level of its target proteins. Environ. Exp. Bot. 2018, 155, 21–30. [Google Scholar] [CrossRef]
- Qi, S.; Lin, Q.; Zhu, H.; Gao, F.; Zhang, W.; Hua, X. The RING Finger E3 Ligase SpRing is a positive regulator of salt stress signaling in salt-tolerant wild tomato species. Plant Cell Physiol. 2016, 57, 528–539. [Google Scholar] [CrossRef] [PubMed]
- Song, J.; Xing, Y.; Munir, S.; Yu, C.; Song, L.; Li, H.; Wang, T.; Ye, Z. An ATL78-Like RING-H2 finger protein confers abiotic stress tolerance through interacting with RAV2 and CSN5B in tomato. Front. Plant Sci. 2016, 7, 1305. [Google Scholar] [CrossRef] [PubMed]
- Tian, M.; Lou, L.; Liu, L.; Yu, F.; Zhao, Q.; Zhang, H.; Wu, Y.; Tang, S.; Xia, R.; Zhu, B.; et al. The RING finger E3 ligase STRF1 is involved in membrane trafficking and modulates salt-stress response in Arabidopsis thaliana. Plant J. 2015, 82, 81–92. [Google Scholar] [CrossRef] [PubMed]
- Yang, L.; Liu, Q.; Liu, Z.; Yang, H.; Wang, J.; Li, X.; Yang, Y. Arabidopsis C3HC4-RING finger E3 ubiquitin ligase AtAIRP4 positively regulates stress-responsive abscisic acid signaling. J. Integr. Plant Biol. 2016, 58, 67–80. [Google Scholar] [CrossRef] [PubMed]
- Zang, D.; Li, H.; Xu, H.; Zhang, W.; Zhang, Y.; Shi, X.; Wang, Y. An Arabidopsis zinc finger protein increases abiotic stress tolerance by regulating sodium and potassium homeostasis, reactive oxygen species scavenging and osmotic potential. Front. Plant Sci. 2016, 7, 1272. [Google Scholar] [CrossRef] [PubMed]
- Khanday, I.; Ram Yadav, S.; Vijayraghavan, U. Rice LHS1/UsMADS1 controls floret meristem specification by coordinated regulation of transcription factors and hormone signaling pathways. Plant Physiol. 2013, 161, 1970–1983. [Google Scholar] [CrossRef] [PubMed]
- Jain, M.; Nijhawan, A.; Arora, R.; Agarwal, P.; Ray, S.; Sharma, P.; Kapoor, S.; Tyagi, A.K.; Khurana, J.P. F-box proteins in rice. Genome-wide analysis, classification, temporal and spatial gene expression during panicle and seed development, and regulation by light and abiotic stress. Plant Physiol. 2007, 143, 1467–1483. [Google Scholar] [CrossRef] [PubMed]
- Martinez-Atienza, J.; Jiang, X.; Garciadeblas, B.; Mendoza, I.; Zhu, J.K.; Pardo, J.M.; Quintero, F.J. Conservation of the salt overly sensitive pathway in rice. Plant Physiol. 2007, 143, 1001–1012. [Google Scholar] [CrossRef] [PubMed]


| Summary | Detail |
|---|---|
| 12 samples | three samples for each of condition and stage |
| 2 conditions | Normal and salt stress |
| 2 stages | Seedling (fully expanded leave) and booting (flag leave) |
| 3 replicates | for each of condition and stage |
| Stages | Gene Counts | Total | |
|---|---|---|---|
| Seedling stage | Upregulated | 337 | 788 |
| Downregulated | 451 | ||
| Booting stage | Upregulated | 338 | 759 |
| Downregulated | 421 | ||
| Seedling Stage | |||||
| GO | Name | Type | p-Value | Odds Ratio | Adjusted p-Value |
| GO:0005576 | extracellular region | CC | 2.957 × 10⁻⁹ | 3.30 | 2.839 × 10⁻⁷ |
| GO:0009628 | response to abiotic stimulus | BP | 1.305 × 10⁻⁸ | 1.79 | 1.24 × 10⁻⁶ |
| GO:0005618 | cell wall | CC | 7.548 × 10⁻⁷ | 2.37 | 7.095 × 10⁻⁵ |
| GO:0006950 | response to stress | BP | 2.539 × 10⁻⁶ | 1.54 | 0.000236 |
| GO:0003824 | catalytic activity | MF | 0.000106 | 1.39 | 0.009719 |
| GO:0005975 | carbohydrate metabolic process | BP | 0.000367 | 1.73 | 0.033430 |
| GO:0008152 | metabolic process | BP | 0.000848 | 1.24 | 0.076302 |
| GO:0009536 | Plastid | CC | 0.004486 | 1.24 | 0.399220 |
| GO:0006091 | generation of precursor metabolites and energy | BP | 0.005245 | 1.88 | 0.461591 |
| GO:0009579 | Thylakoid | CC | 0.013869 | 1.51 | 1 |
| GO:0006629 | lipid metabolic process | BP | 0.015656 | 1.46 | 1 |
| GO:0016020 | Membrane | CC | 0.017398 | 1.21 | 1 |
| GO:0009987 | cellular process | BP | 0.018653 | 1.15 | 1 |
| GO:0030312 | external encapsulating structure | CC | 0.035846 | 11.24 | 1 |
| GO:0015979 | Photosynthesis | BP | 0.040445 | 1.70 | 1 |
| GO:0040007 | Growth | BP | 0.040712 | 2.11 | 1 |
| GO:0016049 | cell growth | BP | 0.046445 | 1.63 | 1 |
| Booting Stage | |||||
| GO | Name | Type | p-Value | Odds Ratio | Adjusted p-Value |
| GO:0005840 | Ribosome | CC | 2.91 × 10⁻³² | 6.27 | 2.80 × 10⁻³⁰ |
| GO:0005198 | structural molecule activity | MF | 8.05 × 10⁻²⁹ | 5.58 | 7.65 × 10⁻²⁷ |
| GO:0006412 | Translation | BP | 9.25 × 10⁻²¹ | 4.13 | 8.69 × 10⁻¹⁹ |
| GO:0005730 | Nucleolus | CC | 4.53 × 10⁻¹¹ | 3.98 | 4.21 × 10⁻⁹ |
| GO:0005829 | Cytosol | CC | 1.71 × 10⁻⁹ | 1.87 | 1.57 × 10⁻⁷ |
| GO:0009628 | response to abiotic stimulus | BP | 2.90 × 10⁻⁹ | 1.92 | 2.64 × 10⁻⁷ |
| GO:0005773 | Vacuole | CC | 8.21 × 10⁻⁶ | 1.91 | 0.000739 |
| GO:0005618 | cell wall | CC | 0.007243 | 1.61 | 0.644585 |
| GO:0040007 | Growth | BP | 0.007826 | 2.90 | 0.688678 |
| GO:0009606 | Tropism | BP | 0.013779 | 3.50 | 1 |
| GO:0019748 | secondary metabolic process | BP | 0.022283 | 1.74 | 1 |
| GO:0006950 | response to stress | BP | 0.027036 | 1.21 | 1 |
| Properties | Normal-State Network | Salinity-State Network |
|---|---|---|
| Number of nodes | 1446 | 1443 |
| Number of edges | 98,754 | 273,620 |
| Connections per node | 68 | 190 |
| Average degree | 137 | 379 |
| Number of hub nodes (degree > 200) | 448 | 908 |
| Number of end nodes (degree = 1) | 11 | 7 |
| Diameter length | 11 | 10 |
| Degree Assortativity | 0.7100 | 0.3739 |
| Global clustering coefficient | 0.5924 | 0.6871 |
| Locus_ID | Stage | up/down | Function | References | Mark |
|---|---|---|---|---|---|
| LOC_Os01g39770 | booting | up | calcineurin B, putative, expressed | [44,45,46,47,48,49,50,51,52,53,54,55,56,57] | *** |
| LOC_Os02g06330 | booting | down | AP2 domain containing protein, expressed | [58,59,60,61,62,63,64,65,66,67,68,69,70] | *** |
| LOC_Os02g38040 | booting | up | leucine-rich repeat family protein, putative, expressed | [71,72,73,74,75,76,77,78,79,80,81,82,83] | *** |
| LOC_Os04g32460 | booting | down | OsFBL16-F-box domain and LRR containing protein, expressed | [71,84,85,86,87,88,89] | *** |
| LOC_Os04g32590 | booting | up | transcription factor, putative, expressed | - | - |
| LOC_Os05g02500 | booting | down | OsMKP1, GSN1, dual specificity protein phosphatase, putative, expressed. A calmodulin-binding mitogen-activated protein kinase phosphatase induced by wounding and regulating the activities of stress-related mitogen-activated protein kinases in rice | [90,91] | * |
| LOC_Os05g37690 | booting | down | OsFBL23-F-box domain and LRR containing protein, expressed | [71,84,85,86,87,88,89] | *** |
| LOC_Os05g45810 | booting | down | calcineurin B, putative, expressed | [44,45,46,47,48,49,50,51,52,53,54,55,56,57] | *** |
| LOC_Os06g14750 | seedling | up | phosphatidylinositol-4-phosphate 5-Kinase family protein, putative, expressed | [92,93] | * |
| LOC_Os07g47140 | booting | down | CCT/B-box zinc finger protein, putative, expressed | [94,95,96,97,98,99,100] | ** |
| LOC_Os08g07970 | booting | down | OsbZIP64 [101], transcription factor, putative, expressed | [102,103,104,105,106,107,108,109,110,111,112,113,114,115,116] | *** |
| LOC_Os08g35190 | booting | up | auxin-repressed protein, putative, expressed | - | - |
| LOC_Os09g29130 | booting | down | ZF-HD protein dimerization region containing protein, expressed | [117,118] | * |
| LOC_Os10g31850 | booting | up | RING finger and CHY zinc finger domain-containing protein 1, putative, expressed | [119,120,121,122,123,124,125,126,127,128,129,130,131,132] | *** |
| LOC_Os11g44810 | booting | down | auxin-repressed protein, putative, expressed | - | - |
| LOC_Os11g47920 | seedling | up | SCARECROW, putative, expressed | [93] | * |
| LOC_Os12g06340 | booting | up | OsBLH1, BEL1-like homeodomain transcription factor, putative, expressed | [133] | * |
© 2018 by the authors. Licensee MDPI, Basel, Switzerland. This article is an open access article distributed under the terms and conditions of the Creative Commons Attribution (CC BY) license (http://creativecommons.org/licenses/by/4.0/).
Share and Cite
Suratanee, A.; Chokrathok, C.; Chutimanukul, P.; Khrueasan, N.; Buaboocha, T.; Chadchawan, S.; Plaimas, K. Two-State Co-Expression Network Analysis to Identify Genes Related to Salt Tolerance in Thai Rice. Genes 2018, 9, 594. https://doi.org/10.3390/genes9120594
Suratanee A, Chokrathok C, Chutimanukul P, Khrueasan N, Buaboocha T, Chadchawan S, Plaimas K. Two-State Co-Expression Network Analysis to Identify Genes Related to Salt Tolerance in Thai Rice. Genes. 2018; 9(12):594. https://doi.org/10.3390/genes9120594
Chicago/Turabian StyleSuratanee, Apichat, Chidchanok Chokrathok, Panita Chutimanukul, Nopphawitchayaphong Khrueasan, Teerapong Buaboocha, Supachitra Chadchawan, and Kitiporn Plaimas. 2018. "Two-State Co-Expression Network Analysis to Identify Genes Related to Salt Tolerance in Thai Rice" Genes 9, no. 12: 594. https://doi.org/10.3390/genes9120594