Identification of Differentially Methylated Sites with Weak Methylation Effects

 , , and
Abstract
:1. Introduction
2. Methods
2.1. Wavelet-Based Functional Mixed Models
2.2. Bayesian False Discovery Rate
3. Data and Simulation
3.1. Arabisopsis thaliana Treated with Herbicide Glyphosate
3.2. Methylation Level Simulation
4. Results
4.1. Simulation Results
4.1.1. Effect of the Degree of Methylation Difference
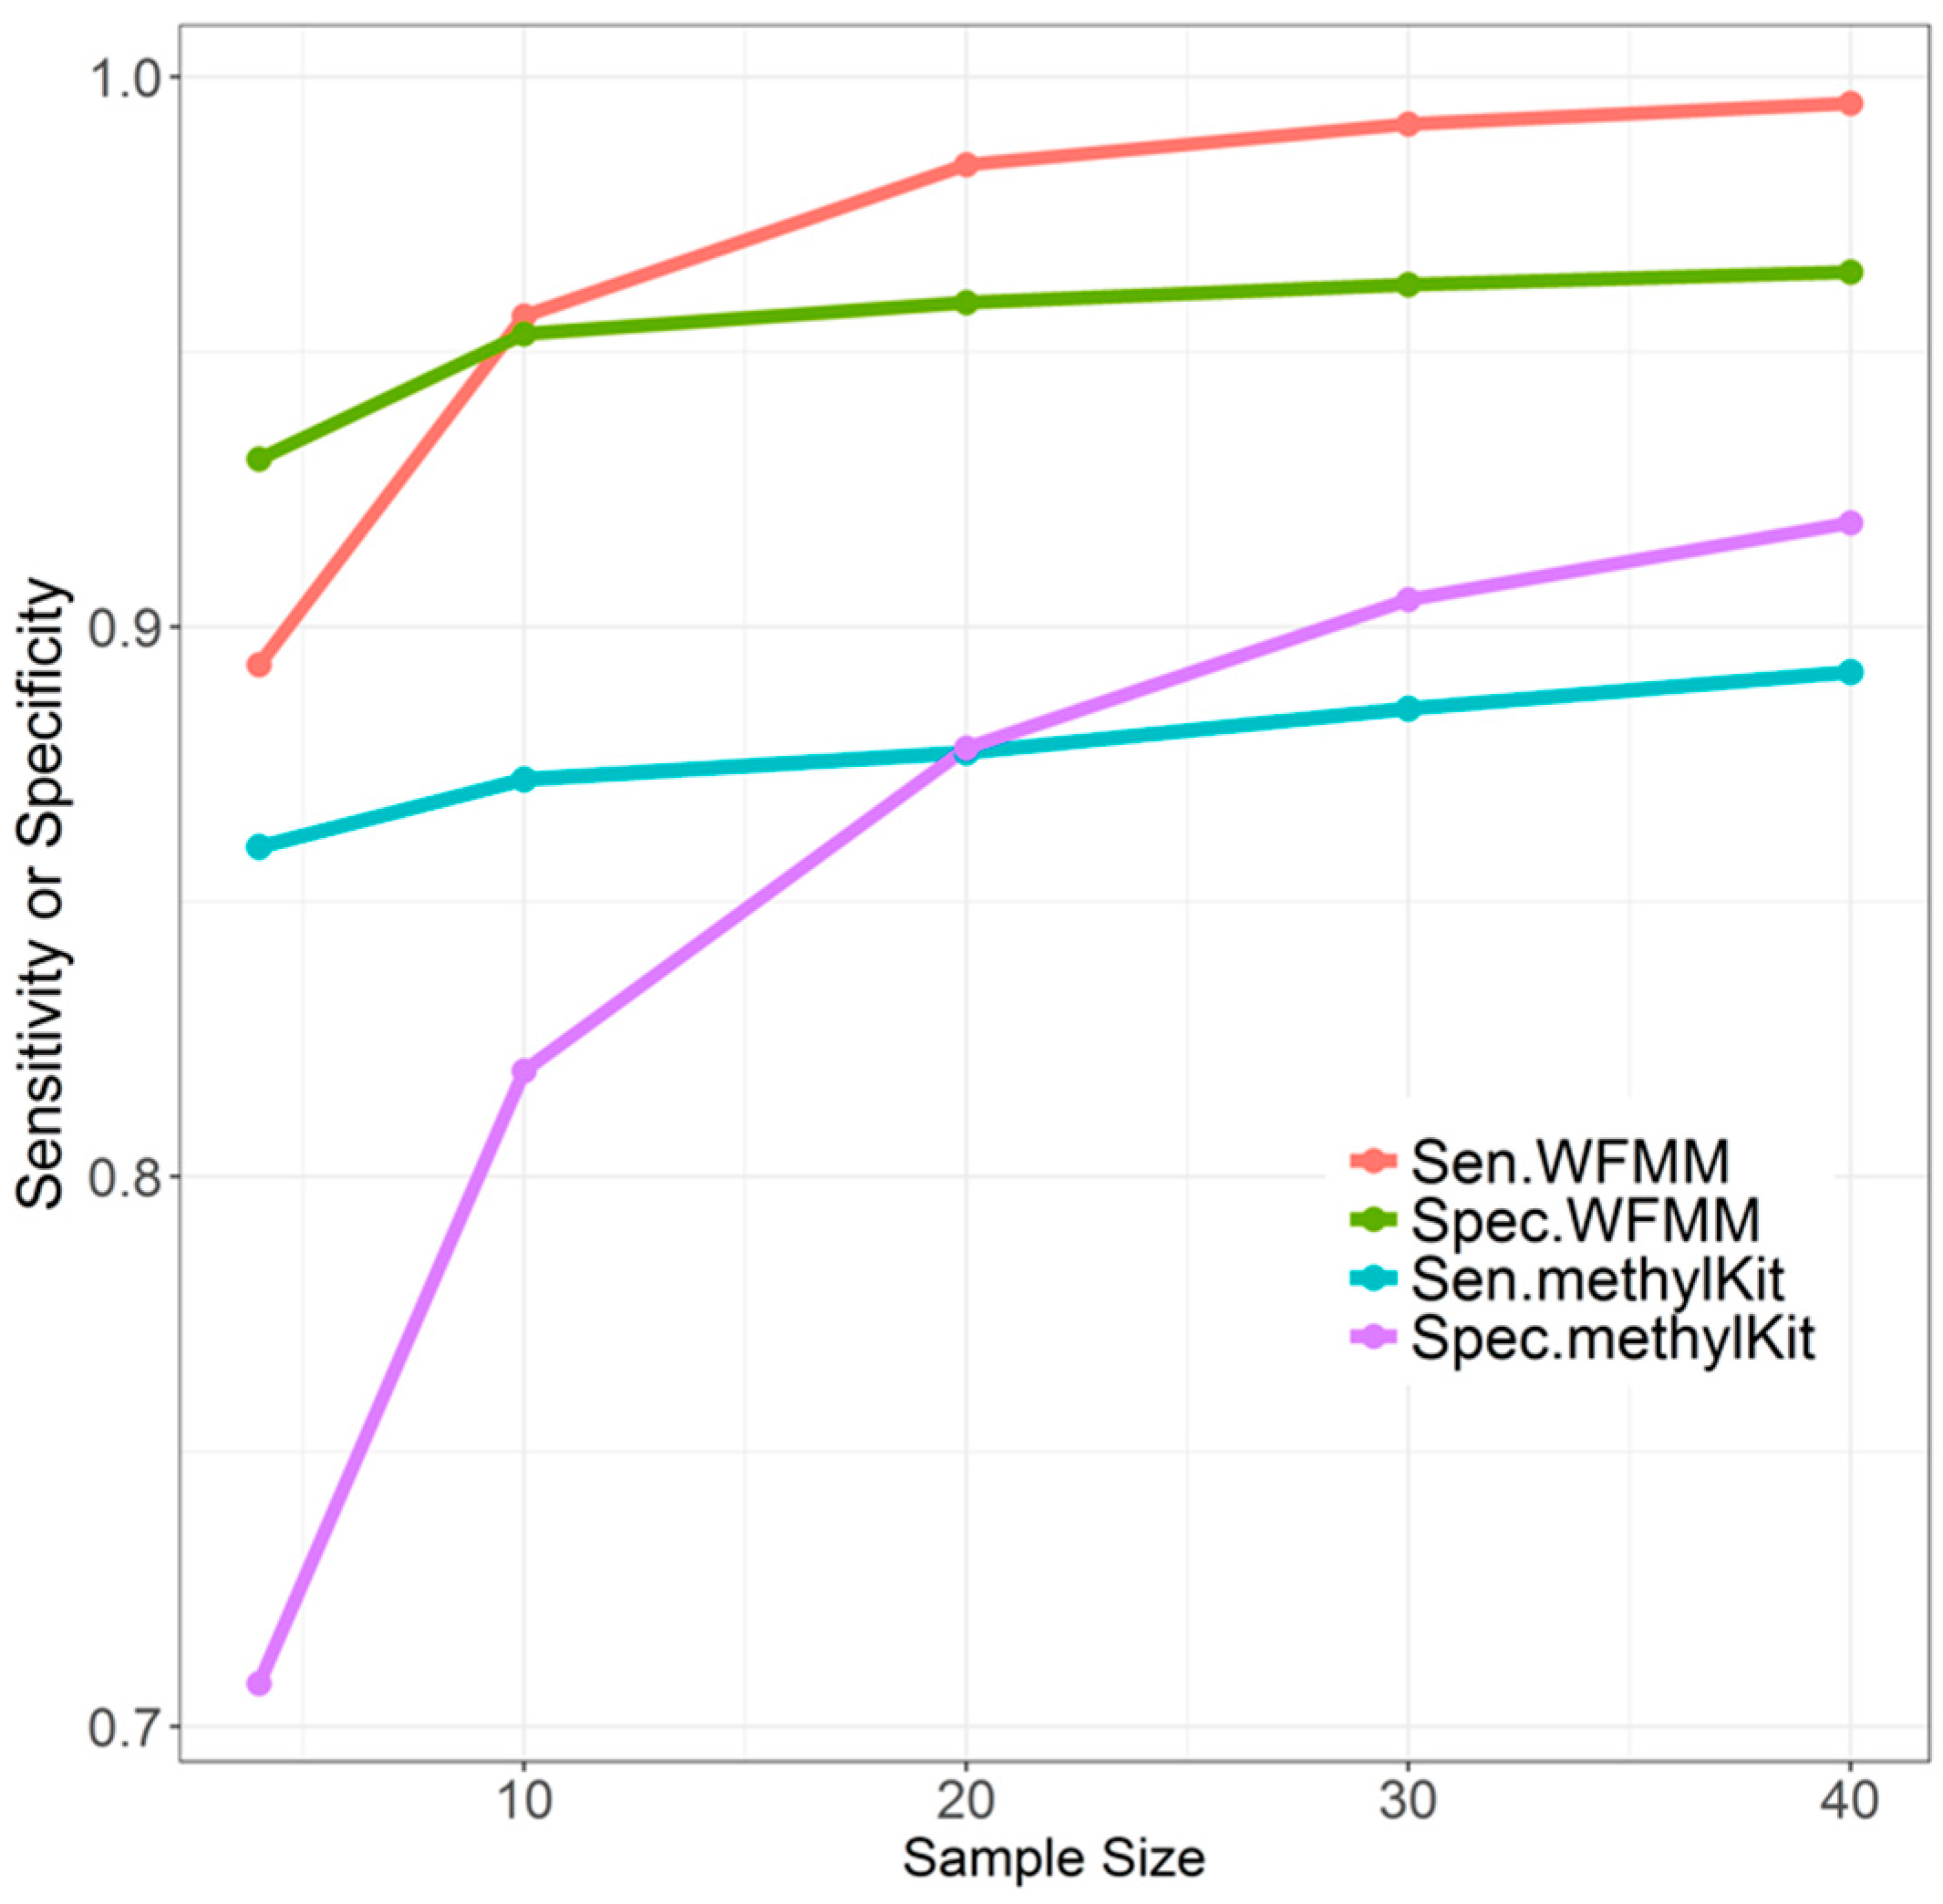
4.1.2. Effect of Sample Size
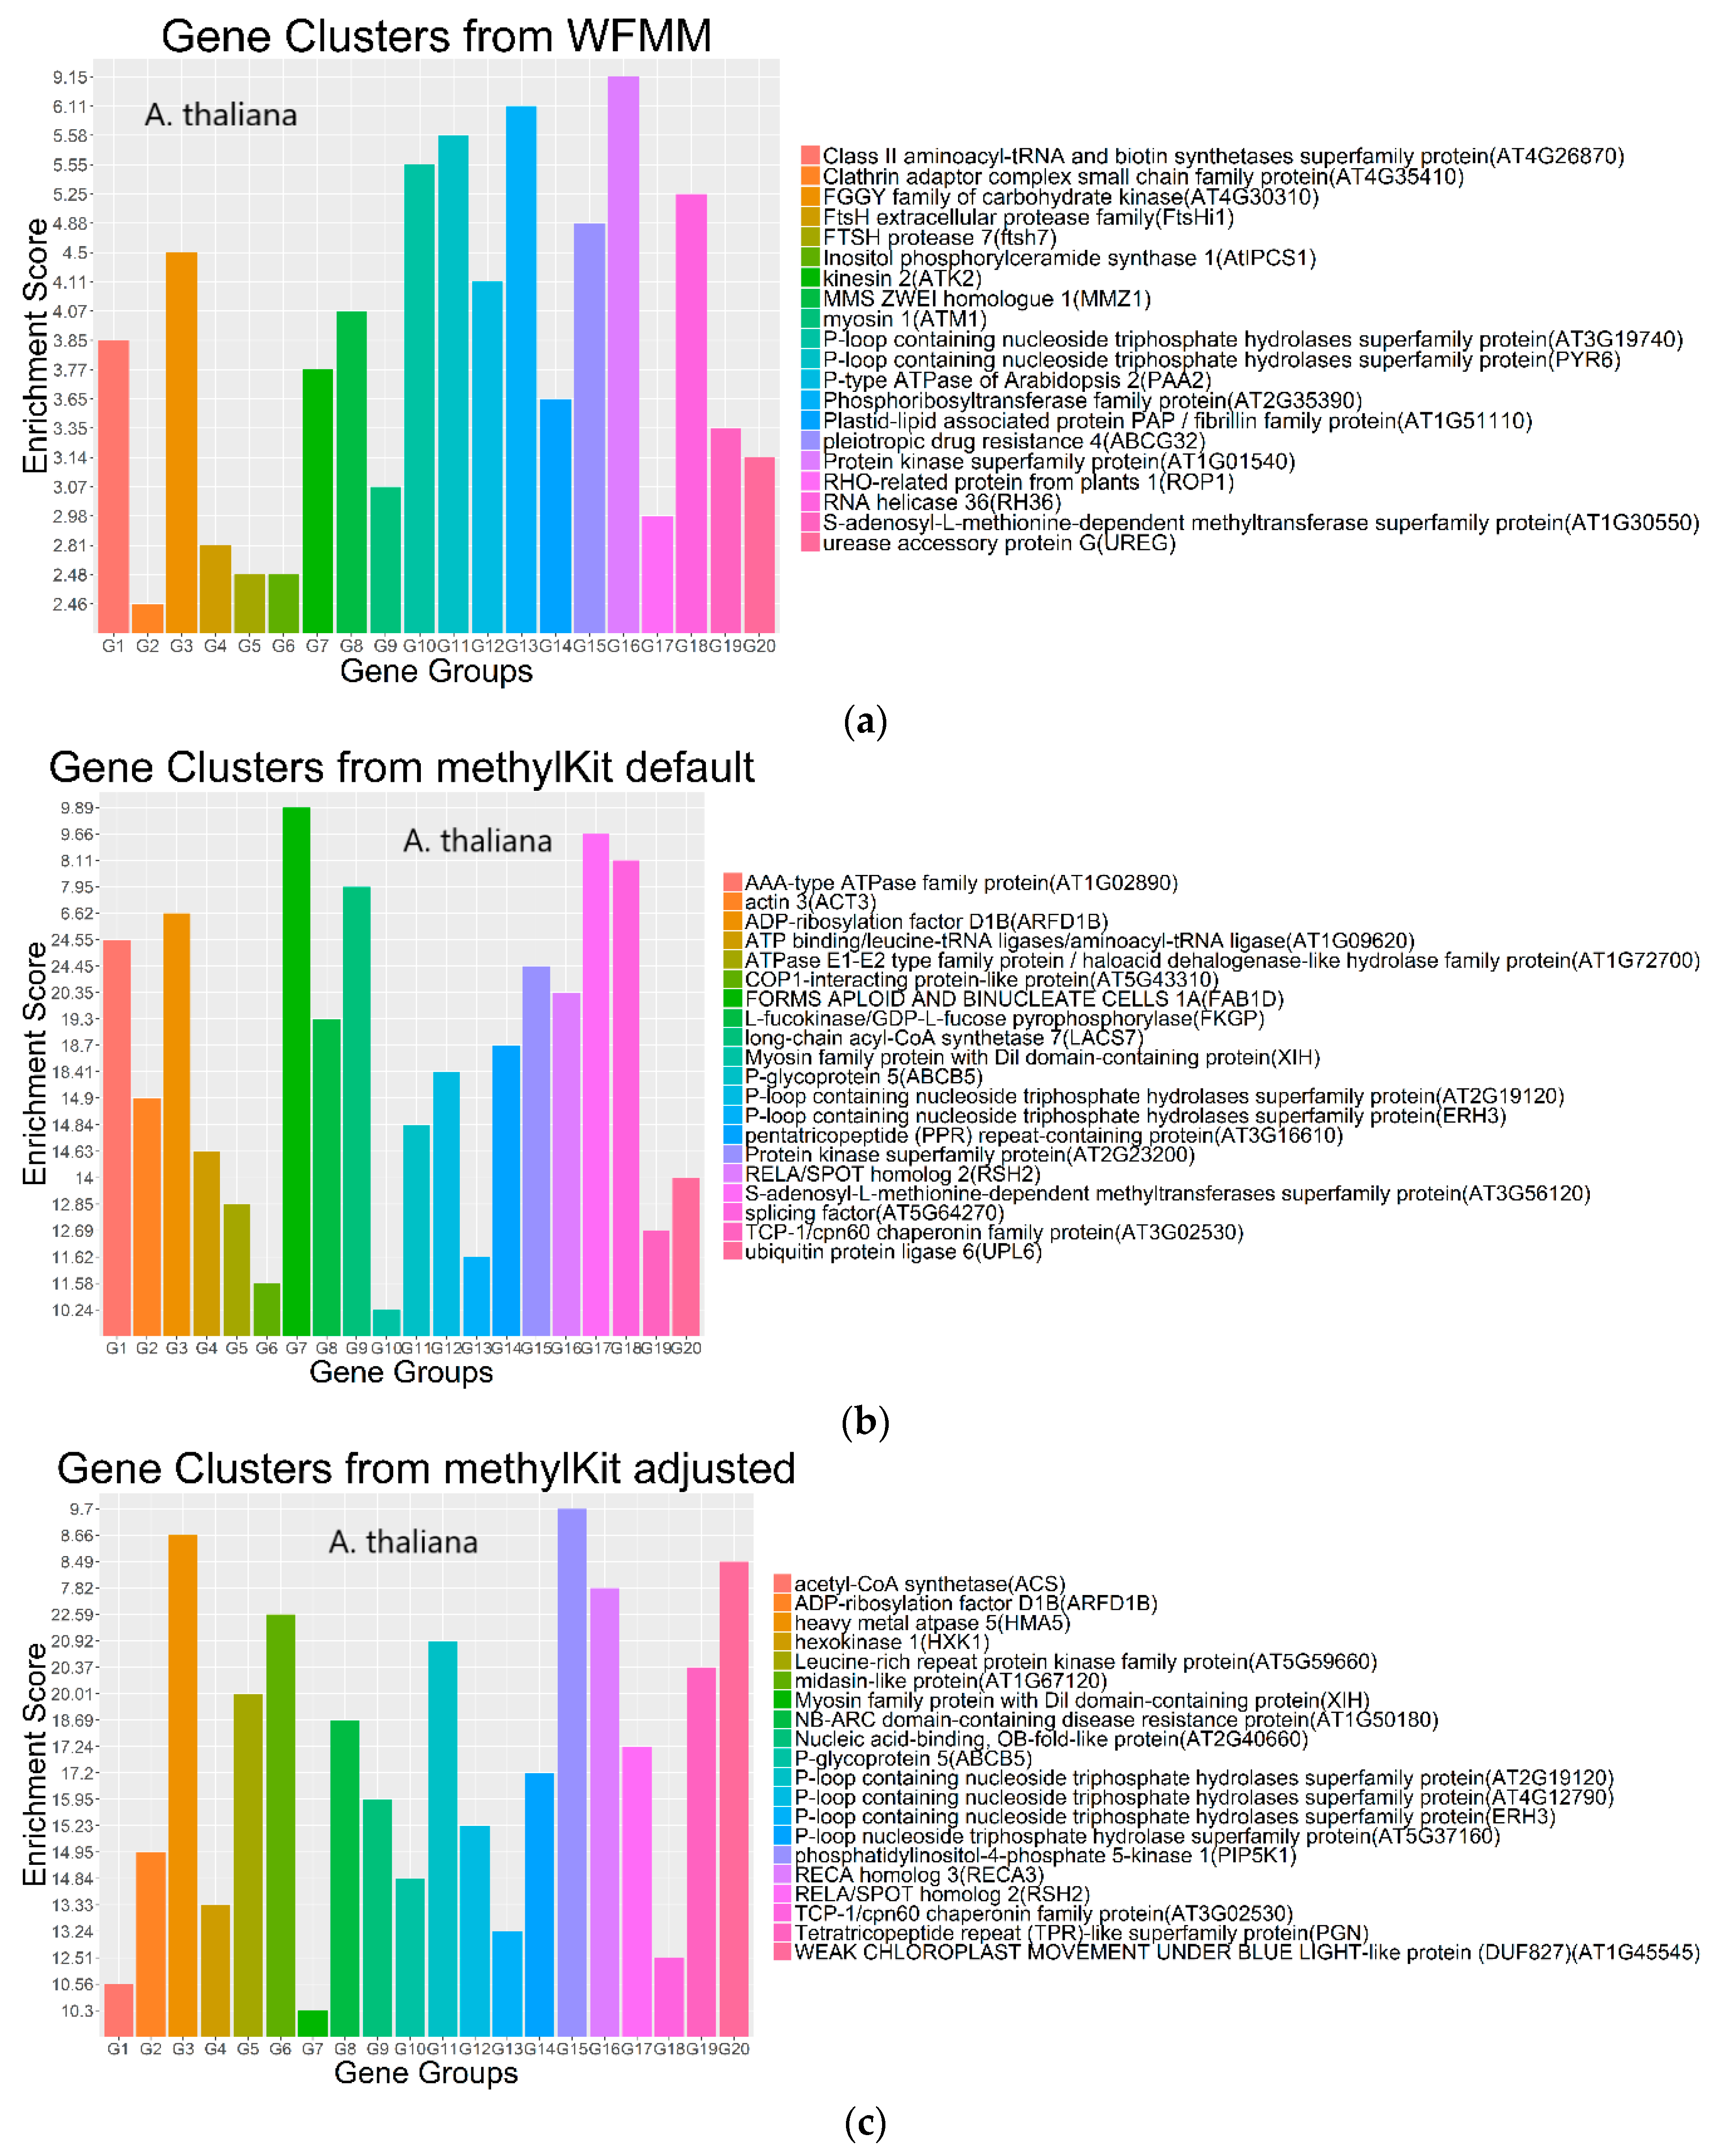
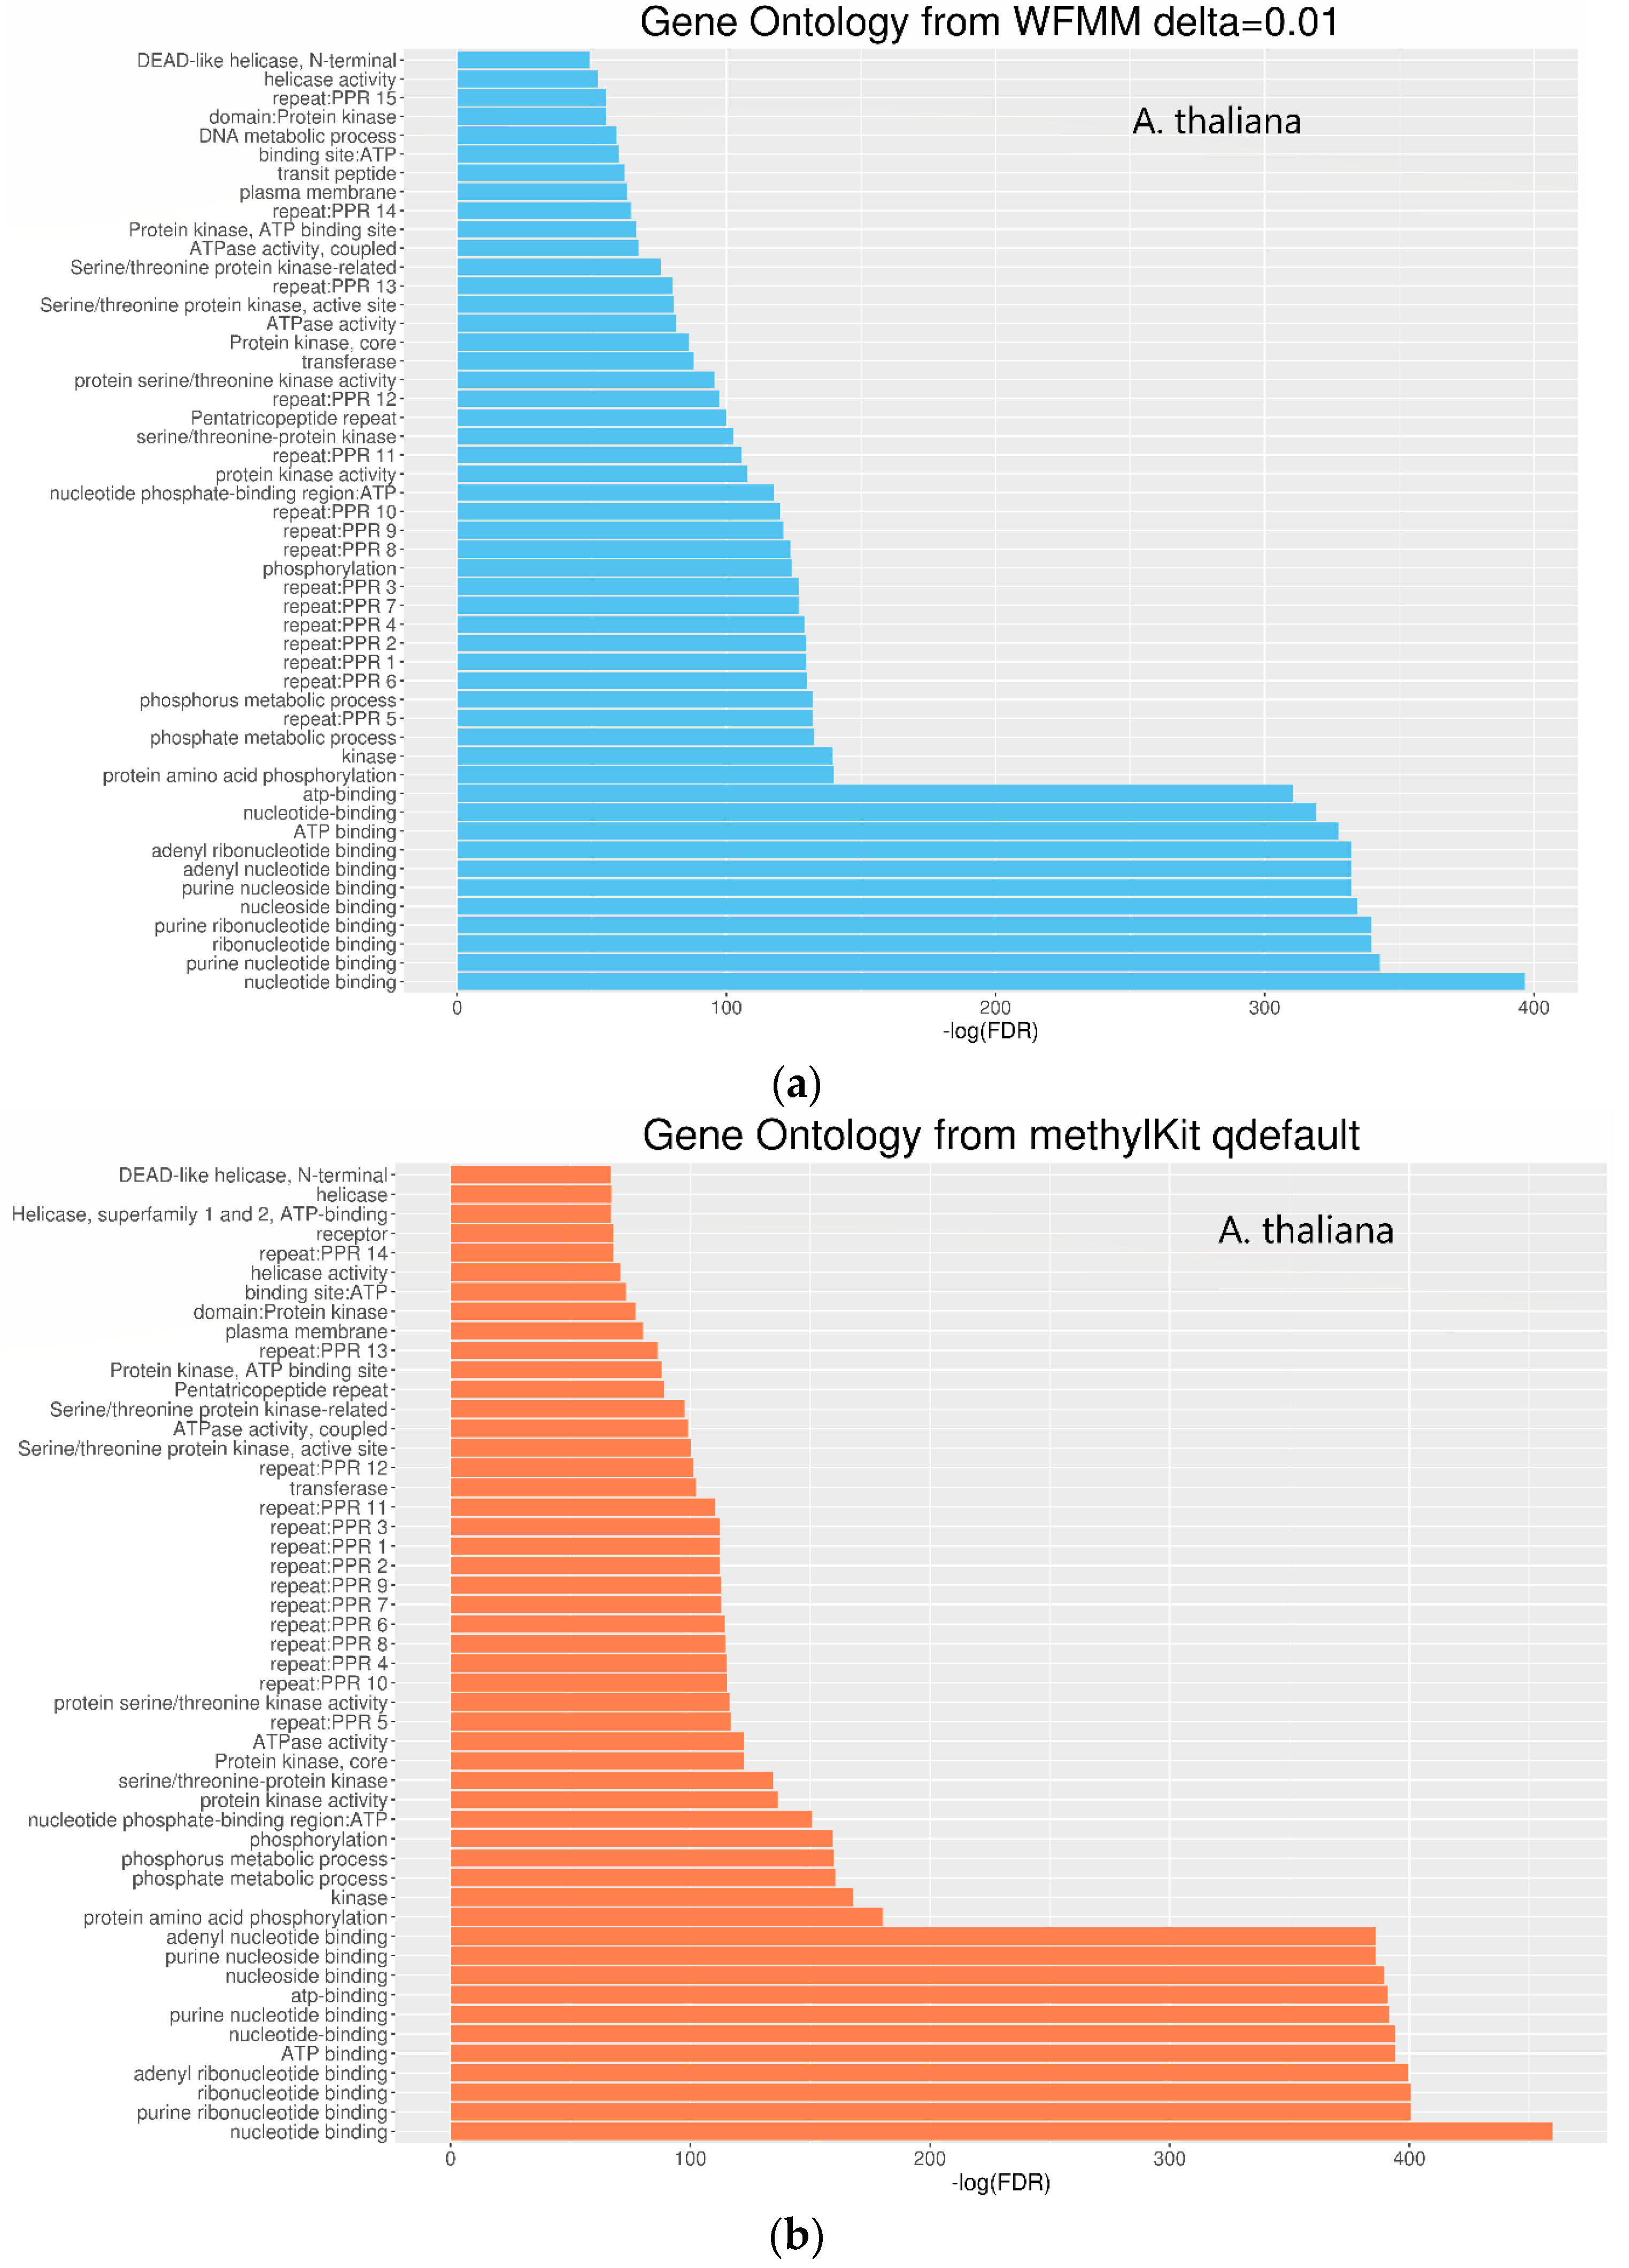
4.2. Real Data from Herbicide Glyphosate Treatment of Arabidopsis thaliana
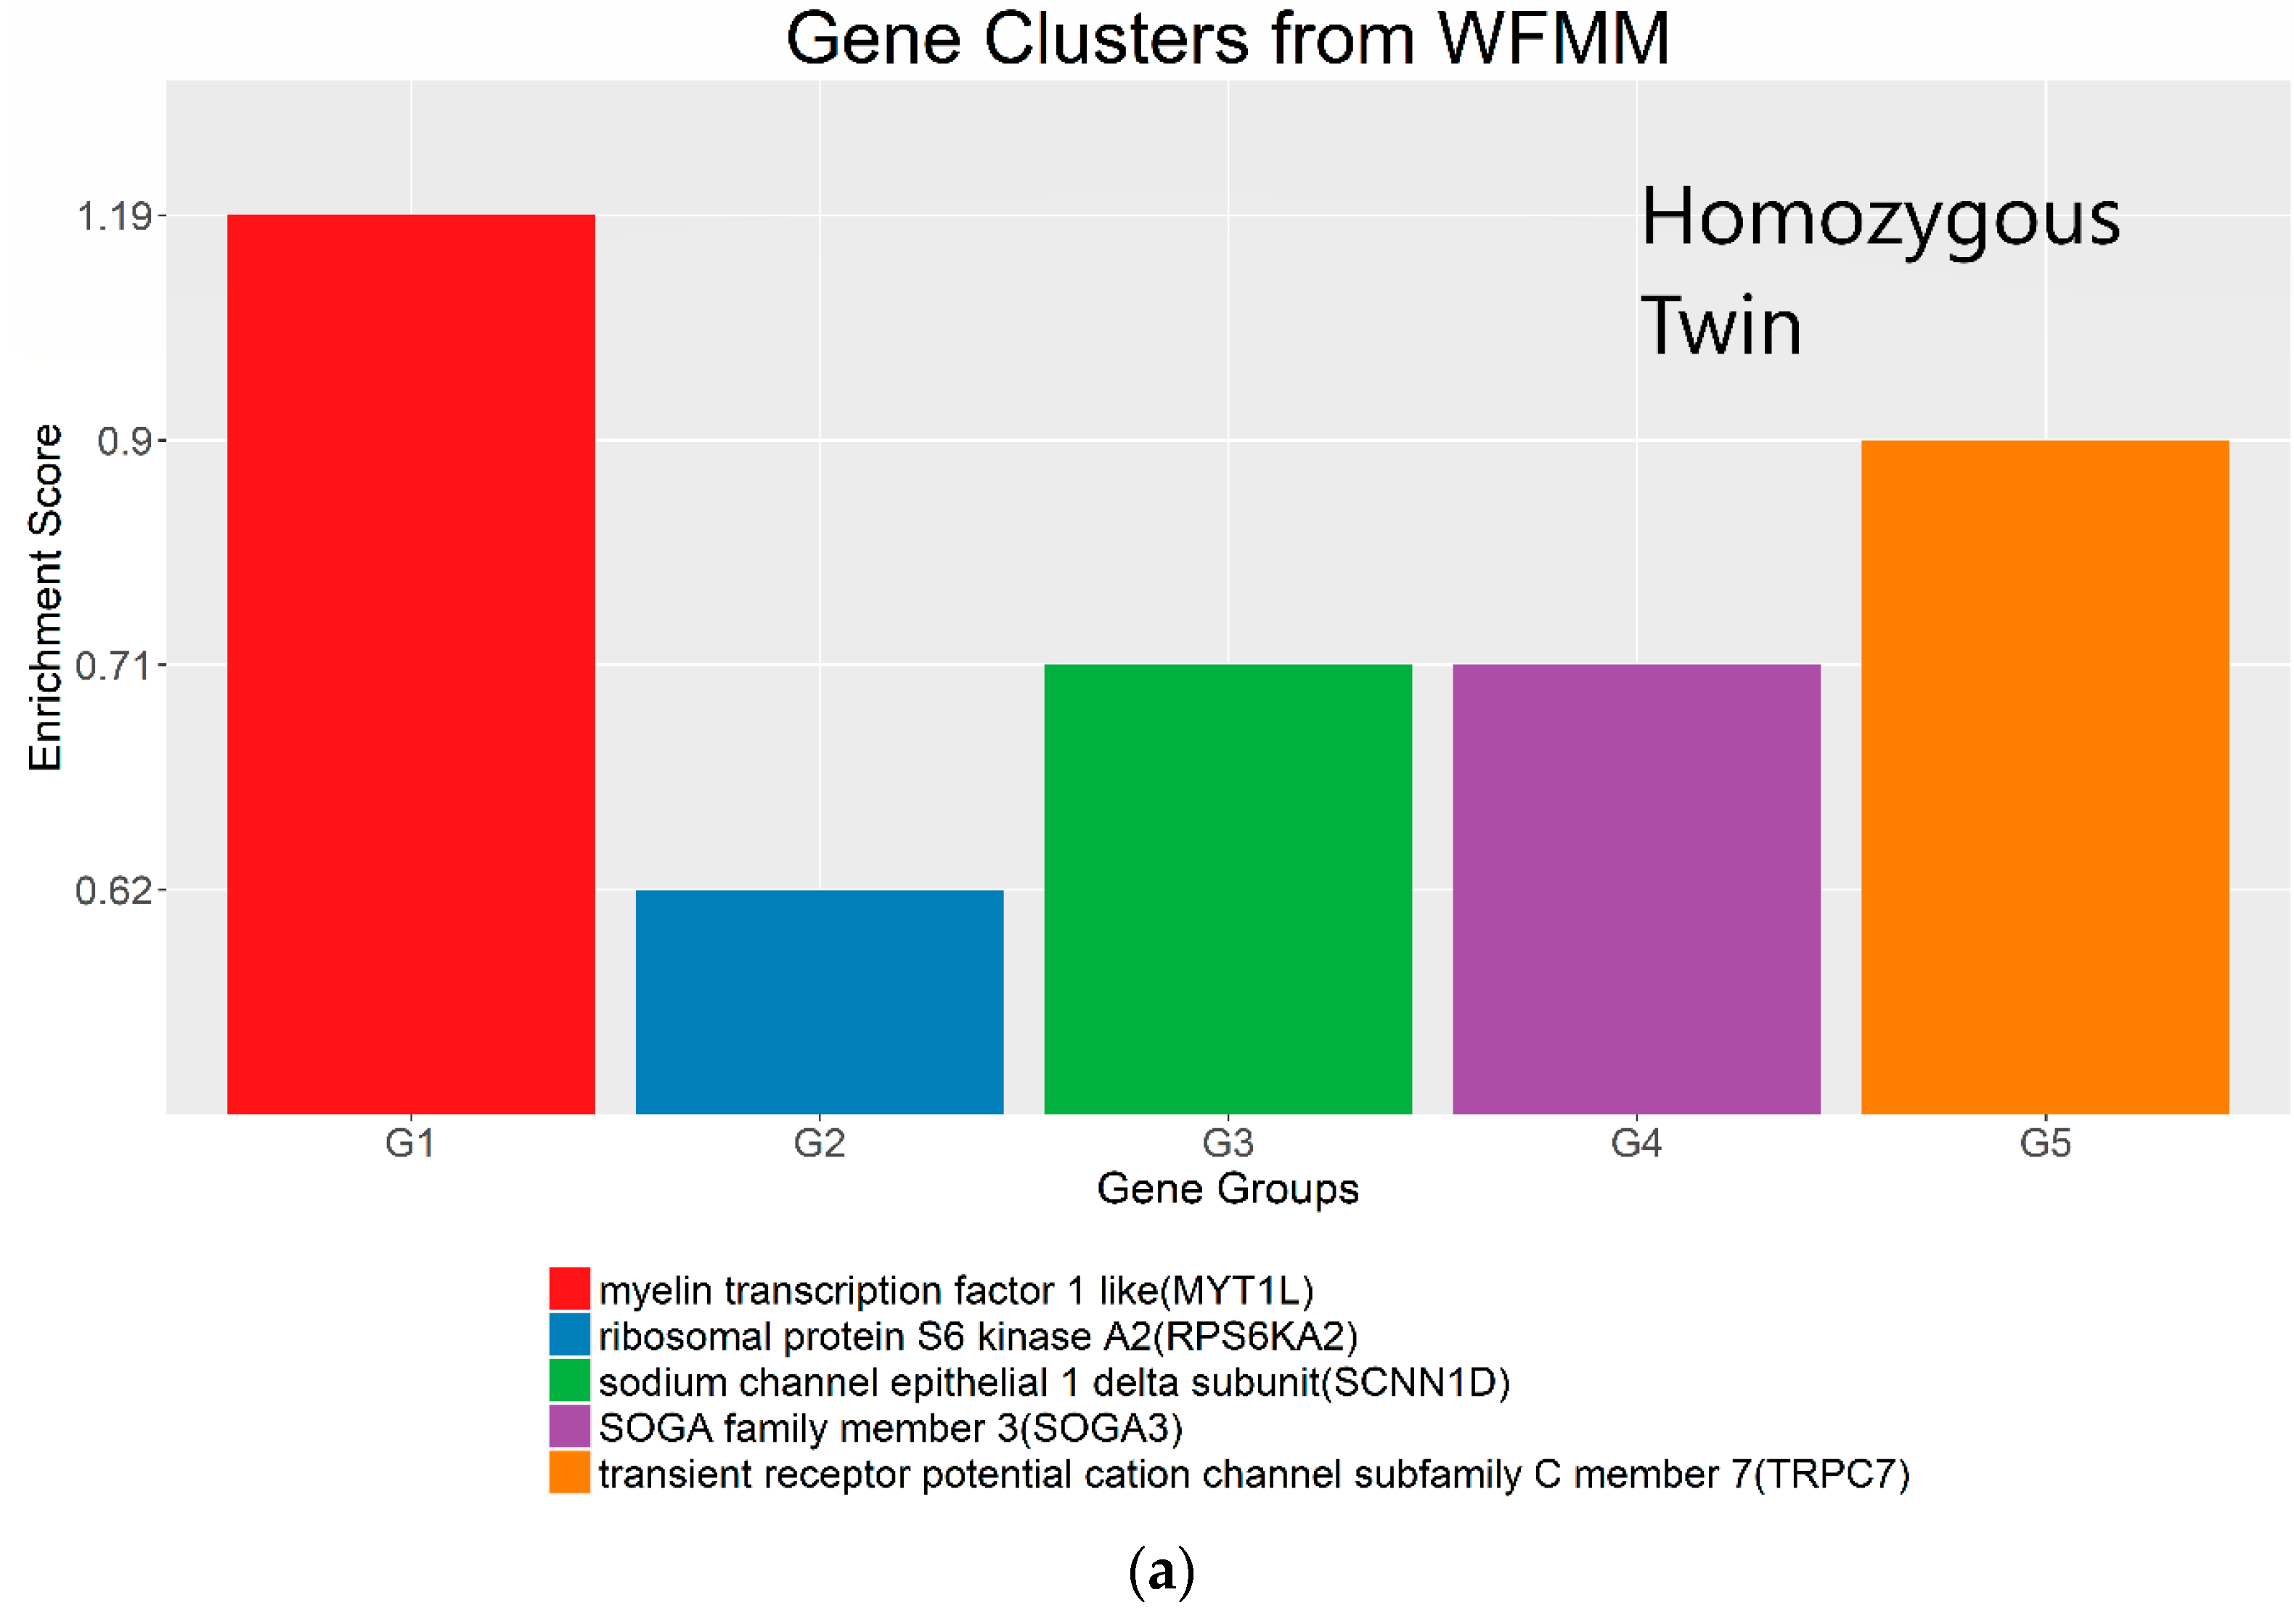
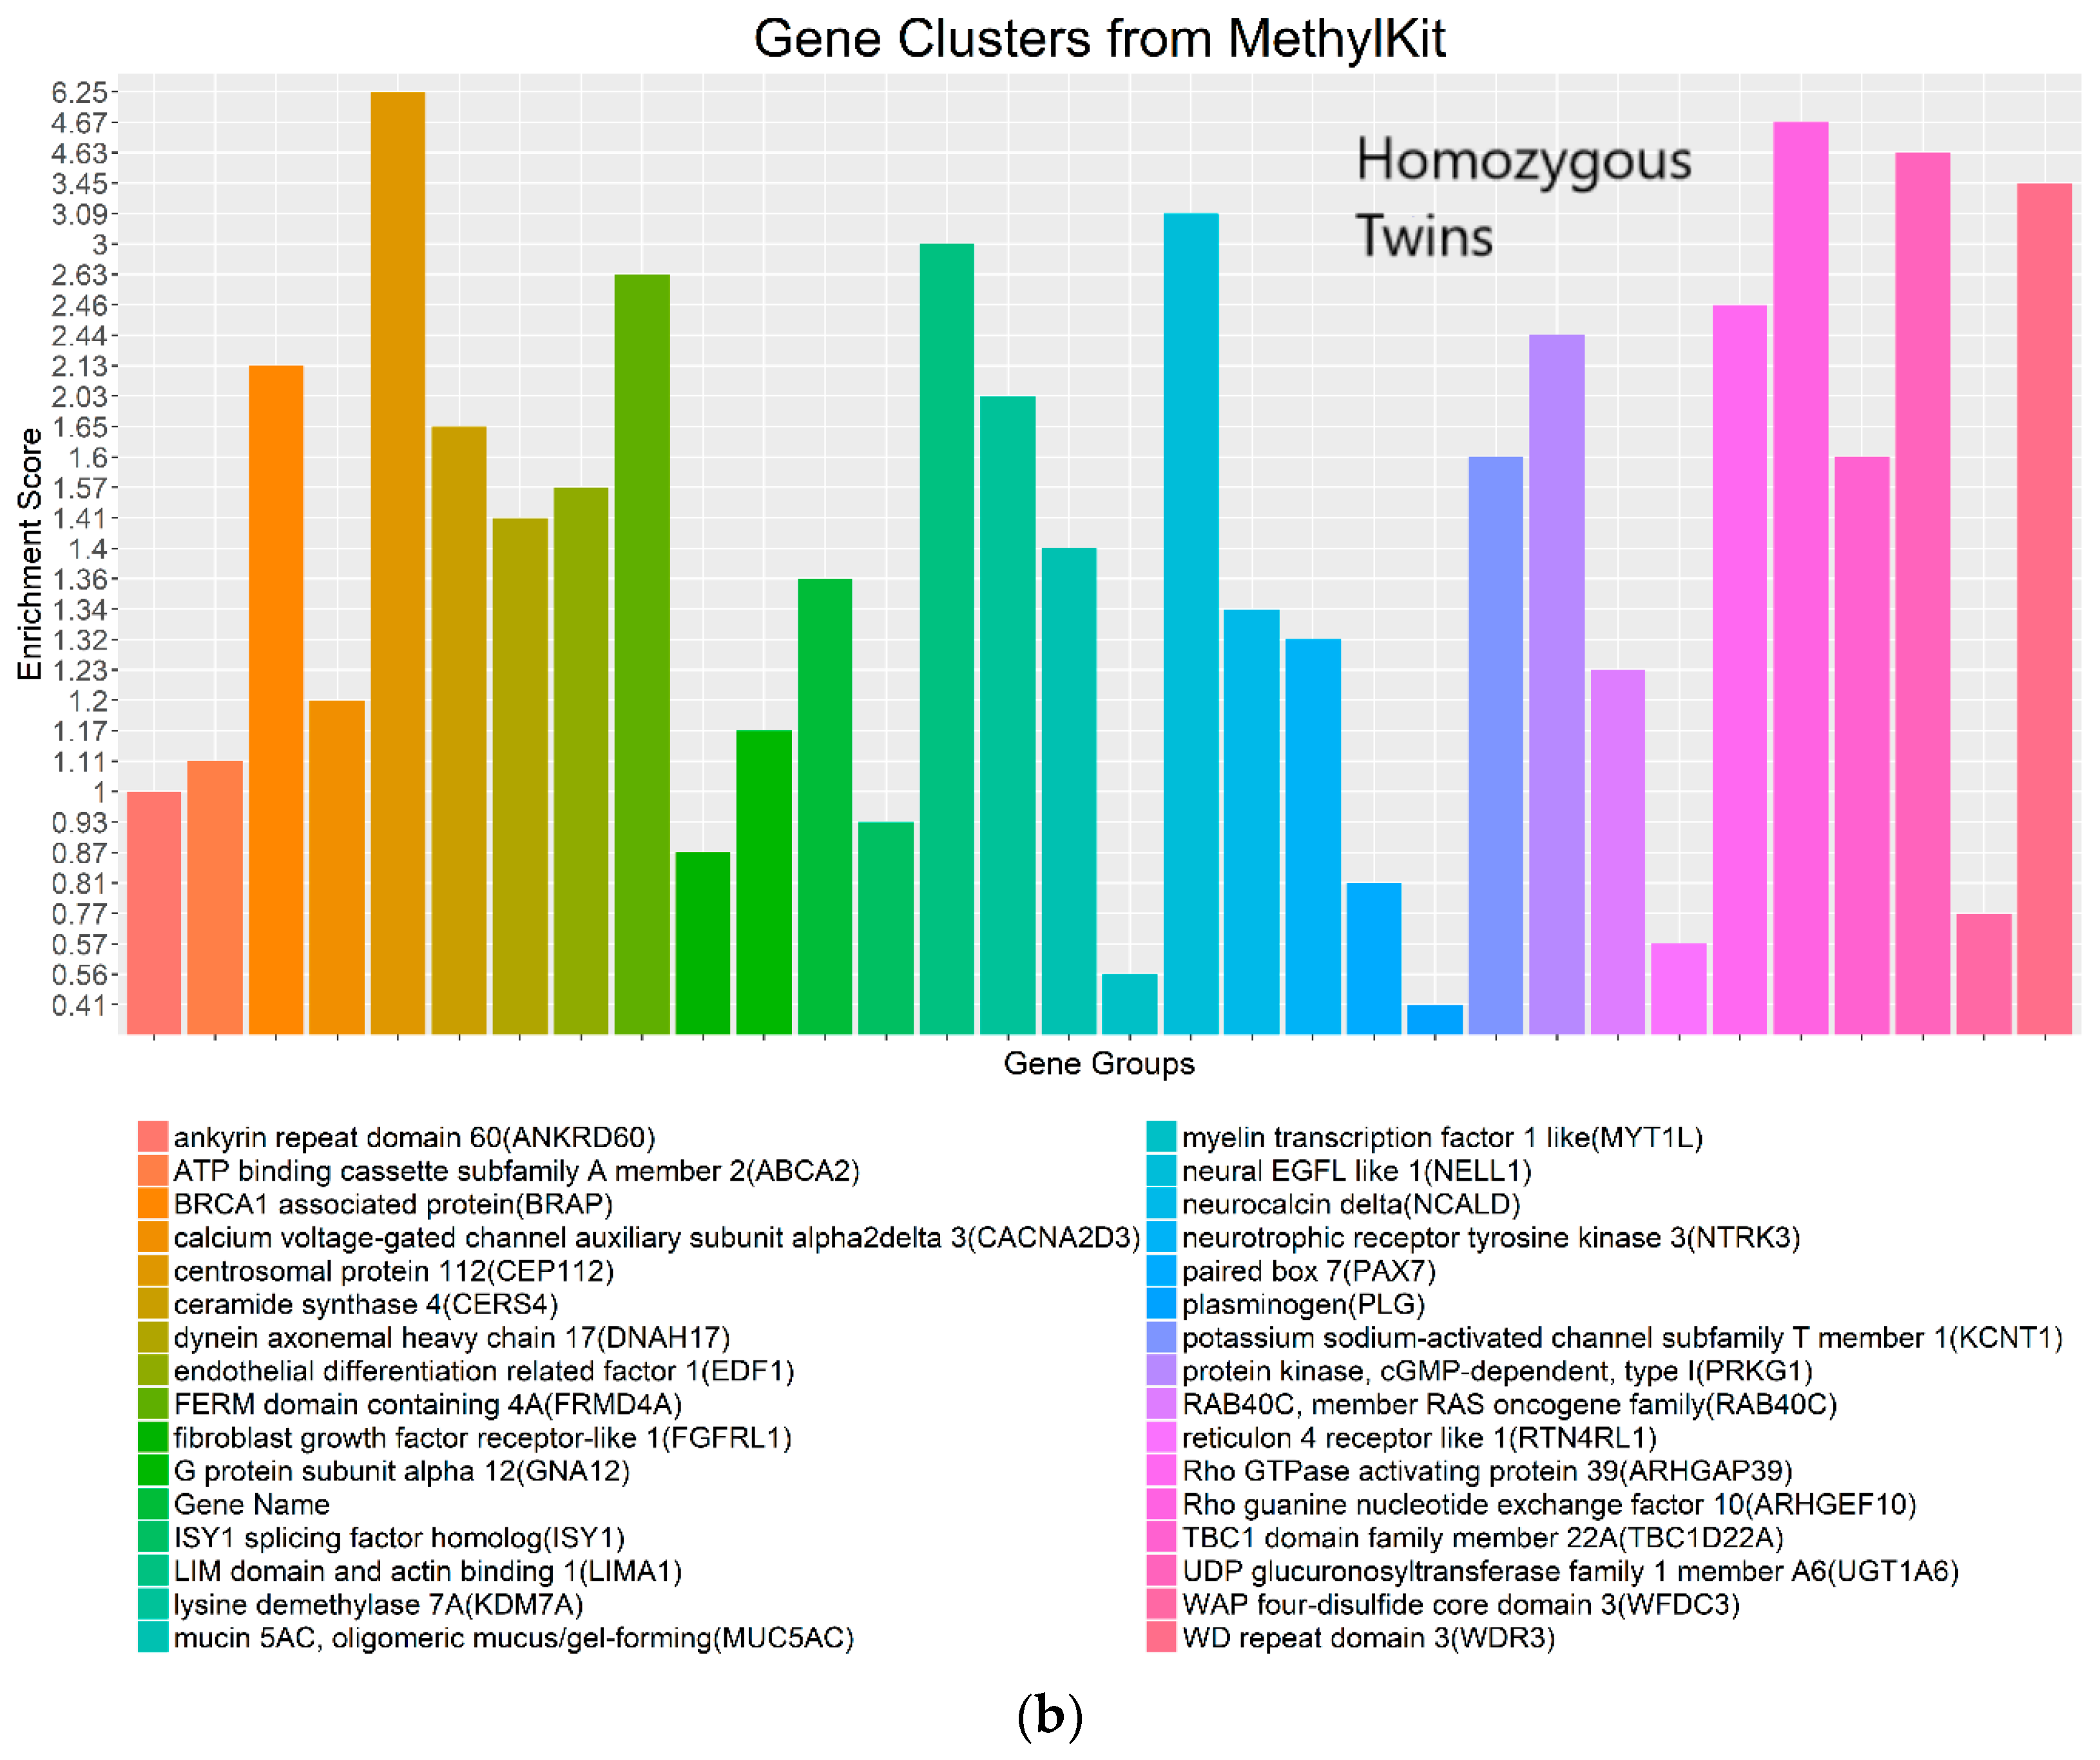
4.3. Real Data from Monozygotic Twin Data with Different Pain Sensitivity Scores
5. Discussion
Supplementary Materials
Acknowledgments
Author Contributions
Conflicts of Interest
References
- De Pristo, M.A.; Banks, E.; Poplin, R.; Garimella, K.V.; Maguire, J.R.; Hartl, C.; Philippakis, A.A.; Del Angel, G.; Rivas, M.A.; Hanna, M. A framework for variation discovery and genotyping using next-generation DNA sequencing data. Nat. Genet. 2011, 43, 491–498. [Google Scholar] [CrossRef] [PubMed]
- Guo, J.U.; Su, Y.; Shin, J.H.; Shin, J.; Li, H.; Xie, B.; Zhong, C.; Hu, S.; Le, T.; Fan, G. Distribution, recognition and regulation of non-cpg methylation in the adult mammalian brain. Nat. Neurosci. 2014, 17, 215–222. [Google Scholar] [CrossRef] [PubMed]
- Robinson, M.D.; Kahraman, A.; Law, C.W.; Lindsay, H.; Nowicka, M.; Weber, L.M.; Zhou, X. Statistical methods for detecting differentially methylated loci and regions. Front. Genet. 2014, 5, 324. [Google Scholar] [CrossRef] [PubMed] [Green Version]
- Leek, J.T.; Scharpf, R.B.; Bravo, H.C.; Simcha, D.; Langmead, B.; Johnson, W.E.; Geman, D.; Baggerly, K.; Irizarry, R.A. Tackling the widespread and critical impact of batch effects in high-throughput data. Nat. Rev. Genet. 2010, 11, 733–739. [Google Scholar] [CrossRef] [PubMed]
- Zilberman, D.; Gehring, M.; Tran, R.K.; Ballinger, T.; Henikoff, S. Genome-wide analysis of arabidopsis thaliana DNA methylation uncovers an interdependence between methylation and transcription. Nat. Genet. 2007, 39, 61–69. [Google Scholar] [CrossRef] [PubMed]
- Martienssen, R.A.; Colot, V. DNA methylation and epigenetic inheritance in plants and filamentous fungi. Science 2001, 293, 1070–1074. [Google Scholar] [CrossRef] [PubMed]
- Chodavarapu, R.K.; Feng, S.; Bernatavichute, Y.V.; Chen, P.-Y.; Stroud, H.; Yu, Y.; Hetzel, J.A.; Kuo, F.; Kim, J.; Cokus, S.J. Relationship between nucleosome positioning and DNA methylation. Nature 2010, 466, 388–392. [Google Scholar] [CrossRef] [PubMed]
- Sainani, K. The Importance of Accounting for Correlated Observations; Elsevier: Amsterdam, The Netherlands, 2010. [Google Scholar]
- Lee, W.; Morris, J.S. Identification of differentially methylated loci using wavelet-based functional mixed models. Bioinformatics 2016, 32, 664–672. [Google Scholar] [CrossRef] [PubMed]
- Morris, J.S.; Carroll, R.J. Wavelet-based functional mixed models. J. R. Stat. Soc. Ser. B Stat. Methodol. 2006, 68, 179–199. [Google Scholar] [CrossRef] [PubMed]
- Kim, G.; Clarke, C.R.; Larose, H.; Tran, H.T.; Haak, D.C.; Zhang, L.; Askew, S.; Barney, J.; Westwood, J.H. Herbicide injury induces DNA methylome alterations in arabidopsis. PeerJ 2017, 5, e3560. [Google Scholar] [CrossRef] [PubMed]
- Bell, J.; Loomis, A.; Butcher, L.; Gao, F.; Zhang, B.; Hyde, C.; Sun, J.; Wu, H.; Ward, K.; Harris, J. Differential methylation of the trpa1 promoter in pain sensitivity. Nat. Commun. 2014, 5, 2978. [Google Scholar] [CrossRef] [PubMed] [Green Version]
- Akalin, A.; Kormaksson, M.; Li, S.; Garrett-Bakelman, F.E.; Figueroa, M.E.; Melnick, A.; Mason, C.E. Methylkit: A comprehensive r package for the analysis of genome-wide DNA methylation profiles. Genome Biol. 2012, 13, R87. [Google Scholar] [CrossRef] [PubMed]
- Zhu, H.; Brown, P.J.; Morris, J.S. Robust, adaptive functional regression in functional mixed model framework. J. Am. Stat. Assoc. 2011, 106, 1167–1179. [Google Scholar] [CrossRef] [PubMed]
- Andrews, S. FastQC: A Quality Control Tool for High Throughput Sequence Data. Available online: https://www.bioinformatics.babraham.ac.uk/projects/fastqc/ (accessed on 5 February 2018).
- Bolger, A.M.; Lohse, M.; Usadel, B. Trimmomatic: A flexible trimmer for illumina sequence data. Bioinformatics 2014, 30, 2114–2120. [Google Scholar] [CrossRef] [PubMed]
- Martin, M. Cutadapt removes adapter sequences from high-throughput sequencing reads. EMBnet J. 2011, 17, 10–12. [Google Scholar] [CrossRef]
- Krueger, F.; Andrews, S.R. Bismark: A flexible aligner and methylation caller for bisulfite-seq applications. Bioinformatics 2011, 27, 1571–1572. [Google Scholar] [CrossRef] [PubMed]
- Huang, D.W.; Sherman, B.T.; Tan, Q.; Kir, J.; Liu, D.; Bryant, D.; Guo, Y.; Stephens, R.; Baseler, M.W.; Lane, H.C. David bioinformatics resources: Expanded annotation database and novel algorithms to better extract biology from large gene lists. Nucleic Acids Res. 2007, 35, W169–W175. [Google Scholar] [CrossRef] [PubMed]
- Das, M.; Reichman, J.R.; Haberer, G.; Welzl, G.; Aceituno, F.F.; Mader, M.T.; Watrud, L.S.; Pfleeger, T.G.; Gutiérrez, R.A.; Schäffner, A.R. A composite transcriptional signature differentiates responses towards closely related herbicides in arabidopsis thaliana and brassica napus. Plant Mol. Biol. 2010, 72, 545–556. [Google Scholar] [CrossRef] [PubMed]
- Langmead, B.; Trapnell, C.; Pop, M.; Salzberg, S.L. Ultrafast and memory-efficient alignment of short DNA sequences to the human genome. Genome Biol. 2009, 10, R25. [Google Scholar] [CrossRef] [PubMed]
- Huang, D.W.; Sherman, B.T.; Lempicki, R.A. Systematic and integrative analysis of large gene lists using david bioinformatics resources. Nat. Protoc. 2009, 4, 44–57. [Google Scholar] [CrossRef] [PubMed]


| Chromosome | WFMM δ = 0.01; Number of DMCs | methylKit Default; q value = 0.01; Difference = 25, Number of DMCs | methylKit q value = 1.00; Difference = 4, Number of DMCs | WFMM δ = 0.01; Number of Significant Genes | methylKit Default; q value = 0.01; Difference = 25; Number of Significant Genes | methylKit q value = 1.00; Difference = 4; Number of Significant Genes |
|---|---|---|---|---|---|---|
| Chr1 | 133,512 | 12,048 | 294,153 | 4041 | 3098 | 7760 |
| Chr2 | 87,488 | 7627 | 244,683 | 2417 | 1887 | 5129 |
| Chr3 | 113,229 | 9863 | 274,382 | 3180 | 2459 | 6254 |
| Chr4 | 91,327 | 7708 | 227,539 | 2563 | 1943 | 4815 |
| Chr5 | 123,027 | 10,776 | 290,090 | 3622 | 2779 | 6989 |
| ChrC * | 9081 | 19 | 7306 | 0 | 0 | 0 |
| ChrM * | 0 | 0 | 66 | 0 | 0 | 0 |
| Total | 557,664 | 48,041 | 1,338,219 | 15,823 | 12,166 | 30,947 |
| Methods | Number of Significant DMRs | Number of Significant Genes Using DAVID |
|---|---|---|
| WFMM δ = 3.44 × 10⁻⁵ | 769 | 236 |
| methylKit adjusted; q value = 1.00; difference = 4.34 × 10⁻⁵ | 2023 | 892 |
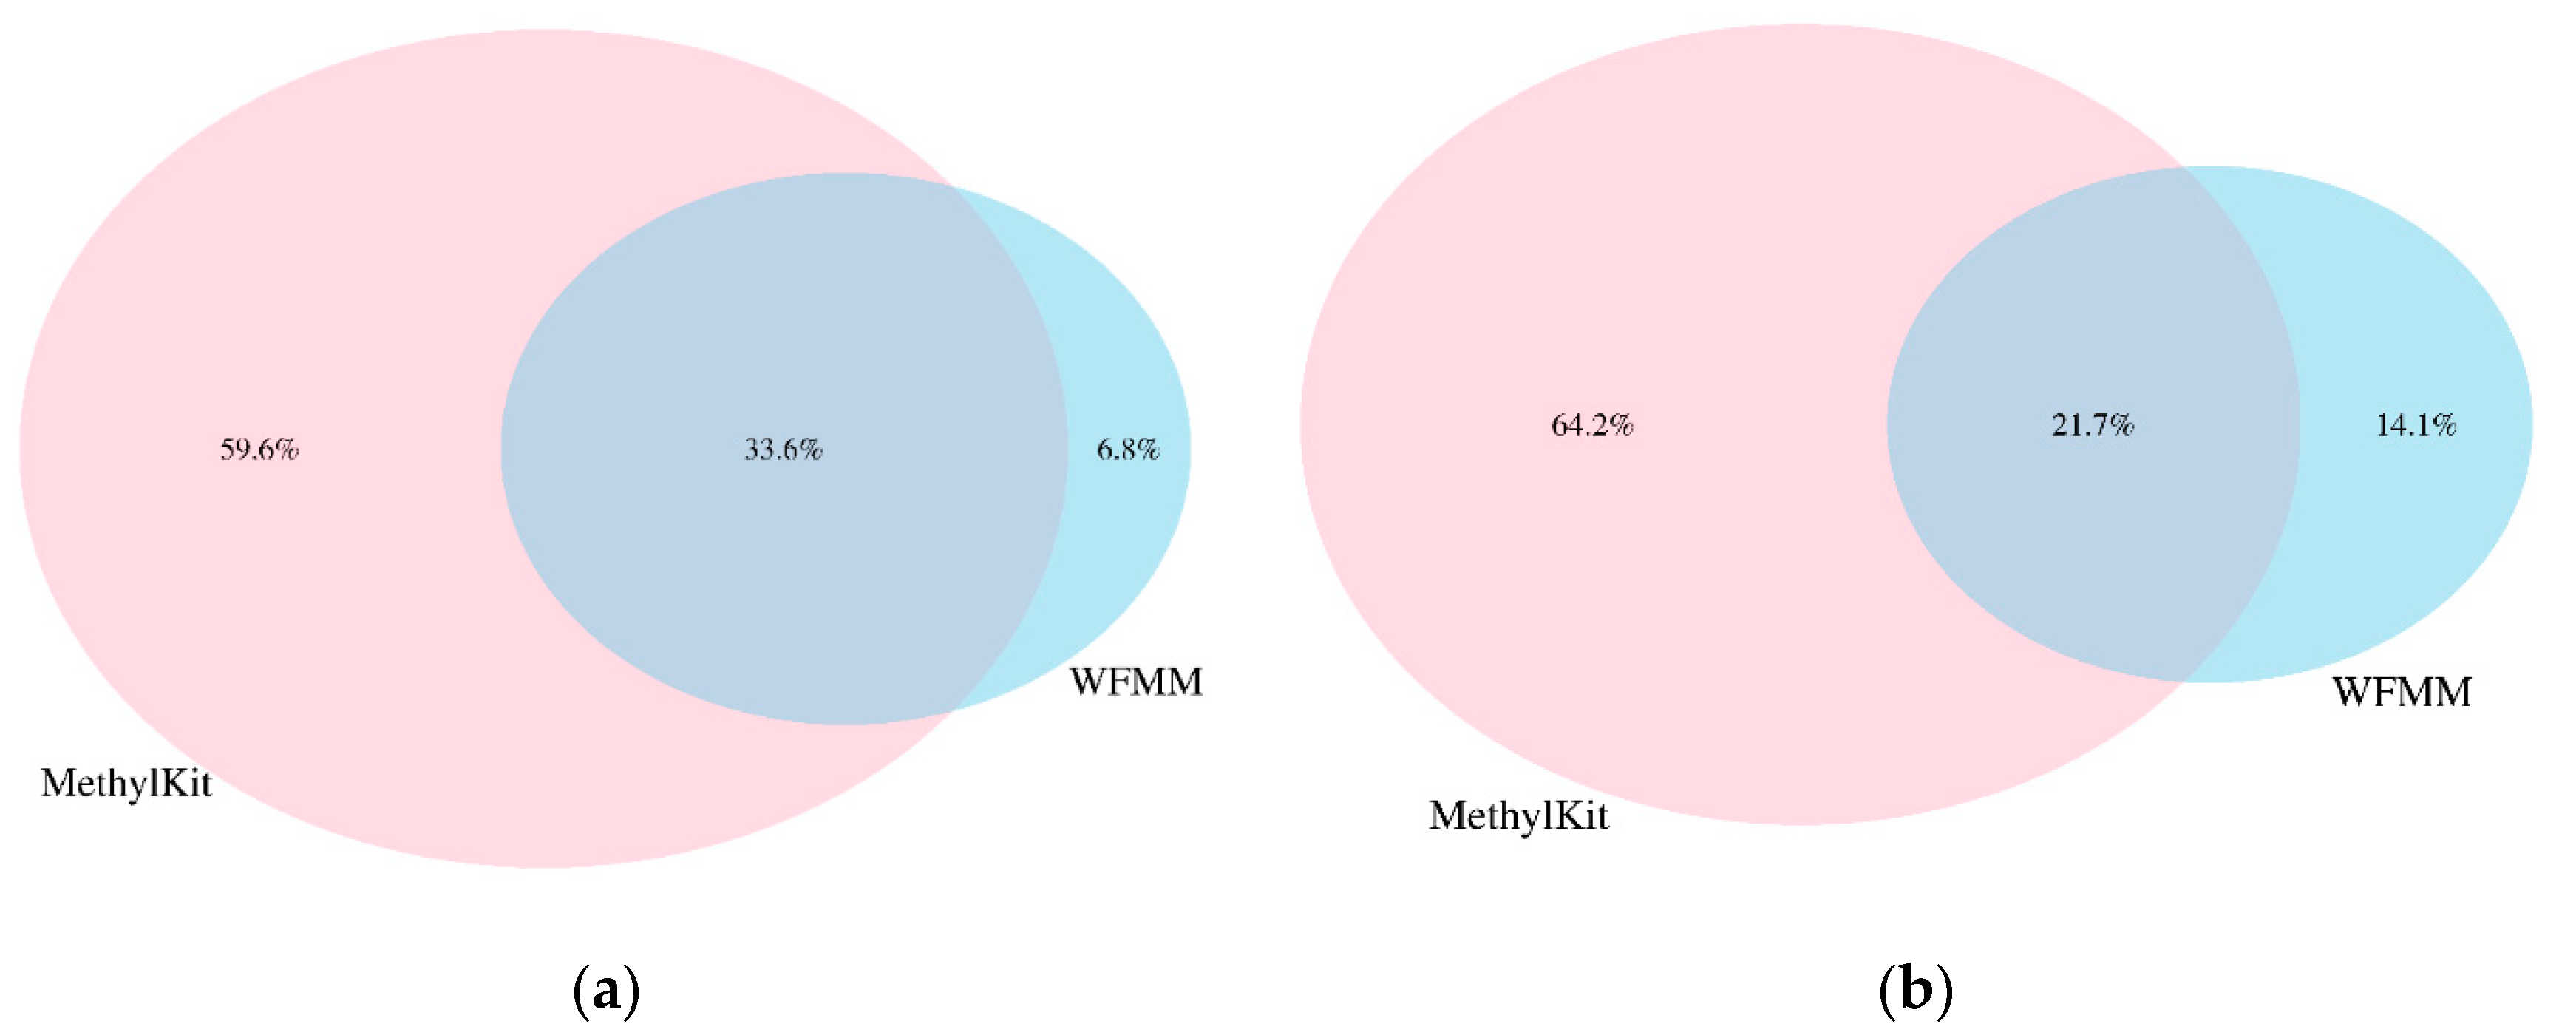
| Methods | Number of Significant Genes | Number of Shared Genes in All Significant Genes | Number of Shared Genes in Top 3000 Most Significant Genes |
|---|---|---|---|
| WFMM δ = 0.01 | 15,823 | 238 | 51 |
| methylKit default; q value = 0.01; difference = 25 | 12,166 | 181 | 39 |
| methylKit adjusted; q value = 1.00; difference = 4 | 30,947 | 466 | 44 |
© 2018 by the authors. Licensee MDPI, Basel, Switzerland. This article is an open access article distributed under the terms and conditions of the Creative Commons Attribution (CC BY) license (http://creativecommons.org/licenses/by/4.0/).
Share and Cite
Tran, H.; Zhu, H.; Wu, X.; Kim, G.; Clarke, C.R.; Larose, H.; Haak, D.C.; Askew, S.D.; Barney, J.N.; Westwood, J.H.; et al. Identification of Differentially Methylated Sites with Weak Methylation Effects. Genes 2018, 9, 75. https://doi.org/10.3390/genes9020075
Tran H, Zhu H, Wu X, Kim G, Clarke CR, Larose H, Haak DC, Askew SD, Barney JN, Westwood JH, et al. Identification of Differentially Methylated Sites with Weak Methylation Effects. Genes. 2018; 9(2):75. https://doi.org/10.3390/genes9020075
Chicago/Turabian StyleTran, Hong, Hongxiao Zhu, Xiaowei Wu, Gunjune Kim, Christopher R. Clarke, Hailey Larose, David C. Haak, Shawn D. Askew, Jacob N. Barney, James H. Westwood, and et al. 2018. "Identification of Differentially Methylated Sites with Weak Methylation Effects" Genes 9, no. 2: 75. https://doi.org/10.3390/genes9020075
APA StyleTran, H., Zhu, H., Wu, X., Kim, G., Clarke, C. R., Larose, H., Haak, D. C., Askew, S. D., Barney, J. N., Westwood, J. H., & Zhang, L. (2018). Identification of Differentially Methylated Sites with Weak Methylation Effects. Genes, 9(2), 75. https://doi.org/10.3390/genes9020075