PM1 in Ambient and Indoor Air—Urban and Rural Areas in the Upper Silesian Region, Poland


Department of Air Protection, Silesian University of Technology, 22B Konarskiego St., 44-100 Gliwice, Poland
*
Author to whom correspondence should be addressed.
Atmosphere 2019, 10(11), 662; https://doi.org/10.3390/atmos10110662
Submission received: 24 September 2019
/
Revised: 24 October 2019
/
Accepted: 26 October 2019
/
Published: 30 October 2019
(This article belongs to the Special Issue 10th Anniversary of Atmosphere: Air Quality)
Abstract
:(1) Background: The work presents results of concentration measurements of PM1, collected in the indoor air of four preschool buildings in Gliwice and its environs (Silesia Province) and in ambient air in the vicinity of four working hard coal power plants and four coking plants located in southern Poland. (2) Methods: The samples of <1 µm, 1–2.5 µm, 2.5–10 µm, and >10 µm fractions were collected with the use of Dekati® PM10 cascade impactor, and concentrations of seven trace elements (Cd, Cr, Mn, Ni, Pb, Sb, and Se) were determined. (3) Results: The concentrations of PM1 changed in the range of 3.1 μg/m3–65.3 μg/m3. Among trace elements, the highest concentrations in indoor air were evidenced for Cr (129–219 ng/m3), while in outdoor air for Pb (12.6–21.2 ng/m3). Principal Component Analysis PCA analysis extracted three factors of rural dusts, city dusts, and natural soils. (4) Conclusions: The paper points to accumulation of carcinogenic Cd, Cr, and Ni in indoor air, and significant contribution of trace elements in PM1, which, owing to long-lasting exposure and elevated sensitivity of developing organisms, may evoke effects on health of children.
1. Introduction
During the last two decades, many environmental researches have been concentrating on the quality of ambient air and on indoor air quality (IAQ). Among the air pollutants, particulate matter (PM) is considered the most hazardous. In 2016 the World Health Organization (WHO), together with the International Agency for Research on Cancer (IARC), classified ambient air and PM in ambient air to Group 1—compounds carcinogenic to humans. The authors of the IARC monograph [1] emphasize that irrespective of diameters of PM, air pollution features mutagenic and carcinogenic effects in people. Exposure of humans to PM in polluted ambient air is connected with genetic damages, which appear to be cancer predictive in people. Additionally, exposure to air pollution with PM may favor cancer progression through oxidative stress, reactions to oxidation stress and persistent upper respiratory tract infection [2].
Epidemiological tests consistently indicate a connection between pollution with PM and the number of respiratory tract and cardiovascular diseases [3,4,5]. At the same time, attention of many researchers is focused on more and more minute PM fraction. The influence of PM with aerodynamic diameters <2.5 μm (PM2.5) onto asthma and allergies have been widely studied [6,7,8,9,10,11,12]. A far smaller number of researches cover the influence of a smaller but more toxic PM1 fraction, with aerodynamic diameters of <1 μm, onto health [13,14].
Actual PM influence onto human health depends on the mechanism of depositing PM in the respiratory tract and the ability of the respiratory tract to remove such deposits, which is directly connected with the size of PM and their chemical composition. Coarse PM (2.5–10 μm) tends to deposit in the area of nose, throat, and larynx of the respiratory tract; at the same time, fine (0.1–2.5 μm) and ultra-fine (<0.1 μm) PM tends to deposit in the area of trachea and bronchi, as well as in pulmonary alveoli. Additionally, surfaces of PM may adsorb organic and non-organic pollutants [15].
The smaller PM (<1 μm), the higher the ratio between the surface area to volume and the higher the potential of harmful biological interactions with respiratory tract tissues and the risk of adverse health effects [14,16,17]. However, despite the greater health hazard, PM1 is not measured routinely, as it is not a subject of air quality standards. In the majority of countries, there are only limited data pertaining to concentration levels of PM1 and its characteristics [18,19,20,21,22,23,24,25].
In particular, Perrone et al. [18] highlighted the importance of PM1 measurements because it provides a better estimation of anthropogenic particles than PM2.5. At the same time, Titos et al. [22] underline that the contribution of PM1 in PM2.5 and PM10 is not commonly presented, while the PM size-dependence is a good tool for air quality monitoring.
The concentration of PM in ambient air depends on a large number of factors, such as local and regional PM sources, as well as the meteorological conditions and geographical position. PM2.5–10 particles are mainly formed mechanically as a result of various abrasion or crushing type of materials. Both PM fractions (fine and coarse) are of natural—mineral dust, sea salt—and anthropogenic origin—combustion as well as abrasion of tires and brakes [26]. Within a typical urbanized area of southern Poland in summer about 50% of the mass of PM2.5–10 come from natural sources (soil), while the rest is directly or indirectly linked with combustion processes [27]. The coarse particles have high settling velocity and are easily removed from the atmosphere by wet deposition. Therefore, the residence time of coarse particles in the atmospheric air is short—from minutes to days—and they can be transferred over distances approx. a few kilometers. Larger particles (d > 1 μm) settle gravitationally or by impaction on a surface, whereas small particles (d < 1 μm) diffuse to the Earth’s surface. This process becomes less efficient as the particle size increases. In the size range 0.1 μm < d < 1.0 μm, neither diffusion nor gravitational settling or impaction is efficient, thus aerosols tend to accumulate in this size range. The less efficient removal processes prolong the atmospheric residence time of the accumulation mode aerosols, thus increasing their long-range transport potential [28]. The size of particles is not increased over this category with condensational growth. Furthermore, the removal mechanisms of particles in this category are very slow mainly by activation in clouds and subsequent precipitation and, as a result, there is an accumulation of submicron particles in the atmosphere [29], increasing the threats of the citizens of urban and rural areas.
The threat posed by ambient PM to the health is one of the greatest, and yet growing, air pollution concerns worldwide. High concentrations of PM increase the risk of serious diseases in humans. The risk arises from the combined effects of the chemical composition and the size of PM particles.
As they are characterized by varied carcinogenicity and toxicity, Cd, Cr, Mn, Ni, Pb, Sb, and Se were selected for research. The IARC classifies them according to the following groups [1]:
• Group 1—elements carcinogenic to humans: Cd, Cr, Ni [30];
Cd—Anthropogenic emission sources include the metallurgical industry, coal combustion as well as incineration of waste and rubbish [31,32]. The principal exposure pathways of Cd are intake by oral and inhalation routes. Ambient air has a low Cd concentration. Levels in PM1 are in the range 0.3−1 ng/m3 [33,34].
Cr—Airborne Cr exists as a component of PM. Chromium and its compounds absorbed by the respiratory system are more toxic than those absorbed by the digestive tract. Anthropogenic emission sources include combustion of coal and fossil fuels, incineration of rubbish and sewage sludge, industry emissions and Cr resulting from long-range transportation [27,31,32]. In general, chromium concentrations in air are at the levels of a few ng/m3 in mountain and forest areas, and up to dozens of ng/m3 in urban areas. The concentrations of Cr in PM1 in Europe have been reported of less than 10 ng/m3 [35,36], while in more polluted areas e.g., Algeria reach 30 ng/m3 [37]. Significantly higher Cr concentrations were noted, for example, within the distance of 1 km from the metallurgical plant producing Cr (145–800 ng/m3) [38].
Ni—Combustion of fossil fuels, particularly in oil-fired power plants, and pollution from nickel industries are the main sources of environmental nickel exposure. Other sources of Ni emissions into the air include waste and sewage sludge incineration, mining and steel production industries and electroplating [31,32,39]. The principal exposure pathways of Ni are intake by inhalation and ingestion routes [40]. Ni occurs in PM1 in concentrations of 0.3–4 ng/m3 [41]. Ni absorption via skin contact is a major human exposure route [40].
• Group 2—elements probably carcinogenic to humans: Pb [30];
Pb—The Pb concentration in the air is varied. The range of Pb concentration in PM1 is from 1.2 to 20 ng/m3 [41], and in more polluted areas exceeds 200 ng/m3 [37]. The major sources of Pb in ambient air are industrial activities such as ore and metal processing, waste incinerators, coal combustion, and vehicle emissions [31,32,39]. The exposure pathways of Pb are intake by inhalation, ingestion, or dermal contact [42].
• Group 3—elements not classified as carcinogenic to humans: Se;
Se—selenium is a toxic element. Sources of emissions of Se include the burning of fossil fuels, particularly coal containing high levels of selenium, or industrial processes (glass manufacture and metal-processing plants) [39,43,44]. The atmospheric level of Se in most urban regions ranges from 0.1 to 10 ng/m3. The estimated average is well below 10 ng/m3, and in remote areas, it is below 1 ng/m3. The principal exposure pathways of Se are intake by inhalation routes or dermal contact [45].
• Toxic elements: Mn and Sb according to the Agency for Toxic Substances and Disease Registry (ATSDR) [46,47];
Mn—manganese is a toxic element, though a review of the literature by the ATSDR found no evidence of carcinogenic effects in humans. Mn can be released into the air by the combustion of petrol that contains MMT (Methylcyclopentadienyl manganese tricarbonyl) as an anti-knock additive instead of Pb [48]. Mn in PM1 ranges from 0.2 to 9 ng/m3 [41], however in urban areas it can reach μg/m3 [49]. The anthropogenic sources of Mn in the atmosphere are emissions from the metallurgical industry and, to a lesser extent, from the combustion of coals and liquid fuels, as well as from suspended PM [31,39]. The exposure pathways of Mn are intake by inhalation, ingestion or dermal contact.
Sb—antimony is a toxic element. Anthropogenic sources include non-ferrous metal mining, non-ferrous metal primary, and secondary smelting and refining, coal combustion as well as refuse and sludge combustion [50,51]. The range of Sb concentration in PM1 is from 0.3 to 2 ng/m3 [41]. The exposure pathways of Sb are intake by inhalation, ingestion or dermal contact [52].
This paper adds information to the current literature regarding the levels of PM1, PM2.5, PM10 and the associated trace elements in the outdoor and indoor air in the Upper Silesia Region, Poland. Parts of this study concerning PM1 in outdoor air has been presented in the previous articles [20,21], while results obtained in preschools have not been presented yet. On the basis of determination of concentration and composition of PM1 potential sources and contributions of PM were discussed. The principal component analysis (PCA) was used, to identify the possible sources of trace elements in outdoor and indoor air. Additionally, the contributions of PM1 in compare to other fractions (1–2.5, 2.5–10 and >10 μm) according to its critical role in human health.
2. Method
2.1. Locations of Measurement Points
Locations of measurement points were selected in southern Poland, in the surrounding of four hard coal power plants, four coking plants and inside four preschool buildings. The points of collecting samples from ambient air were located within the distance of approximately 2 km, due north-east from a selected power plant. Location of these measurement points was a compromise between the representativeness of a receptor and the possibility of connecting research instruments and consent of landowners. Measurement points (Figure 1) were marked with ER1, ER2, ER3 and ER4 symbols (power plants 1 to 4, rural area). At the same time, for points in which the influence of coking plants onto the air quality was researched (Figure 1), the KR1, KR2, KR3 symbols (coking plants 1, 2, 3, rural area), KU4 (coking plant 4, urban area) were introduced. The selection of theses power and coking plants had been motivated by the character of the Upper Silesia Region. This region represents the high density of industry. It has rich coal resources, and have been using coal from many years in the past. Moreover, the perspective of the coal use is relatively strong, particularly in the context of coke industry. It should be emphasized, that the air quality in the region is influenced not only by power and coking plants, but also other industrial sources, transport, and municipal sector. The Upper Silesia Region it is the largest industrial district of Poland. The region includes mining, metallurgy, transport, energy, machine, coking and chemical industry. The region is located at the intersection of several road communication routes. The road network is also well developed here. Two European routes run here: E40 (France-Russia) and E75 (Norway-Greece), 2 motorways and several national roads and provincial roads. There are 71 cities in the region and 9 cities with a population of over 100,000 people. The Silesian Voivodship is the second voivodship in terms of population in Poland, with almost 12% of the citizens [53].
Indoor measurements were conducted in four preschools—two urban ones in Gliwice and two rural ones in Przezchlebie and Świętoszowice. The first two were marked with PU1 and PU2 symbols (preschools 1 and 2, urban area). The remaining two were marked with PR3 and PR4 symbols (preschools 3 and 4, rural area). Each of the preschools was selected due to its specific location (Figure 1). The PU1 preschool is typically suburban in character; it was selected due to the neighboring Provincial Environmental Protection Monitoring Station. The PU2 preschool is typically urban in character, with high concentration of traffic pollution. The facade of the building is located 50 m from a street that extends the DK44 national road. This is a high-traffic road; during each 1-h period, there are 2400–2800 vehicles on average passing by [54]. Between the building and the street there was a parking lot, which facilitated inflow of traffic pollution. As of now, there is a Police station building. The PR3 preschool is typically rural in character, located in an area free of industrial activities and featuring low traffic. The PR4 preschool is also located in rural area but in the neighborhood of A1 highway (separated by sound screens, 50 m from the preschool).
2.2. Collection of Samples
In Poland, PM emission during the year depends on ambient temperature. In the research, the uniform emissions from power and coking plants were assumed throughout the year. Unfortunately, the monthly average data on PM emissions are not available. Industrial sources are obligated to report only annual emissions. In 2015 in Poland, fuel combustion in power generating plants was responsible for 10.8% of PM2.5 emission, industrial power plants 8.3%, industrial technologies 6.2%, mobile sources 15.2%, other stationary sources 4.7%, while the highest emission 53% was from households [55]. Currently, domestic fuel combustion is still the dominant PM2.5 source in Poland. The role of domestic emission is visible in seasonal cycle of PM concentration, which regardless of the location shows higher concentrations during the winter season.
In Poland the heating season starts about October and ends in March/April.
For the need to eliminate the influence of the heating season, and low emission in particular, as evidenced in the research of Zajusz-Zubek et al. [56], the measurement sessions were conducted in spring and summer of 2014 and 2015. Sampling was not performed simultaneously at all locations. The first session was conducted inside preschool buildings and lasted from 24 March to 23 May 2014, the second session in the surroundings of power plants was carried from 28 May to 20 September 2014, while the third session was performed from 4 May to 28 August 2015. Although the outdoor sampling campaigns were not carried out simultaneously, they were characterized by similar ambient temperature 18.4 ± 3.6 °C and 19.1 ± 4.8 °C in the surroundings of power and coking plants, respectively. In the case of indoor session the average ambient temperature was lower 11.7 ± 4.2 °C. Not-simultaneous measurements are the main limitation of this study, but in the case of submicron particles the removal mechanisms from the atmosphere are not as influential as in the fine and coarse fraction [29]. In the studied region the most influential air quality parameter is use of coal for heating purposes, which has been eliminated.
PM samples were collected using of Dekati® PM10 cascade impactor (Finland) with the air flow of 1.8 m3/h. Dekati® PM10 impactor provides for the collection of samples for fractions of <1; 1–2.5; 2.5–10 and >10 μm. Polycarbonate filters (Nuclepore, Whatman International Ltd., Maidstone, UK; diameter 25 mm) were used to collect samples in the first, second and third stage of the impactor. In the fourth stage, PM was collected with the use of Teflon filter (Pall Teflo R2PJ047, diameter of 47 mm, Pall, International Ltd., New York, NY, USA) which deposits particles with diameters of ≤1 μm [57].
In ambient air, the samples were collected at the height of 1.5 m from the ground, that is in the zone of breathing of adult humans. Each sampling session lasted for 7 days, and the whole measurements session lasted for 16 weeks. The length of sample collection cycles in ambient air was dictated by the need to collect the amount of at least a few μg/m3 at the lowest impaction stage (PM1). Generally in air monitoring the 24 h samples are collected [58], but also the longer sample periods are used [56,59,60]. The longer sampling period is the source of uncertainty, however, the higher mass of PM was the priority in the study.
The average volume of ambient air flowing through air filters amounted to 300 m3. On the other hand, PM samples inside preschool buildings were collected at the height of ca. 0.8 m, that is in the breathing zone of children; the collection took place in two 5-day cycles (Monday–Friday), between 7:30 a.m. and 3:30 p.m. The average volume of indoor air flowing through air filters inside preschool buildings amounted to ca. 70 m3.
The efficiency of the impactor is characterized by uncertainty of below 2.8% given by the manufacturer. In each measurement session blank filters were stored at the location of samples collection. The mass of PM collected at individual stages of impactor was determined with gravimetric method and referenced to the volume of air flow (µg/m3). The filters had been conditioned prior to and following PM collection in the temperature of 20 ± 1 °C (relative humidity of 50 ± 5%) through 48 h, and then weighed on microbalance with the accuracy of 1 μg (MXA5/1, RADWAG, Poland).
2.3. Methods of Trace Elements Analysis
The concentrations of 7 trace elements (Cd, Cr, Mn, Ni, Pb, Sb, and Se) were determined in PM1. Two methods were used to conduct analysis of these elements. Ambient air samples were determined as a sum of fractions obtained through fractionation analysis according to the procedure presented in papers [20,21,57]. The indoor air samples were determined according to the procedure presented in papers [61,62,63].
The chemical analysis was performed by two approved and recommended methods. In the indoor samples the analysis of trace elements was conducted using atomic absorption spectrometers with an acetylene-air flame (Avanta PM) and a graphite furnace (Avanta GM; GBC Scientific Equipment Pty Ltd., Melbourne, Australia). The standard solutions of the trace elements were obtained from Merck, Germany. Solutions of different concentrations were prepared by standard dilution 1000 mg/L (CeriPUR®). Afterwards, the filters with PM fractions (<1 µm, 1−2.5 µm, 2.5−10 µm, and >10 µm) were mineralised in a mixture of concentrated (ultra-high purity) HNO3 (8 cm3) and H2O2 (2 cm3), according to the PN-EN 14902 standard [64]. The outdoor samples PM collected on the relevant stage of the Dekati® PM10 cascade impactor was subjected to chemical fractionation. Subsequent stages of the investigations involved the chemical fractionation of the collected PM. The qualitative-quantitative analysis of the solutions obtained for particular fractions of outdoor samples was conducted by the method of inductively coupled plasma mass spectrometry, using ICP-MS (NexION 300D, PerkinElmer, Inc., Waltham, MA, USA) equipment. Detail information on the chemical analysis has been presented in Appendix A.
According our previous research [65], PCA has been shown to be the most useful statistical tool in the study of source apportionment of trace elements in PM. In order to obtain a reliable estimation of different sources contributing to PM1 at outdoor and indoor air, Principal Component Analysis (PCA) was used to identify major trace elements associated with different sources. Varimax rotated factor analysis was carried out using Statistica 13.3 (TIBCO Inc.) with seven trace elements as variables.
3. Results and Discussion
3.1. PM1 Concentrations
Table 1 presents concentrations of PM1 collected in outdoor air in the surroundings of selected working power plants and coking plants, and inside preschool buildings. PM1 concentrations in outdoor air were in the range of 3.1–65.3 µg/m3, and average weekly concentration in outdoor air amounted to 20.0 ± 2.4 µg/m3 in an urban area, and to 9.5 ± 4.5 µg/m3 in rural area of Upper Silesia Region. The lowest concentration (3.1 µg/m3) was detected in KR3 point, located in rural area in the surroundings of the working coking plant. On the other hand, the highest concentration (65.3 µg/m3) was detected inside the PR4 preschool, localized in rural area, in the vicinity of the highway. The average concentrations of PM1 inside urban preschools were 44.7 ± 10.9 μg/m3 (PU1) and 57.7 ± 10.2 μg/m3 (PU2), while in rural preschools were 38.2 ± 15.7 μg/m3 and 55.5 ± 13.9 μg/m3 in PR3 and PR4, respectively. As it can be seen among urban and rural preschools higher PM1 concentrations were observed in the buildings located near roads (PU2 and PR4). It must be underlined that inside preschool buildings located near roads the average concentration of PM1 exceeded acceptable level of daily concentration of PM10 (50 µg/m3), and exceeded two-fold the acceptable annual level of PM2.5 recommended by the EU (25 µg/m3).
In indoor air, the concentrations in urban and rural sites were 51.2 ± 11.4 and 45.1 ± 16.2 µg/m3, respectively. There are several different sources of PM indoors, and they depend on the condition and location of the building, also the activities of occupants and the outdoor sources [61]. Among outdoor sources industry, city traffic, top-soil and building materials reveal similar impact. Additionally, the small difference of indoor PM concentrations in preschool’s is due to regular renovation of the buildings, the similar equipment, and children’s behavior. The significant difference between PM1 indoor and outdoor is caused by the accumulation of PM in indoors. Among PM fractions particularly very small particles PM1 adhere to the surface on the interior walls [66].
When analyzing PM1 concentrations in relation to urban and rural locations, it was noted that average concentrations in urban locations exceed concentrations in rural locations. Generally, researches across the world indicate higher PM concentrations in urban areas in comparison to rural areas [67,68,69]. It must be emphasized, that due to domestic heating (low emissions) in winter season in Poland, the situation is reversed [34,56,70]. The rural areas are characterized by lower air quality than urban areas, so this research covers only spring and summer seasons.
3.2. Concentration of Trace Elements
For PM1 composition analysis, seven trace elements were selected: Cd, Cr, Mn, Ni, Pb, Sb, and Se, with their average concentrations presented in Table 1.
Comparing the concentrations of trace elements in PM1 collected in indoor air (in preschools), and in the outdoor air (in the surroundings of power and coking plants), the highest concentrations were evidenced in indoor air for Cr, Cd, Mn, and Ni. The higher concentrations in outdoor air than in indoor air were indicated for Pb, Se and Sb. For the last two, the differences in concentrations are not statistically relevant—p = 0.45 and 0.06, respectively, for Se and Sb. The highest concentration in both locations was documented for Cr, Pb and Mn, which form the following order Cr > Pb > Mn in indoor air, but in and outdoor air the decreasing order differs between urban (Pb>Cr>Mn) and rural sites (Cr > Pb > Mn). The remaining four elements form decreasing order Ni > Cd > Sb > Se characteristic for urban locations, and different orders for rural locations Se > Ni > Sb > Cd in outdoor air and Cd > Ni > Sb > Se in indoor air. Comparing concentrations of individual trace elements in urban and rural locations (Table 1), higher concentrations, with the exception of selenium, were indicated for urban areas. However, the difference between concentrations of Se in both locations is statistically irrelevant (p = 0.076).
Comparing the typically reported concentration levels of trace elements in outdoor PM1 our results generally are in similar levels to [33,34,41]. Starting with carcinogenic trace elements Cd and Ni their concentrations are slightly higher than the concentrations of other elements at urban area (KU4), 1.9 ± 0.2 ng/m3 and 5.5 ± 1.9 ng/m3, respectively. Cr levels in both urban and rural areas are comparable to more polluted regions. It was expected that in outdoor air probably carcinogenic Pb will reveal the highest concentration; however, in our study the levels did not reach the range characteristic for polluted areas. Se not classified as carcinogenic to humans was in the lower than in other European regions [45]. Remaining toxic elements (Mn and Sb) concentrations are in a range reported in Europe.
In indoor air the highest concentration of 129 ± 50.3 and 219.0 ± 12.4 ng/m3 reveal carcinogenic Cr in urban and rural sites, respectively. Even though in comparison to other regions of Poland, higher concentrations of Cr were expected in the Upper Silesia Region, the level of Cr concentrations provides no explanation why concentrations in preschools indoor air exceed 10-fold the concentrations in the surroundings of power and coking plants. Other research performed in the Polish region in Zabrze present the Cr levels 6.42 and 5.49 ng/m3 during non-heating and heating season, respectively [36]. Research in metropolitan city of Ulsan, the largest industrial city in Korea point to the similar levels in ambient PM1 in the spring and summer (5.4 and 8.5 ng/m3) [71].
Examples of trace elements emission sources are preparations for wood preservation (Cr, As) and paints (Cd, Mn, Ti, Pb) and metal hardware (Ni), dyes used in textiles (Cd, Zn, Cu) and toys (Pb), as well as fungicides (Zn) [72,73,74,75]. In addition, previous papers [61,62] indicate sewage sediments, which had been planted across the fields in the area. Sewage sediments are among the main sources of Cr in PM during summer [76,77]. In the case of toxic Mn the concentration is 14.4 ± 3.3 and 12.0 ± 4.9 ng/m3 in urban and rural preschools respectively. Among other trace elements the concentrations are from 12.6 to 21.2 ng/m3 for Pb, while Sb and Se concentrations are approx. 1 ng/m3.
3.3. Principal Component Analysis (PCA)
Table 2 first presents factor loadings from the PCA analysis at the surroundings of power plants and coking plants separately, and then together as outdoor air in comparison to indoor air of preschools. Three principal components (PCs) were extracted to explain more than 80% of the total variance. Factor loadings 0.6 or −0.6 are in bold and considered to be important, representing the contribution of each variance to the corresponding PCs.
In the surroundings of power plants, nearly 44% of the variance is dominated by the PC1 factor which has high loadings for Cd, Mn, Pb, and Sb. The second factor PC2 includes Cr and Se (44% of variance), while in the PC3 factor only Ni is included.
In the first component (PC1) extracted from PCA in PM1 collected in the surroundings of coking plants the highest loadings reveal Cr and Ni, in the same PC1 factor Se is negatively related, while Cd is taken under consideration in both PC1 and PC2 factors. The other components of PC2 are Pb and Sb. While the third component (PC3) includes Mn.
There are many power and coking plants in the Upper Silesia Region that affect the air quality, especially for submicron particles. According to the shortage of natural PM1 removal mechanisms in the atmosphere, both industrial sources have been connected in one outdoor group. In the common outdoor group Cd, Mn, Pb, and Sb represent the factor PC1 with almost 31% variance. The common sources to theses trace elements at the region may represent the re-suspension of surface road dust that comes from both coal combustion and vehicle emissions including abrasion of automobile tire [20,77,78]. The second component (PC2) was accounted with high loading of Cd, Cr, and Ni with 34% variance. The presence of a high load of all three elements could indicate a contribution to re-suspension of soil dust contaminated by sewage sludge dumping on agricultural fields which took place at this time at the rural sites [61,77]. The third component (PC3) contributed about 19% which includes Se most probably originated from a variety of industrial emissions [43].
The PCA analysis of trace element concentrations in PM1 samples collected indoors extracted slightly different PCs. The first component (PC1) contributed 38% of the total variance. This factor is strongly loaded by Pb and Sb, while Cr is negatively related to the first factor. The shared source of Pb and Sb point to an anthropogenic origin viz. coal emissions, and sewage sludge dumping on agricultural fields (Cr). The second component (PC2) contributed 31% is strongly loaded by Cd and moderately loaded by Mn and Se point to vehicular emissions as the manganese tricarbonyl compound is used as an additive in unleaded petrol to enhance automobile performance [48], while Cd, as well as Se, are emitted from fossil fuels burning. The third component (PC3) contributed about 20% of variance includes Mn and Ni. PC3 has been identified as a mixed soil factor because it contains Mn often used as the reference element for Earth’s crust [79] and Ni, although characteristic for industrial emissions, is accumulated in the soil [80].
3.4. PM1 in Comparison with Fractions 1–2.5 µm, 2.5–10 µm, and >10 µm
Studies of Chen et al. [13] have suggested that among a smaller particle size, PM1 is more harmful than PM2·5. PM1 is more likely to reach deeper into the respiratory system carrying more hazardous trace elements adsorbed on the surface. Trace elements adsorbed on PM surfaces are easily released to lung fluids hence, it is the most dangerous to human health [41,56]. Coarse particles are mainly formed through mechanical processes, such as dust carried by wind and loose soil, while fine fraction can be released by combustion of fuels or the process of air particle formation [13]. The mass concentrations of PM1, PM2.5, PM10, and total suspended particles TSP in the surroundings of power and coking plants as well as inside the preschool buildings are given in Table 3.
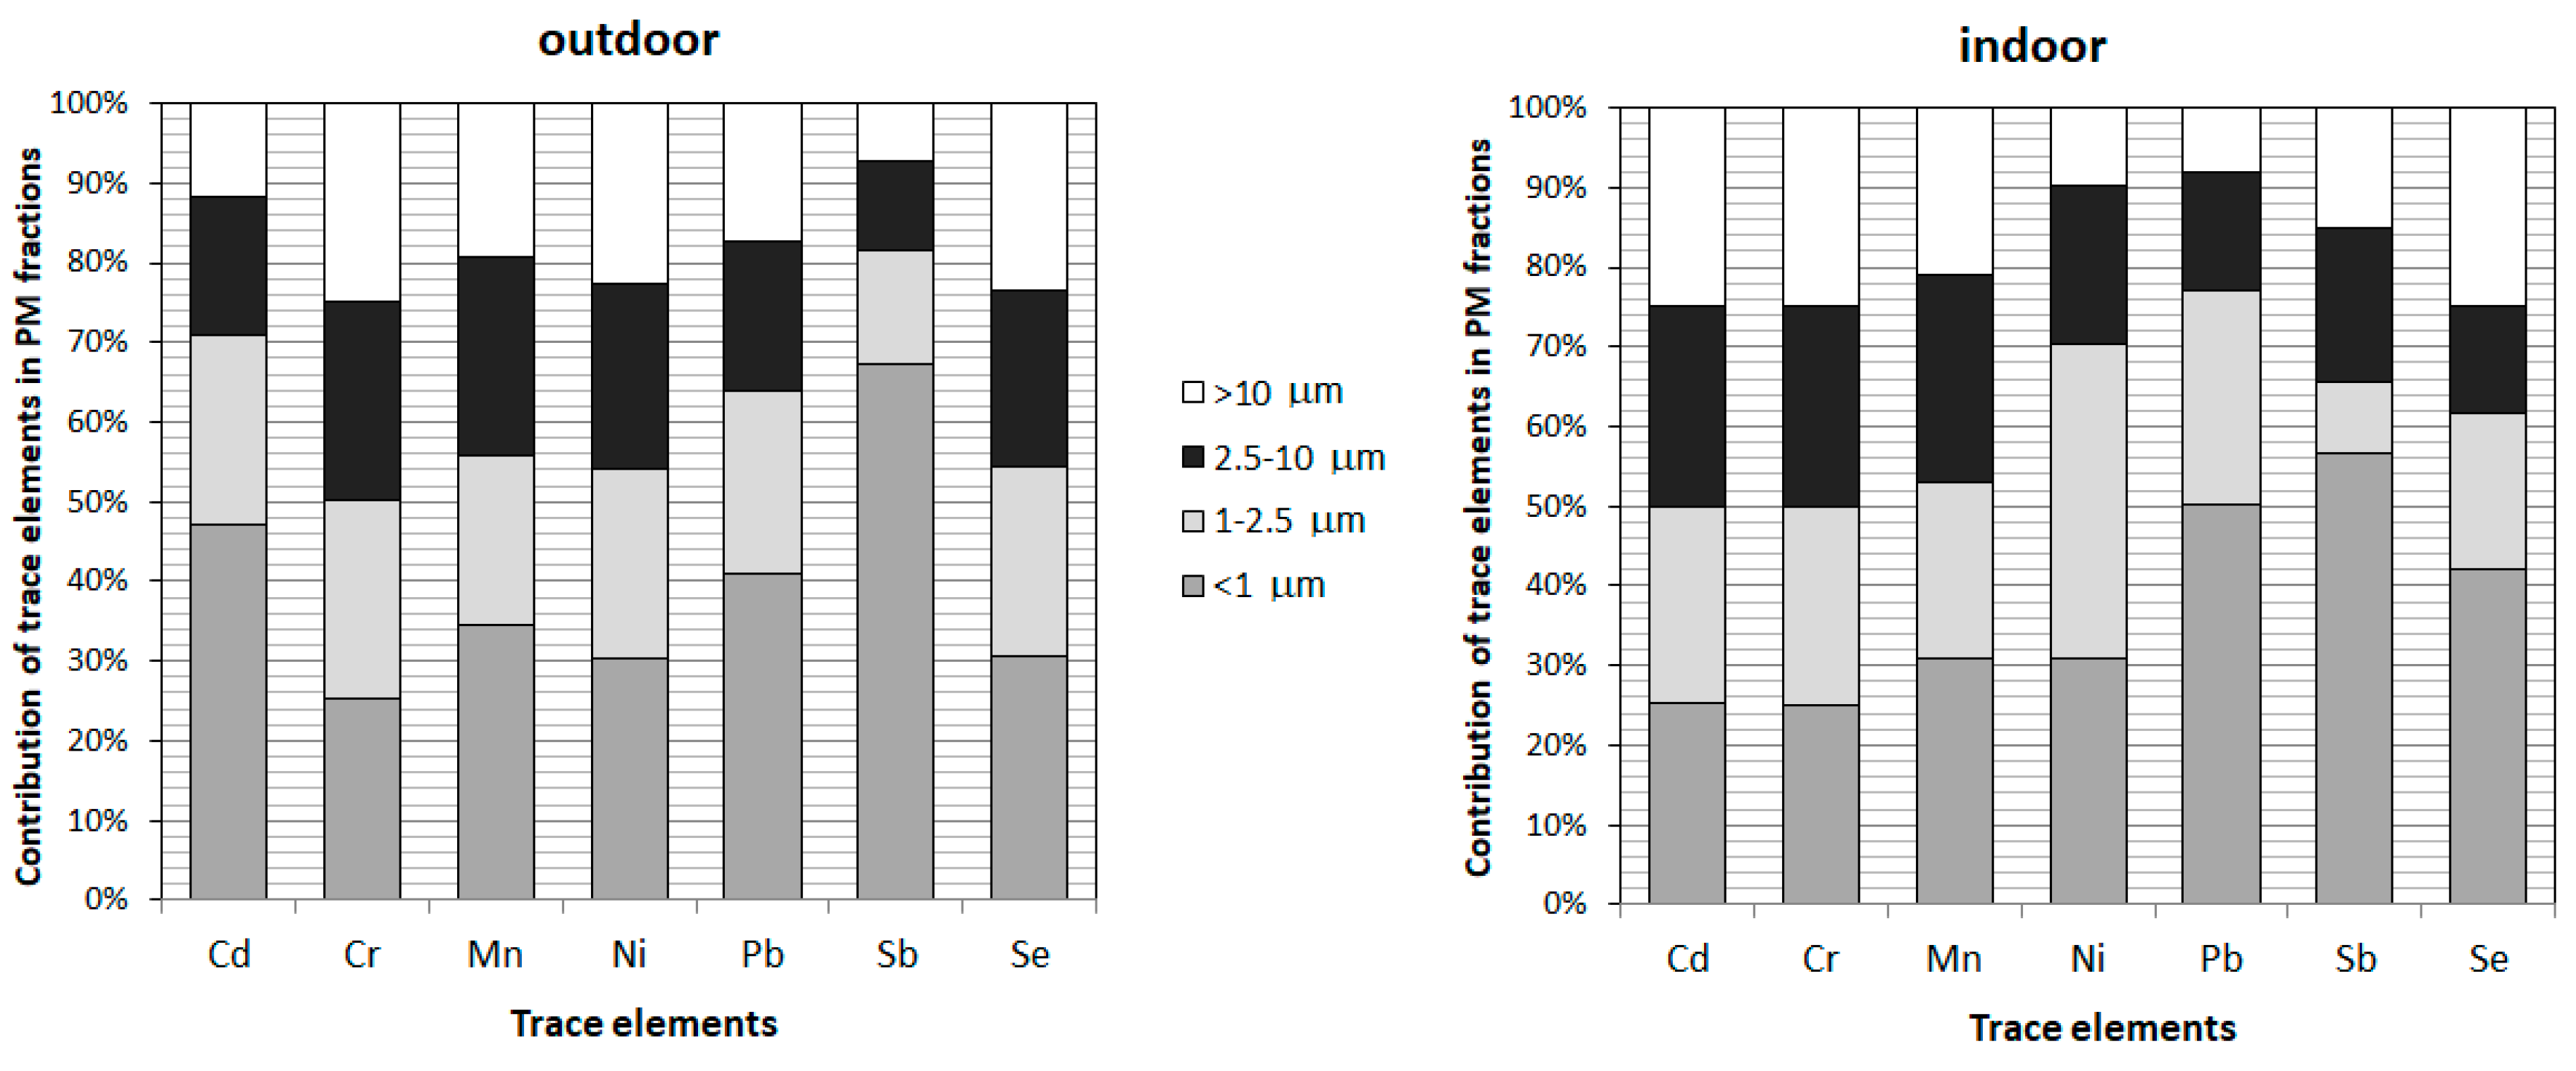
During the studied periods the coarse fraction is weakly represented. In fact, ratios PM1/PM2.5, PM1/PM10 and PM2.5/PM10 of 0.75, 0.55 and 0.80 respectively indicate a strong contribution of small particles. During the studied periods the fractional distribution is characterized by high PM1/PM2.5 ratios of 0.75 in both outdoor and indoor air. These similar ratios generally indicate the infiltration of fine particles into the buildings. The similar PM1/PM2.5 ratios of 0.5–0.7 in ambient air and 0.6–0.7 in indoor air have been reported in Belgium [81], lower values 0.55 were presented in Algeria [37], while higher ratios 0.96 have been mentioned in Italy [82]. As can be seen, the contribution of PM1 in PM2.5 presents a large variability. Which can be influenced by altitude, diurnal and seasonal periodicity, proximity to land or sea, urban or rural locations, and latitude [83]. The difference in contribution of small PM particles indicates the diversity of emission sources. The different emission sources influence not only the mass of particles but particularly the contribution of trace elements among PM fractions. These samples for analysis were divided between indoor and outdoor samples. The average contribution of the examined elements in fractions <1 µm, 1–2.5 µm, 2.5–10 µm, and >10 µm extracted from PM have been presented in Figure 2. The obtained results revealed differentiation of the trace elements in four PM fractions. Among the analyzed elements contained in PM in the surroundings of power and coking plants (outdoor samples), the highest average percentage contents in PM1, which is most dangerous for the human health, were noted for Sb (67%), Cd (47%) and Pb (41%), in the preschools (indoor samples) the highest contribution was also for Sb (57%) and Pb (50%), then Se (42%). In the other PM fractions the contribution of Pb, Sb, and Se varies from 7 to 27%.
Following the trace elements carcinogenicity, the highest contribution in PM1 is revealed to Sb — not classified as carcinogenic to humans; this could lead to a positive conclusion, but it can be misleading. Chen et al. [13] underline that although PM1 is more harmful than PM2.5 because it reaches deeper into the respiratory system carrying more toxins from anthropogenic emissions. However, both PM1 and PM2.5 are highly correlated (PM1/PM2.5 is 75%) and had similar short-term effects on emergency hospital visits. As can be seen for all trace elements, the contribution in PM2.5 is >50%. In the case of carcinogenic Cd and Ni (indoors) the contribution in PM2.5 is even >70%. Additionally, the contribution of probably carcinogenic to humans Pb in PM2.5 is >60% in outdoor air and >70% in preschools. Considering high contribution of trace elements adsorbed on small PM particles together with higher trace elements concentrations indoors more attention should be paid to the route of exposure, the frequency, and length of exposure, as well as the doses at which the adverse effects are expected to occur. Particularly children attending the researched preschools must be taken into deeper consideration according to their higher sensitivity and susceptibility to damage as young, developing organisms.
4. Conclusions
PM1, in contrast to PM10 and PM2.5, is not subject to air quality standards, nor WHO recommendations, thus it is not routinely measured. However, research studies have shown that PM1 has a higher potential to cause harmful health effects than is the case for coarse particles. This particulate is more likely to reach deeper into the respiratory system carrying with it more toxins from anthropogenic emissions. PM1 contributed nearly 75% of PM2.5 in both outdoor and indoor PM collected in the Upper Silesia Region, Poland. Thus, understanding the spatial variations of PM1 and its effects on health are relevant to the prevention and control of air pollution in Poland.
On the basis of the conducted research the following conclusions were drawn:
- Among determined concentrations of trace elements (Cd, Cr, Mn, Ni, Pb, Sb and Se) in PM1 collected in indoor air (in preschools), and in the outdoor air (in the surroundings of power plants and coking plants), the highest concentrations were evidenced for Cr, Cd, Mn and Ni.
- Source identification through PCA extracted three factors. PC1 in the outdoor air represent the re-suspension of surface road dust that comes from both coal combustion and vehicle emissions including abrasion of an automobile tire, PC2 indicates a contribution to re-suspension of soil dust contaminated by sewage sludge dumping on agricultural fields, while PC3 points to variety of industrial emissions. In the indoor air PC1 points to an anthropogenic origin viz. coal emissions, and sewage sludge dumping on agricultural fields, PC2 indicates vehicular emissions and fossil fuels burning, while PC3 has been identified as a mixed soil factor.
- Generally, the ratios of PM1/PM2.5, PM1/PM10, and PM2.5/PM10 are about 0.75, 0.55 and 0.80, respectively, which indicate a strong contribution of small particles to PM10 and PM2.5.
- The highest average percentage contents of the Cd, Cr, Mn, Ni, Pb, Sb and Se in <1 µm, 1–2.5 µm, 2.5–10 µm, and >10 µm fractions point to Sb (67%), Cd (47%) and Pb (41%) in outdoor samples, Sb (57%) and Pb (50%), then Se (42%) in indoor samples.
Supplementary Materials
The following are available online at https://www.mdpi.com/2073-4433/10/11/662/s1, Table S1. The concentration of PM1 (μg/m3) and trace elements (ng/m3) in indoor air and outdoor air; Table S2. Coordinates of the sampling points.
Author Contributions
Conceptualization, A.M. and E.Z.-Z.; methodology, E.Z.-Z.; investigation, E.Z.-Z.; writing—original draft preparation, A.M.; writing—review and editing, A.M. and E.Z.-Z.; visualization, A.M. and E.Z.-Z.; supervision, A.M. and E.Z.-Z.; project administration, A.M. and E.Z.-Z.
Funding
This research was funded by Faculty of Energy and Environmental Engineering, Silesian University of Technology (statutory research).
Conflicts of Interest
The authors declare no conflict of interest.
Appendix A
The chemical analysis was performed by two approved and recommended methods. In the indoor samples the analysis of trace elements was conducted using atomic absorption spectrometers with an acetylene-air flame (Avanta PM) and a graphite furnace (Avanta GM; GBC Scientific Equipment Pty Ltd., Melbourne, Australia). The standard solutions of the trace elements were obtained from Merck, Germany. Solutions of different concentrations were prepared by standard dilution 1000 mg/L (CeriPUR®). The PM samples were collected by the use of a three-stage impactor−Dekati® PM10 impactor (Finland), which enables the collection of <1 µm, 1−2.5 µm, 2.5−10 µm, and >10 µm fractions. Afterwards, the filters were mineralised in a mixture of concentrated (ultra-high purity) HNO3 (8 cm3) and H2O2 (2 cm3), according to the PN-EN 14902 standard [64]. Ultrapure acid and hydrogen peroxide for trace analysis from Sigma Aldrich TraceSELECTultra® were used to obtain a clear solution. Samples of the filters with PM were digested in the microwave system (Multiwave PRO, Anton Paar) at a temperature of 260 °C, and a pressure of 60 bar. The mineralisation product was placed into a 25-cm3 measuring flask, and non-ionised water was added to complete the flask volume.
The outdoor samples the PM collected on the relevant stage of the Dekati® PM10 cascade impactor was subjected to chemical fractionation. Subsequent stages of the investigations involved the chemical fractionation of the collected PM. The research was preceded by literature studies regarding the fractionation methodology, which showed differences between the conditions of the process and the extractants applied for various matrixes. One of the speciation analysis schemes for particulate matter is the analysis proposed by Tessier et al. [84], involving division into relevant fractions. This scheme was modified by Fernández Espinosa et al. [60], Sanchez-Rodas et al. [85] and Schleicher et al. [86], as well as in a publication presenting the results of a speciation analysis of trace elements contained in PM1 collected in the surroundings of coal-fired power plants [20]. The adopted scheme takes into consideration the presence of elements in the following chemical fractions: exchangeable—the most bioavailable (F1)—highly mobile fraction; related to carbonates and oxides (F2)—mobile fraction; related to organic matter (F3)—less mobile fraction; and permanently bound with minerals (F4)—not mobile fraction. All fractions are presented in Table S1. An analysis according to the adopted scheme involves the chemical fractionation of PM in the process of sequential extraction with solutions of an increasing leaching power [20,87]. Such a procedure enables the simulation of the natural and anthropogenic environmental conditions.
The solutions that were obtained from the four extraction steps (F1–F4) and in both analytical methods were filtered using the DigiFILTER system (PerkinElmer, Inc., Waltham, MA, USA; 0.45 μm). The total content of each trace element in outdoor samples was calculated as the sum of the four extraction steps [60,88].

| Fraction | Reagent | Experimental conditions |
|---|---|---|
| Fraction 1 (F1) | 15 cm3 H2O Milli-Q | 3 h shaking (room temperature) |
| Fraction 2 (F2) | 10 cm3 NH2OH⋅HCl (0,25M) | 5 h shaking (room temperature) |
| Fraction 3 (F3) | 7.5 cm3 H2O2 (30%) + 7.5 cm3 H2O2 (30%) + 15 cm3 NH4AcO (2,5M) | First evaporation at 95 °C until near dryness. Second evaporation at 95 °C until near dryness. Shaking 90 min (room temperature). |
| Fraction 4 (F4) | 10 cm3 (HNO3:HCl:HClO4) (6:2:5) | 5 h shaking (room temperature) |
The qualitative-quantitative analysis of the solutions obtained for particular fractions of outdoor samples was conducted by the method of inductively coupled plasma mass spectrometry, using ICP-MS (NexION 300D, PerkinElmer, Inc., Waltham, MA, USA) equipment. For all the simultaneously determined elements, the parameters of the equipment work were the same as those quoted in publication [56]. Certified multi-element standard solutions of 1000 μg/cm3 (CertPUR ICP multi-element standard solution VI for ICP-MS, produced by Merck, Germany) were used as calibration solutions for determining 111Cd, 53Cr, 55Mn, 60Ni, 206Pb, 121Sb and 82Se. All the samples were measured in tenfold repetitions. The determined quantification limits were based on 10 independent measurements for a blind experiment. The average value and the value of standard deviation SD were calculated for the results obtained in this way. The correct determination of element contents was verified with certified reference materials: the European Reference Material ERM®-CZ120 and the Standard Reference Material SRM 1648a (National Institute of Standards and Technology, USA). The recovery with the aforementioned certified materials reached 111% for ERM®-CZ120 and 96% for SRM 1648, Cd (97 and 105%), Cr (103 and 94%), Mn (106 and 100%), Ni (107 and 102%), Pb (107 and 105%) and Sb (99 and 91%), respectively. The certified materials did not contain Se. To determine the accuracy and precision of the extraction protocol, SRM NIST 1649a Urban Dust and NIST 1648 Urban Particulate were used. The limits of detection for the method, determined by analyzing blanks (clean filter substrates) according to PN-EN14902 standard [64] were 0.25 ng/m3 for Cd, 3.1 ng/m3 for Cr, 1.5 ng/m3 for Mn, 0.25 ng/m3 for Ni, 0.5 ng/m3 for Pb, 0.45 ng/m3 for Sb, and 1.0 ng/m3 for Se.
References
- IARC International Agency for Research on Cancer. Monographs on the Evaluation of Carcinogenic Risks to Humans; International Agency for Research on Cancer: Lyon, France, 2015. [Google Scholar]
- IARC International Agency for Research on Cancer. Outdoor Air Pollution; International Agency for Research on Cancer: Lyon, France, 2016; Volume 109. [Google Scholar]
- Skrzypek, M.; Zejda, J.E.; Kowalska, M.; Czech, E.M. Effect of residential proximity to traffic on respiratory disorders in school children in Upper Silesian Industrial Zone, Poland. Int. J. Occup. Med. Environ. Health 2013, 26, 83–91. [Google Scholar] [CrossRef] [PubMed]
- Kasznia-Kocot, J.; Kowalska, M.; Górny, R.L.; Niesler, A.; Wypych-Ślusarska, A. Environmental risk factors for respiratory symptoms and childhood asthma. Ann. Agric. Environ. Med. 2010, 17, 221–229. [Google Scholar] [PubMed]
- Kim, S.Y.; Peel, J.L.; Hannigan, M.P.; Dutton, S.J.; Sheppard, L.; Clark, M.L.; Vedal, S. The temporal lag structure of short-term associations of fine particulate matter chemical constituents and cardiovascular and respiratory hospitalizations. Environ. Health Perspect. 2012, 120, 1094–1099. [Google Scholar] [CrossRef]
- Kowalska, M.; Zejda, J.E. Relationship between PM2.5 concentration in the ambient air and daily exacerbation of respiratory diseases in the population of Silesian voivodeship during winter smog. Med. Pr. 2018, 69, 523–530. [Google Scholar] [CrossRef]
- Bose, S.; Romero, K.; Psoter, K.J.; Curriero, F.C.; Chen, C.; Johnson, C.M.; Kaji, D.; Breysse, P.N.; Williams, D.L.; Ramanathan, M.; et al. Association of traffic air pollution and rhinitis quality of life in Peruvian children with asthma. PLoS ONE 2018, 13, 1–13. [Google Scholar] [CrossRef]
- Khalili, R.; Bartell, S.M.; Hu, X.; Liu, Y.; Chang, H.H.; Belanoff, C.; Strickland, M.J.; Vieira, V.M. Early-life exposure to PM2.5 and risk of acute asthma clinical encounters among children in Massachusetts: A case-crossover analysis. Environ. Heal. 2018, 17, 1–9. [Google Scholar]
- Keet, C.A.; Keller, J.P.; Peng, R.D. Long-term coarse particulate matter exposure is associated with asthma among children in Medicaid. Am. J. Respir. Crit. Care Med. 2018, 197, 737–746. [Google Scholar] [CrossRef]
- Lavigne, É.; Bélair, M.; Duque, D.R.; Do, M.T.; Stieb, D.M.; Hystad, P.; Van Donkelaar, A.; Martin, R.V.; Crouse, D.L.; Crighton, E.; et al. Effect modification of perinatal exposure to air pollution and childhood asthma incidence. Eur. Respir. J. 2018, 51, 1–13. [Google Scholar] [CrossRef]
- Yang, M.; Chu, C.; Bloom, M.S.; Li, S.; Chen, G.; Heinrich, J.; Markevych, I.; Knibbs, L.D.; Bowatte, G.; Dharmage, S.C.; et al. Is smaller worse? New insights about associations of PM 1 and respiratory health in children and adolescents. Environ. Int. 2018, 120, 516–524. [Google Scholar] [CrossRef]
- Mainka, A.; Zajusz-Zubek, E. Indoor air quality in urban and rural preschools in Upper Silesia, Poland: Particulate patter and carbon dioxide. Int. J. Environ. Res. Public Health 2015, 12, 7697–7711. [Google Scholar] [CrossRef] [PubMed]
- Chen, G.; Li, S.; Zhang, Y.; Zhang, W.; Li, D.; Wei, X.; He, Y.; Bell, M.L.; Williams, G.; Marks, G.B.; et al. Effects of ambient PM1 air pollution on daily emergency hospital visits in China: An epidemiological study. Lancet Planet. Health 2017, 1, e221–e229. [Google Scholar] [CrossRef]
- Mei, M.; Song, H.; Chen, L.; Hu, B.; Bai, R.; Xu, D.; Liu, Y.; Zhao, Y.; Chen, C. Early-life exposure to three size- fractionated ultrafine and fine atmospheric particulates in Beijing exacerbates asthma development in mature mice. Part. Fibre Toxicol. 2018, 15, 1–16. [Google Scholar] [CrossRef] [PubMed]
- Bernstein, J.A.; Alexis, N.; Bacchus, H.; Bernstein, I.L.; Fritz, P.; Horner, E.; Li, N.; Mason, S.; Nel, A.; Oullette, J.; et al. The health effects of nonindustrial indoor air pollution. J. Allergy Clin. Immunol. 2008, 121, 585–591. [Google Scholar] [CrossRef] [PubMed]
- Borm, P.J.A.; Robbins, D.; Haubold, S.; Kuhlbusch, T.; Fissan, H.; Donaldson, K.; Schins, R.; Stone, V.; Kreyling, W.; Lademann, J.; et al. The potential risks of nanomaterials: A review carried out for ECETOC. Part. Fibre Toxicol. 2006, 3, 1–35. [Google Scholar] [CrossRef] [PubMed]
- Seaton, A.; Tran, L.; Aitken, R.; Donaldson, K. Nanoparticles, human health hazard and regulation. J. R. Soc. Interface 2010, 7, S119–S129. [Google Scholar] [CrossRef] [PubMed]
- Perrone, M.R.; Becagli, S.; Garcia Orza, J.A.; Vecchi, R.; Dinoi, A.; Udisti, R.; Cabello, M. The impact of long-range-transport on PM1 and PM2.5 at a Central Mediterranean site. Atmos. Environ. 2013, 71, 176–186. [Google Scholar] [CrossRef]
- Spindler, G.; Grüner, A.; Müller, K.; Schlimper, S.; Herrmann, H. Long-term size-segregated particle (PM10, PM2.5, PM1) characterization study at Melpitz - Influence of air mass inflow, weather conditions and season. J. Atmos. Chem. 2013, 70, 165–195. [Google Scholar] [CrossRef]
- Zajusz-Zubek, E.; Kaczmarek, K.; Mainka, A. Trace Elements Speciation of Submicron Particulate Matter (PM1) Collected in the Surroundings of Power Plants. Int. J. Environ. Res. Public Health 2015, 12, 13085–13103. [Google Scholar] [CrossRef] [Green Version]
- Zajusz-Zubek, E.; Radko, T.; Mainka, A. Fractionation of trace elements and human health risk of submicron particulate matter (PM1) collected in the surroundings of coking plants. Environ. Monit. Assess. 2017, 189. [Google Scholar] [CrossRef]
- Titos, G.; Lyamani, H.; Pandolfi, M.; Alastuey, A.; Alados-Arboledas, L. Identification of fine (PM1) and coarse (PM10-1) sources of particulate matter in an urban environment. Atmos. Environ. 2014, 89, 593–602. [Google Scholar] [CrossRef] [Green Version]
- Agudelo-Castañeda, D.M.; Teixeira, E.C. Seasonal changes, identification and source apportionment of PAH in PM1.0. Atmos. Environ. 2014, 96, 186–200. [Google Scholar] [CrossRef]
- Sarti, E.; Pasti, L.; Rossi, M.; Ascanelli, M.; Pagnoni, A.; Trombini, M.; Remelli, M. The composition of PM1 and PM2.5 samples, metals and their water soluble fractions in the Bologna area (Italy). Atmos. Pollut. Res. 2015, 6, 708–718. [Google Scholar] [CrossRef]
- Lyu, X.-P.; Wang, Z.-W.; Cheng, H.-R.; Zhang, F.; Zhang, G.; Wang, X.-M.; Ling, Z.-H.; Wang, N. Chemical characteristics of submicron particulates (PM1.0) in Wuhan, Central China. Atmos. Res. 2015, 161–162, 169–178. [Google Scholar] [CrossRef]
- Seinfeld, J.H.; Pandis, S.N. Atmospheric Chemistry and Physics: From Air Pollution to Climate Change; John Wiley & Sons: New York, NY, USA, 2006. [Google Scholar]
- Rogula-Kozłowska, W.; Klejnowski, K.; Rogula-Kopiec, P.; Mathews, B.; Szopa, S. A Study on the Seasonal Mass Closure of Ambient Fine and Coarse Dusts in Zabrze, Poland. Bull. Environ. Contam. Toxicol. 2012, 88, 722–729. [Google Scholar] [CrossRef]
- Ferm, M.; Areskoug, H.; Makkonen, U.; Wåhlin, P.; Yttri, K.E. Measurements of PM1,PM2.5 and PM10 in air at Nordic Background Stations Using Low-Cost Equipment; IVL Swedish Environmental Research Institute Ltd.: Stockholm, Sweden, 2008. [Google Scholar]
- Colbeck, I.; Lazaridis, M. Aerosols and environmental pollution. Naturwissenschaften 2010, 97, 117–131. [Google Scholar] [CrossRef]
- IARC. Monographs on the Evaluation of Carcinogenic Risks to Humans; International Agency for Research on Cancer: Lyon, France, 2010; Volume 96. [Google Scholar]
- Karar, K.; Gupta, A.K.; Kumar, A.; Biswas, A.K. Characterization and Identification of the Sources of Chromium, Zinc, Lead, Cadmium, Nickel, Manganese and Iron in PM10 Particulates at the Two Sites of Kolkata, India. Environ. Monit. Assess. 2006, 120, 347–360. [Google Scholar] [CrossRef]
- Lee, P.K.; Youm, S.J.; Jo, H.Y. Heavy metal concentrations and contamination levels from Asian dust and identification of sources: A case-study. Chemosphere 2013, 91, 1018–1025. [Google Scholar] [CrossRef]
- Nordberg, G.F.; Nogawa, K.; Nordberg, M. Cadmium, 4th ed.; Elsevier: London, UK, 2014; Volume 1. [Google Scholar]
- Rogula-Kozłowska, W.; Kozielska, B.; Klejnowski, K.; Szopa, S. Hazardous Compounds in Urban PM in the Central Part of Upper Silesia (Poland) in Winter. Arch. Environ. Prot. 2013, 39, 53–65. [Google Scholar] [CrossRef]
- Langård, S.; Costa, M. Chromium, 4th ed.; Elsevier: London, UK, 2014; Volume 1. [Google Scholar]
- Widziewicz, K.; Rogula-Kozłowska, W.; Loska, K. Cancer risk from arsenic and chromium species bound to PM2.5 and PM1 - Polish case study. Atmos. Pollut. Res. 2016, 7, 884–894. [Google Scholar] [CrossRef]
- Talbi, A.; Kerchich, Y.; Kerbachi, R.; Boughedaoui, M. Assessment of annual air pollution levels with PM1, PM2.5, PM10 and associated heavy metals in Algiers, Algeria. Environ. Pollut. 2018, 232, 252–263. [Google Scholar] [CrossRef]
- Świetlik, R.; Trojanowska, M.; Molik, A.; Łożyńska, M. Źródła i formy występowania chromu w powietrzu atmosferycznym; Konieczyński, J., Ed.; Instytut Podstaw Inżynierii Środowiska Polskiej Akademii Nauk: Zabrze, Poland, 2014; pp. 227–239. [Google Scholar]
- Laden, F.; Neas, L.M.; Dockery, D.W.; Schwartz, J. Association of fine particulate matter from different sources with daily mortality in six U.S. cities. Environ. Health Perspect. 2000, 108, 941–947. [Google Scholar] [CrossRef] [PubMed]
- Klein, C.; Costa, M. Nickel, 4th ed.; Elsevier: London, UK, 2014; Volume 1. [Google Scholar]
- Wiseman, C.L.S.; Zereini, F. Characterizing metal(loid) solubility in airborne PM10, PM2.5 and PM1 in Frankfurt, Germany using simulated lung fluids. Atmos. Environ. 2014, 89, 282–289. [Google Scholar] [CrossRef]
- Skerfving, S.; Bergdahl, I.A. Lead, 4th ed.; Elsevier: London, UK, 2014; Volume 1. [Google Scholar]
- Alexander, J. Selenium, 4th ed.; Elsevier: London, UK, 2014; Volume 1. [Google Scholar]
- Chow, J.C.; Watson, J.G.; Kuhns, H.; Etyemezian, V.; Lowenthal, D.H.; Crow, D.; Kohl, S.D.; Engelbrecht, J.P.; Green, M.C. Source profiles for industrial, mobile, and area sources in the Big Bend Regional Aerosol Visibility and Observational study. Chemosphere 2004, 54, 185–208. [Google Scholar] [CrossRef] [PubMed]
- Medinsky, M.A.; Cuddihy, R.G.; Griffith, W.C.; Weissman, S.H.; McClellan, R.O. Projected uptake and toxicity of selenium compounds from the environment. Environ. Res. 1985, 36, 181–192. [Google Scholar] [CrossRef]
- ATSDR Agency for Toxic Substances and Disease Registry. Toxicological Profile for Manganese; ATSDR: Atlanta, GA, USA, 2012. [Google Scholar]
- ATSDR Agency for Toxic Substances and Disease Registry. Toxicological Profile for Antimony and Compounds; ATSDR: Atlanta, GA, USA, 2017. [Google Scholar]
- Spangler, J.G.; Reid, J.C. Environmental manganese and cancer mortality rates by county in north carolina: An ecological study. Biol. Trace Elem. Res. 2010, 133, 128–135. [Google Scholar] [CrossRef]
- U.S. EPA. 2006 Urban Air Toxics Monitoring Program (UATMP) Final Report Volume I: Main Content; U.S. Environmental Protection Agency: Morrisville, NC, USA, 2007; Volume I.
- Estrellan, C.R.; Iino, F. Toxic emissions from open burning. Chemosphere 2010, 80, 193–207. [Google Scholar] [CrossRef]
- Fujiwara, F.; Rebagliati, R.J.; Marrero, J.; Gómez, D.; Smichowski, P. Antimony as a traffic-related element in size-fractionated road dust samples collected in Buenos Aires. Microchem. J. 2011, 97, 62–67. [Google Scholar] [CrossRef]
- Tylenda, C.A.; Sullivan, D.W.; Fowler, B.A. Antimony, 4th ed.; Elsevier: London, UK, 2014; Volume 1. [Google Scholar]
- GUS Statistics Poland. Available online: https://stat.gov.pl/ (accessed on 8 October 2019).
- Kozielska, B. Concentration of benzene and its alkyl derivatives in Gliwice air. Arch. Environ. Prot. Waste Manag. Environ. Prot. 2013, 15, 81–88. [Google Scholar]
- KOBIZE - The National Center for Emissions Management. Krajowy bilans emisji SO2, NOx, CO, NH3, NMLZO, pyłów, metali ciężkich i TZO za lata 2014 - 2015 w układzie klasyfikacji SNAP Raport syntetyczny (in Polish); Instytut Ochrony Środowiska—Państwowy Instytut Badawczy: Warsaw, Poland, 2017. [Google Scholar]
- Zajusz-Zubek, E.; Mainka, A.; Korban, Z.; Pastuszka, J.S. Evaluation of highly mobile fraction of trace elements in PM10 collected in Upper Silesia (Poland): Preliminary results. Atmos. Pollut. Res. 2015, 6, 961–968. [Google Scholar] [CrossRef]
- Zajusz-Zubek, E.; Mainka, A.; Kaczmarek, K. Determination of water-soluble elements in PM2.5, PM10, and PM2.5-10 collected in the surroundings of power plants. In Proceedings of the E3S Web of Conferences, 18–21 October 2018, Zakopane, Poland; Volume 28, pp. 1–8.
- Pastuszka, J.S.; Rogula-Kozłowska, W.; Zajusz-Zubek, E. Characterization of PM10 and PM2.5 and associated heavy metals at the crossroads and urban background site in Zabrze, Upper Silesia, Poland, during the smog episodes. Environ. Monit. Assess. 2010, 168, 613–627. [Google Scholar] [CrossRef]
- Kowalska, M.; Mainka, A.; Mucha, W. Przydatność optycznego miernika do oceny narażenia ludzi na drobny pył zawarty w powietrzu pomieszczeń/The usefulness of an optical monitor for the assessment of human exposure to fine dust in indoor air. Med. Pr. 2019, 70, 1–8. [Google Scholar] [CrossRef] [PubMed]
- Fernández Espinosa, A.J.; Ternero Rodríguez, M.; Barragán De La Rosa, F.J.; Jiménez Sánchez, J.C. A chemical speciation of trace metals for fine urban particles. Atmos. Environ. 2002, 36, 773–780. [Google Scholar] [CrossRef]
- Mainka, A.; Zajusz-Zubek, E.; Kaczmarek, K. PM 2.5 in Urban and Rural Nursery Schools in Upper Silesia, Poland: Trace Elements Analysis. Int. J. Environ. Res. Public Health 2015, 12, 7990–8008. [Google Scholar] [CrossRef] [PubMed]
- Mainka, A.; Zajusz- Zubek, E.; Kaczmarek, K. PM10 composition in urban and rural nursery schools in Upper Silesia, Poland: A trace elements analysis. Int. J. Environ. Pollut. 2017, 61, 98. [Google Scholar] [CrossRef]
- Mainka, A.; Zajusz-Zubek, E.; Kozielska, B.; Brągoszewska, E. Investigation of air pollutants in rural nursery school—A case study. In Proceedings of the E3S Web of Conferences, Zakopane, Poland, 18–21 October 2017; Volume 28, pp. 1–8. [Google Scholar]
- PN-EN14902 Ambient air quality - Standard method for measurement of Pb, Cd, As and Ni in PM10 fraction of suspended particulate matter [Jakość powietrza atmosferycznego. Standardowa metoda oznaczania Pb, Cd, As i Ni we frakcji PM10 pyłu zawieszonego]; Polish Committee for Standardization: Warsaw, Poland, 2010.
- Zajusz-Zubek, E.; Mainka, A.; Kaczmarek, K. Toxic/Hazardous Substances and Environmental Engineering Dendrograms, heat maps and principal component analysis—The practical use of statistical methods for source apportionment of trace elements in PM. J. Environ. Sci. Heal. Part A 2019, 0, 1–8. [Google Scholar]
- Latif, M.T.; Yong, S.M.; Saad, A.; Mohamad, N.; Baharudin, N.H.; Bin Mokhtar, M.; Tahir, N.M. Composition of heavy metals in indoor dust and their possible exposure: A case study of preschool children in Malaysia. Air Qual. Atmos. Health 2014, 7, 181–193. [Google Scholar] [CrossRef]
- Branco, P.T.B.S.; Alvim-Ferraz, M.C.M.; Martins, F.G.; Sousa, S.I.V. Indoor air quality in urban nurseries at Porto city: Particulate matter assessment. Atmos. Environ. 2014, 84, 133–143. [Google Scholar] [CrossRef]
- Yoon, C.; Lee, K.; Park, D. Indoor air quality differences between urban and rural preschools in Korea. Environ. Sci. Pollut. Res. 2011, 18, 333–345. [Google Scholar] [CrossRef]
- Nunes, R.A.O.; Branco, P.T.B.S.; Alvim-Ferraz, M.C.M.; Martins, F.G.; Sousa, S.I.V. Particulate matter in rural and urban nursery schools in Portugal. Environ. Pollut. 2015, 202, 7–16. [Google Scholar] [CrossRef] [Green Version]
- Juda-Rezler, K.; Reizer, M.; Oudinet, J.P. Determination and analysis of PM10 source apportionment during episodes of air pollution in Central Eastern European urban areas: The case of wintertime 2006. Atmos. Environ. 2011, 45, 6557–6566. [Google Scholar] [CrossRef]
- Hieu, N.T.; Lee, B.K. Characteristics of particulate matter and metals in the ambient air from a residential area in the largest industrial city in Korea. Atmos. Res. 2010, 98, 526–537. [Google Scholar] [CrossRef]
- Darus, F.M.; Nasir, R.A.; Sumari, S.M.; Ismail, Z.S.; Omar, N.A. Heavy Metals Composition of Indoor Dust in Nursery Schools Building. Procedia Soc. Behav. Sci. 2012, 38, 169–175. [Google Scholar] [CrossRef] [Green Version]
- Ibanez, Y.; Bot, B.L.E.; Glorennec, P. House-dust metal content and bioaccessibility: A review. Eur. J. Mineral. 2010, 22, 629–637. [Google Scholar] [CrossRef]
- Fantke, P.; Aylward, L.; Bare, J.; Chiu, W.A.; Dodson, R.; Dwyer, R.; Ernstoff, A.; Howard, B.; Jantunen, M.; Jolliet, O.; et al. Advancements in Life Cycle Human Exposure and Toxicity Characterization. Environ. Health Perspect. 2018, 126, 125001. [Google Scholar] [CrossRef]
- Weschler, C.J. Changes in indoor pollutants since the 1950s. Atmos. Environ. 2009, 43, 153–169. [Google Scholar] [CrossRef]
- Wang, P.; Zhao, W. Assessment of ambient volatile organic compounds (VOCs) near major roads in urban Nanjing, China. Atmos. Res. 2008, 89, 289–297. [Google Scholar] [CrossRef]
- Kulshrestha, A.; Satsangi, P.G.; Masih, J.; Taneja, A. Metal concentration of PM2.5 and PM10 particles and seasonal variations in urban and rural environment of Agra, India. Sci. Total Environ. 2009, 407, 6196–6204. [Google Scholar] [CrossRef]
- Pey, J.; Querol, X.; Alastuey, A. Discriminating the regional and urban contributions in the North-Western Mediterranean: PM levels and composition. Atmos. Environ. 2010, 44, 1587–1596. [Google Scholar] [CrossRef]
- Wedepohl, K.H. The composition of the continental crust. Geochim. Cosmochim. Acta 1995, 59, 1217–1232. [Google Scholar] [CrossRef]
- Fowler, B.A.; Prusiewicz, C.M.; Nordberg, M. Metal Toxicology in Developing Countries, 4th ed.; Elsevier: London, UK, 2014; Volume 1. [Google Scholar]
- Buczyńska, A.J.; Krata, A.; Van Grieken, R.; Brown, A.; Polezer, G.; De Wael, K.; Potgieter-Vermaak, S. Composition of PM2.5 and PM1 on high and low pollution event days and its relation to indoor air quality in a home for the elderly. Sci. Total Environ. 2014, 490, 134–143. [Google Scholar] [CrossRef]
- Giorio, C.; Tapparo, A.; Scapellato, M.L.; Carrieri, M.; Apostoli, P.; Bartolucci, G.B. Field comparison of a personal cascade impactor sampler, an optical particle counter and CEN-EU standard methods for PM10, PM2.5 and PM1 measurement in urban environment. J. Aerosol Sci. 2013, 65, 111–120. [Google Scholar] [CrossRef]
- Salvador, P.; Almeida, S.M.; Cardoso, J.; Almeida-Silva, M.; Nunes, T.; Cerqueira, M.; Alves, C.; Reis, M.A.; Chaves, P.C.; Artinano, B.; et al. Composition and origin of PM10 in Cape Verde: Characterization of long-range transport episodes. Atmos. Environ. 2016, 127, 326–339. [Google Scholar] [CrossRef]
- Tessier, A.; Campbell, P.G.C.; Bisson, M. Sequential Extraction Procedure for the Speciation of Particulate Trace Metals. Anal. Chem. 1979, 51, 844–851. [Google Scholar] [CrossRef]
- Sanchez-Rodas, D.; Sanchez De La Campa, A.; Oliveira, V.; De La Rosa, J. Health implications of the distribution of arsenic species in airborne particulate matter. J. Inorg. Biochem. 2012, 108, 112–114. [Google Scholar] [CrossRef]
- Schleicher, N.J.; Norra, S.; Chai, F.; Chen, Y.; Wang, S.; Cen, K.; Yu, Y.; Stüben, D. Temporal variability of trace metal mobility of urban particulate matter from Beijing—A contribution to health impact assessments of aerosols. Atmos. Environ. 2011, 45, 7248–7265. [Google Scholar] [CrossRef]
- Zajusz-Zubek, E. Evaluation of Forms in Which Occur Selected Trace Elements in Suspended Dust (PM10) and Respirable Fraction (PM2.5) in the Surroundings of Coal-Fired Power Plants and Coking Plants in the Non-Heating Season; Publishing House of Silesian University of Technology: Gliwice, Poland, 2016. [Google Scholar]
- Richter, P.; Griño, P.; Ahumada, I.; Giordano, A. Total element concentration and chemical fractionation in airborne particulate matter from Santiago, Chile. Atmos. Environ. 2007, 41, 6729–6738. [Google Scholar] [CrossRef]
Figure 1.
Locations of measurement points (map data: ©2013 GeoBasis-DE/BKF (©2009), Google).
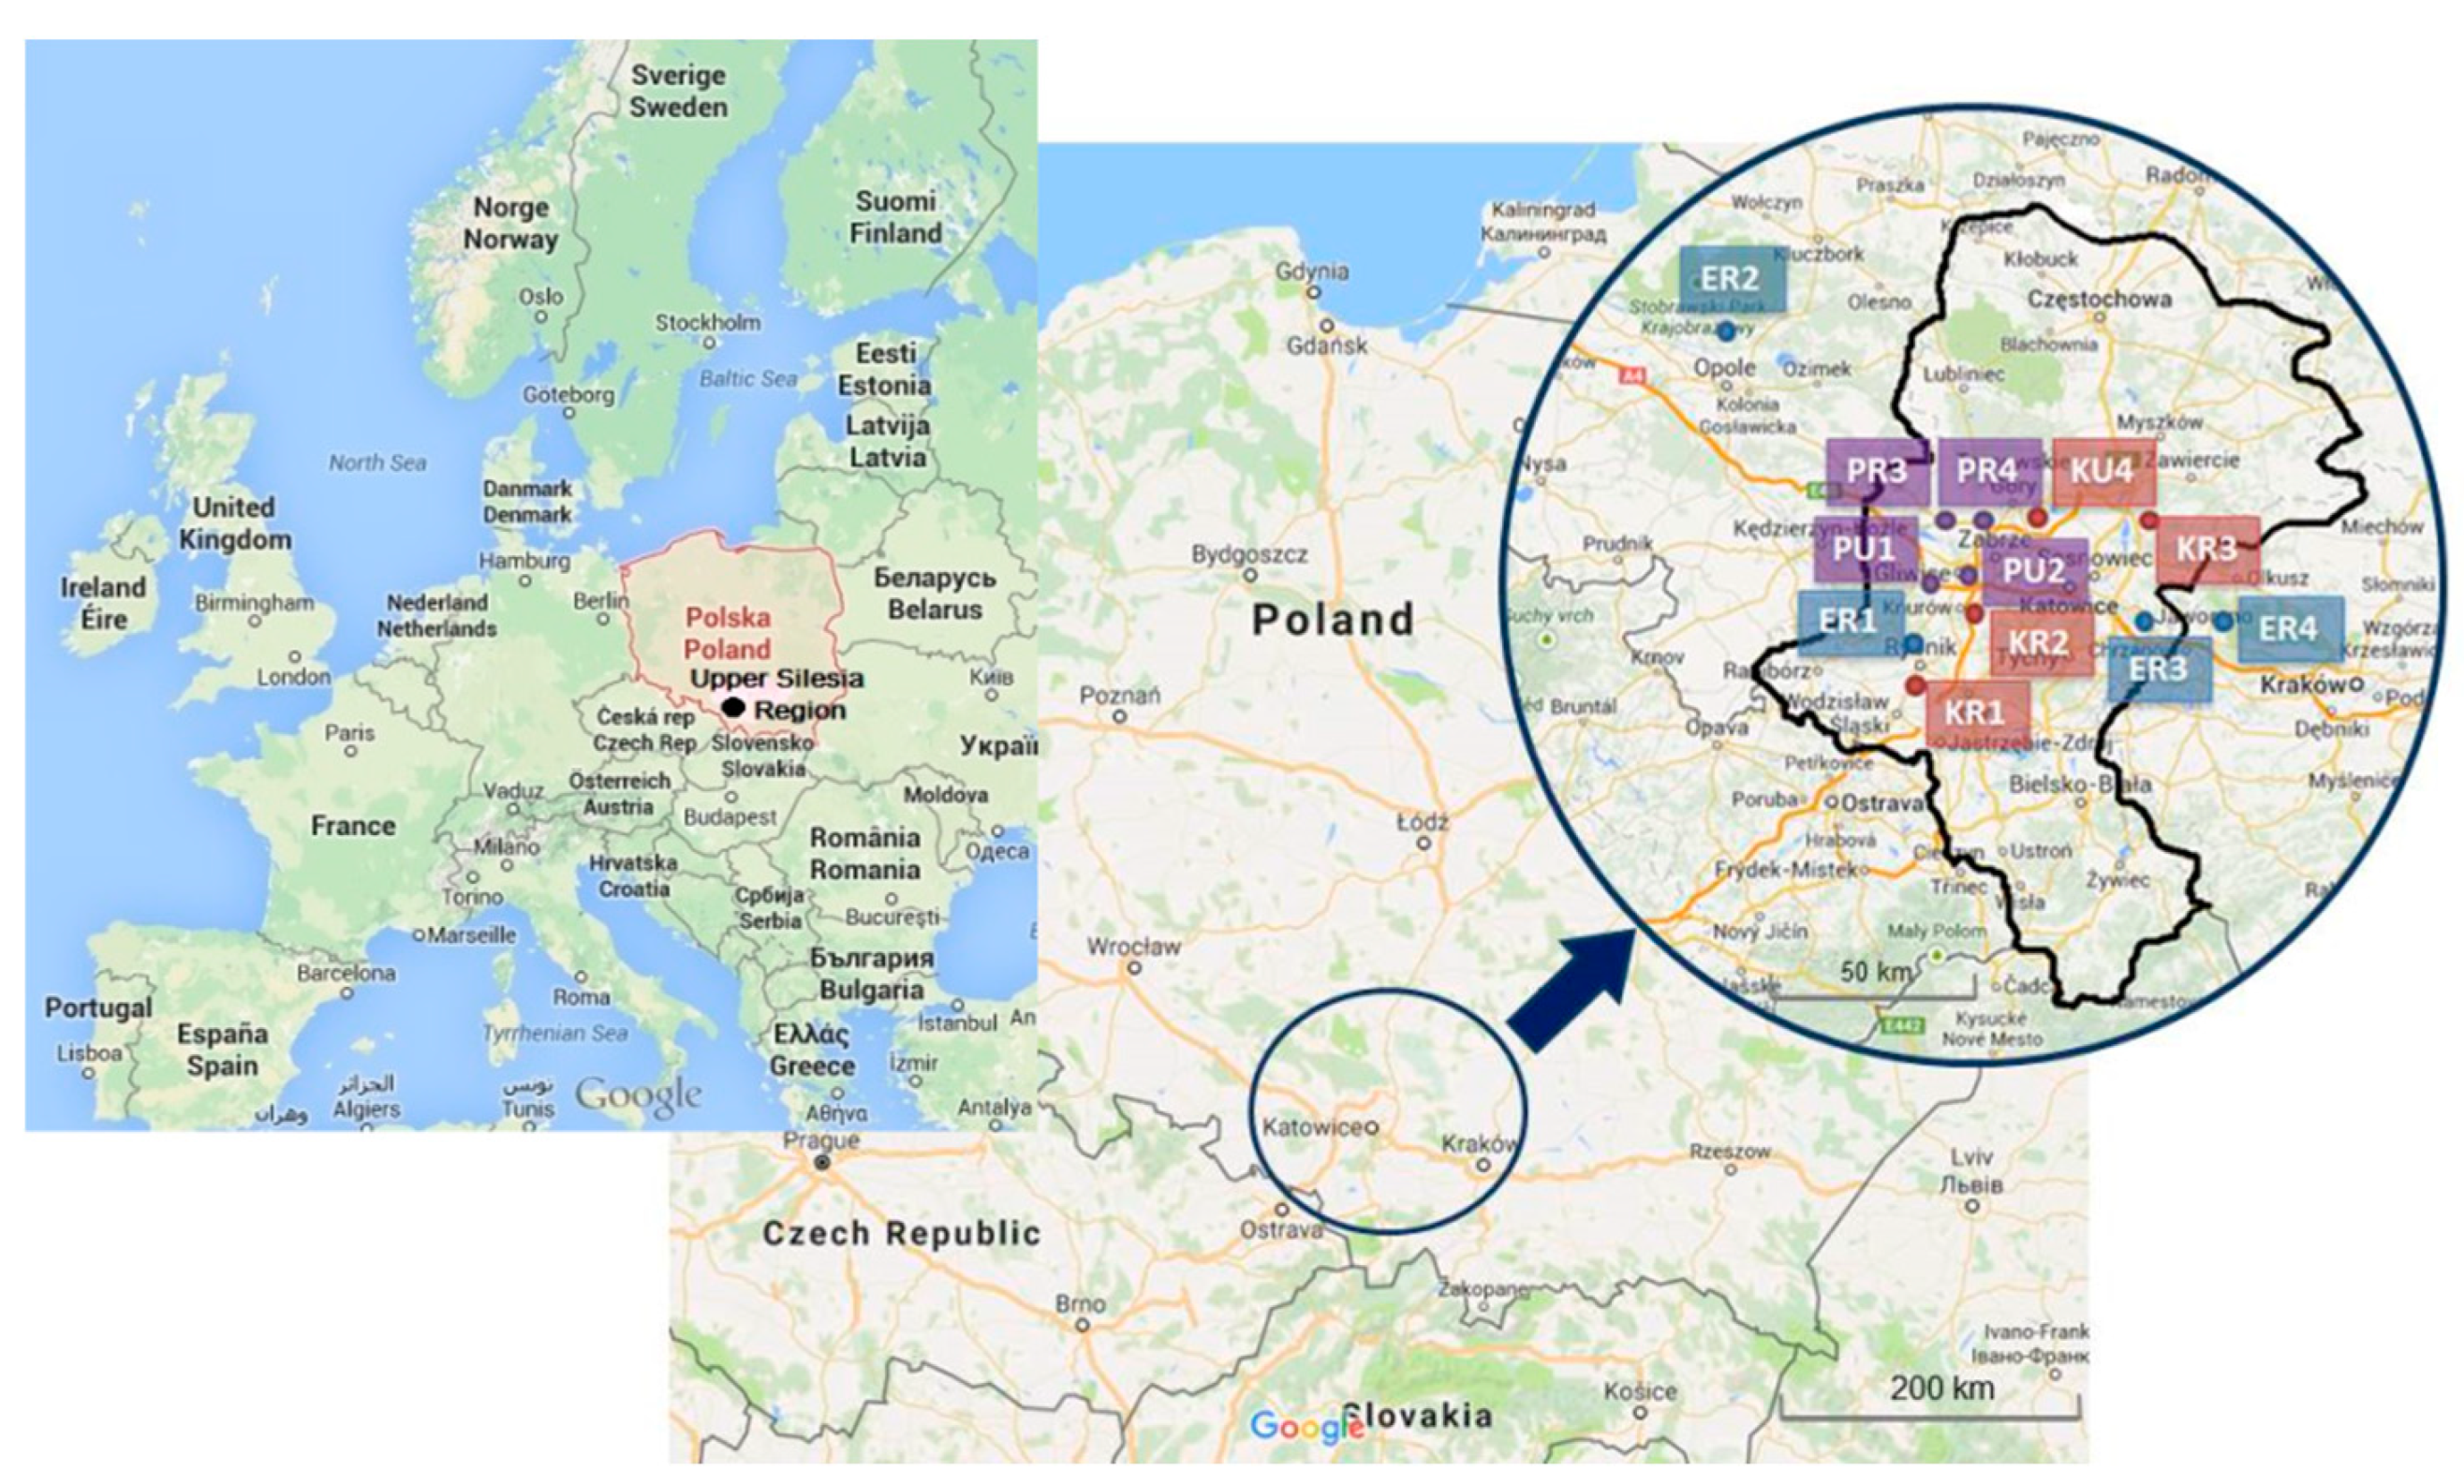
Figure 2.
Contribution of trace elements in different PM fractions (<1; 1−2.5; 2.5−10 and <10 μm).

Table 1.
Average ± SD concentration of trace elements (ng/m3) in indoor air and outdoor air as well as urban and rural locations (n = 33).
Table 1.
Average ± SD concentration of trace elements (ng/m3) in indoor air and outdoor air as well as urban and rural locations (n = 33).
| Concentrations | Outdoor | Indoor | ||
|---|---|---|---|---|
| Urban | Rural | Urban | Rural | |
| PM1, μg/m3 | 20.0 ± 2.4 | 9.5 ± 4.5 | 51.2 ± 11.4 | 45.1 ± 16.2 |
| Cd, ng/m3 | 1.9 ± 0.2 | 0.6 ± 0.3 | 9.1 ± 1.0 | 9.4 ± 1.0 |
| Cr, ng/m3 | 27.4 ± 7.4 | 15.2 ± 0.5 | 129.1 ± 50.3 | 219.0 ± 12.4 |
| Mn, ng/m3 | 11.8 ± 3.9 | 6.6 ± 3.6 | 14.4 ± 3.3 | 12.0 ± 4.9 |
| Ni, ng/m3 | 5.5 ± 1.9 | 2.2 ± 0.9 | 10.6 ± 3.3 | 6.2 ± 4.4 |
| Pb, ng/m3 | 74.0 ± 7.6 | 15.1 ± 27.7 | 21.2 ± 8.4 | 12.6 ± 8.4 |
| Sb, ng/m3 | 1.8 ± 0.6 | 1.0 ± 0.8 | 1.1 ± 0.4 | 0.3 ± 0.3 |
| Se, ng/m3 | 1.6 ± 2.7 | 3.6 ± 0.5 | 0.8 ± 0.4 | 0.4 ± 0.4 |
Table 2.
Principal component analysis in PM1.
| Trace | PC1 | PC2 | PC3 | PC1 | PC2 | PC3 |
|---|---|---|---|---|---|---|
| Elements | Power plants | Coking plants | ||||
| Cd | 0.91 | −0.19 | 0.01 | 0.62 | 0.68 | 0.29 |
| Cr | −0.06 | 0.99 | 0.09 | 0.97 | 0.18 | 0.14 |
| Mn | 0.96 | 0.22 | −0.01 | 0.11 | 0.03 | 0.98 |
| Ni | −0.07 | 0.10 | 0.99 | 0.91 | 0.36 | 0.05 |
| Pb | 0.76 | −0.55 | −0.08 | 0.53 | 0.67 | 0.38 |
| Sb | 0.86 | −0.14 | −0.24 | −0.01 | 0.97 | −0.08 |
| Se | −0.04 | 0.99 | 0.06 | −0.99 | 0.06 | −0.09 |
| % variance | 43.8 | 34.0 | 15.0 | 48.8 | 29.1 | 17.6 |
| Outdoor (Power and coking plants) | Indoor (Preschools) | |||||
| Cd | 0.69 | 0.61 | 0.29 | −0.29 | 0.91 | 0.04 |
| Cr | 0.12 | 0.92 | −0.26 | −0.94 | 0.16 | −0.22 |
| Mn | 0.60 | 0.34 | 0.17 | 0.02 | 0.71 | 0.61 |
| Ni | 0.08 | 0.87 | 0.27 | 0.11 | 0.03 | 0.97 |
| Pb | 0.66 | 0.57 | 0.32 | 0.88 | −0.08 | −0.05 |
| Sb | 0.90 | −0.06 | 0.08 | 0.81 | 0.42 | 0.03 |
| Se | −0.17 | −0.01 | −0.97 | 0.49 | 0.79 | −0.02 |
| % variance | 30.7 | 34.4 | 18.6 | 37.7 | 30.8 | 19.5 |
Loads larger than 0.6 (in absolute values) are in bold.
Table 3.
Levels and ratios of PM fractions μg/m3 measured during non-heating periods in the outdoor air (outdoor samples) and in the preschools (indoor samples).
Table 3.
Levels and ratios of PM fractions μg/m3 measured during non-heating periods in the outdoor air (outdoor samples) and in the preschools (indoor samples).
| PM Fractions | Outdoor | Indoor |
|---|---|---|
| PM1 | 10.8 ± 5.6 | 47.8 ± 13.8 |
| PM2.5 | 14.5 ± 5.6 | 63.7 ± 19.2 |
| PM10 | 18.8 ± 5.9 | 91.2 ± 24.2 |
| TSP | 22.0 ± 6.4 | 108.5 ± 29.1 |
| PM size ratios | ||
| PM1/PM2.5 | 0.74 (0.38−0.89) | 0.75 (0.66−0.84) |
| PM1/PM10 | 0.57 (0.21−0.80) | 0.52 (0.41−0.63) |
| PM1/TSP | 0.49 (0.16−0.73) | 0.44 (0.33−0.54) |
| PM2.5/PM10 | 0.77 (0.55−0.86) | 0.84 (0.62−0.78) |
© 2019 by the authors. Licensee MDPI, Basel, Switzerland. This article is an open access article distributed under the terms and conditions of the Creative Commons Attribution (CC BY) license (http://creativecommons.org/licenses/by/4.0/).
Share and Cite
MDPI and ACS Style
Mainka, A.; Zajusz-Zubek, E. PM1 in Ambient and Indoor Air—Urban and Rural Areas in the Upper Silesian Region, Poland. Atmosphere 2019, 10, 662. https://doi.org/10.3390/atmos10110662
AMA Style
Mainka A, Zajusz-Zubek E. PM1 in Ambient and Indoor Air—Urban and Rural Areas in the Upper Silesian Region, Poland. Atmosphere. 2019; 10(11):662. https://doi.org/10.3390/atmos10110662
Chicago/Turabian StyleMainka, Anna, and Elwira Zajusz-Zubek. 2019. "PM1 in Ambient and Indoor Air—Urban and Rural Areas in the Upper Silesian Region, Poland" Atmosphere 10, no. 11: 662. https://doi.org/10.3390/atmos10110662
Note that from the first issue of 2016, this journal uses article numbers instead of page numbers. See further details here.