Article

Natural Formation of Chloro- and Bromoacetone in Salt Lakes of Western Australia

1
Institute of Earth Sciences, Heidelberg University, 69120 Heidelberg, Germany
2
Max Planck Institute for Chemistry, 55128 Mainz, Germany
3
Institute of Sustainable and Environmental Chemistry, University of Lüneburg, 21335 Lüneburg, Germany
4
Atmospheric Chemistry, University of Bayreuth, 95447 Bayreuth, Germany
5
Marine and Atmospheric Chemistry, RSMAS, University of Miami, Coral Gables, FL 33149, USA
6
Max Planck Institute for Biogeochemistry, 07745 Jena, Germany
7
Institute of Coastal Research, Helmholtz-Centre, 215022 Geesthacht, Germany
8
Environmental Chemistry and Air Research, Technical University Berlin, 10623 Berlin, Germany
9
Bayreuth Center of Ecology and Environmental Research, University of Bayreuth, 95447 Bayreuth, Germany
*
Author to whom correspondence should be addressed.
Atmosphere 2019, 10(11), 663; https://doi.org/10.3390/atmos10110663
Submission received: 24 September 2019 / Revised: 25 October 2019 / Accepted: 26 October 2019 / Published: 30 October 2019
(This article belongs to the Special Issue Atmospheric Volatile Organic Compounds (VOCs))

Abstract

:
Western Australia is a semi-/arid region known for saline lakes with a wide range of geochemical parameters (pH 2.5–7.1, Cl 10–200 g L−1). This study reports on the haloacetones chloro- and bromoacetone in air over 6 salt lake shorelines. Significant emissions of chloroacetone (up to 0.2 µmol m−2 h−1) and bromoacetone (up to 1. 5 µmol m−2 h−1) were detected, and a photochemical box model was employed to evaluate the contribution of their atmospheric formation from the olefinic hydrocarbons propene and methacrolein in the gas phase. The measured concentrations could not explain the photochemical halogenation reaction, indicating a strong hitherto unknown source of haloacetones. Aqueous-phase reactions of haloacetones, investigated in the laboratory using humic acid in concentrated salt solutions, were identified as alternative formation pathway by liquid-phase reactions, acid catalyzed enolization of ketones, and subsequent halogenation. In order to verify this mechanism, we made measurements of the Henry’s law constants, rate constants for hydrolysis and nucleophilic exchange with chloride, UV-spectra and quantum yields for the photolysis of bromoacetone and 1,1-dibromoacetone in the aqueous phase. We suggest that heterogeneous processes induced by humic substances in the quasi-liquid layer of the salt crust, particle surfaces and the lake water are the predominating pathways for the formation of the observed haloacetones.

1. Introduction

Sources of organohalogens include emissions from plants, bacteria, sponges, fungi, insects, higher animals and humans [1]. Abiotic formation of halogenated volatile organic compounds (VOX) contributes significantly to the global VOX emissions; occurring in volcanoes, biomass burning, subsurface geothermal processes, soils, wetlands, oceans, the atmosphere and particularly in and above salt lakes and saline soils [2,3,4,5,6]. Saline soils cover ~3.6 × 10⁶ km2 of the terrestrial surface and are substantial sources of halogens to the troposphere [7]. As saline soils are increasing over Western Australia, it is necessary to study their emissions and atmospheric impact. In previous studies, a multitude of halogenated compounds were found (e.g., chlorofuran), that were abiotically formed in Australian salt lakes [8,9,10]. The salt lakes are well characterized and show marked geochemical differences within a small area. Lakes with pH 2.7 are located close to lakes with pH 7.1, five orders of magnitude difference in acidity, providing a real world laboratory for the investigation of different emission rates and mechanisms.
However, only few studies report on halogenated acetones in an environmental context, and most measurements to date are from water samples. Halogenated acetones (haloacetones) and, especially 1,3-dibromoacetone (CH2BrCOCH2Br) and trichloroacetone (CCl3COCH3) are known by-products in the degradation of organic compounds during water chlorination [11,12]. Effluents from pulp mills do contain tri-, tetra-, penta-, and hexachloroacetones with tetra- and pentachloroacetone to be the most abundant [13]. Chloro- and bromocetones can be formed in the aqueous phase by the acid or base-catalyzed enolization of ketones. It has been proposed [14] that there are three distinct pathways that form halogenated acetones: i) acid catalyzed, ii) weak base catalyzed and iii) strong base catalyzed. Depending on pH, it is either the enol or enolate that reacts with Br2, HOBr or BrO in the solution [15]. The acid catalyzed mechanism favors the formation of monohalogenated products due to the electron withdrawing inductive effect of the halogen substituent that hinders the enolization [16,17]. A detailed kinetic analysis of the aqueous chlorination of acetone is available in the literature [18], and the haloform reaction kinetics of bromination of acetone, bromoacetone, and 1,1-dibromacetone have been studied by Cox and Warkentin [19]. Haloacetones in water undergo rapid hydrolysis at alkaline pH that is more effective with increasing chlorine number and pH [20]. Reaction rate constants for hydrolysis of chloroacetone have been determined by Osterman-Golkar [21], and the Arrhenius expression yields a calculated lifetime of half a year for the hydrolysis of chloroacetone at 293 K.
So far, atmospheric chloro- and bromoacetone formation was only observed in the springtime Arctic troposphere and at low mixing ratios (1 to 10 pptv) [22]. The reactions between propene and atomic chlorine (Cl) or bromine (Br), respectively, were identified to be a major source of atmospheric haloacetones. Their formation occurs according to the following reaction scheme where X can be Cl or Br [23]:
X + CH2 = CH-CH3 → XCH2-CH˙-CH3
XCH2-CH˙-CH3 + O2 → XCH2-CHOO-CH3
XCH2-CHOO˙-CH3 + NO → XCH2-CHO-CH3 + NO2
XCH2-CHO˙-CH3 + O2 → XCH2-CO-CH3 + HO2
The rate constant for the reaction of propene with atomic Cl has been determined to be kC3H6+Cl = 2.71 × 10⁻¹⁰ cm3 molecule−1 s−1 at 298 K [24] and the rate constant for the reaction with atomic Br to be kC3H6+Br = 2.85 × 10⁻¹² cm3 molecule−1 s−1 [25,26]. Other known possible atmospheric sources for haloacetones are the reactions of the halogen atoms Cl and Br with methacrolein [27] with yields of 60–70% where X can be Cl or Br [28]:
H2C = C(CH3)CHO + X → XH2C-C˙(CH3)CHO
XH2C-C˙(CH3)CHO + O2 → XH2C-C(O2)(CH3)CHO
XH2C-C(OO˙)(CH3)CHO + RO2 → XH2C-C(O)(CH3)CHO + RO + O2
XH2C-C(O)(CH3)CHO + O2 → XCH2COCH3 + HO2 + CO
The rate constant of the reaction with methacrolein has been determined to be kmethacr+Cl = 3.3 × 10⁻¹⁰ cm3 molecule−1 s−1 for atomic Cl at 298 K [29] and kmethacr+Br = 2.33 × 10⁻¹¹ cm3 molecule−1 s−1 for atomic Br [30]. The reactions of 1-chloro- and 1-bromopropane with OH radicals contribute to the formation of haloacetones with yields for bromoacetone of 56% [31]:
BrH2C-CH2-CH3 + OH → BrH2C-C˙H-CH3 + H2O
with kC3H5Cl+OH = 8.61 × 10⁻¹³ cm3 molecule−1 s−1 [32,33,34] kC3H5Br + OH = 5.75 × 10⁻¹² cm3 molecule−1 s−1 [35]. Zetzsch and Behnke [36] observed the formation of chloroacetone and 1,1,-dichloroacetone in a smog chamber from the photochemical degradation of a hydrocarbon mixture in the presence of particulate sodium chloride (NaCl). Behnke and Zetzsch [37] monitored bromoacetone and 1,1-dibromoacetone in a similar aerosol smog chamber study, where chloride, sulfate and bromide were present. However, it was not determined whether the halogenated acetones were formed from organic secondary aerosols (SOA) or from the gas-phase photochemistry of the hydrocarbons.
Burkholder et al. [31] determined the UV absorption cross sections of chloro- and bromoacetone in the gas phase between 200 and 360 nm and observed the photolytic quantum yields to be high (Φ ≈ 0.5 for chloroacetone and Φ ≈ 1 for bromoacetone). This leads to short lifetimes in the troposphere that range from a few hours to days. Due to their short atmospheric lifetimes, chloro- and bromoacetones do not reach the stratosphere. The photolysis of haloacetones leads to the formation of HCl/HBr and the acetonyl radical CH3C(O)CH2 which is an intermediate in the OH + allene reaction and can lead to secondary organic aerosol (SOA) formation [38].
The main focus of this study is the investigation of a potential strong source for chloro- and bromoacetone that explains the high measured mixing ratios above Australian salt lakes. In addition, rate constants for hydrolysis of bromoacetone and the nucleophilic exchange reactions of chloride ions with bromoacetone and Henry’s Law constants have been determined, to investigate the partitioning between the gas and the liquid phase.

2. Experimental Section

The salt lakes of Western Australia are part of the Avon River catchment with an area of about 120,000 km² [39]. The lakes are situated in the Lockhart sub catchment. Topography is undulated with elevation drops from Lake Biddy to the Camm River confluence of about 28 m over 78 km and from Lake King to the confluence of about 48 m over 197 km [39,40]. The shallow ephemeral lakes are surrounded by sandflats, sand dunes and occasionally rocky outcrops. The surface is heavily weathered and contains calcretes and calcareous soils as well as acid sulfate soils and sediments [41,42]. Deep rooted native vegetation, mainly eucalyptus species, was replaced with pastures and winter growing annual crops. As a consequence, groundwater recharge by precipitation has increased while mean evaporation through plants has decreased leading to a rise of the groundwater table [43,44,45,46]. The rising groundwater extends to mineral rich layers, takes up salts and transports these ions close to the surface, causing secondary salinization [47]. In the same process of rising groundwater, Fe2+ oxidation and hydrolysis, or ferrolysis lead to an acidification [47,48,49,50,51]. Additionally, the oxidation of iron sulfides in acidic sulfate soils could be responsible for acidification [42,52].
The measurements presented here were conducted on 6 lakes with diverse pH characteristics. A thin salt crust covered the sediment around Lake Bean. The lake has a water inlet and drainages from crop fields. Lake Bean represents a neutral lake with a pH of 7.1. Lake Boats, the most acidic salt lake under investigation with a pH of 2.3, has a diameter of about 0.3 km and is surrounded by eucalyptus trees and bushes. A thick hard salt crust covers anoxic sandy sediment. The salt crust on Lake Kathleen covered the sediment with a thin layer and floated on the water (pH = 7). Lake Orr is 0.6 km in diameter, but is intersected by shallow sand dunes giving the lake a shape form. Surface water was below a pH of 4. The salt crust on Lake Shot showed small cubic NaCl crystals. The pH was 3.5. Lake Strawbridge is a remote round salt lake with a 0.6 km diameter and a closed, soft and partly reddish salt crust. The lake is surrounded by a broad belt of Salicornia and other low growing halophytes. Exoskeletons of crayfish indicate occasional flooding of the lake, probably through the main inlet in the south with a catchment area that expands through native vegetation and fields. The lake sediment is anoxic with sulfate reducing conditions. The pH was measured to be around 7.3 (see Table 1 for an overview of lake characteristics). Sampling locations were selected in the context of SOA formation events [53,54] and to cover a broad range of geochemical characteristics. For a detailed site description refer to Krause [9].
The measurements were performed using Teflon chambers to concentrate the released stable gas-phase products to detectable amounts [55]. Teflon is UV-transparent [56] and allows photochemistry to proceed at comparable rates to the surrounding environment. The 2.35 m3 Teflon chamber (fluorinated ethylene propylene–FEP 200A, DuPont, Wilmington, DE, USA, 140 cm depth and length and 120 cm height) was installed on the shore of seven salt lakes (Table 1) covering both water and sediment (Supplement S11 and S12). Gas samples were collected inside 2 L electropolished stainless steel canisters. The canisters were evacuated (< 10−3 mbar) in the laboratory by a rotary vane pump and a turbomolecular high vacuum pump and sealed with a metal bellow valve (Swagelok, SS-4H). At the sampling site, the valve was opened and the gas from the Teflon chamber (6 L in total) was pumped into the evacuated canister with a flow of 30,000 sccm up to 2 bar by a battery powered compressor pump with a Teflon® membrane (N814KTDC, KNF, Germany).
The collected samples were analyzed with a multi-detector GC/MSD/FID/ECD instrument (Agilent 7890 GC/5973 MSD) interfaced to a Markes Unity II Thermal Desorption Unit that included an Air Server and Canister Interface Accessory (CIA). A 0.8 L sample was introduced to the system at 80 cm3 min−1 after an initial flush of 0.16 L. The sample was directly concentrated on an adsorbent trap (Markes UT17O3P-2S, ozone precursor trap) held at −37 °C. Prior to adsorption on the trap, the air sample was dried by passing through a 15” × 0.25” (38.1 cm × 0.635 cm) stainless steel trap held at −18 ± 1 °C, with additional drying by the use of a Nafion drier (24” × 0.05” (60.96 cm × 0.127 cm), MD-050-24-FS-2; Perma Pure, Toms River, NJ, USA). During injection, the analytes were desorbed at 300 °C using a backflush flow. The sample was split into 2 analytical columns: a 20 m × 0.2 mm × 1.12 µ DB-624 (128-1324, Agilent Technologies) which was directed to the MS and EC detector and a 30 m × 0.25 mm × 5 µm Al2O3-PLOT column (HP-AL/S, Agilent Technologies) which was directed to the FID. A 1 m section of GS-GASPRO (Agilent Technologies) column (0.32 mm) was added to facilitate the separation of ethyne from a co-eluting compound. The total sample flow was split approximately 2/3 to the FID column (525 cm3) and 1/3 to the MSD/ECD (275 cm3). The effluent of the MSD/ECD column was connected to a capillary splitter (Agilent G3183B). Approximately 70% of the sample (192 cm3) was sent to the MSD, while 30% (83 cm3) was directed to the ECD. The temperature program of the GC started at −20 °C and was heated after 3 min to 200 °C with a rate of 10 °C min−1 where it was held for 4 min. Quantification of the samples was done by comparison to a working whole air standard that was calibrated against known mixtures, either directly or by dynamic dilutions from the standard gas (Apel and Riemer Environmental Inc. USA). Every canister was measured twice, and the multi-detector GC/MSD/FID/ECD system was run with an internal standard. The detected differences were lower than 7% for all compounds.
To investigate the contribution of the gas-phase sources for haloacetones, kinetic box modeling software (FACSIMILE) was employed, including the relevant gas-phase reactions [57]. The reactions were complemented by halogen reactions [58,59,60], and by the degradation reactions of propene and methacrolein with Cl, Br [29,30] and OH [61,62]. The photolysis rates depend on the diurnal actinic flux at the measurement site. Therefore, the photolysis rates of all relevant species, including chloro- and bromoacetone, proprnr, methacrolein, photolabile halogen compounds and important (radical) intermediates, were calculated based on the time dependent actinic flux for clear sky conditions for every 30 min beginning with sunrise by the Quick TUV calculator [63] for the measurement sites (S13). The mean daily O3 concentrations were measured in situ in the chamber with negligible diurnal variations, and the albedo was assumed to be 0.6, representing the albedo of a dry salt crust [64]. Multiplying the absorption cross sections and quantum yields (both taken from the UV/VIS Spectral Atlas of Keller-Rudek et al. [65], MPI Mainz [66]) with the actinic flux for every 30 minutes, a time profile of the photolysis rate for each species was obtained. The FACSIMILE files including the applied photolysis functions, reaction pathways and rate constants can be found in the Supplemental Material.
The measurement results of chloro- and bromoacetone, propene and methacrolein were implemented into the model by fixing the mixing ratios obtained and by fitting unknown sources and sinks between each measurement point to reproduce the changes of the measured gas-phase concentrations. Hence, the necessary unknown source/sink strengths give hints at additional unknown production or degradation pathways not included in the model.
To evaluate the processes involved in the emissions from lake water, the aqueous-phase formation of chloro- and bromoacetone from humic acid (HA) in the presence of ozone, chloride and bromide was studied in a semi-batch (continuously stirred tank) reactor in the presence and absence of simulated sunlight [67,68]. As model compounds, we chose the well characterized HA from Sigma-Aldrich (Merck KGaA, Germany). As this HA has been extracted from lignite with sodium hydroxide, it has to be purified before use. We followed the cleaning procedure outlined in the literature [69]. As the purified HA is less soluble, it was initially dissolved in 10 mL 0.1 mol L−1 NaOH and placed for 10 min into an ultrasonic bath. The solution was then diluted with ultrapure water or the respective buffer solution (see below). Afterwards it was re-placed into the ultrasonic bath for another 10 min. Finally, the HA solution was filtrated into the reaction vessel through a 0.45 µm syringe filter unit (CME 0.45 µm, Carl Roth GmbH + Co. KG, Karlsruhe, Germany). Concentrations of dissolved humic acid ranged from 30 to 40 mg L−1. The concentrations of the Br (KBr, p.a., Merck KGaA, Darmstadt, Germany) were either 8.5 × 10⁻³ mol L−1 or 17 × 10−3 mol L−1, whereas Cl solutions (NaCl, p.a., Carl Roth GmbH + Co. KG, Karlsruhe, Germany) contained 8.6 × 10⁻² mol L−1 to 8.6 × 10⁻¹ mol L−1. The pH was adjusted by addition of HCl/NaOH to buffer solutions, prepared from Na2HPO4, NaH2PO4, and H3PO4, and was checked during the experiments by a pH meter pH-197-S (Xylem Analytics GmbH & Co. KG. Germany) with a pH-electrode SenTix 41 (WTW, Germany), calibrated against commercial buffer solutions (Xylem Analytics GmbH & Co. KG.) at pH = 4.01 and 7. In the absence of buffer, the pH was typically observed to decrease from 6.9 to 6.7. The temperature of the solutions was monitored by the built-in thermistor of the pH meter. Some experiments were performed with bromide in the absence of chloride. Mixtures were filled into a 500 mL quartz-glass round-bottom flask. Halogenation was initiated by a bubbling air stream of 45 mL min−1 O3 (~ 2.4 × 10¹⁶ molecules cm−3) in pure oxygen through the solution that was constantly mixed by a magnetic stirrer. Ozone was produced by photolysis of oxygen at 185 nm with a Hg lamp (Pen-ray, UVP, Upland, Canada), a technique known to avoid contamination/acidification by nitrogen oxides. With pure water (in the absence of reactants), this semi-batch reactor was characterized with a rise time of ozone of 35 min to a steady state at an O3 level of 2.5 µmol L−1, limited by the surface decomposition lifetime of 74 min of O3 at room temperature. A standard of bromoacetone in cyclohexane was commercially available (10 mg L−1; Ehrenstorfer, Augsburg, Germany) and the purity was checked by headspace gas chromatography (HS-GC) and found to be 90.5%. The method of Levene [70] was used to synthesize a purer sample of bromoacetone (>99%) and 1,1-dibromoacetone. The raw product was purified by vacuum distillation, leading to fractions with up to 95% of 1,1-dibromoacetone and 22% of 1,3-dibromoacetone. A microliter syringe (Hamilton, 50 µL) was employed to determine the liquid density, ρ = 2.087 g ml−1 at 294 K [71] and to obtain an analytical standard of 1,1-dibromoacetone volumetrically. In this setup, O3 oxidizes Br and Cl to form the reactive species Br2, HOBr and OBr and BrCl, Cl2, HOCl and OCl respectively.
Organohalogen formation was investigated in the dark and under irradiation. For irradiation, a 500 W xenon arc lamp (Osram GmbH, Munich, Germany), placed in a water cooled housing (Messtechnik AMKO GmbH, Tornesch, Germany), was used. Light was focused by mirrors through a water filter equipped with quartz windows and an optical glass-filter with known absorbance and a cut-off at λ < 285 nm. Reaction products were measured by HS-GC with an electron capture detector (Perkin-Elmer, Auto System XL, Waltham, Ma, USA), using a 50 m × 0.5 mm × 1.8 µ Permabond SE-54-DF column (Macherey-Nagel, Oensingen, Switzerland) for separation and 1-bromo-4-fluorobenzene as internal standard. For some samples, a liquid–liquid extraction method was used instead of the HS sampling. The method was adapted from US-EPA method 511 for a lower sample volume (15 mL instead of 35 ml), extracting the 15 mL sample volume from the reaction vessel with 2 mL methyl-t-butyl ether (MTBE). About 1–1.5 mL of the MTBE-phase were analyzed after drying with sodium sulfate by the above described GC-ECD setup with liquid injection instead of head space sampling. Absorption spectra were recorded by a UV/VIS spectrophotometer (Lambda 45, Perkin-Elmer) at 2 nm resolution in 1 nm steps, using quartz cuvettes (d = 1 and 5 cm). Additional experimental details and calibration curves, chromatograms and mass spectra can be found elsewhere [67,68].
For the determination of the Henry’s law constant of bromoacetones, the vapor phase calibration method introduced by Kolb [72] was applied. Briefly, by measuring a known amount of a volatile compound in a headspace vial (without solvent) via HS-GC, the gas-phase concentration of the analyte can be calibrated. Further, the mixture of analyte and solvent is measured, and the partitioning coefficient (Kp) is calculated from the measured concentration in the gas phase and the known volumes of liquid and gas phase [73,74].
Henry’s Law constants (H) were calculated from the partitioning coefficient according to
H =   K p R T
where, R is the universal gas constant and T the absolute temperature. The temperature dependence of H can be described according to the van-t-Hoff equation.
d   l n H d   ( 1 / T ) = Δ sol H R .
where, ∆solH is the enthalpy of dissolution that was obtained by fitting the experimental data (H, T). By integrating Equation (11) and using H at 298 K as a reference:
H ( T ) = H θ     exp   ( Δ sol H R   ( 1 T 1 T θ ) )
The temperature-controlled headspace auto-sampler allowed determination of partitioning temperature dependencies (i.e., 277 K to 373 K for this study).

3. Results

3.1. Lake Measurements

Chloro- and bromoacetone were measured at maximum mixing ratios of ca. 15 ppb and 40 ppb respectively (Figure 1, S13). In general, higher mixing ratios were observed for bromoacetone over chloroacetone. Only monohalogenated acetones were detected over the salt lakes. At acidic lakes higher mixing ratios (Lake Boats (chloroacetone 14.6 ppb; bromoacetone 20.7 ppb), Lake Dune (chloroacetone 8 ppb; bromoacetone 36.3 ppb), Lake Shot (chloroacetone 11 ppb; bromoacetone 40.4 ppb)) were measured compared to the less acidic to neutral lakes (Lake Orr (Cl-Acetone 1.5 ppb; Br-Acetone 10.8 ppb), Kathleen (Cl-Acetone 3.5 ppb; Br-Acetone 12.2 ppb), Bean (Cl-Acetone 3.5 ppb; Br-Acetone 25.6 ppb), Strawbridge (Cl-Acetone 6.2 ppb; Br-Acetone 19 ppb)). Haloacetones showed low mixing ratios (MR) before sunrise (Chloroacetone acidic lakes 1.9 ± 1.3 ppb; Bromoacetone acidic lakes 9.7 ± 3.8 ppb). Maximum concentrations for the acidic lakes ranged from 8 to 14.6 ppb for chloroacetone, while the less acidic lakes displayed a maximum range of 1.5 to 6.2 ppb. For bromoacetone the maximum MRs are 20.7 to 40.4 ppb for the acidic lakes and 10.8 to 25.6 ppb for the less acidic to neutral lakes. Maximum MRs were measured around 2 p.m. and decreased slightly (several ppb) afterwards (Figure 2). Methacrolein and propene showed less pronounced variations without a uniform time pattern. The most acidic lakes (Boats and Dune) emitted the highest amount of methacrolein and propene while the less acidic to neutral lakes showed lower concentrations and fewer differences over the sampling period (see Supplementary Information). The neutral lakes (Lake Kathleen, Lake Bean, and Lake Strawbridge) were sampled with a higher frequency, but no samples were taken after 13:00. At the acidic lakes, two or three different days were used for sampling to investigate whether the diurnal behaviour is reproducible. Lake Boats is used for a brief comparison between the two sampling days. Between Lake Boats from March 8th, 2013 (Figure 1A) and Lake Boats from March 13th, 2013 only minor mixing ratio differences could be observed. Temperature, relative humidity and solar radiation were similar on these two days, and the diurnal mixing ratio trends were also very similar. On March 8th, haloacetone mixing ratios were slightly higher and did not decrease much between 8 and 10 a.m. In comparison to methacrolein, bromoacetone showed anticorrelating temporal behaviour, so highest methacrolein mixing ratios (Figure 1A) were found during the bromoacetone minimum between 8 and 10 a.m. Propene and methacrolein were found with lower mixing ratios and did not exhibit a distinct diurnal variation (Figure 1A).

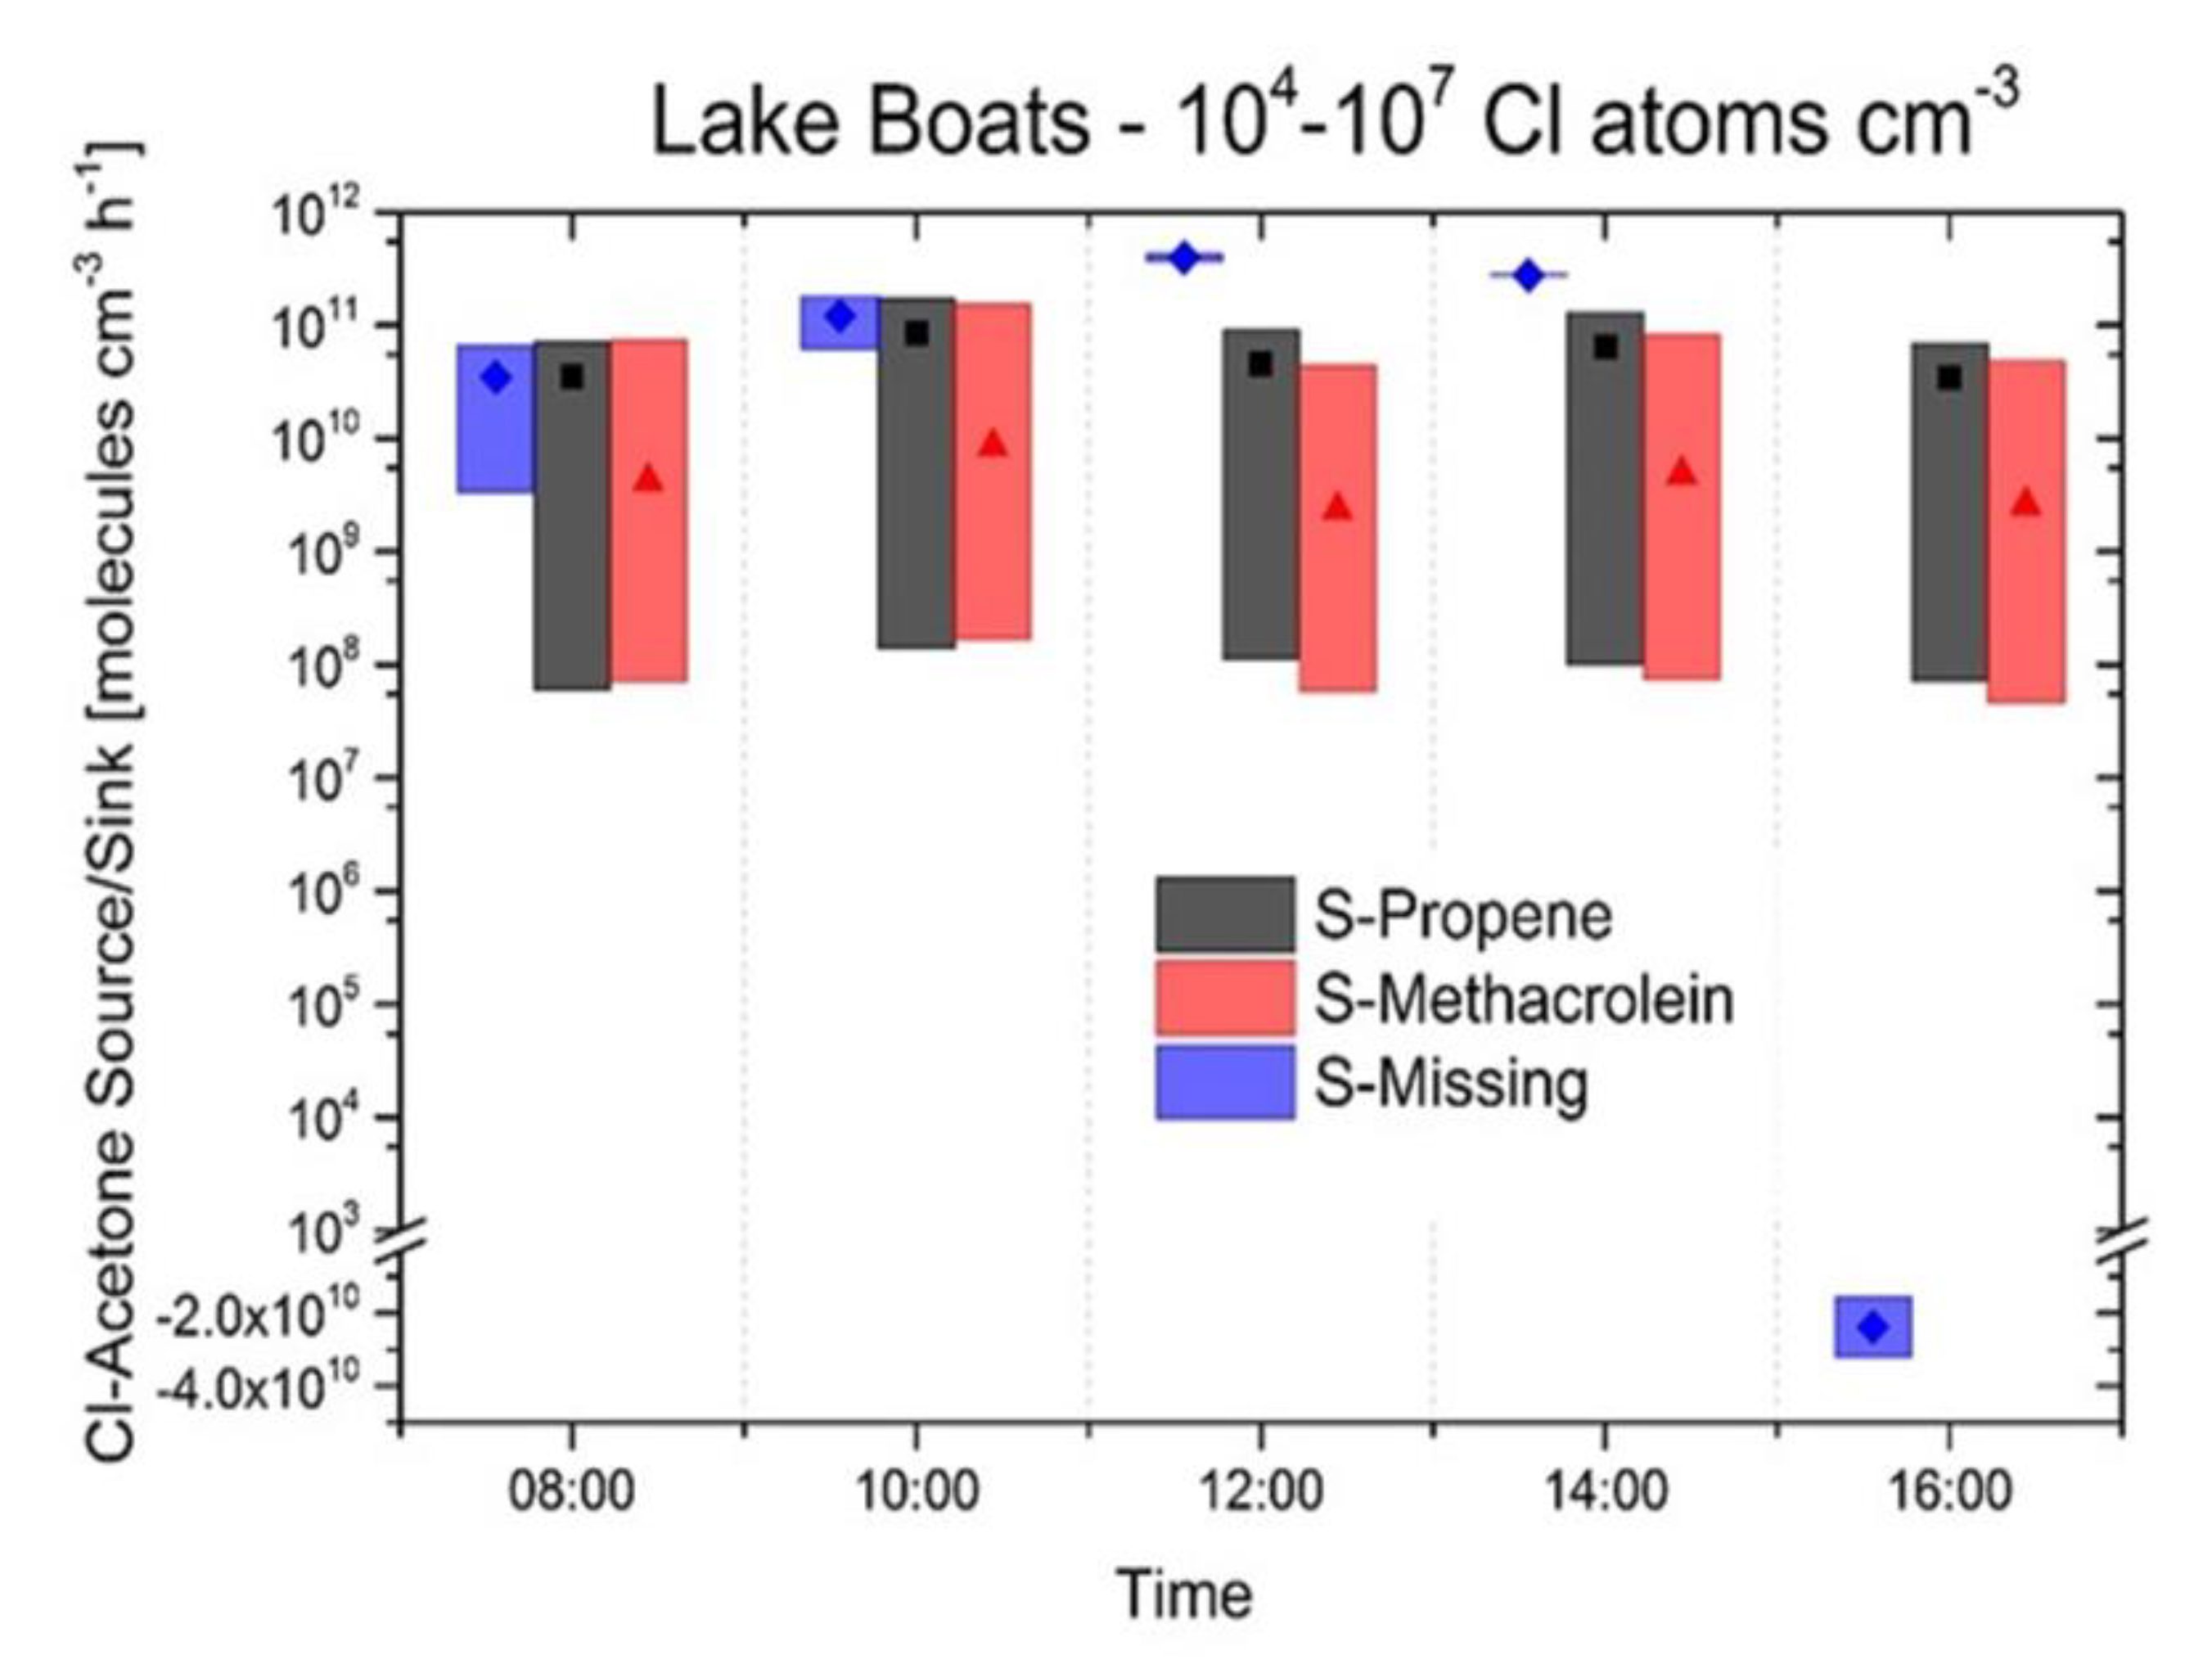
3.2. Source and Sink Balance Model

Based on the measured mixing ratios, the physical and chemical parameters inside the chamber were simulated using the FACSIMILE box model which was used to estimate the atmospheric sources of chloro- and bromoacetone. Atmospheric sinks (photolysis and reaction with OH, Cl and Br atoms) were included. The model was applied to Lake Boats, Lake Shot and Lake Bean. Here we discuss Lake Boats. The other lakes show a similar beahaviour, and the corresponding figures can be found in the Supplementary Information (S2 to S9). The fast reaction of the halogenated acetones with chlorine and bromine atoms play an important role in the system. The quasi-stationary Cl and Br concentration in the chamber was assumed to be in the range of 104 to 107 Cl atoms cm−3 and 104 to 107 Br atoms cm−3 to estimate a lower, realistic and an upper limit (based on the assumption of extremely high Cl concentrations [75,76]). The first model run with variable chlorine atom concentrations was set to a stationary Br concentration of 108 atoms cm−3 (Figure 3) and the model run with variable bromine atom concentrations was set to a stationary Cl concentration of 104 atoms cm−3 (Figure 4). The variable model output is the amount of chloroacetone (or bromoacetone) molecules produced by atmospheric reactions of propene (Figure 3 and Figure 4 black bars), methacrolein (Figure 3 and Figure 4 red bars) and the additional source that is needed to reach the measured concentrations (Figure 3 blue bars and Figure 4). The bars and corresponding shaded area represent an upper and lower limit, dependent on the Cl-atom (Br-atom) concentration. The blue bars in Figure 3 and Figure 4 represent an unknown atmospheric formation reaction or a different, not atmospheric, source. Quantifying the total missing sources and sinks allows the determination of the respective contribution for each source in molecules per cm3 and hour between each measurement. The lower and upper margins of the bars in Figure 3 represent the values for 107 and 104 Cl cm3 respectively. In general, at high Cl concentrations, propene (black bars) and methacrolein (red bars) source is increasing while the missing source decreases. At 8:00 and 10:00 (Figure 3), the three sources have the same range in order of magnitude. At 12:00 and 14:00, the missing source is clearly one order of magnitude stronger than the atmospheric production of chloroacetone. At 16:00, the model suggests propene and methacrolein to be such a big source, that an additional sink is needed to reach the measured chloroacetone concentration with the model. The variable bromine model shows a different picture (Figure 4).
Considering the source and sink balance of the various Br concentrations (105–108 Br cm−3), the missing source appears to be more important than the formation from propene and methacrolein. At every time step, bromoacetone concentrations cannot be explained by the atmospheric reactions of propene and methacrolein. The unknown sources (Figure 4 blue bars) at 12:00 and 14:00 are even two orders of magnitude higher than the known atmospheric reactions.
In Figure 5 and Figure 6, the contribution of the single sources (propene, methacrolein, unknown) to the total MR of Cl-Acetone and Br-Acetone are calculated from the model. The illustrated source fractions (Figure 5) for the considered lakes show a large contribution of the missing source mainly at 104 Cl atoms cm−3 and an almost sufficient gas-phase source at 107 Cl atoms cm−3. A value of 107 Cl atoms cm−3 represents an extremely high concentration of Cl atoms that is unlikely to be attainable in the environment sampled when compared to estimates of 105 Cl atoms cm−3 [75] for the Great Salt Lake in Utah, 104–105 Cl atoms cm−3 for the open ocean [76] or the typical Cl concentrations of 104–106 atoms cm−3 obtained in laboratory smog chamber runs at high salt concentrations [77]. Therefore, the model calculations give us a clear indication towards a large unknown source producing chloroacetone, that is even larger for bromoacetone (Figure 6).

3.3. Humic Acid as a Source of Haloacetones

Halogenation reactions of natural organic matter in the liquid phase apply to a broad range of different compounds. Humic acid in salt solutions has been investigated under laboratory conditions as a potential haloacetone precursor. Thus, HA was dissolved in salt solutions and a Xe arc lamp simulated sunlight. Our laboratory experiments [67,68,69,70,71,72,73,74,75,76,77,78] observed formation of haloacetones during ozonation in samples containing HA, Cl and Br. Haloacetones could not be detected in the dark if only chloride was added to the solution. Brominated species dominated the halogenated products even with large excess of chloride with a Br- (8.5 × 10⁻³ mol L−1) to Cl (0.86 mol L−1) ratio of about 1/100. Formation of bromoacetone was observed in the dark and under irradiation (Figure 7a). Under irradiation, the formation rate of bromoacetone stayed the same but the yield was higher. This indicates a slow, rate determining step with rapid photochemical consecutive steps. After starting the experiment, the quantity of bromoacetone increases, reaching its maximum after 24 hours (Figure 7b). The decline afterwards is presumably caused by the decreased production (due to the lower acetone formation from HA). Other sinks, such as further bromination products (e.g., 1,1-dibromoacetone and 1,3-dibromoacetone), substitution of Br by Cl, hydrolysis, photolysis and gaseous loss were also investigated (see Section 3.4 and Section 3.5).

3.4. pH-Dependent Bromoacetone Formation

The pH dependence of bromoacetone formation from irradiated salt solutions containing HA, was measured with two different methods a) the HS-GC and b) the extraction method. The HS-GC measurements were performed at pH 3 and pH 7 whereas the measurements by the extraction method (see Figure 8) were conducted in the range from pH 2 to pH 5. Formation of 1,1-dibromoacetone [68] was about a factor 3 to 4 lower than for bromoacetone at pH 3 and pH 7, while the formation was similar in the pH range between 2 and 3. At pH 5, a change can be observed as the transition from the acid catalyzed to base-catalyzed mechanism occurs and the halogen species change from HOBr to Br2. The enolate instead of the enol becomes more important for the reaction with the halogens between pH 5 and pH 7. At pH 7, a similar time profile as for pH < 5 could be observed, even three-times higher quantity than at pH 3 (as the enolate is more reactive towards halogens). This is consistent with the aforementioned scheme proposed by Rappe (1966) [14] assuming a so-called “weak base catalyzed” mechanism additionally to the well-established acid- and base-catalyzed enolization. The main product found from bromination of bromoacetone was 1,1-dibromoacetone. It followed the general trend of bromoacetone with a maximum at 24 h (Figure 8) and a subsequent decline and consistently a factor of 3 to 4 less than the monobrominated product.

3.5. Hydrolysis and Nucleophilic Substitution of Bromoacetone

The stability of bromoacetone against hydrolysis was tested at 333 and 353 K to find the optimum temperature for the HS measurements. No change could be detected within three hours at 333 K. At 353 K, bromoacetone declined with a rate of 1.1 × 10⁻⁴ s−1 and 1,1-dibromoacetone with a rate of 2.5 × 10⁻⁵ s−1. Therefore, we assume both compounds to be stable against hydrolysis under the conditions of the laboratory and ambient measurements.
Further to hydrolysis, we investigated nucleophilic substitution of Br by Cl as potential loss processes of the brominated acetones (bromoacetone and 1,1-dibromoacetone) in laboratory experiments at 316.5, 325 and 336.5 K in the presence of chloride (1.57 mol L−1) and at 316.5 K with 0.57 mol L−1 of chloride. The rate constants are shown as an Arrhenius plot (Figure 9) together with the literature data on the hydrolysis of chloroacetone [21]. The data can be described by the Arrhenius equations (in units of L mol−1 s−1) and extrapolated rate constants:
k(Bromoacetone + chloride) = 2.3 × 10¹⁰ exp (−84 kJ mol−1/RT), corresponding to 2.4 × 10⁻⁵ at 293 K
k(1,1-Dibromoacetone+chloride) = 1.0 × 10¹⁵ exp (−123 kJ mol−1/RT), corresponding to 1 × 10⁻⁷ at 293 K
k(Choroacetone+H2O) = 8.6 × 10¹³ exp (−129 kJ mol−1/RT), corresponding to 1 × 10⁻⁹ at 293 K.
The additional observations for the nucleophilic substitutions of the bromoacetone and 1,1-dibromoacetone in the presence of a three-times lower level of chloride (0.58 mol L−1) at 336.5 K were found to be in agreement. The hydrolysis of the bromoacetones in pure water was too slow for a determination at 336.5 K. Values obtained at 353 K are shown for comparison. In lack of a measured temperature dependence one may speculate for room temperature that they are slower than the reaction between chloroacetone and water (Figure 9 and Table 2).

3.6. Photolysis Rates of Bromoacetone

Photolysis rates of the brominated acetones were determined in water with and without 2-propanol (2%) as a radical scavenger for OH and Br. The decay of bromoacetone was monitored for up to 52 h. The concentration range changed by a factor of 5, that results in a photolysis lifetime of 26 h. The decay of 1,1-dibromoacetone was observed for 10 h and changed more than a factor of 50 in concentration with a resulting lifetime of 2.7 h. Bromide was observed to increase with the same time as the 1,1-dibromoacetone decreases. UV absorption spectra of bromoacetone and 1,1-dibromoacetone were determined in aqueous solution and in n-hexane between 250 and 365 nm (shown in the supplement (S10)).
The spectrum of bromoacetone in aqueous solution resembles the gas-phase spectrum reported by Burkholder et al. (2002) [31] who observed two absorption bands centered at 210 and 300 nm. Starting from 250 nm, the extinction coefficients of bromoacetone decreased slightly to a flat minimum at 250 nm and increased again to a broad absorption maximum of 40 L mol−1 cm−1 at 285 nm, extending in a parabolic fashion to more than 342 nm, where the extinction coefficient decreased below 0.5 L mol−1 cm−1. The absorption spectrum of 1,1-dibromoacetone in water had a similar shape, where the minimum (at 270 nm) and the maximum (100 L mol−1 cm−1 at 285 nm) were less pronounced and the parabolic decrease to less than 0.5 L mol−1 cm−1 was reached at 346 nm. In n-hexane, the spectra of both compounds showed a marked bathochromic shift of the maxima to 310 nm, and a weak structure with four equidistant maxima appeared in the spectrum of 1,1-dibromacetone. The quantum yields for photolysis of these compounds were determined in aqueous solution from the photolysis rates mentioned above, using iron oxalate and metamitron as actinometers [78]. The quantum yields were obtained to be Φ ± σ = 0.085 ± 0.035 for bromoacetone, leading to a photolytic lifetime of five days (in mid July at a latitude of 50°N) and Φ ± σ = 0.25 ± 0.05 for 1,1-dibromoacetone, leading to a photolytic lifetime of 15 hours.

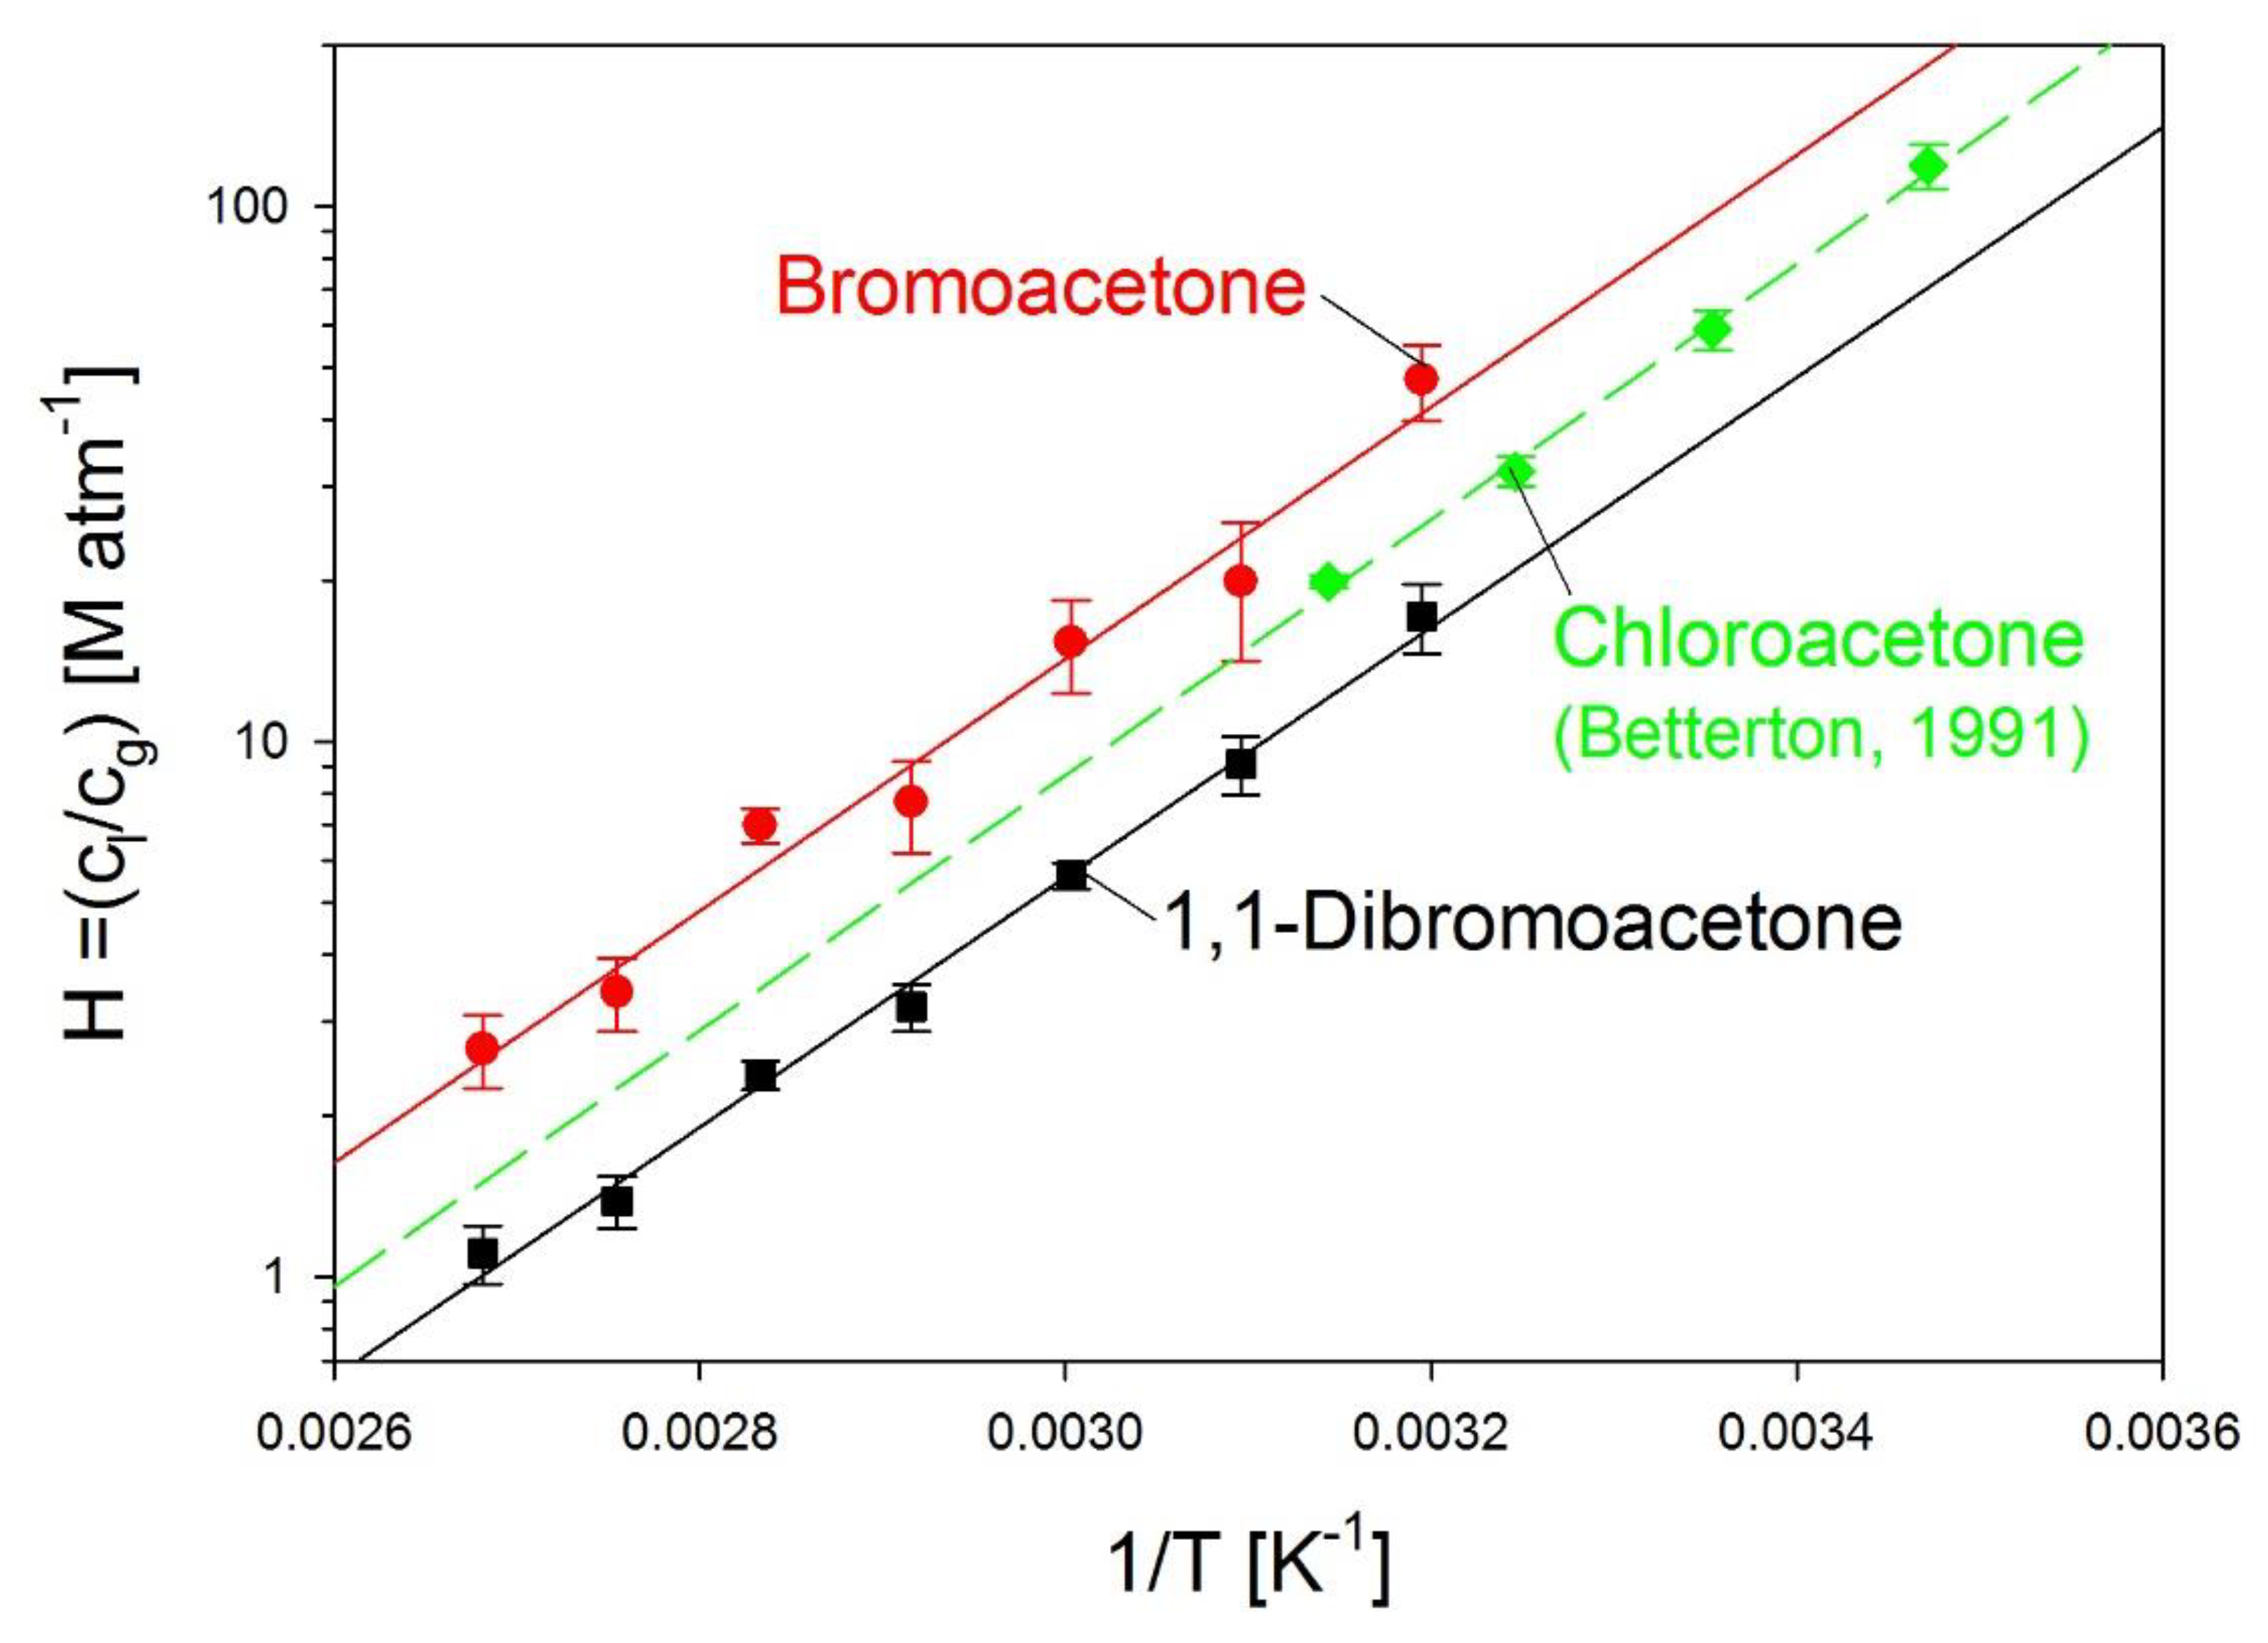
3.7. Henry’s Law Constants of Bromoacetone and 1,1-dibromoacetone

The Henry’s Law constants for monobromoacetone and 1,1-dibromoacetone showed a strong dependence on temperature (see Table 3 and Figure 10). The extrapolated Henry’s Law constant of bromoacetone at 298 K (H298 = 100 M atm−1) is about a factor of two lower compared to a calculated value (H298 = 170 M atm−1) by the method of Meylan and Howard (1991) [79], available in the Hazardous Substance Data Bank (HSDB, 2015). Calculated values from the program EPI-suite (US-EPA, 2000) are in the range from H298 = 83 – 175 M atm−1. The measured values are at the lower end of the estimates and the value from HSDB is at the upper end. The extrapolated Henry’s Law constant at 298 K for 1,1-dibromoacetone is H298 = 38 M atm−1, the recommended Henry’s Law constant of chloroacetone at 298 K is H298 = 59 M atm−1 [80] and therefore in between that of bromoacetone and 1,1-dibromoacetone (as also illustrated in Figure 10).

4. Discussion

Diurnal variations of haloacetones demonstrated a link to photochemical processes over the Western Australian salt lakes. Maximum concentrations of chloro- and bromoacetone were found around 2 p.m. (Figure 2). The formation of chloro- and bromoacetone, however, is not exclusively influenced by gas-phase chemistry as high haloacetone MRs could not be explained by known gas-phase formation reactions alone. Our findings point towards the contribution of an unknown source.
Model simulations indicated a significant gap in our knowledge concerning the sources of halogenated acetones. Gas-phase photochemistry provides an adequate source for the haloacetones only if the chlorine and bromine radical concentration is extremly high. At 4 p.m. at Lake Shot and at 8 a.m. at Lake Bean the model output shows an unknown sink. In general, the high bromoacetone MRs are dominated by the unknown source, while the chloroacetone MR is more sensitive to atmospheric photochemical reactions with methacrolein and propene. In view of the sampled area, only the lake water/lake sediment can provide enough organic substrate to emit high amounts of haloacetone. Fulvic and humic acids (FA and HA) have been proposed to contain keto groups which produce halogenated ketones in the presence of reactive halogen species (predominantly Br, Cl) [82]. An additional source from the HA could be the formation of acetone, that is halogenated in later stages. The photolytic degradation of HA in marine waters was observed and showed an enhanced acetone formation [83,84]. Monohalogenated acetones are favored, as the enolization is very slow under low pH conditions. Westerhoff et al. (2004) [85] observed approximately 10 times higher rates for the bromination reaction of pre-ozonized natural organic matter compared to the chlorination reaction, partly outweighing the lower abundance of bromide. Bromide even enhances the haloacetone formation as already observed for drinking water chlorination processes [82]. This could be explained by the weaker reactivity of HOCl compared to HOBr [83], which were the dominant reactive halogen species in the pH range from 5 to 7. Highest mixing ratios were measured at even lower pH, where Br2 becomes the dominant bromine species (below pH 5) [15,86].
The temperature of the salt lakes showed diurnal cycles with a high amplitude, ranging from 15 to 35 °C in the lake water and up to 45 °C inside the chamber. Within this temperature range (15 to 35 °C) the Henry’s Law constant of bromoacetone drops from around 150 to 50 M atm−1. This enhances the release of haloacetones from the water phase with increasing temperature over the day. Additionally, the complete dry out of surfaces will release bromoacetone into the gas phase [87] because of its vapor pressure (at 20 °C) of 120 Pa [88]. The emissions in the chamber were calculated on the assumption of no leaks, based on the measured mixing ratios and known losses. For example, chloroacetone concentrations in the FEP chamber on Lake Bean increased to about 3.5 ppb between 6 and 7 a.m. This relates to 0.34 µmol in the 2350 L chamber, taking into account the molar volume at 20 °C and 101.3 kPa of 24.1 L mol1 (for every time step molar volume was corrected for the temperature). In respect to the covered surface (1.96 m2), the overall emission relates to 0.17 µmol m2 h1 chloroacetone between 6 and 7 a.m. In general, emissions for chloroacetone were 0.01 to 0.17 µmol m2 h1 and for bromoacetone 0.01 to 1.45 µmol m2 h1. The overall production of Lake Shot (pH 3.5) between 6 a.m. and 1 p.m. was 0.1 µmol m2 h1 for chloroacetone and 0.36 µmol m2 h1 for bromoacetone. Compared to the neutral lakes (e.g., Lake Bean 0.01 µmol m2 h1 chloroacetone and 0.09 µmol m2 h1 bromoacetone), a clear trend towards higher emissions at more acidic lakes was observed.
In contrast, a minor source of haloacetones might be provided by the gas-phase reaction (9) of 1-chloro- and 1-bromopropane with OH radicals. While they were not measured in air samples, small amounts of these compounds were produced by some lake sediments under laboratory conditions. The dihalogenated 1,3-dichloropropane and the monohalogenated 1-iodopropane was found in water samples from Lake Strawbridge and Lake Boats, respectively. These compounds could be precursors for 1,3-dibromoacetone and iodoacetone. Freeze-dried sediment samples, that were incubated with ultrapure water (1 g and 10 mL in a 20 mL headspace vial) and shaken in darkness on a rotary table at 40 °C for 24 h, produced 2.9 to 8.8 ng/g 1-chloropropane and 0.7 to 4.8 ng g−1 1,3-dichloropropane. Samples from Lake Boats emitted 0.4 ng/g 1-iodopropane. For detailed results of the compounds released from the samples in the laboratory experiments under these conditions, refer to Krause (2014) [9].
The mass ratio of bromide to chloride in the Australian salt lakes was found to be about 1/500 (bromide ranging from 0.23 to 0.6 g L−1 according to Krause, 2014 [9]). The rate constant for the nucleophilic substitution of bromide by chloride yields a lifetime of 2 h in a saturated solution of NaCl at 293 K and cannot be neglected as a sink of bromoacetone and a source of chloroacetone in the diurnal cycle. At the elevated temperatures of the hypersaline soil, the nucleophilic substitution will be even stronger. The photolytic lifetime of bromoacetone is several days and therefore plays no significant role in the loss. The laboratory experiments on HA were conducted at elevated O3 levels (~ 5 orders of magnitude higher than in the troposphere) and ozone was directly bubbled through the solution leading to a well-mixed solution by constant stirring. Nevertheless, if the uptake of reactive halogen species formed in the gas phase serves as a source for reactive halogen species (Br2, HOBr, Cl2 and HOCl) the amount of O3 would not be limiting. Furthermore, the reactions are expected to occur at lower ozone concentrations, due to the high reactivity of ozone towards halides [89], the photochemical activation of chlorine by aerosol surfaces [90] and the iron(III)-induced activation of chloride and bromide on the lakes and on aerosols [91,92]. A potential uncertainty is the conditions of the photochemical experiments with dilute solutions that may differ from those of the salt lakes and saline soils. However, the varied molar ratio of chloride to bromide between 3 and 100 (as compared to 500 in the salt lakes), and the range between 200 and 600 was covered in deliquescent aerosol (saturated solution) experiments of Behnke et al. (1999) [93], where bromide catalyzed the release of atomic Cl, even more at lower relative humidity (79% compared to 60%). Nevertheless, the laboratory experiments proved the existence of an alternative formation mechanism that would be consistent with the measurements.

5. Conclusions

Haloacetones were measured in the complex transition interface of Australian salt lakes using a Teflon chamber. The advantage of the static Teflon chamber is that it confines the emissions and prevents dilution through mixing, leading to the accumulation of compounds over time, so that smaller emission rates can be observed while allowing for photochemical reactions. The main gas-phase source of haloacetones in the troposphere is the reaction of propene and methacrolein with atomic chlorine and bromine. These atmospheric reactions could not explain the measured values in the chambers. Therefore, an alternative reaction pathway was considered. According to laboratory observations, these formation pathways are the acid catalyzed enolization of acetone and the direct halogenation of organic matter in the water phase and the quasi-liquid phase and on the salt crust. Particles are assumed to be a potential source of these halogenation processes and may have contributed to their formation inside the chamber. It could be shown in laboratory experiments that the encountered lake conditions (pH 2–7, high salinity) favor the formation of monohalogenated acetones and brominated species are favored over chlorinated as reaction products, which is in line with the measurements on the lakes.
The salt lakes of the Australian wheat belt have been identified to be a source of ultrafine particles which were measured in elevated numbers over the agricultural land by airborne, car-based and stationary instruments [53,54]. This raised the question of the underlying aerosol formation process and whether the salt lakes have a significant impact on the local climate that unambiguously changed over the last decades. Photolysis of haloacetones leads to the formation of HCl/HBr and the acetonyl radical CH3C(O)CH2 which is an intermediate in the OH + allene reaction and which participates in the secondary organic aerosol (SOA) formation [38]. Therefore, we recommend more research on the aerosol formation efficiency of haloacetones and, in view of increasing salinization due to anthropogenic impacts, more research on possible reactions of organic matter with halogens. Despite the high Henry’s Law constants of chloro- and bromoacetone, the liquid phase is considered to be the main source of these compounds.

Supplementary Materials

The following are available online at https://www.mdpi.com/2073-4433/10/11/663/s1, Figure S1: Measured compounds of lakes Orr, Kathleen, Bean and Strawbridge, Figure S2: Source/Sink strengths chloroacetone Lake Bean, Figure S3: Source/Sink strengths bromoacetone Lake Bean, Figure S4: Source fraction of chloroacetone formation Lake Bean, Figure S5: Source fraction of bromoacetone formation Lake Bean, Figure S6: Source/Sink strengths chloroacetone Lake Shot, Figure S7: Source/Sink strengths bromoacetone Lake Shot, Figure S8: Source fraction of chloroacetone formation Lake Shot, Figure S9: Source fraction of bromoacetone formation Lake Shot, Figure S10: UV-spectra of bromoacetone and 1,1-dibromoacetone, Figure S11: Foto of the chamber on Lake Shot, Figure S12: Foto of the cover area by the chamber on Lake Shot, Table S13: Measured MR on the lakes, Figure S14: Measured propene, methacrolein, chloro- and bromoacetone mixing ratios at Lake Shot, Figure S15: Modeled time profiles of the concentrations of atomic Cl and Br, chloro- and bromoacetone and propene and methacrolein for the conditions at Lake Shot, Figure S16: Comparison of the unknown source strength of chloroacetone with the photochemical gas-phase sources of halogenation of propene and methacrolein as a function of atomic Cl, FACSIMILE File S17: fit_shot16-19E8_br.fac and FACSIMILE File S18: box_shot16-19E8_br.fac

Author Contributions

Conceptualization, H.-F.S., C.Z. and W.-U.P.; model software, S.B. (Sergej Bleicher) and J.W. (Julian Wittmer); formal analysis, T.S., J.W., M.S., R.K., T.K., S.B. (Simon Benk), K.K. and J.O.; resources, H.-F.S., C.Z., E.A. and J.W.; writing—original draft preparation, T.S., M.S. and J.W. (Julian Wittmer); writing—review and editing, E.B., J.W.(Jonathan Williams); supervision, H.-F.S., C.Z., E.A., W.-U.P. and A.H.

Funding

This research was supported by the Bundesministerium für Bildung und Forschung (BMBF) within AFO 2000 and by the Deutsche Forschungsgemeinschaft (DFG) Research Unit 763.

Acknowledgments

R. Kopetzky acknowledges W. Ruck for supervising his diploma work at the University of Lüneburg, and M. Sörgel his supervisor O. Elsholz from the Hamburg University of Applied Sciences (HAW Hamburg) for supporting his work at the University of Lüneburg.

Conflicts of Interest

The authors declare no conflicts of interest. The funders had no role in the design of the study; in the collection, analyses, or interpretation of data; in the writing of the manuscript, or in the decision to publish the results.

References

  1. Gribble, G.W. Naturally Occurring Organohalogen Compounds—A Comprehensive Update; Springer: Wien, Austria, 2010. [Google Scholar]
  2. Schöler, H.F.; Keppler, F. Abiotic Formation of Organohalogens during Early Diagenetic Processes; The Handbook of Environmental Chemistry; Springer Verlag: Heidelberg, Germany, 2003; Volume 3. [Google Scholar]
  3. Gribble, G.W. The Diversity of Naturally Produced Organohalogens; Chemosphere: Heidelberg, Germany, 2003; Volume 52, pp. 289–297. [Google Scholar]
  4. Comba, P.; Kerscher, M.; Krause, T.; Schöler, H.F. Iron-catalysed oxidation and halogenation of organic matter in nature. Environ. Chem. 2015, 12, 381–395. [Google Scholar] [CrossRef] [Green Version]
  5. Behnke, W.; Zetzsch, C. Efficiency of Br and I for activating chloride in sea-spray aerosol, derived from aerosol smog chamber experiments and model calculation. Geophys. Res. Abstr. 2005, 7, 03095. [Google Scholar]
  6. Schöler, H.F.; Zetzsch, C.; Kappler, A. Foreword to the Special Issue on ‘Naturally Produced Organohalogens—Atmosphere, Soil’. Environ. Chem. 2015, 12, 1–2. [Google Scholar] [CrossRef]
  7. Abrol, I.P.; Massoud, F.I. Salt-Affected Soils and Their Management 1988; Food and Agriculture Organization of the United Nations: Rome, Italy, 1988; pp. 10–12. [Google Scholar]
  8. Krause, T.; Tubbesing, C.; Benzing, K.; Schöler, H.F. Model reactions and natural occurence of furans from hypersaline environments. Biogeoscience 2013, 11, 2871–2882. [Google Scholar] [CrossRef]
  9. Krause, T. Natural Occurence of Volatile Mono-/Polyhalogenated and Aromatic/Heteroaromatic Hydrocarbons from Hypersaline Environments. Ph.D. Thesis, University of Heidelberg, Heidelberg, Germany, 2014. [Google Scholar]
  10. Mulder, I.; Krause, T.; Sattler, T.; Tubbesing, C.; Studenroth, S.; Bukowski, K.; Atlas, E.; Schöler, H.F. Thermolytic degradation of methyl methionine and implications for its role in DMS and MeCl formation in hypersaline environments. Environ. Chem. 2015, 12, 415. [Google Scholar] [CrossRef]
  11. Reckhow, D.A.; Singer, P.C. Chlorination by-products in drinking waters: From formation potentials to finished water concentrations. Am. Water Works Assoc. 1990, 82, 173–180. [Google Scholar] [CrossRef]
  12. Huang, W.J.; Chen, L.Y.; Peng, H.S. Effect of NOM characteristics on brominated organics formation by ozonation. Environ. Int. 2004, 29, 1049–1055. [Google Scholar] [CrossRef]
  13. McKague, A.B.; Bradley, D.; Meier, H.P.; Monteith, D.; Betts, J.L. Chloroacetones in pulp mill chlorination-stage effluents. Environ. Toxicol. Chem. 1990, 9, 1301–1303. [Google Scholar] [CrossRef]
  14. Rappe, C. Halogenation of ketones. Acta Chem. Scand. 1966, 20, 376–384. [Google Scholar] [CrossRef]
  15. Da Rosa, M.B.; Behnke, W.; Zetzsch, C. Study of the heterogeneous reaction of O3 with CH3SCH3 using the wetted-wall flowtube technique. Atmos. Chem. Phys. 2003, 3, 1665–1673. [Google Scholar] [CrossRef]
  16. Hughes, E.D.; Watson, H.B.; Yates, E.D. Constitutional factors controlling prototropic change in carbonyl compounds. Part I. The relative speeds of enolisation of acetone and bromoacetone and the effect of the acid catalyst. Catalyst. J. Chem. Soc. 1931, 6, 3318–3324. [Google Scholar] [CrossRef]
  17. Watson, B.; Yates, E.D. Constitutional factors controlling prototropic changes in carbonyl compounds. Part 2. Acid and base catalysis in the bromination of halogenated acetones. Catalyst. J. Chem. Soc. 1932, 7, 1207–1215. [Google Scholar] [CrossRef]
  18. Guthrie, J.P.; Cossar, J. The chlorination of acetone: a complete kinetic analysis. Can. J. Chem. 1986, 64, 1250–1266. [Google Scholar] [CrossRef]
  19. Cox, R.A.; Warkentin, J. Kinetics of bromination of acetone, bromoacetone, and 1,1-dibromoacetone. Canandian J. Chem. 1970, 50, 3233–3238. [Google Scholar] [CrossRef]
  20. McKague, A.B.; Lee, E.G.H.; Douglas, G.R. Chloroacetones: Mutagenic constituents of bleached kraft chlorination effluents. Mutation Res. 1981, 91, 301–306. [Google Scholar] [CrossRef]
  21. Osterman-Golkar, S. Reaction kinetics in water of chloroethylene oxide, chloroacetaldehyde, and chloroacetone. Hereditas 1984, 101, 65–68. [Google Scholar] [CrossRef]
  22. Keil, A.D.; Shepson, P.B. Chlorine and bromine atom ratios in the springtime arctic troposphere as determined from measurements of halogenated volatile organic compounds. J. Geophys. Res. Atmos. 2006, 111, D17. [Google Scholar] [CrossRef]
  23. Kleindienst, T.E.; Shepson, P.B.; Nero, C.M.; Bufalini, J.J. The production of chlorine atom from the reaction of OH with chlorinated hydrocarbons. Int. J. Chem. Kinet. 1989, 21, 863–884. [Google Scholar] [CrossRef]
  24. Kaiser, E.W.; Wallington, T.J. Pressure dependence of the reaction Cl + C3H6. J. Phys. Chem. 1996, 100, 9788–9793. [Google Scholar] [CrossRef]
  25. Barnes, I.; Bastian, V.; Becker, K.H.; Overath, R.; Tong, Z. Rate constants for the reactions of Br atoms with a series of alkanes, alkenes, and alkynes in the presence of O2. Int. J. Chem. Kinet. 1989, 21, 499–517. [Google Scholar] [CrossRef]
  26. Wallington, T.J.; Skewes, L.M.; Siegl, W.O.; Japar, S.M. A relative rate study of the reaction of bromine atoms with a variety of organic compounds at 295 K. Int. J. Chem. Kinet. 1989, 21, 1069–1076. [Google Scholar] [CrossRef]
  27. Orlando, J.J.; Tyndall, G.S.; Apel, E.C.; Riemer, D.D.; Paulson, S.E. Rate coefficients and mechanisms of the reaction of Cl-atoms with a series of unsaturated hydrocarbons under atmospheric conditions. Int. J. Chem. Kinet. 2003, 35, 334–353. [Google Scholar] [CrossRef]
  28. Calvert, J.G.; Orlando, J.J.; Stockwell, W.R.; Wallington, T.J. The Mechanisms of Reactions Influencing Atmospheric Ozone; Oxford University Press: New York, NY, USA, 2015; pp. 67–96. [Google Scholar]
  29. Canosa-Mas, C.E.; Cotter, E.S.N.; Duffy, J.; Thompson, K.C.; Wayne, R.P. The reaction of atomic chlorine with acrolein, methacrolein and methyl vinyl ketone. Phys. Chem. Chem. Phys. 2001, 3, 3075–3084. [Google Scholar] [CrossRef]
  30. Sauer, C.G.; Barnes, I.; Becker, K.H. FT-IR kinetic and product study of the Br-radical initiated oxidation of α, β-unsaturated organic carbonyl compounds. Atmos. Environ. 1999, 33, 1969–2979. [Google Scholar] [CrossRef]
  31. Burkholder, J.B.; Gilles, M.K.; Gierczak, T.; Ravishankara, A.R. The atmospheric degradation of 1-bromopropane: The photochemistry of bromoacetone. Geophys. Res. Lett. 2002, 29, 1822. [Google Scholar] [CrossRef]
  32. Markert, F.; Nielsen, O.J. The reactions of OH radicals with chloroalkanes in the temperature range 295–360 K. Chem. Phys. Lett. 1992, 194, 123–127. [Google Scholar] [CrossRef]
  33. Donaghy, T.; Shanahan, I.; Hande, M.; Fitzpatrick, S. Rate constants and atmospheric lifetimes for the reactions of OH radicals and Cl atoms with haloalkanes. Int. J. Chem. Kinet. 1993, 25, 273–284. [Google Scholar] [CrossRef]
  34. Calvert, J.G.; Derwent, R.G.; Orlando, J.J.; Tyndall, G.S.; Wallington, T.J. Mechanisms of Atmospheric Oxidation of the Alkanes; Oxford University Press: New York, NY, USA, 2008; pp. 379–603. [Google Scholar]
  35. Nelson, D.D.; Wormhoudt, J.C.; Zahniser, M.S.; Kolb, C.E.; Ko, M.K.W.; Weisenstein, D.K. OH reaction kinetics and atmospheric impact of 1-bromopropane. J. Phys. Chem. 1997, 101, 4987–4990.
  36. Zetzsch, C.; Behnke, W. Heterogeneous photochemical sources of atomic Cl in the troposphere. Ber. Bunsenges. Phys. Chem. 1992, 96, 488–493. [Google Scholar] [CrossRef]
  37. Behnke, W.; Zetzsch, C. Formation of organohalogens from heterogeneous atmospheric chemistry simulated in an aerosol smog chamber. GDCh Monograph. 2005, 34, 110–121. [Google Scholar]
  38. Alligood, B.W.; FitzPatrick, B.L.; Szpunar, D.E.; Butler, L.J. Chloroacetone photodissoiation at 193 nm and the sub-sequent dynamics of the CHC(O)CH2 radical—An intermediate formed in the OH + allene reaction en route. J. Chem. Phys. 2011, 134, 054301. [Google Scholar] [CrossRef]
  39. Department of Water, Government of Western Australia. Waterway Assessment of the Upper Lockhart River: Camm River Confluence to Newdegate; Water resource management series, WRM 58; Avon Catchment Council: Northam, Australia, 2009.
  40. Department of Water, Government of Western Australia. Waterway Assessment of the Camm River: Lockhart River Confluence to Hyden; Water resource management series, WRM 57; Avon Catchment Council: Northam, Australia, 2009.
  41. Lillicrap, A.; George, R. The Distribution and Origins of Acid Groundwaters in the South West Agricultural Area; Resource Management Technical Report; Department of Agriculture and Food, Western Australia: Perth, Australia, 2010. [Google Scholar]
  42. Fitzpatrick, R.; Shand, P. Inland Acidic Sulfate Soil Systems across Australia; CRC LEME Open File Report; CRC LEME: Perth, Australia, 2008. [Google Scholar]
  43. Hookey, G.R. Prediction of delays in groundwater response to catchment clearing. J. Hydrol. 1987, 94, 181–198. [Google Scholar] [CrossRef]
  44. Nulsen, R.A. Catchment Hydrology Group. Groundwater Trends in the Agricultural Area of Western Australia; Resource Management Technical Report No. 173; Agriculture Western Australia: Perth, Australia, 1998. [Google Scholar]
  45. Addison, D. Groundwater Study of the Lake Grace Townsite; Resource Management Technical Report 212; Agriculture Western Australia: Perth, Australia, 2001. [Google Scholar]
  46. Ghauri, S. Groundwater Trends in the Central Agricultural Region; Resource Management Technical Report 269; Department of Agriculture, Western Australia: Perth, Australia, 2004. [Google Scholar]
  47. Ruprecht, J.K.; Schofield, N.J.S. Effects of partial deforestation on hydrology and salinity in high salt storage landsapes. II strip, soil and parkland clearing. J. Hydrol. 1991, 129, 39–55. [Google Scholar] [CrossRef]
  48. Rogers, S.; George, R. WA Wheatbelt drainage—Acidic groundwater, not just a salt issue. Focus Salt 2005, 33, 8–9. [Google Scholar]
  49. Degens, B.; Shand, P. Assessment of acidic saline groundwater hazard in the Western Australian Wheatbelt: Yarra Yarra, Blackwood and South Coast; Water for a Healthy Country National Research Flagship; CSRIO: Perth, Australia, 2010. [Google Scholar]
  50. Mann, A.W. Hydrogeochemistry and weathering on the Yilgarn Block, Western Australia—Ferrolysis and heavy metals in continental brines. Geochim. Cosmochim. Acta 1983, 47, 181–190. [Google Scholar] [CrossRef]
  51. McArthur, J.M.; Turner, J.V.; Lyons, W.B.; Osborn, A.O.; Thirlwall, M.F. Hydrochemistry on the Yilgarn Block, Western Australia: Ferrolysis and mineralization in acidic brines. Geochim. Cosmochim. Acta 1991, 55, 1273–1288. [Google Scholar] [CrossRef]
  52. Shand, P.; Degens, B. Avon Catchment Acidic Groundwater—Geochemical Risk Assessment; CRC LEME Open File Report; CRC LEME: Perth, Australia, 2008; p. 82. [Google Scholar]
  53. Kamilli, K.A.; Ofner, J.; Krause, T.; Sattler, T.; Schmitt-Kopplin, P.; Eitenberger, E.; Friedbacher, G.; Lendl, B.; Lohninger, H.; Schöler, H.F.; et al. How salt lakes affect atmospheric new particle formation: A case study in Western Australia. Sci. Total Environ. 2016, 573, 985–995. [Google Scholar] [CrossRef]
  54. Junkermann, W.; Hacker, J.; Lyons, T.; Nair, U. Land use change supresses precipitation. Atmos. Chem. Phys. 2009, 9, 6531–6539. [Google Scholar] [CrossRef]
  55. Kamilli, K.A.; Ofner, J.; Lendl, B.; Schmitt-Kopplin, P.; Held, A. New particle formation above a simulated salt lake in aerosol chamber experiment. Environ. Chem. 2015, 12, 504–514. [Google Scholar] [CrossRef]
  56. Cocker, D.R.; Flagan, R.C.; Seinfeld, J.H. State-of-the-art chamber facility for studying atmospheric aerosol chemistry. Environ. Sci. Technol. 2001, 35, 2594–2601. [Google Scholar] [CrossRef]
  57. Toyota, K.; Kanaya, Y.; Takahashi, M.; Akimoto, H. A box model study on photochemical interactions between VOCs and reactive halogen species in the marine boundary layer. Atmos. Chem. Phys. 2004, 4, 1961–1987. [Google Scholar] [CrossRef] [Green Version]
  58. Bleicher, S. Zur Halogenaktivierung im Aerosol und in Salzpfannen 2012. Ph.D. Thesis, Universität Bayreuth, Bayreuth, Germany, 2012. [Google Scholar]
  59. Bleicher, S.; Buxmann, J.; Sander, R.; Riedel, T.P.; Thornton, J.A.; Platt, U.; Zetzsch, C. The influence of nitrogen oxides on the activation of bromide and chloride in salt aerosol. Atmos. Chem. Phys. Discuss. 2014, 14, 10135–10166. [Google Scholar] [CrossRef]
  60. Buxmann, J.; Balzer, N.; Bleicher, S.; Platt, U.; Zetzsch, C. Observations of bromine explosions in smog chamber experiments above a model salt pan. Int. J. Chem. Kinet. 2012, 44, 312–326. [Google Scholar] [CrossRef]
  61. Orlando, J.J. Temperature dependence of the rate coeffients for the reaction of chlorine atoms with chloromethanes. Int. J. Chem. Kinet. 1999, 31, 515–524. [Google Scholar] [CrossRef]
  62. Saunders, S.M.; Jenkin, M.E.; Derwent, R.G.; Pilling, M.J. Protocol for the development of the master chemical mechanism, MCM v3 (part: A): tropospheric degradation of non-aromatic volatile organic compounds. Atmos. Chem. Phys. 2003, 3, 161–180. [Google Scholar] [CrossRef]
  63. NCAR Earth System Laboratory, Atmospheric Chemistry Division. Available online: http://cprm.acom.ucar.edu/Models/TUV/Interactive_TUV/ (accessed on 13 September 2019).
  64. Physick, W.L.; Tapper, N.J. A numerical study of circulations induced by a dry salt lake. Mon. Wea. Rev. 1990, 118, 1029–1042. [Google Scholar] [CrossRef]
  65. Keller-Rudek, H.; Moortgat, G.K.; Sander, R.; Sörensen, R. The MPI-Mainz UV/VIS spectral atlas of gaseous molecules of atmospheric interest. Earth Syst. Sci. Data 2013, 5, 365–373. [Google Scholar] [CrossRef]
  66. The MPI_Mainz UV/VIS Spectral Atlas of Gaseous Molecules of Atmospheric Interest. Available online: www.uv-vis-spectral-atlas-mainz.org (accessed on 13 September 2019).
  67. Kopetzky, R. Bildung halogenierter organischer Verbindungen aus salzhaltigen Lösungen 2005. Diploma Thesis, Universität Lüneburg, Lüneburg, Germany, 2005. [Google Scholar]
  68. Sörgel, M. Experimentelle Untersuchung zur Bildung halogenorganischer Verbindungen aus Huminsäuren in Abhängigkeit vom pH-Wert 2007. Ph.D. Thesis, Hochschule für Angewandte Wissenschaften Hamburg, Hamburg, Germany, 2007. [Google Scholar]
  69. Yamada, E.; Doi, K.; Okano, K.; Fuso, Y. Simultaneous determination of the concentration and molecular weight of humic substances in environmental water by gel chromatography with fluorescence detector. Anal. Sci. 2000, 16, 125–129. [Google Scholar] [CrossRef]
  70. Levene, P.A. Bromoacetone. Org. Synth. 1930, 10. [Google Scholar] [CrossRef]
  71. Hodgeson, J.W.; Cohen, A.I. Determination of Chlorinated Desinfection Byproducts and Chlorinated Solvents in Drinking Water by Liquid-Liquid Extraction and Gas Chromatography with Electron-Capture Detection; Environmental Monitoring Systems Laboratory Office of Research and Development, U.S. Environmental Protection Agency: Cincinnati, OH, USA, 1990. [Google Scholar]
  72. Kolb, B. Application of gas chromatographic head-space analysis for the characterization of non-ideal solution by scanning the total concentration range. J. Chromatogr. A 1975, 112, 287–295. [Google Scholar] [CrossRef]
  73. Kolb, B.; Welter, C.; Bichler, C. Determination of partition coefficients by automatic equilibrium headspace gas chromatography by vapour phase calibration. Chromatographia 1992, 34, 235–240. [Google Scholar] [CrossRef]
  74. Kolb, B.; Ettre, L.S. Static Headspace-Gas Chromatography: Theory and Practice; Wiley-VCH: New York, NY, USA, 2006. [Google Scholar]
  75. Stutz, J.; Ackermann, R. Atmospheric reactive chlorine and bromine at the Greate Salt Lake. Utha. Geophys. Res. Lett. 2002, 29, 197–256. [Google Scholar] [CrossRef]
  76. Wingenter, O.W.; Sive, B.C.; Blake, N.J.; Blake, D.R.; Rowland, F.S. Atomic chlorine concentrations derived from ethane and hydroxyl measurements over the equatorial Pacific Ocean: Implication for dimethyl sulfide and bromine monoxide. J. Geophys. Res. 2005, 110, D20308. [Google Scholar] [CrossRef]
  77. Wittmer, J.; Bleicher, S.; Zetzsch, C. Iron(III)-induced activation of chloride and bromide from modeled salt pans. J. Phys. Chem. A 2014, 119, 4373–4385. [Google Scholar] [CrossRef]
  78. Palm, W.-U.; Millet, M.; Zetzsch, C. Photochemicals reaction of metamitron. Chemosphere 1997, 35, 117–1130. [Google Scholar] [CrossRef]
  79. Meylan, W.M.; Howard, P.H. Bond contribution method for estimating Henry’s law constants. Environ. Toxicol. Chem. 1991, 10, 1283–1293. [Google Scholar] [CrossRef]
  80. Sander, R. Compilation of Henry’s law constants (version 4.0) for water as solvent. Atmos. Chem. Phys. 2015, 15, 4399–4981. [Google Scholar] [CrossRef]
  81. Betterton, E.A. The partitioning of ketones between the gas and aqueous phases. Atmos. Environ. Part A. Gen. Top. 1991, 25.8, 1473–1477. [Google Scholar] [CrossRef]
  82. Peters, R.J.B.; de Leer, E.W.B.; Versteegh, J.F.M. Identification of halogenated compounds produced by chlorination of humic acid in the presence of bromide. J. Chromatogr. 1994, 686, 253–261. [Google Scholar] [CrossRef]
  83. Kieber, R.J.; Zhou, X.; Mopper, K. Formation of carbonyl compounds from UV-induced photodegradation of humic substances in natural waters: Fate of riverine carbon in the sea. Limnol. Oceanogr. 1990, 35, 1503–1515. [Google Scholar] [CrossRef]
  84. Zhou, X.; Mopper, K. Photochemical production of low-molecular-weight carbonyl compounds in seawater and surface microlayer and their air-sea exchange. Marine Chem. 1997, 56, 201–213. [Google Scholar] [CrossRef]
  85. Westerhoff, P.; Chao, P.; Mash, H. Reactivity of natural organic matter with aqueous chlorine and bromine. Water Res. 2004, 38, 1502–1513. [Google Scholar] [CrossRef] [PubMed]
  86. Deborde, M.; von Gunten, U. Reactions of chlorine with inorganic and organic compounds during water treatment-Kinetics and mechanisms: A critical review. Water Res. 2008, 42, 13–51. [Google Scholar] [CrossRef] [PubMed]
  87. HSDB (2015): Hazardous Substances Data Bank (HSDB)–Toxnet–National Institute of Health, National Library of Medicine, 8600 Rockville Pike, Bethesda, MD 20894 National Institutes of Health, Health & Human Services. Available online: https://toxnet.nlm.nih.gov/newtoxnet/hsdb.htm (accessed on 12 June 2015).
  88. Lewis, R.J. Hawley’s Condensed Chemical Dictionary, 15th ed.; Wiley: New York, NY, USA, 2007. [Google Scholar]
  89. Haag, W.R.; Hoigné, J. Ozonation of bromide-containing waters: Kinetics of formation of hypobromous acid and bromate. Environ. Sci. Technol. 1983, 17, 261–267. [Google Scholar] [CrossRef]
  90. Wittmer, J.; Zetzsch, C. Photochemical activation of chlorine by iron-oxide aerosol. J. Atmos. Chem. 2016, 73, 1–18. [Google Scholar] [CrossRef]
  91. Wittmer, J.; Bleicher, S.; Ofner, J.; Zetzsch, C. Iron(III)-induced activation of chloride from artificial sea salt aerosol. Environ. Chem. 2015, 12, 461–475. [Google Scholar] [CrossRef]
  92. Ofner, J.; Balzer, N.; Buxmann, J.; Grothe, H.; Schmitt-Kopplin, P.; Platt, U.; Zetzsch, C. Halogenation processes of secondary organic aerosol and implications on halogen release mechanisms. Atmos. Chem. Phys. 2012, 12, 5787–5806. [Google Scholar] [CrossRef] [Green Version]
  93. Behnke, W.; Elend, M.; Krüger, U.; Zetzsch, C. The influence of NaBr/NaCl ratio on the Br--catalysed production of halogenated radicals. J. Atmos. Chem. 1999, 34, 87–99. [Google Scholar] [CrossRef]
Figure 1. Measured propene, methacrolein, chloro- and bromoacetone mixing ratios. The measured solar radiation is shown on the second y-axis. For every lake (AC) two different days are plotted.
Atmosphere 10 00663 g001
Figure 2. Mean measured mixing ratios of chloro- and bromoacetone from acidic lakes. Whiskers show maximum and minimum measured values and the diamonds median values.
Atmosphere 10 00663 g002
Figure 3. Amount of chloroacetone molecules derived from atmospheric reactions of measured propene (black) and methacrolein (red). Additional chloroacetone molecules, that are necessary for obtaining the measured mixing ratios (MR) in the chamber, are shown in blue and represent an unknown source.
Atmosphere 10 00663 g003
Figure 4. Amount of bromoacetone molecules derived from atmospheric reactions of measured propene (black) and methacrolein (red). Additional bromoacetone molecules, that are necessary for receiving the measured MR in the chamber, are shown in blue and represent an unknown source.
Atmosphere 10 00663 g004
Figure 5. Source fractions contributing to the chloroacetone formation at 104 Cl atoms cm−3 (left bright bars) and 107 Cl atoms cm−3 (right lighter bars) for Lake Boats. The Br concentration was fixed at 108 cm−3.
Atmosphere 10 00663 g005
Figure 6. Source fractions contributing to the bromoacetone formation at 105 Br atoms cm−3 (left bright bars) and 108 Br atoms cm−3 (right darker bars) for Lake Boats. The Cl concentration was fixed at 104 cm−3.
Atmosphere 10 00663 g006
Figure 7. Time series observed in photochemical experiments inside a semi-batch reactor with an O3 dose of 31∙10−7 mol min−1 in an O2 flow of 45 cm3 min−1. Panel a) shows the degradation of HA (17 mg L−1) during experiments in the dark and under irradiation, measured by the extinction at 253.7 nm in the presence of c(Br) = 8.5 × 10⁻³ mol L−1 and c(Cl) = 2.6 × 10⁻² mol L−1 (a ratio of about 1/3). Panel b) shows the amount of bromoacetone formed from HA (40 mg L−1) during experiments at pH 7 at c(Br) = 8.5 × 10⁻³ mol L−1 and c(Cl) = 0.86 mol L−1 (a ratio of about 1/100). Values were derived from combining liquid phase and gas-phase measurements and consider gaseous losses from the reaction vessel in the outflow.
Atmosphere 10 00663 g007
Figure 8. Concentration time profiles for 1,1-dibromoacetone, determined with the extraction method in the pH range from 2 to 5 in a semi-batch reactor under constant irradiation and an O3 dose of 3.1∙10−6 mol min−1. Concentrations in the liquid phase were: c(HA) = 33 mg L−1, c(Cl) = 0.86 mol L−1 and c(Br) = 0.017 mol−1 corresponding to bromide/chloride ratio of 1/50. An experiment at pH 7 (not shown) with a bromide/chloride ratio of 1:100 (c(HA) = 40 mg L−1, c(Cl) = 0.86 mol L−1), c(Br) 8.5 × 10⁻³ mol L−1) delivered up to 60 nmol L−1 of bromoacetone and 18 nmol L−1 of 1,1-dibromobenzene after 1400 min of irradiation.
Atmosphere 10 00663 g008
Figure 9. Temperature dependence of the rate constants for the reactions of brominated acetones with chloride and water and data on the hydrolysis of chloroacetone from Osterman-Golkar (1984) [21] in comparison with hydrolysis data at 353 K on bromoacetone (diamond) and 1,1-dibromoacetone (square). The 1/T scale ends at T = 293 K for convenience.
Atmosphere 10 00663 g009
Figure 10. Temperature dependence of the Henry’s Law constants of bromoacetone (H293 K = 133 ± 39 M atm−1), 1,1-dibromoacetone (H293 K = 51 ± 11 M atm−1 derived from our data in Table 2) and of chloroacetone according to Betterton (1991) [81], leading to the recommendation of H(298 K, chloroacetone) = 59 M atm−1).
Atmosphere 10 00663 g010
Table 1. Overview of the sampling sites with position, diameter, pH of lake water, and amount of air samples.
SiteLatitude
(°) S
Longitude
(°) E
Diameter
(km)
pHAmount of
Air Samples
Lake Boats−33.068538119.6369830.32.312
Lake Bean−33.161294119.744744-7.18
Lake Kathleen−32.984241119.694444-78
Lake Orr−33.148051119.1611990.644
Lake Shot−33.047973119.610159-3.513
Lake Strawbridge−32.848018119.3969980.67.34
Lake Dune−33.084896119.6379030.32.915
Table 2. Rate constants for nucleophilic exchange reactions with chloride and hydrolysis of bromoacetone and 1,1-dichloroacetone.
T
(°C)
Bromoacetone + Cl
k ±σ (10−4 M−1s−1)
1,1-Dibromoacetone + Cl
k ± σ (10−6M−1s−1)
Hydrolysis of
Bromoacetone
(10−6 M−1s−1)
Hydrolysis of 1,1-Dibromoacetone
(10−6 M−1s−1)
43.53.26 ± 0.134.2 ± 1.4
52.57.27 ± 0.0914.0 ± 3.4
63.518.0 ± 0.5573.5 ± 8.2
80.0--2.05 ± 0.33
80.0 0.48 ± 0.21
Table 3. Henry’s Law constants, HT (M atm1), determined for different temperatures, T (K), based on the partitioning coefficients measured by the vapor-phase chromatographie (VPC) method.
CompoundH313H323H333H343H353H363H373
Bromoacetone47.4 ± 7.619.9 ± 5.715.3 ± 3.07.7 ± 1.57.0 ± 0.53.4 ± 0.52.7 ± 0.4
1,1-Dibromoacetone17.1 ± 2.59.09 ± 1.155.63 ± 0.313.20 ± 0.322.38 ± 0.151.38 ± 0.151.11 ± 0.14

