Electrochemical Evidence of non-Volatile Reduced Sulfur Species in Water-Soluble Fraction of Fine Marine Aerosols

1
Laboratory for Physical Oceanography and Chemistry of Aquatic Systems, Division for Marine and Environmental Research, Ruđer Bošković Institute, 10 000 Zagreb, Croatia
2
Laboratory for Marine and Atmospheric Biogeochemistry, Division for Marine and Environmental Research, Ruđer Bošković Institute, 10 000 Zagreb, Croatia
*
Author to whom correspondence should be addressed.
Atmosphere 2019, 10(11), 674; https://doi.org/10.3390/atmos10110674
Submission received: 27 September 2019
/
Revised: 28 October 2019
/
Accepted: 30 October 2019
/
Published: 1 November 2019
(This article belongs to the Special Issue Atmospheric Aqueous-Phase Chemistry)
Abstract
:The traditional voltammetric method at the mercury electrode, and an acidification step developed for the determination of reduced sulfur species (RSS) in natural waters, was for the first time used for the quantification of RSS in the water-soluble fraction of fine marine aerosols collected at the Middle Adriatic location (Rogoznica Lake). The evidence of two types of non-volatile RSS that have different interaction with the Hg electrode was confirmed: mercapto-type which complexes Hg as RS–Hg and sulfide/S0-like compounds which deposits HgS. The analytical protocol that was used for RSS determination in aerosol samples is based on separate voltammetric studies of a methyl 3-mercaptopropionate (3-MPA) as a representative of mercapto-type compounds and sulfide as a representative of inorganic RSS. Our preliminary study indicates the presence of mainly RS–Hg compounds in spring samples, ranging from 2.60–15.40 ng m−3, while both, the mercapto-type (0.48–2.23 ng m−3) and sulfide and/or S0-like compounds (0.02–0.26 ng m−3) were detected in early autumn samples. More expressed and defined RS–Hg peaks recorded in the spring potentially indicate their association with biological activity in the area. Those samples were also characterized by a higher water-soluble organic carbon content and a more abundant surface-active fraction, pointing to enhanced solubility and stabilization of RSS in the aqueous atmospheric phase.
1. Introduction
In different aquatic ecosystems, electrochemical methods have been widely used for the characterization and determination of different sulfur (S) species, comprising dissolved and/or particulate inorganic and organic S compounds, including thiols ([1,2,3,4,5,6,7,8,9,10,11,12] and references therein). Strong interaction between mercury electrode (Hg) and S species is a background for their electroanalytical determination and speciation at the Hg electrode. The methodology is based on the tendency of inorganic and organic reduced S species (RSS) to deposit a HgS layer [1,2,3,4,5,13,14,15] and/or RS–Hg complexes [9,10,15] (term “complex” refers to a different type of interaction between the analyte and the Hg electrode) during an accumulation step at the deposition potential (Ed) around −0.2 V vs. the reference electrode (Ag/AgCl). In solutions containing sulfide anions, an insoluble HgS layer is formed during the deposition step at the Hg surface by the reversible process of a two-electron-transfer oxidation of Hg at potentials more positive than −0.5 V vs. the reference electrode (Ag/AgCl) (Equation (1)) [1,2,3,4,5,6,7,8,9,10,11,12,13,14,15]:
HS− + Hg0 ⇆ HgS(s) + H+ + 2e−.
The same process occurs during the interaction of Hg with some other organic (thiourea, thiols, oxines, thioanions) and inorganic S species (polysulfides, dissolved and colloidal S, labile chalcogenides, i.e., CuS, PbS, HgS, FeS, Ag2S). During the potential scan toward negative values, layers of HgS and adsorbable RS–Hg complexes (in the case of DMS, DMDS, cysteine, glutathione) are reduced between −0.45 and −0.70 V (vs. Ag/AgCl) with facilitated reduction of the RS–Hg complexes at a more positive potential than −0.68 V (vs. Ag/AgCl) where HgS reduction occurs [2,9,10,15,16].
Natural cycling of S compounds through the environment has taken on a new significance due to their involvement in the formation of atmospheric aerosol particles and their influence on global environmental processes and human health [17,18,19]. Atmospheric S contributes the most to atmospheric acid deposition being detrimental to ecosystems, harming aquatic biota, as well as to a wide range of terrestrial plant life [20]. Moreover, S-rich atmospheric particulate matter (PM) can serve as cloud condensation nuclei and participate in the cloud formation processes, which can ultimately affect the radiative balance of the atmosphere and the Earth’s climate [21,22]. The main anthropogenic sources of atmospheric S are coal and oil combustion, oil refining, and smelting of copper ores ([23,24] and references therein). The widespread combustion of fossil fuels has greatly increased S emissions into the atmosphere, with the anthropogenic component now substantially greater than natural emissions on a global basis [25]. The main natural sources are oceanic phytoplankton [21], volcanoes [26,27], and geothermal fields [28]. Production of marine S compounds is mostly related to eutrophication phenomena and spreading of hypoxic–anoxic dead zones in the marine environment. A significant fraction of natural S emission occurs in the form of dimethylsulfide (DMS), produced by phytoplankton and zooplankton grazing, which is released from the ocean into the atmosphere, where it undergoes oxidation to form sulfur dioxide (SO2), dimethylsulfoxide, dimethylsulfone, methanesulfonic acid (MSA), and sulfate (SO42−) [29,30,31].
The wide range of S oxidation states (from −2 to +6) as well as organic and inorganic forms present in ambient samples makes the characterization of aerosol S challenging [32]. Sulfur in aerosols is usually measured in the form of inorganic sulfate ion, and it is often assumed to be one of the most important forms of aerosol S. However, in addition to sulfate, other S compounds, even in smaller quantities, are present in ambient aerosols. Among these, the most abundant are sulfides, organosulfur/sulfate compounds, and polycyclic aromatic sulfur heterocycles (PAHSs) [33,34,35]. Even though different methodological approaches have been applied to resolve S content in aerosols, including ion chromatography, X-ray fluorescence, and inductively coupled plasma mass spectrometry, these cannot determine the oxidation state or directly identify the chemical form of aerosol S. Thus, there is still a need for accurate and direct method enabling speciation of different S species in small amounts such as those found within PM2.5 and/or PM10 samples (usually no more than a few milligrams).
In this work, for the first time the water-soluble (WS) fraction of the fine marine aerosols was studied by voltammetric methods that are used thus far for RSS characterization in natural waters. An analytical protocol for the electrochemical RSS characterization in the WS fraction of aerosol samples is given based on separate voltammetric studies of a methyl 3-mercaptopropionate (3-MPA), and its mixture with sulfide. Here, 3-MPA is used as a representative for mercapto-type compounds (RS–Hg type) which gives a more positive reduction peak (around −0.60 V vs. Ag/AgCl at neutral pH) than standard HgS reduction (around −0.70 V vs. Ag/AgCl) usually considered for RSS quantification in different natural samples [1,2,3,4,5,6,7,8].
2. Experiments
2.1. Materials and Methods
The chemicals used were of reagent grade. The 3-MPA Me 3-MP stock solutions were prepared by dissolving 98% methyl 3-mercaptopropionate (Merck, Darmstadt, Germany) in N2 degassed ultra-pure water (Milli-Q, 18.2 MΩ, total organic carbon (TOC) < 3 ppb). The inorganic sulfide stock solutions were prepared by dissolving Na2S crystals (Sigma-Aldrich, Steinheim, Germany) in N2 degassed solution of 2 × 10⁻⁴ M NaOH (Merck, Darmstadt, Germany). Working solutions were prepared by adding, small volumes of the 3-MPA and/or Na2S stock solutions to the previously N2 degassed solutions of supporting electrolyte (0.55 M NaCl, pH ≈ 6). The above-mentioned conditions, including the supporting electrolyte selection, are chosen to be consistent and comparable with our previous measurements by the same approach [2,7,8,14,16,36]. Nevertheless, we tested the method using the electrolyte of lower ionic strength to mimic more atmospheric conditions (0.1 M NaCl) and did not detect any significant difference in the electrochemical response.
2.2. Aerosol Sampling and Preparation
Natural samples of atmospheric PM2.5 were collected by using the low-volume Sequential Sampler SEQ 47/50 (SEQ47/50) (Sven Leckel, Ingenieuburo GmbH, Berlin, Germany) on a pre-baked (450 °C for 4 h) glass fiber filters (GF/F) (Whatman, grade GF/F, d = 47 mm). The sample collection was conducted at a flow rate of 2.3 m3/h for 48 h.
Sampling was conducted throughout the spring and early autumn in 2016 at the Middle Adriatic location (next to marine Rogoznica Lake, 43.53° N, 15.95° E). According to the air-mass backward trajectory analysis by using the NOAA HYSPLIT model at 10 m above sea level continental air-mass inflows mostly affected sampling area in winter and autumn, while in spring and summer periods southern marine pathways had higher impact. From October to March the synoptic wind circulation was northerly, while from April to September the direction of wind changed to southerly with the domination of south western wind during the summer.
Collected aerosol samples were stored in Petri slides (Millipore Inc., Darmstadt, Germany) at −50 °C prior to analysis. Approximately 10% of the filter sample was cut in pieces and dissolved in 10–20 mL of ultra-pure water (Milli-Q, 18.2 MΩ, total organic carbon (TOC) < 3 ppb), ultrasonicated for 20 min, and stored at 4 °C overnight. Afterward, the solution was filtrated through GF/F filters of 0.7 µm pore sizes and further treated as WS aerosol fraction. For the electrochemical measurements the final ion strength of the WS solution was adjusted by adding saturated NaCl solution to correspond to 0.55 M NaCl electrolyte.
For sulfate (SO42−) analysis approximately a quarter of each exposed filter was cut and dissolved in 10 mL of ultra-pure water (Milli-Q, 18.2 MΩ, total organic carbon (TOC) < 3 ppb), ultrasonicated for 20 min, and stored at 4 °C overnight. The solutions were filtrated through 0.22 μm PTFE disk filters and analyzed by ion chromatography (IC). SO42− anions were measured on a Dionex ICS 3000 ion chromatograph (Thermo Scientific, Sunnyvale, CA, USA) with a conductivity detector.
2.3. Electrochemical Instrumentation and Procedure
The RSS measurements: The RSS measurements were performed with a µ-Autolab (Electrochemical Instrument Eco Chemie, Metrohm Autolab B.V., Utrecht, Netherlands) electrochemical analyzer connected to a 663 VA Stand Metrohm mercury electrode. The reference electrode was an Ag/AgCl/3 M KCl (Ag/AgCl electrode connected to the solution with an electrolyte bridge). A platinum electrode served as the auxiliary electrode. The cell volume was 25 mL.
The applied electrochemical technique was cathodic striping square wave voltammetry (CSSWV). Determination of the non-volatile RSS compounds in Hg was made by their deposition at positive electrode potentials (Ed = −0.2 and −0.4 V vs. reference electrode Ag/AgCl) before and after the acidification step and purging by N2 to remove volatile RSS as already described [2,7,16]. Namely, non-volatile RSS can be measured by voltammetry after acidification and purging of the sample with an inert gas to remove all volatile RSS. For the given experimental conditions, purging by N2 was performed between 3 and 5 min. Cathodic scans with and without accumulation (acc. time, ta = 0–120 s) by stirring at the starting deposition potentials were run with an amplitude (A) of 25 mV and frequency (f) of 80 Hz. The sensitivity of the measurements with 120 s accumulation time is given by the limit of detection (LOD) and limit of quantification (LOQ), which for sulfide measurements were 0.13 and 0.46 nM, respectively, and for 3-MPA the LOD was 0.66 nM and the LOQ 2.21 nM. Quantitation of RSS in the studied samples was based on external calibration, by using calibration curves for sulfide and 3-MPA in 0.55 M NaCl.
The surface-active substance (SAS) measurements: SASs were determined by the electrochemical method of alternating current (a.c.) voltammetry with out-of-phase mode using a µ-Autolab (Electrochemical Instrument Eco Chemie, Metrohm Autolab B.V., Utrecht, Netherlands) electrochemical analyzer connected with 663 VA Stand Metrohm mercury electrode equipped as described above. A.c. voltammetry is based on the SAS adsorption effects at the hydrophobic surface of Hg (at Ed = −0.6 V) [2,36 and references therein]. The measurements were performed under following conditions: accumulation potential Ed = −0.6 V, ta = 30 s, f = 75 Hz, amplitude A = 10 mV, and phase angle = 90°. The concentration of SAS in each sample was expressed in equivalents (mg L−1) of a model surfactant Triton-X-100 (T-X-100). The detection limit of SAS determination is 0.02 mg L−1 equivalent of T-X-100, with LOQ of 0.05 mg L−1. All electrochemical measurements were done at room temperature (21 ± 1 °C).
In addition, water-soluble organic carbon (WSOC) content was determined by the high-temperature catalytic oxidation (HTCO) method at a TOC-VCPH instrument (Shimadzu, Japan) as described previously [7,16,36]. The WSOC sample aliquot (15 mL) was acidified with 2 M HCl to pH ~ 3 in order to eliminate the inorganic carbonates. The concentration of each sample was calculated as an average of three to five replicates. The quantification limit was 0.228 M for dissolved organic C with reproducibility of 5%.
3. Results and Discussion
3.1. Electrochemical Behavior of 3-MPA
During voltammetric experiments, accumulation of 3-MPA on Hg at Ed = −0.2 V resulted in the formation of a 3-MPA–Hg complex (Equation (2)), which was then reduced by scanning the potential toward more negative values. The reduction of the formed complex occurred at around −0.6 V by giving a reversible and reproducible reduction peak according to process explained by the reverse of Equation (2) [9,37]:
2RSH + Hg ↔ (RS)2Hg(ads) + 2H++2e−.
The RSH stands here for thio-type RSS (DMS, DMDS, cysteine, methanethiol, gluthatione). In general, the position and the height of the 3-MPA–Hg reduction peak is sensitive to the pH of the bulk solution as already noted for other RSS studied at the Hg surface [2,3,12,15]. Therefore, in this study, measurements were done at the same conditions, pH ~ 6. By prolonging the accumulation time with stirring (ta = 0–120 s) at the starting Ed = −0.2 V the height of the 3-MPA–Hg reduction peak increases, Ip as shown for the 9 nM 3-MPA solution (Figure 1a). The same effect is obtained by increasing the 3-MPA bulk concentrations (Figure 1b) used for the preparation of a calibration curve (Figure 1c).
The linear relationship between the 3-MPA concentration and Ip which is a direct measure of the reduction process at the Hg, is obtained for the wide concentration range, between 3.0 and 500 nM for an accumulation step with stirring (ta = 120 s). For the given experimental conditions at concentration of 500 nM, saturation of the electrode was achieved. Considering the concentrations of RSS expected in marine aerosol samples, we focused on the calibration in the lower concentration range, between 2 and 50 nM, as presented in Figure 1c. For comparison, the calibration curve of the Na2S is presented in the same graph. Typical voltammetric curves for increasing sulfide concentration are given as an insert in the same Figure. The height of the standard HgS reduction peak, Ip, increases sharply with increasing the concentration of Na2S in the bulk solutions, being about four times more sensitive than the Ip of the same 3-MPA concentrations (Figure 1c), as already documented for thiols, Na2S, and S0 [38,39]. The peak potential of the HgS reduction, if compared with the 3-MPA-Hg reduction, is moving as well more negatively with the increase of the bulk sulfide concentration, i.e., the amount of the formed HgS layer [13,14]. Such a difference in sensitivity is used in this study as an advantage in characterization of mixtures containing organic and inorganic RSS, i.e., the 3-MPA and sulfide.
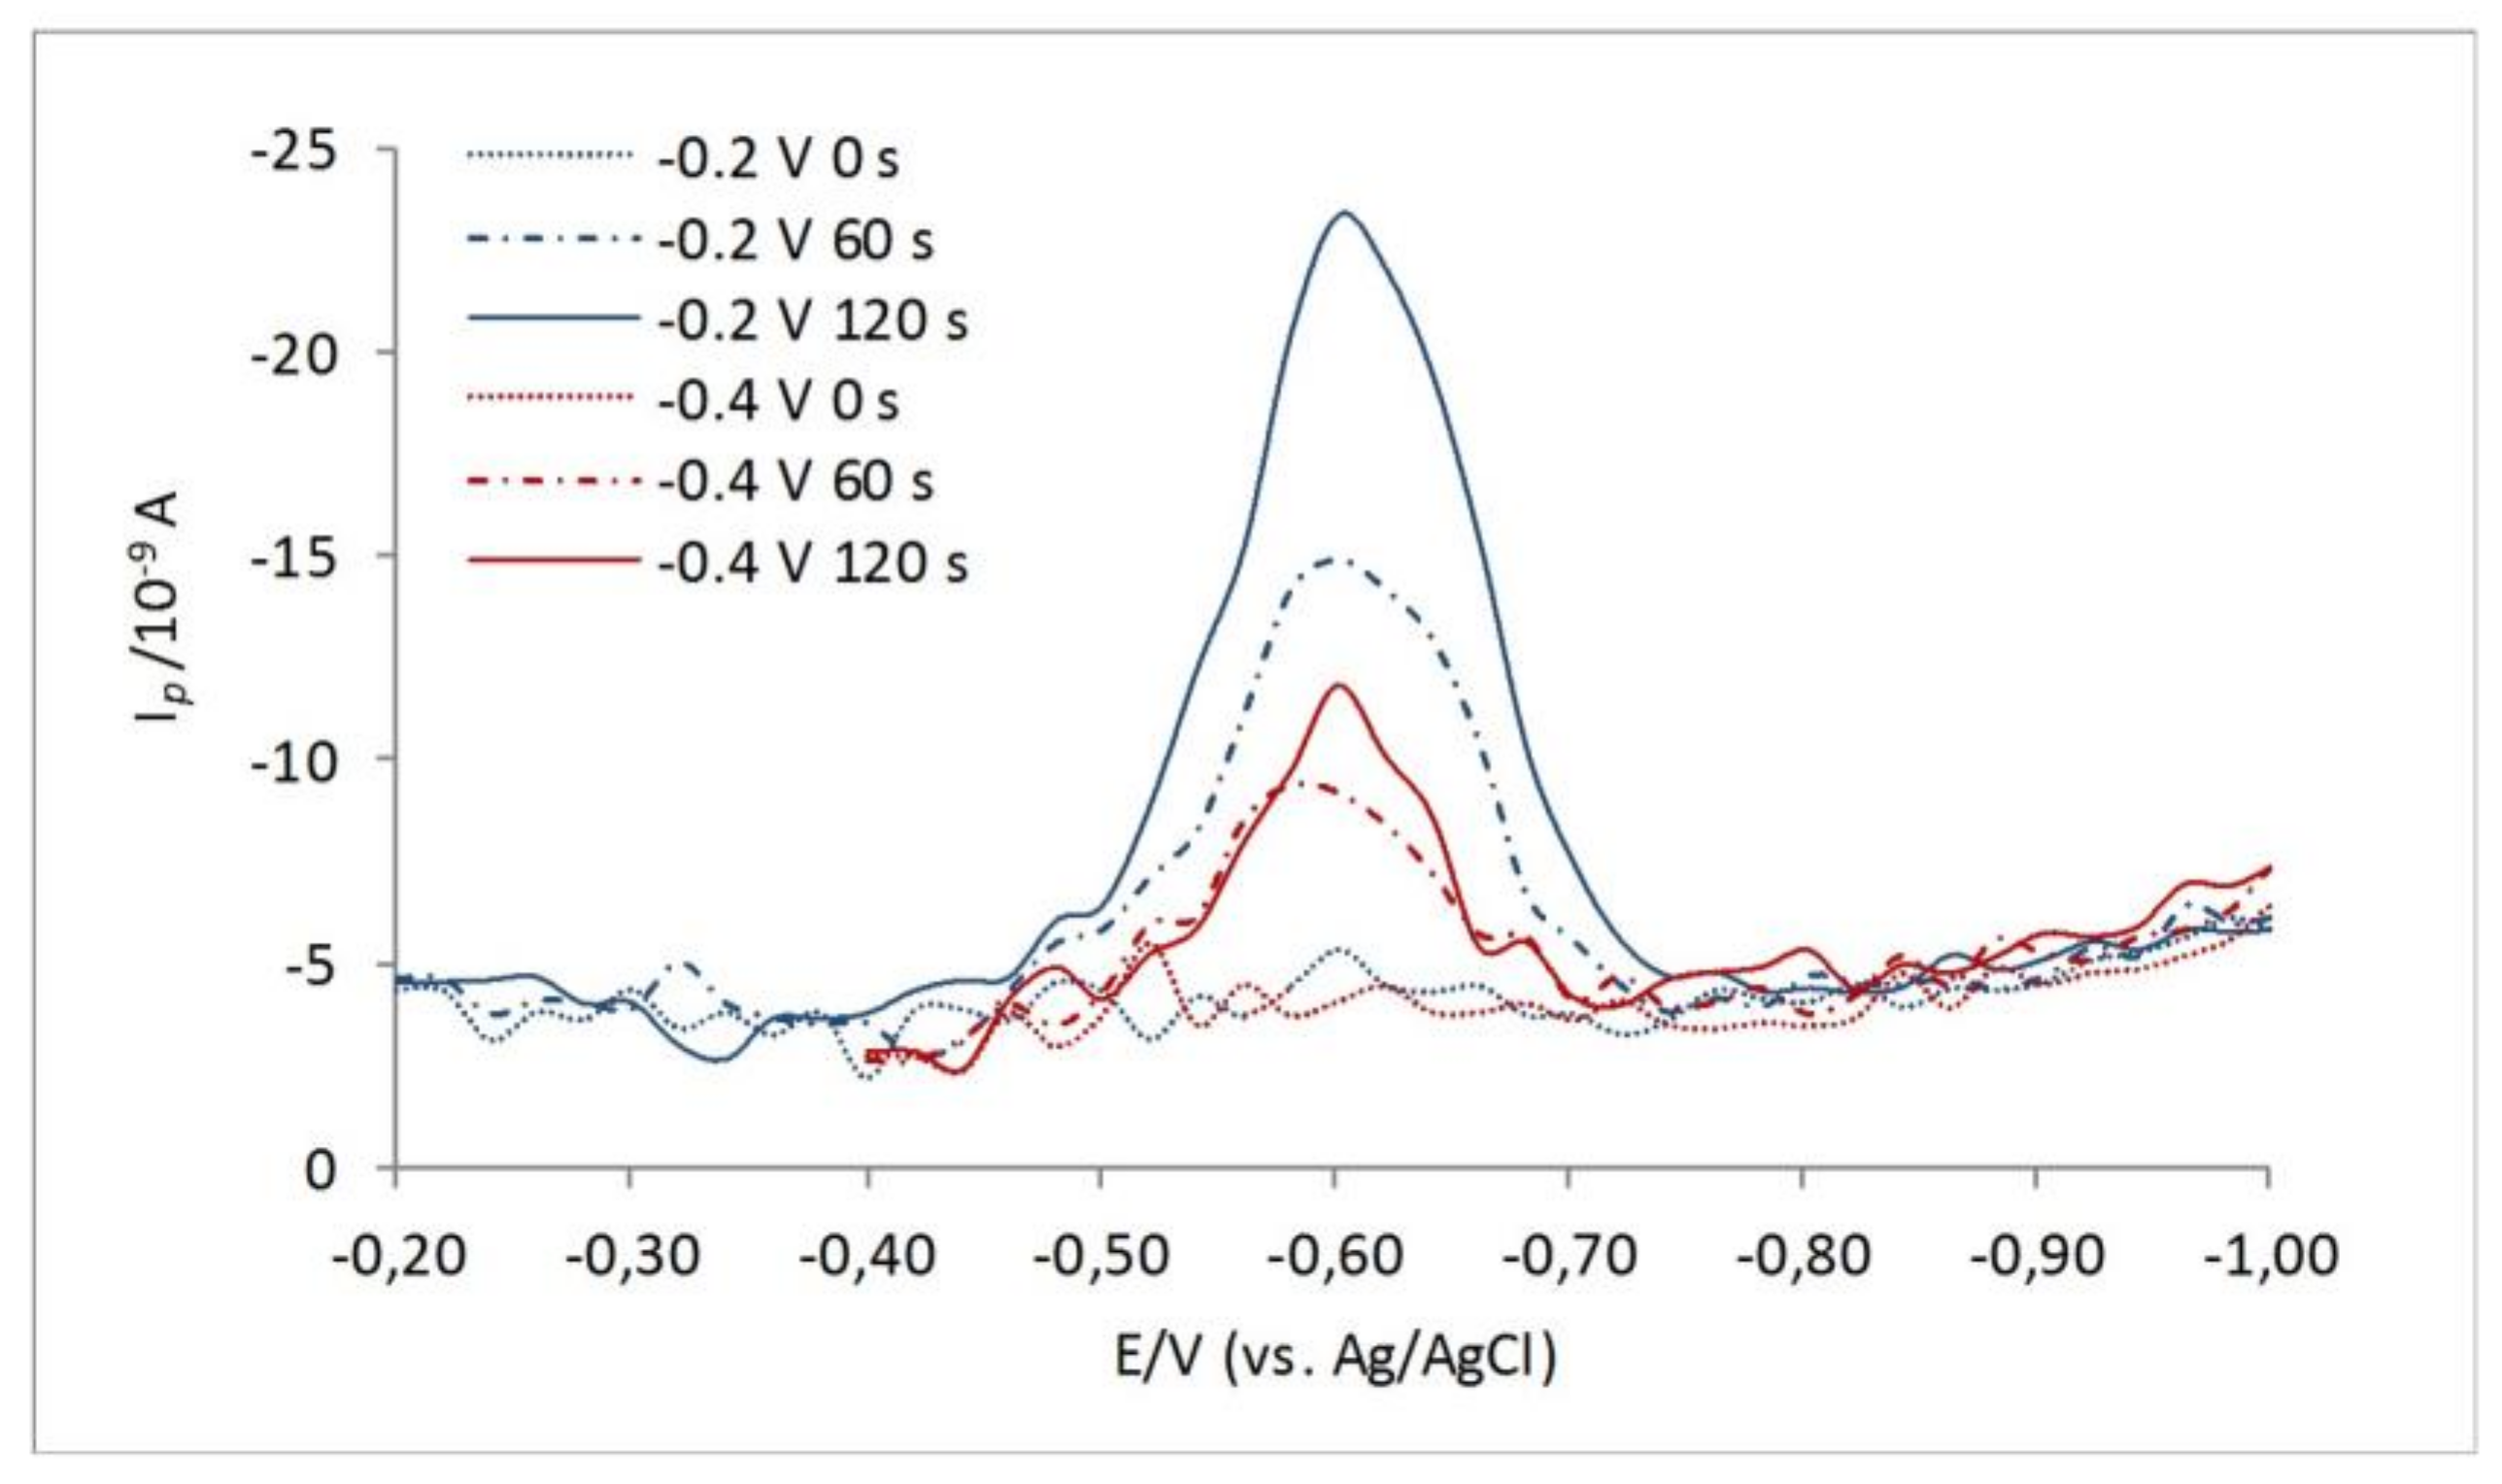
Variation of the deposition potentials (at the given experimental conditions) from Ed = 0.00 to −0.50 V has been already shown to influence electrochemistry of the organic RSS at the Hg surface [9,10,13,40], i.e., the appearance and height of the revealed reduction peaks. Such a property of setting the electrode at the unique deposition potential of maximum response for the selected model compounds was successfully used in the analytical protocol for thiol characterization in seawater and freshwater samples [6,9,10,11,40,41]. Depending on the deposition potential, dimethylarsinyl-ethanol sulfide [13] and similar labile compounds would be oxidized and deposit the HgS layer at the Hg surface. The same behavior is also characteristic for thiourea [42] and some other low-molecular-weight thiols (LMWTs) [9,10] which deposit HgS around 0 V. The observed behavior is caused by the different stability of the RS–Hg and HgS-type compounds as well as different lability of organic RSS at the studied Hg electrode potentials. Here, by changing the deposition potential from −0.2 toward −0.4 V, for the solution containing 3-MPA, the height of the 3-MPA–Hg reduction peak is significantly decreasing by depositing at more negative potentials (Figure 2). Sulfide and elemental sulfur (S0) in the same range of deposition potentials would not change their electrochemical behavior [13].
Usually in the adopted electrochemical measurements of the RSS in natural samples, the acidification and purging step by N2 is used to make a distinction between the volatile and non-volatile fraction of the RSS [2,3,7,13,16]. Sulfide-type RSS are considered volatile, while elemental sulfur (S0) and S0-like compounds (including some LMWTs that deposit HgS and are not sensitive to purging in acidic conditions) are considered non-volatile RSS that mainly contribute to the HgS peak in natural samples. The 3-MPA is shown to be quite stable in water solution. Experiments with 3-MPA approved its stability in water solution within several hours. As distinguished from sulfide which disappears completely from acidic solution (pH = 3–5) in 3–5 min depending on the concentration, the 3-MPA is insensitive to acidification and purging with nitrogen (see Figure 3). This different behavior of 3-MPA and sulfide in acidic conditions enables their direct electrochemical determination in the solution.
3.2. Mixture of Model RSS: 3-MPA and Na2S as Representatives for Organic and Inorganic RSS
Although under some experimental conditions the RS–Hg and HgS reduction peaks merge [9,10,40], in our case at given experimental conditions: By selecting the 3-MPA as a representative of the organic RSS; by selecting the deposition potentials at Ed = −0.2 and −0.4 V, and by the different deposition accumulation times (ta = 0−120 s), separate reduction peaks were clearly revealed as shown in Figure 3. Different accumulation times at different deposition potentials influence the position and intensities of the recorded reduction peaks in the mixture of the 3-MPA and Na2S. Deposition at Ed = −0.2 V would produce only one peak, while deposition at Ed = −0.4 V allows appearance of both the 3-MPA–Hg and HgS reduction.
Herein, note that with longer accumulation time at Ed = −0.2, only one peak appears. While by deposition at Ed = −0.4 V, and longer deposition, the HgS reduction is also expressed. The acidification step assures that all volatile RSS (sulfide here) will be removed from the mixture, and only non-volatile RSS will remain.
However, the accumulation effect is more expressed in the case of HgS. As already shown, the HgS reduction is not influenced by changing the deposition potentials from 0 to −0.5 V [13], and the HgS reduction peak remains the same whether it is accumulated at −0.2 or −0.4 V. In other words, by selecting these potentials it is possible to make a rough distinction between organic and inorganic S compounds [2,13,16] since majority of organic RSS would not deposit HgS at Hg.
Furthermore, there is a possibility to further characterize and define recorded peaks separately by detailed convolution analyses (Autolab GPES and/or ECDSOFT software, [43]; http://gss.srce.hr/pithos/rest/[email protected]/files/Software/.) However, if the acidification and purging step by N2 is additionally applied, it is possible to completely remove sulfide (i.e., all volatile RSS) from the mixture and detect one reduction peak assigned to 3-MPA–Hg, as shown in Figure 3 by the green, bold line. Therefore, 3-MPA belongs to a pool of non-volatile and non-acidification-step sensitive RSS, as already discussed [2].
Based on the above-presented results, we conclude that the mixture characterization should be done by measuring at deposition potentials of −0.2 and −0.4 V, with variation of accumulation times (ta = 0–120s). The acidification step (pH = 2–3), and the measurement of the voltammetric peaks before and after acidification and purging, followed by adjustment to original pH, will indicate the presence of volatile and/or non-volatile RSS.
3.3. Electrochemical RSS Responses in WS Fraction of Fine Marine Aerosols
Electrochemical responses recorded in the WS fraction of the fine marine aerosols are shown in Figure 4. In Figure 4a, the electrochemical response is shown for three consecutive samples from the spring season (March 29–April 4, 2016), denoted as S1, S2, and S3. Figure 4b shows electrochemical responses for four early autumn samples denoted as A1, A2, A3, and A6 (October 8–14, 2016 and October 18–20, 2016, respectively). In spring samples, the presence of mainly RS–Hg reduction was observed, while both, the RS–Hg and HgS peaks were detected in early autumn samples. Peak identification was additionally confirmed by considering the standard 3-MPA solution spiked with Na2S as shown within Figure 4a.
Electrochemical responses recorded in the WS fraction of the fine marine aerosols are shown in Figure 4. In Figure 4a, the electrochemical response is shown for three consecutive samples from the spring season (29 March–4 April 2016), denoted as S1, S2, and S3. Figure 4b shows electrochemical responses for four early autumn samples denoted as A1, A2, A3, and A6 (October 8–14, 2016 and October 18–20, 2016, respectively). In spring samples, the presence of mainly RS–Hg reduction was observed, while both, the RS–Hg and HgS peaks were detected in early autumn samples. Peak identification was additionally confirmed by considering the standard 3-MPA solution spiked with Na2S as shown within Figure 4a.
Observed RSS peaks in the studied WS aerosol samples were recorded in the same range of potentials (−0.58 to −0.76 V) as recorded in the model mixtures of the 3-MPA and sulfide. In spring samples, there was no difference in the peak appearance and its height by measuring at different (Ed = −0.2 and −0.4 V) deposition potentials, behaving more like the HgS reduction, even the peak position was more positive than expected for the typical HgS reduction (Figure 4a). However, in autumn samples, deposition at −0.4 V during ta = 120 s revealed only the HgS peak (Figure 4c). In these samples, the accumulation effect was also more expressed through increasing of the HgS peak as observed in the model mixtures. Standard addition of the 3-MPA directly into the electrochemical cell containing the A1 sample after the acidification and purging step caused an increase of the first more positive peak, RS–Hg around −0.6 V (Figure 4d), pointing to similar electrochemical behavior to the 3-MPA-Hg electrode process, while the addition of sulfide caused the increase of the more negative HgS peak. It is important to stress that all recorded RSS peaks (RS–Hg and HgS-type electrode reaction) were not visible under diffusion-controlled conditions (ta = 0s) and were not sensitive to the purging and acidification step, indicating the presence of non-volatile RSS.
The appearance of the negative HgS peak in autumn samples could be likely associated with enhanced release of volatile S compounds during water layer mixing in the nearby marine Rogoznica Lake [44]. That is, during intense vertical lake water layers mixing, millimolar concentrations of sulfide present in the anoxic bottom layer reach the surface where it is rapidly oxidized (mainly to S0) and further lost into the atmosphere. Such a scenario is supported by decreasing the HgS peak in aerosol samples collected five days and later from October 5/6, when mixing of the water layers started (Figure 4b and Table 1). In the same WS aerosol samples, the decrease of the RS–Hg peaks was also noticed.
According to the electrochemical behavior and position of the recorded RSS peaks in the studied ambient aerosol samples, corresponding to the 3-MPA–Hg and HgS reduction, the detected peaks presumably can be evidence of non-volatile mercapto-type RSS and sulfide and/or S0 or other non-volatile and labile RSS-like compounds that deposit HgS at the Hg surface. The existence of similar compounds has already been proved for the oxic water layers in the North Adriatic as well as marine Rogoznica Lake [2,7,13]. Similar electrochemical response, implying similar RSS were reported as well for precipitation samples (the concentration range for detected RSS was between 2 and 5 nM) [16], where mainly volatile RSS were associated with the RS–Hg peak detected at around −0.55 V (vs. Ag/AgCl).
In the studied spring samples, Ip of non-volatile RS–Hg peaks ranges from 22 to 130 nA, which corresponds to concentrations of the mercapto-type compounds ranging from 10.0 to 65.0 nM in analyzed WS filter aliquots (calibrated with the 3-MPA). The concentration of non-volatile RSS, expressed in relation to the volume of the sampled air, ranges from 2.60 to 15.40 ng m−3 (mean value = 7.40 ng m−3, N = 10). In autumn samples, detected peaks range from 12 to 63 nA, corresponding to concentrations of the mercapto-type compounds ranging from 6.0 to 30.0 nM, i.e., from 0.48 to 2.23 ng m−3 (mean value = 1.26 ng m−3, N = 6). The Ip of the second HgS peak in autumn samples calibrated with the sulfide, ranged from 7 to 117 nA, which correspond to RSS concentration ranging from 0.75–11.89 nM in analyzed WS filter aliquots, i.e., from 0.02 to 0.26 ng m−3 (mean value = 0.07 ng m−3, N = 6) if expressed in relation to the volume of the sampled air.
In addition, concentration of WSOC and surface-active substances (SAS) was determined for all aerosol samples discussed above (S1–S3 and A1–A3, A6), and their values are given in Table 1. Relatively high organic matter content, especially its surface-active fraction that strongly adsorbs on the hydrophobic Hg surface [2,36,45], could potentially suppress the reduction process of organic RSS [2,12,45] and mask the real concentration of RSS present in the ambient samples. On the other side, recorded RSS peaks in solutions with such relatively high SAS presence indicate relatively strong interaction between the present RSS and Hg. Recently published work on voltammetry of reduced glutathione, in its analytical protocol recommends a reduction of natural organic matter concentration to at least 1 mg L−1 [12] for getting the signal for Hg-glutathione reduction, implying that, in the samples studied here, RSS with a stronger stability constant with Hg than that with Hg-glutathione are possible present.
Presence of SAS is also known to influence the appearance and shape of the HgS peak [45], as was the case in WS aerosol samples studied here. For example, in samples S2 and A1, the most evident RSS response was obtained after double dilution of the original WS aerosol fractions. Moreover, it appears that the HgS peak is positioned more negatively in WS aerosol and precipitation samples [16] in comparison with seawater samples, which can be a consequence of more hydrophobic SAS presence that are blocking electrode redox reaction. Furthermore, the same organic material could have important role in increasing the solubility of organic compounds as well as stabilization of RSS in the aqueous phase and could modify the dissolution rate of aerosol particles in the atmosphere. It is worth noting that higher values of WSOC (0.81–3.45 µg m−3) were recorded in the spring samples when higher amount of non-volatile mercapto-type RSS (2.5−15.8 ng m−3) was also detected. Such seasonal difference could be attributed to biological activity, as already shown for the WSOC fraction in the marine aerosols [46]. The observed seasonal variations of the sulfate concentration shown in Table 1 also lead to the same conclusion.
Results from this work are supportive to studies reporting a significant concentration of non-sulfate sulfur species in fine aerosols [33,34,35,47]. Besides organosulfates, additional sulfur species such as methanesulfonates, hydroxymethanesulfonates, sulfites, sulfides, polycyclic aromatic sulfur heterocycles, and primary biological particles were reported to contribute to non-sulfate sulfur species. Depending on location and season, the likely presence of such compounds was reported for locations dominated by biogenic emissions, such as forested and agricultural regions and marine environment. As in our case, the signal for such S aerosols was most pronounced during the summer. In addition, preliminary source apportionment results indicate sulfur-containing organic aerosols as an important WSOC fraction in the same studied aerosol samples [48]. However, these S species may also have an anthropogenic source [47].
It is also important to note how the hydrophobic part of WSOC, called humic-like substances (HULIS) [49,50] as they share similar spectroscopic properties to macromolecular humic substances in terrestrial and aquatic environments [51], could have electrochemically active sulfur. That is, a high level of electrochemically active sulfur is confirmed for fulvic and humic material isolated from the lagoon and marine sediments [7,52]. In the previous paper of Frka et al. [36], a broad voltammetric peak that was recorded around a potential of −0.70 V in continental, coastal, and urban aerosol samples as well as in the isolated atmospheric HULIS, could be possibly associated with the presence of RSS. These RSS contribute to the surfactant activity, since HULIS material, i.e., HULIS concentration can be regarded as a rough upper-limit estimate of aerosol water-soluble SAS [53]. Moreover, RSS are an important part of the total S pool in aerosol samples. On the other side, HULIS could contribute to higher solubility and stabilization of RSS in the atmospheric aqueous phase, similarly to that obtained for natural organic macromolecules and elemental sulfur in seawater [7].
In addition, sulfur-containing compounds in the class of carbohydrates and proteins have been recently identified in HULIS extracts of aerosols collected in the coastal area of South Korea [54]. Moreover, protein-like components were found dominant in marine aerosols sampled over the Amundsen Sea as a result of biological activity [55]. Similar compounds are shown to be electroactive on Hg [56,57,58]. Likewise, a persistent behavior of the revealed voltammetric peaks, suggest that, in this study, detected RSS are from secondary processing in the atmosphere and not from primary emissions.
4. Conclusions
In this work, voltammetric methods have been used for the first time to study the presence of reduced sulfur species (RSS) in the water-soluble fraction of the fine marine aerosols collected during spring and early autumn in the area of Rogoznica Lake, a unique anoxic and sulfidic seawater environment at the Adriatic. Two types of non-volatile RSS peaks were detected and attributed to the presence of mercapto-type (RS–Hg peak at around −0.6 V and positive, calibrated with 3-MPA) and sulfide/S0-like compounds (HgS peak more negative than −0.6 V, calibrated with sulfide). In spring samples only, the presence of the mercapto-type compounds was evident and proved by the addition of the standard 3-MPA, ranging from 2.60 to 15.40 ng m−3, while both, the mercapto-type (0.48–2.23 ng m−3) and sulfide and/or S0-like compounds (0.02–0.26 ng m−3) were detected in early autumn samples collected during anoxic holomictic event [44] in the nearby marine lake water column.
Intensity of the RS–Hg peaks in ambient samples varied through the studied seasons with more expressed and defined peaks recorded in the spring, which possibly indicates their association with biological activity. It is worth to note that these mercapto-type RSS, show the same seasonal trend as biogenically derived sulfate and methanesulfonic acid (MSA) recorded in the same aerosol samples [59], which as the oxidation product of dimethyl sulfide, is widely used as a proxy for marine biogenic sources [32,46,59]. MSA was shown not to be electrochemically active at the given experimental conditions.
In this preliminary work, the 3-MPA is used as a representative of LMW reduced organosulfur compounds that can be usually found in natural aqueous environment, as detected by chromatographic methods [60,61,62]. Thus, we do not intend to declare exactly the presence of 3-MPA in the studied samples, but the presence of similar RSS organic compounds should be considered with regard to the electrochemical response. This statement is supported by preliminary source apportionment results indicating sulfur-containing organic aerosols as an important WSOC fraction in the same aerosol samples [48]. In addition, higher values of WSOC (0.81–3.45 µg m−3) were recorded in the spring samples when higher amounts of non-volatile mercapto-type RSS (2.60–15.40 ng m−3) were also detected.
The adopted protocol by selecting appropriate experimental conditions (accumulation at deposition potentials Ed = −0.2 V and/or −0.4 V vs. Ag/AgCl and the acidification and purging step followed by adjustment of the pH to the original after purging) confirms that electrochemistry is a fast, direct, and non-destructive methodology for the analyses of different seawater and freshwater samples [2,6,9,10,11,40,41,45] and can be successfully applied for the single-scan characterization of the electrochemically active sulfur compounds in ambient aerosol samples. Further work is planned to test other atmospheric RSS-relevant substances and their possible contribution to the detected RSS peaks with possible optimization of the experimental conditions given here.
Author Contributions
Methodology, including sampling and filter sample preparation and measurements I.C. and S.F.; resources, funding: I.C.; measurements, analysis: A.C.K.; supervision: I.C. and S.F.; writing—original draft, and revised version, A.C., and I.C.
Funding
This research was funded by Hrvatska Zaklada za Znanost, grant numbers IP-11-2013-1205 SPHERE, IP-01-2018-1717 MARRES.
Acknowledgments
This work is supported by the Croatian Science Foundation projects IP-11-2013-1205 SPHERE and IP-01-2018-1717 MARRES. Authors thank Ana Kroflič and Irena Grgić from the Department of Analytical Chemistry, National Institute of Chemistry, Ljubljana, Slovenia for sulfate analysis”D. Omanović for help in using ECDSOFT software during analysis of the RSS peaks, and the anonymous reviewers for their valuable comments that improved the manuscript. Marina Frapa Rogoznica is highly acknowledged for support during aerosol sampling.
Conflicts of Interest
The authors declare that they have no conflict of interest.
Abbreviations
methyl 3-mercaptopropionate (3-MPA).
References
- Luther, G.W.; Tsamakis, E. Concentration and form of dissolved sulfide in the oxic water column of the ocean. Mar. Chem. 1989, 27, 165–177. [Google Scholar] [CrossRef]
- Ciglenečki, I.; Ćosović, B. Electrochemical Study of Sulfur Species in Seawater and Marine Phytoplankton Cultures. Mar. Chem. 1996, 52, 87–97. [Google Scholar] [CrossRef]
- Ciglenečki, I.; Ćosović, B. Electrochemical Determination of Thiosulfate in Seawater in the Presence of Elemental Sulfur and Sulfide. Electroanalysis 1997, 9, 775–780. [Google Scholar] [CrossRef]
- Al-Farawati, R.K.; Van den Berg, C.M.G. The Determination of Sulfide in Seawater by Flow-Analysis with Voltammetric Detection. Mar. Chem. 1997, 57, 277–286. [Google Scholar] [CrossRef]
- Rozan, T.F.; Theberge, S.M.; Luther, G. Quantifying elemental sulfur (S0), bisulfide (HS-) and polysulfides (Sx2-) using a voltametric method. Anal. Chim. Acta 2000, 415, 175–184. [Google Scholar] [CrossRef]
- Laglera, L.M.; Van den Berg, C.M.G. Copper complexation by thiol compounds in estuarine waters. Mar. Chem. 2003, 82, 71–89. [Google Scholar] [CrossRef]
- Bura-Nakić, E.; Helz, G.R.; Ciglenečki, I.; Ćosović, B. Seasonal variations in reduced sulfur species in a stratified seawaterlake (Rogoznica Lake, Croatia): Evidence for organic carriers of reactive sulfur. Geochim. Cosmochim. Acta 2009, 73, 3738–3751. [Google Scholar] [CrossRef]
- Bura-Nakić, E.; Viollier, B.; Ciglenečki, I. Electrochemical and colorimetric measurements show the dominant role of FeS in a permanently anoxic lake. Environ. Sci. Technol. 2013, 47, 741–749. [Google Scholar] [CrossRef]
- Superville, P.-J.; Pižeta, I.; Omanović, D.; Billon, G. Identification and on-line monitoring of reduced sulphur species (RSS) by voltammetry in oxic waters. Talanta 2013, 112, 55–62. [Google Scholar] [CrossRef]
- Laglera, L.M.; Downes, J.; Tovar-Sánchez, A.; Monticelli, D. Cathodic pseudopolarography: A new tool for the identification and quantification of cysteine, cystine and other low molecular weight thiols in seawater. Anal. Chim. Acta 2014, 836, 24–33. [Google Scholar] [CrossRef]
- Marie, L.; Pernet-Coudrier, B.; Waeles, M.; Gabon, M.; Riso, R. Dynamics and sources of reduced sulfur, humic substances and dissolved organic carbon in a temperate river system affected by agricultural practices. Sci. Total Environ. 2015, 537, 23–32. [Google Scholar] [CrossRef] [PubMed]
- Chen, W.; Guéguen, C.; Smith, D.S. Assessing effects of pH, metal ion and natural organic matter on identification and determination of reduced glutathione by cathodic stripping voltammetry. Int. J. Environ. Anal. Chem. 2017, 97, 330–334. [Google Scholar] [CrossRef]
- Krznarić, D.; Ciglenečki, I.; Ćosović, B. Voltammetric investigations of 2-dimethylarsinyl-ethanol sulphide in NaCl and seawater. Anal. Chim. Acta 2001, 431, 269–278. [Google Scholar] [CrossRef]
- Milanović, I.; Krznarić, D.; Bura-Nakić, E.; Ciglenečki, I. Deposition and dissolution of metal sulfide layers at a Hg electrode surface in seawater electrolyte conditions. Environ. Chem. 2013, 11, 167–172. [Google Scholar] [CrossRef]
- Florence, T.M. Cathodic stripping voltammetry: Part I. Determination of organic sulfur compounds, flavins and porphyrins at the sub-micromolar level. J. Electroanal. Chem. 1979, 97, 219–236. [Google Scholar] [CrossRef]
- Orlović-Leko, P.; Omanović, D.; Ciglenečki, I.; Vidović, K.; Brenko, T. Application of electrochemical methods in the physico-chemical characterization of atmospheric precipitation. Bulg. Chem. Commun. 2017, 49, 211–217. [Google Scholar]
- Williams, K.D.; Jones, A.; Roberts, D.L.; Senior, C.A.; Woodage, M.J. The response of the climate system to the indirect effects of anthropogenic sulfate aerosol. Clim. Dyn. 2001, 17, 845–856. [Google Scholar] [CrossRef]
- Burnett, R.T.; Dales, R.; Krewski, D.; Vincent, R.; Dann, T.; Brook, J.R. Associations between ambient particulate sulfate and admissions to Ontario hospitals for cardiac and respiratory diseases. Am. J. Epidemiol. 1995, 142, 15–22. [Google Scholar] [CrossRef]
- Pardo, M.; Porat, Z.; Rudich, A.; Schauer, J.J.; Rudich, Y. Repeated exposures to roadside particulate matter extracts suppresses pulmonary defense mechanisms, resulting in lipid and protein oxidative damage. Environ. Pollut. 2016, 210, 227–237. [Google Scholar] [CrossRef]
- Galloway, J.N. Acid deposition: Perspectives in time and space. Water Air Soil Pollut. 1995, 85, 15–24. [Google Scholar] [CrossRef]
- Charlson, R.J.; Lovelock, J.E.; Andreae, M.O.; Warren, S.G. Oceanic phytoplankton, atmospheric sulphur, cloud albedo and climate. Nature 1987, 326, 655–661. [Google Scholar] [CrossRef]
- Quinn, P.K.; Bates, T.S. The case against climate regulation via oceanic phytoplankton sulphur emissions. Nature 2011, 480, 51–56. [Google Scholar] [CrossRef] [PubMed]
- Cullis, C.F.; Hirschler, M.M. Atmospheric sulfur: Natural and man-made sources. Atmos. Environ. 1980, 14, 1263–1278. [Google Scholar] [CrossRef]
- Chin, M.; Jacob, D.J.; Gardner, G.M.; Foreman-Fowler, M.S.; Spiro, P.A.; Savoie, D.L. A global three-dimensional model of tropospheric sulfate. J. Geophys. Res. 1996, 101, 18667–18690. [Google Scholar] [CrossRef]
- Smith, S.J.; Pitcher, H.; Wigley, T.M.L. Global and Regional Anthropogenic Sulfur Dioxide Emissions. Glob. Planet. Change 2001, 29, 99–119. [Google Scholar] [CrossRef]
- Graf, H.F.; Langmann, B.; Feichter, J. The contribution of Earth degassing to the atmospheric sulfur budget. Chem. Geol. 1998, 147, 131–145. [Google Scholar] [CrossRef]
- Bhugwant, C.; Siéja, B.; Bessafi, M.; Staudacher, T.; Ecormier, J. Atmospheric sulfur dioxide measurements during the 2005 and 2007 eruptions of the Piton de La Fournaise volcano: Implications for human health and environmental changes. J. Volcanol. Geotherm. Res. 2009, 184, 208–224. [Google Scholar] [CrossRef]
- Kristmannsdottir, H.; Sigurgeirsson, M.; Armannsson, H.; Hjartarson, H.; Olafsson, M. Sulfur gas emissions from geothermal power plants in Iceland. Geothermics 2000, 29, 525–538. [Google Scholar] [CrossRef]
- Andreae, M.O. Ocean-atmosphere Interactions in the global biogeochemical sulfur cycle. Mar. Chem. 1990, 30, 1–29. [Google Scholar] [CrossRef]
- Malin, G.; Kirst, G.O. Algal production of dimethyl sulfide and its atmospheric role. J. Phycol. 1997, 33, 889–896. [Google Scholar] [CrossRef]
- Stefels, J.; Steinke, M.; Turner, S.; Malin, G.; Belviso, S. Environmental constraints on the production and removal of the climatically active gas dimethylsulphide (DMS) and implications for ecosystem modeling. Biogeochemistry 2007, 83, 245–275. [Google Scholar] [CrossRef]
- Seinfeld, J.H.; Pandis, S.N. Atmospheric Chemistry and Physics from Air Pollution to Climate Change, 2nd ed.; John Wiley & Sons: New York, NY, USA, 2006. [Google Scholar]
- Neubauer, K.R.; Sum, S.T.; Johnston, M.V.; Wexler, A.S. Sulfur speciation in individual aerosol particles. J. Geophys. Res. 1996, 101, 18701–18707. [Google Scholar] [CrossRef]
- Graham, B.; Guyon, P.; Maenhaut, W.; Taylor, P.E.; Ebert, M.; Matthias-Maser, S.; Mayol-Bracero, O.L.; Godoi, R.H.M.; Artaxo, P.; Meixner, F.X.; et al. Composition and diurnal variability of the natural Amazonian aerosol. J. Geophys. Res. 2003, 108, 4765–4782. [Google Scholar] [CrossRef]
- Cozzi, F.; Pellergrini, I.; Adami, G.; Reisenhofer, E.; Bovenzi, M.; Barbieri, P. Sulphur speciation of PM10 samples by XANES spectroscopy. Cent. Eur. J. Chem. 2009, 7, 395–401. [Google Scholar] [CrossRef] [Green Version]
- Frka, S.; Dautović, J.; Kozarac, Z.; Ćosović, B.; Hoffer, A.; Kiss, G. Surface-active substances in atmospheric aerosol: An electrochemical. Tellus B Chem. Phys. Meteorol. 2012, 64, 18490–18503. [Google Scholar] [CrossRef]
- Luther, G.W.; Church, T.M.; Giblin, A.E.; Howarth, R.W. Speciation of Dissolved Sulfur in Salt Marshes by Polarographic Methods. In Organic Marine Geochemistry; Symposium Series; Mary, L.J., Ed.; Marine Chemistry in the Coastal Environment, American Chemical Society: Washington, DC, USA; Volume 305, pp. 340–355, Chapter 20.
- Renard, J.J.; Kubes, G.; Bolker, H.I. Polarographic determination of sulfur compounds in pulping liquors. Anal. Chem. 1975, 47, 1347–1352. [Google Scholar] [CrossRef]
- Wang, F.; Tessier, A. Voltammetric determination of elemental sulfur in pore waters. Limnol. Oceanogr. 1998, 43, 1353–1361. [Google Scholar] [CrossRef]
- Laglera, L.M.; Tovar-Sanchez, A. Direct recognition and quantification by voltammetry of thiol/ thioamide mixes in seawater. Talanta 2012, 89, 496–504. [Google Scholar] [CrossRef]
- Pernet-Coudrier, B.; Waeles, M.; Filella, M.; Quentel, F.; Riso, R.D. Simple and simultaneous determination of glutathione, thioacetamide and refractory organic matter in natural waters by DP-CSV. Sci. Total Environ. 2013, 463, 997–1005. [Google Scholar] [CrossRef]
- Banica, F.-G.; Galik, M.; Švancar, I.; Vytras, K. Electrochemical Investigation of Metal Sulfides at Mercury Electrodes Using Thiourea as a Source of Sulfide Ion. Electroanalysis 2009, 21, 332–341. [Google Scholar] [CrossRef]
- Omanović, D.; Branica, M. Automation of voltammetric measurements by polarographic analyser PAR 384B. Croat. Chem. Acta 1998, 71, 421–433. [Google Scholar]
- Ciglenečki, I.; Ljubešić, Z.; Janeković, I.; Batistić, M. Rogoznica Lake, A Euxinic Marine Lake on the ADRIATIC Coast (Croatia) that Fluctuates Between Anoxic Holomictic and Meromictic Conditions; Ramesh, D.G., Zadereev, E.S., Degermendzhi, A.G., Eds.; Springer: Wageningen, The Netherlands, 2017; pp. 125–154. [Google Scholar]
- Ciglenečki, I.; Kodba, Z.; Ćosović, B. Sulfur Species in Rogoznica Lake. Mar. Chem. 1996, 53, 101–110. [Google Scholar] [CrossRef]
- Yoon, Y.J.; Ceburnis, D.; Cavalli, F.; Jourdan, O.; Putaud, J.P.; Facchini, M.C.; Decesari, S.; Fuzzi, S.; Sellegri, K.; Jennings, S.G.; et al. Seasonal characteristics of the physicochemical properties of North Atlantic marine atmospheric aerosols. J. Geophys. Res. Atoms. Geophys. Union 2007, 112, D04206. [Google Scholar] [CrossRef]
- Shakya, K.M.; Peltier, R.E. Non-sulfate sulfur in fine aerosols across the United States: Insight for organosulfate prevalence. Atmos. Environ. 2015, 100, 159–166. [Google Scholar] [CrossRef] [PubMed]
- Casotto, R.; Cvitešić Kušan, A.; Bhattu, D.; Ciglenečki, I.; Frka, S.; Kroflič, A.; Grgić, I.; Baltensperger, U.; Slowik, J.; Prévôt, A.S.H. Combined analysis using AMS and EESI measures for organic aerosol source apportionment of the Adriatic coast, poster presentation (P1-054). In Proceedings of the European Aerosol Conference, Gothenburg, Sweden, 25–30 August 2019. [Google Scholar]
- Kiss, G.; Tombacz, E.; Hansson, H.C. Surface tension effects of humic-like substances in the aqueous extract of tropospheric fine aerosol. J. Atmos. Chem. 2005, 50, 279–294. [Google Scholar] [CrossRef]
- Facchini, M.C.; Decesari, S.; Mircea, M.; Fuzzi, S.; Loglio, G. Surface tension of atmospheric wet aerosol and cloud/fog droplets in relation to their organic carbon content and chemical composition. Atmos. Environ. 2000, 34, 4853–4857. [Google Scholar] [CrossRef]
- Kiss, G.; Varga, B.; Galambos, I.; Ganszky, I. Characterization of water-soluble organic matter isolated from atmospheric fine aerosol. J. Geophys. Res. Atmos. 2002, 107, D21. [Google Scholar] [CrossRef]
- Gašparović, B.; Ćosović, B. Electrochemical estimation of the dominant type of surface active substances in seawater samples using o-nitrophenol as a probe. Mar. Chem. 1994, 46, 179–188. [Google Scholar] [CrossRef]
- Kroflič, A.; Frka, S.; Simmel, M.; Wex, H.; Grgić, I. Size-resolved surface active substances of atmospheric aerosol: Reconsideration of 3 the impact on sloud droplet formation. Environ. Sci. Technol. 2018, 52, 9179–9187. [Google Scholar] [CrossRef]
- Jang, K.-S.; Choi, A.Y.; Choi, M.; Kang, H.; Kim, T.-W.K.; Park, K.T. Size-Segregated chemical compositions of HULISs in ambient aerosols collected during the winter season in Songdo, South Korea. Atmosphere 2019, 10, 226–240. [Google Scholar] [CrossRef]
- Jung, J.; Hong, S.-B.; Chen, M.; Hur, J.; Jiao, L.; Lee, Y.; Park, K.; Hahm, D.; Choi, Y.-O.; Yang, E.J.; et al. Characteristics of biogenically-derived aerosols over the Amundsen Sea, Antarctica. Atmos. Chem. Phys. Discuss. 2019, 3. [Google Scholar] [CrossRef]
- Ciglenečki, I.; Plavšić, M.; Vojvodić, V.; Ćosović, B.; Pepi, M.; Baldi, F. Mucopolysaccharide transformation by sulfide in diatom culture and natural mucilage. Mar. Ecol. Prog. Ser. 2003, 263, 17–27. [Google Scholar] [CrossRef]
- Strmečki, S.; Plavšić, M.; Steigenberger, S.; Passow, U. Characterization of phytoplankton exudates and carbohydrates in relation to their complexation of copper, cadmium and iron. Mar. Ecol. Prog. Ser. 2010, 408, 33–46. [Google Scholar] [CrossRef] [Green Version]
- Strmečki, S.; Paleček, E. Adsorption/desorption of biomacromolecules involved in catalytic hydrogen evolution. Bioelectrochemistry 2018, 120, 87–93. [Google Scholar] [CrossRef] [PubMed]
- Cvitešić Kušan, A.; Kroflič, A.; Grgić, I.; Ciglenečki, I.; Frka, S. Chemical characterization of fine aerosols in respect to water-soluble ions at the eastern Middle Adriatic coast. Environ. Sci. Pollut. Res. 2019. Submitted to. [Google Scholar]
- Shea, D.; MaCcre, W.A. Determination of hydrophilic thiols in sediment porewater using ion-pair liquid chromatography coupled with electrochemical detection. Anal. Chem. 1988, 60, 1449–1454. [Google Scholar] [CrossRef]
- Saltzman, E.S.; Cooper, W.J. Biogenic Sulfur in the Environment; American Chemical Society: Washington, DC, USA, 1989; Volume 39. [Google Scholar]
- Eitel, E.M.; Taillefert, M. Mechanistic investigation of Fe(III) oxide reduction by low molecular weight organic sulfur species. Geochim. Cosmochim. Acta 2017, 215, 173–188. [Google Scholar] [CrossRef]
Figure 1.
Cathodic striping square wave voltammetry (CSSWV) curves showing (a) accumulation effect in 9 nM methyl 3-mercaptopropionate (3-MPA) electrolyte solution; (b) effect of increasing concentration of the 3-MPA, and (c) calibration curves for the 3-MPA and Na2S, with insertion of CSSWV curves for increasing sulfide concentration in electrolyte solution. Experimental conditions: Ed = −0.2 V, A = 25 mV, f = 80 Hz, ta = 120 s.

Figure 2.
Effect of different deposition potentials, Ed = −0.2 V (red lines), and Ed = −0.4 V (blue lines) and different accumulation times for electrolyte solution containing 9 nM 3-MPA. Experimental conditions: A = 25 mV; f = 80 Hz.
Figure 2.
Effect of different deposition potentials, Ed = −0.2 V (red lines), and Ed = −0.4 V (blue lines) and different accumulation times for electrolyte solution containing 9 nM 3-MPA. Experimental conditions: A = 25 mV; f = 80 Hz.

Figure 3.
CSSWV curves of the solution containing 65.0 nM 3-MPA and 32.5 nM Na2S, recorded at the different deposition potentials with different accumulation times, as illustrated. Green solid (bold) line is recorded after purging the mixture solution with N2 when all added sulfide was stripped out. Experimental conditions: Ed = −0.2 and −0.4 V, ta = 60 and 120 s, A = 25 mV, f = 80 Hz.

Figure 4.
CSSWV curves recorded in the WS fraction of (a) three consecutive Spring 2016 aerosol samples (S1, S2, and S3). Red-solid line corresponds to CSSWV scan of the electrolyte containing 19.8 nM 3-MPA spiked with Na2S; (b) four consecutive Autumn 2016 aerosol samples (A1, A2, A3, A6); (c) effect of different deposition potential (Ed = −0.4 V) for Autumn samples A1, A2, A3, A6. ta = 120 s for a–c; (d) addition of the standard 3-MPA in Autumn sample A1, after the acidification and purging step, ta = 30 s. Please note that pH in this sample was readjusted to 10 after acidification, which influenced the peak position. The best response in samples S2 and A1 was obtained after 2× dilution of original WS aerosol fractions. These samples have the highest surface-active substance (SAS) content. Other experimental conditions: Ed = −0.2 V, A = 25 mV, f = 80 Hz.


Table 1.
Concentrations of reduced sulfur species (RSS), water-soluble organic carbon (WSOC), surface-active substances (SAS), and sulfate (SO42−) in the selected Spring and Autumn 2016 aerosol samples, whose electrochemical characterization is shown in Figure 4.
Table 1.
Concentrations of reduced sulfur species (RSS), water-soluble organic carbon (WSOC), surface-active substances (SAS), and sulfate (SO42−) in the selected Spring and Autumn 2016 aerosol samples, whose electrochemical characterization is shown in Figure 4.
| Aerosol Sample | Sampling Period | WSOC (µg m−3) | SAS eq. T-X-100 (µg m−3) | RSS (ng m−3) Mercapto Type | RSS (ng m−3) Inorganic Type | SO42− (µg m−3) |
|---|---|---|---|---|---|---|
| S1 | 29.03–31.03.2016. | 2.36 | 0.18 | 2.62 | - | 3.00 |
| S2 | 31.03–02.04.2016. | 2.22 | 0.30 | 9.42 | - | 2.33 |
| S3 | 02.04–04.04.2016. | 2.20 | 0.23 | 3.68 | - | 4.22 |
| A1 | 08.10–10.08.2016. | 1.84 | 0.23 | 2.23 | 0.26 | 2.03 |
| A2 | 10.10–12.08.2016. | 1.18 | 0.21 | 1.46 | 0.05 | 1.58 |
| A3 | 12.10–14.10.2016. | 0.97 | 0.21 | 1.00 | 0.04 | 1.77 |
| A6 | 18.10–20.10.2016. | 1.34 | 0.23 | 1.02 | 0.03 | 1.50 |
© 2019 by the authors. Licensee MDPI, Basel, Switzerland. This article is an open access article distributed under the terms and conditions of the Creative Commons Attribution (CC BY) license (http://creativecommons.org/licenses/by/4.0/).
Share and Cite
MDPI and ACS Style
Cvitešić Kušan, A.; Frka, S.; Ciglenečki, I. Electrochemical Evidence of non-Volatile Reduced Sulfur Species in Water-Soluble Fraction of Fine Marine Aerosols. Atmosphere 2019, 10, 674. https://doi.org/10.3390/atmos10110674
AMA Style
Cvitešić Kušan A, Frka S, Ciglenečki I. Electrochemical Evidence of non-Volatile Reduced Sulfur Species in Water-Soluble Fraction of Fine Marine Aerosols. Atmosphere. 2019; 10(11):674. https://doi.org/10.3390/atmos10110674
Chicago/Turabian StyleCvitešić Kušan, Ana, Sanja Frka, and Irena Ciglenečki. 2019. "Electrochemical Evidence of non-Volatile Reduced Sulfur Species in Water-Soluble Fraction of Fine Marine Aerosols" Atmosphere 10, no. 11: 674. https://doi.org/10.3390/atmos10110674
Note that from the first issue of 2016, this journal uses article numbers instead of page numbers. See further details here.