Article

Study of Galactic Cosmic-Ray Flux Modulation by Interplanetary Plasma Structures for the Evaluation of Space Instrument Performance and Space Weather Science Investigations

1
Department of Pure and Applied Sciences, University of Urbino “Carlo Bo”, Via S. Chiara 27, 61029 Urbino, Italy
2
National Institute for Nuclear Physics, Section in Florence, Via B. Rossi 1, 50019 Sesto Fiorentino, Italy
3
National Institute for Astrophysics, Astrophysical Observatory of Turin, Via Osservatorio 20, 10025 Pino Torinese, Italy
*
Authors to whom correspondence should be addressed.
Atmosphere 2019, 10(12), 749; https://doi.org/10.3390/atmos10120749
Submission received: 23 October 2019 / Revised: 21 November 2019 / Accepted: 21 November 2019 / Published: 28 November 2019

Abstract

:
The role of high-energy particles in limiting the performance of on-board instruments was studied for the European Space Agency (ESA) Laser Interferometer Space Antenna (LISA) Pathfinder (LPF) and ESA/National Astronautics and Space Administration Solar Orbiter missions. Particle detectors (PD) placed on board the LPF spacecraft allowed for testing the reliability of pre-launch predictions of galactic cosmic-ray (GCR) energy spectra and for studying the modulation of proton and helium overall flux above 70 MeV n 1 on a day-by-day basis. GCR flux variations up to approximately 15% in less than a month were observed with LPF orbiting around the Lagrange point L1 between 2016 and 2017. These variations appeared barely detected or undetected in neutron monitors. In this work the LPF data and contemporaneous observations carried out with the magnetic spectrometer AMS-02 experiment are considered to show the effects of GCR flux short-term variations with respect to monthly averaged measurements. Moreover, it is shown that subsequent large-scale interplanetary structures cause a continuous modulation of GCR fluxes. As a result, small Forbush decreases cannot be considered good proxies for the transit of interplanetary coronal mass ejections and for geomagnetic storm forecasting.

1. Introduction

The European Space Agency (ESA) precursor mission of the Laser Interferometer Space Antenna (LISA), LISA Pathfinder (LPF) [1,2,3,4], was aimed to test the performance of the instruments that will be placed on board LISA for low-frequency gravitational wave detection in space [5]. LPF orbited around the first Sun-Earth Lagrangian point (L1) at 1.5 million km from Earth between the end of January 2016 and July 2017. The spacecraft (S/C) orbit was quasi-elliptical with 5 × 10 5 km and 8 × 10 5 km minor and major axes, respectively.
LPF allowed for an interferometric measurement of the residual acceleration of the order of femto-g between free-falling test masses: two cubes of gold and platinum of 4.6 cm side placed at 38 cm distance. The test masses were surrounded by capacitive sensors for positioning and actuation. Due to the high LPF sensitivity, it was mandatory to monitor any spurious force acting directly on the test masses. Galactic cosmic rays (GCRs) and solar energetic particles (SEPs) with energies >100 MeV n 1 penetrated about 13.8 g cm 2 of material surrounding the test masses. Monte Carlo simulations of the test-mass net charging and shot noise associated with the charging process were carried out before the mission launch occurred on 3 December 2015 [6,7,8,9]. Predictions of GCR energy spectra and SEP event occurrence at the time LPF was supposed to be sent into space were carried out based on the expected solar modulation (see http://www.sidc.be/silso/home). The solar cycle causes long-term variations of the GCR flux (>1 year) while short-term variations (<1 month) are ascribable to the passage of large interplanetary structures [10]. The proton and helium nuclei (90% and 8%, respectively, of the GCR bulk in particle numbers to the total number) were monitored on board LPF with a particle detector (PD) mounted behind the solar panels with its viewing axis directed towards the Sun. The PD consisted of two silicon wafers of 1.40 × 1.05 cm 2 area and 300 μ m thickness, placed in a telescopic arrangement at 2 cm distance. For isotropic incidence of particles with energies >100 MeV n 1 on each of the two silicon layers (single counts mode), the geometrical factor (GF) of the instrument was 18 cm 2 sr. The GF was about 0.9 cm 2 sr for particles crossing both silicon wafers (coincidence mode). A shielding copper box of 6.4 mm thickness surrounded the silicon layers by stopping particles with energies <70 MeV n 1 before reaching the active part of the instrument. This conservative choice was made in order not to underestimate the overall incident particle flux charging the test masses. The PD returned single counts at 0.067 Hz to the telemetry. Ionization energy losses in the rear silicon layer were stored in histograms every 600 seconds for particles in coincidence mode. The instrument maximum allowed counting rate was 6500 counts s 1 corresponding to a proton fluence of 10 8 particles cm 2 above 100 MeV n 1 , while in coincidence mode 5 × 10 3 energy deposits per second was the saturation limit [11]. No SEP events overcoming the GCR flux above 70 MeV n 1 were observed during the time LPF remained in orbit. The LPF PD 15-s proton-dominated counts were hourly averaged to set the statistical uncertainty of each data point due to fluctuations in the incident particle flux to 1%.
The LPF observations [12,13] are used here to study the role of GCR short-term variations with respect to proton differential flux measurements averaged during different Bartels rotation (BR), i.e., 27-day Sun periods since 1832 February 8. This approach was adopted to reduce the influence of the solar modulation decrease during the mission elapsed time. Data from the AMS-02 experiment on board the international space station (ISS) are also considered for comparison [14]. The characteristics of both recurrent and non-recurrent GCR flux variations are investigated. Among non-recurrent variations, it is focused on Forbush decreases (FDs), sudden drops of the GCR flux intensity due to the passage of interplanetary coronal mass ejections (ICMEs) and shocks [15,16,17].
A comparison among the GCR energy spectra predictions for LPF and the AMS-02 observations is possible, because LPF was only at a distance of 1.5 million km from Earth (1.01 AU) and <1 deg from the ecliptic, and it has been shown that the GCR flux changes by 3% AU 1 and 0.33% ± 0.04% deg 1 [18].
The role of GCR flux short-term variations will be taken into account to study the performance of LISA and other space missions of similar sensitivity carrying PD for in situ monitoring of the overall flux of galactic and solar cosmic rays. LISA will consist of three S/C arranged in a triangular formation of 2.5 × 10 6 km side inclined by 60 degrees to the ecliptic. The LISA S/C formation will orbit the Sun at 50 × 10 6 km behind Earth towards the fifth Lagrange point (L5). The LISA S/C constellation will rotate around its center of mass and around the Sun every year, the three S/C will cover < 2 degrees in longitude and will remain within 1 degree in latitude from ecliptic representing a natural observatory of SEPs and GCRs at small and large angles in longitude with respect to Earth detectors.
A pre-launch environmental study was also carried out for the Mid-Infrared ELT Imager and Spectrograph (METIS) on board the Solar Orbiter [19], an ESA/National Astronautics and Space Administration (NASA) mission scheduled to launch in February 2020. The Solar Orbiter S/C will reach a minimum distance from the Sun of 0.28 AU and a maximum inclination with respect to the equator of the Sun of 25 degrees after a 7-year mission and 34 degrees after 9.5 years. The dose absorbed by the lenses of the METIS polarimeter in 10 years of extended mission was estimated in [20].
This manuscript is arranged as follows: in Section 2 the pre-launch work carried out for LPF and METIS is described. In Section 3 short-term variations of the proton-dominated observations carried out with LPF are studied in comparison to proton differential flux measurements averaged over each BR from the number 2491 through the number 2505. Finally, in Section 4 it is shown that FDs characterized by intensities <10% in space are unsatisfactory proxies for the transit of associated ICMEs due to the GCR flux modulation caused by the passage of other large-scale interplanetary structures. These small events can be barely detected with neutron monitors (NMs).

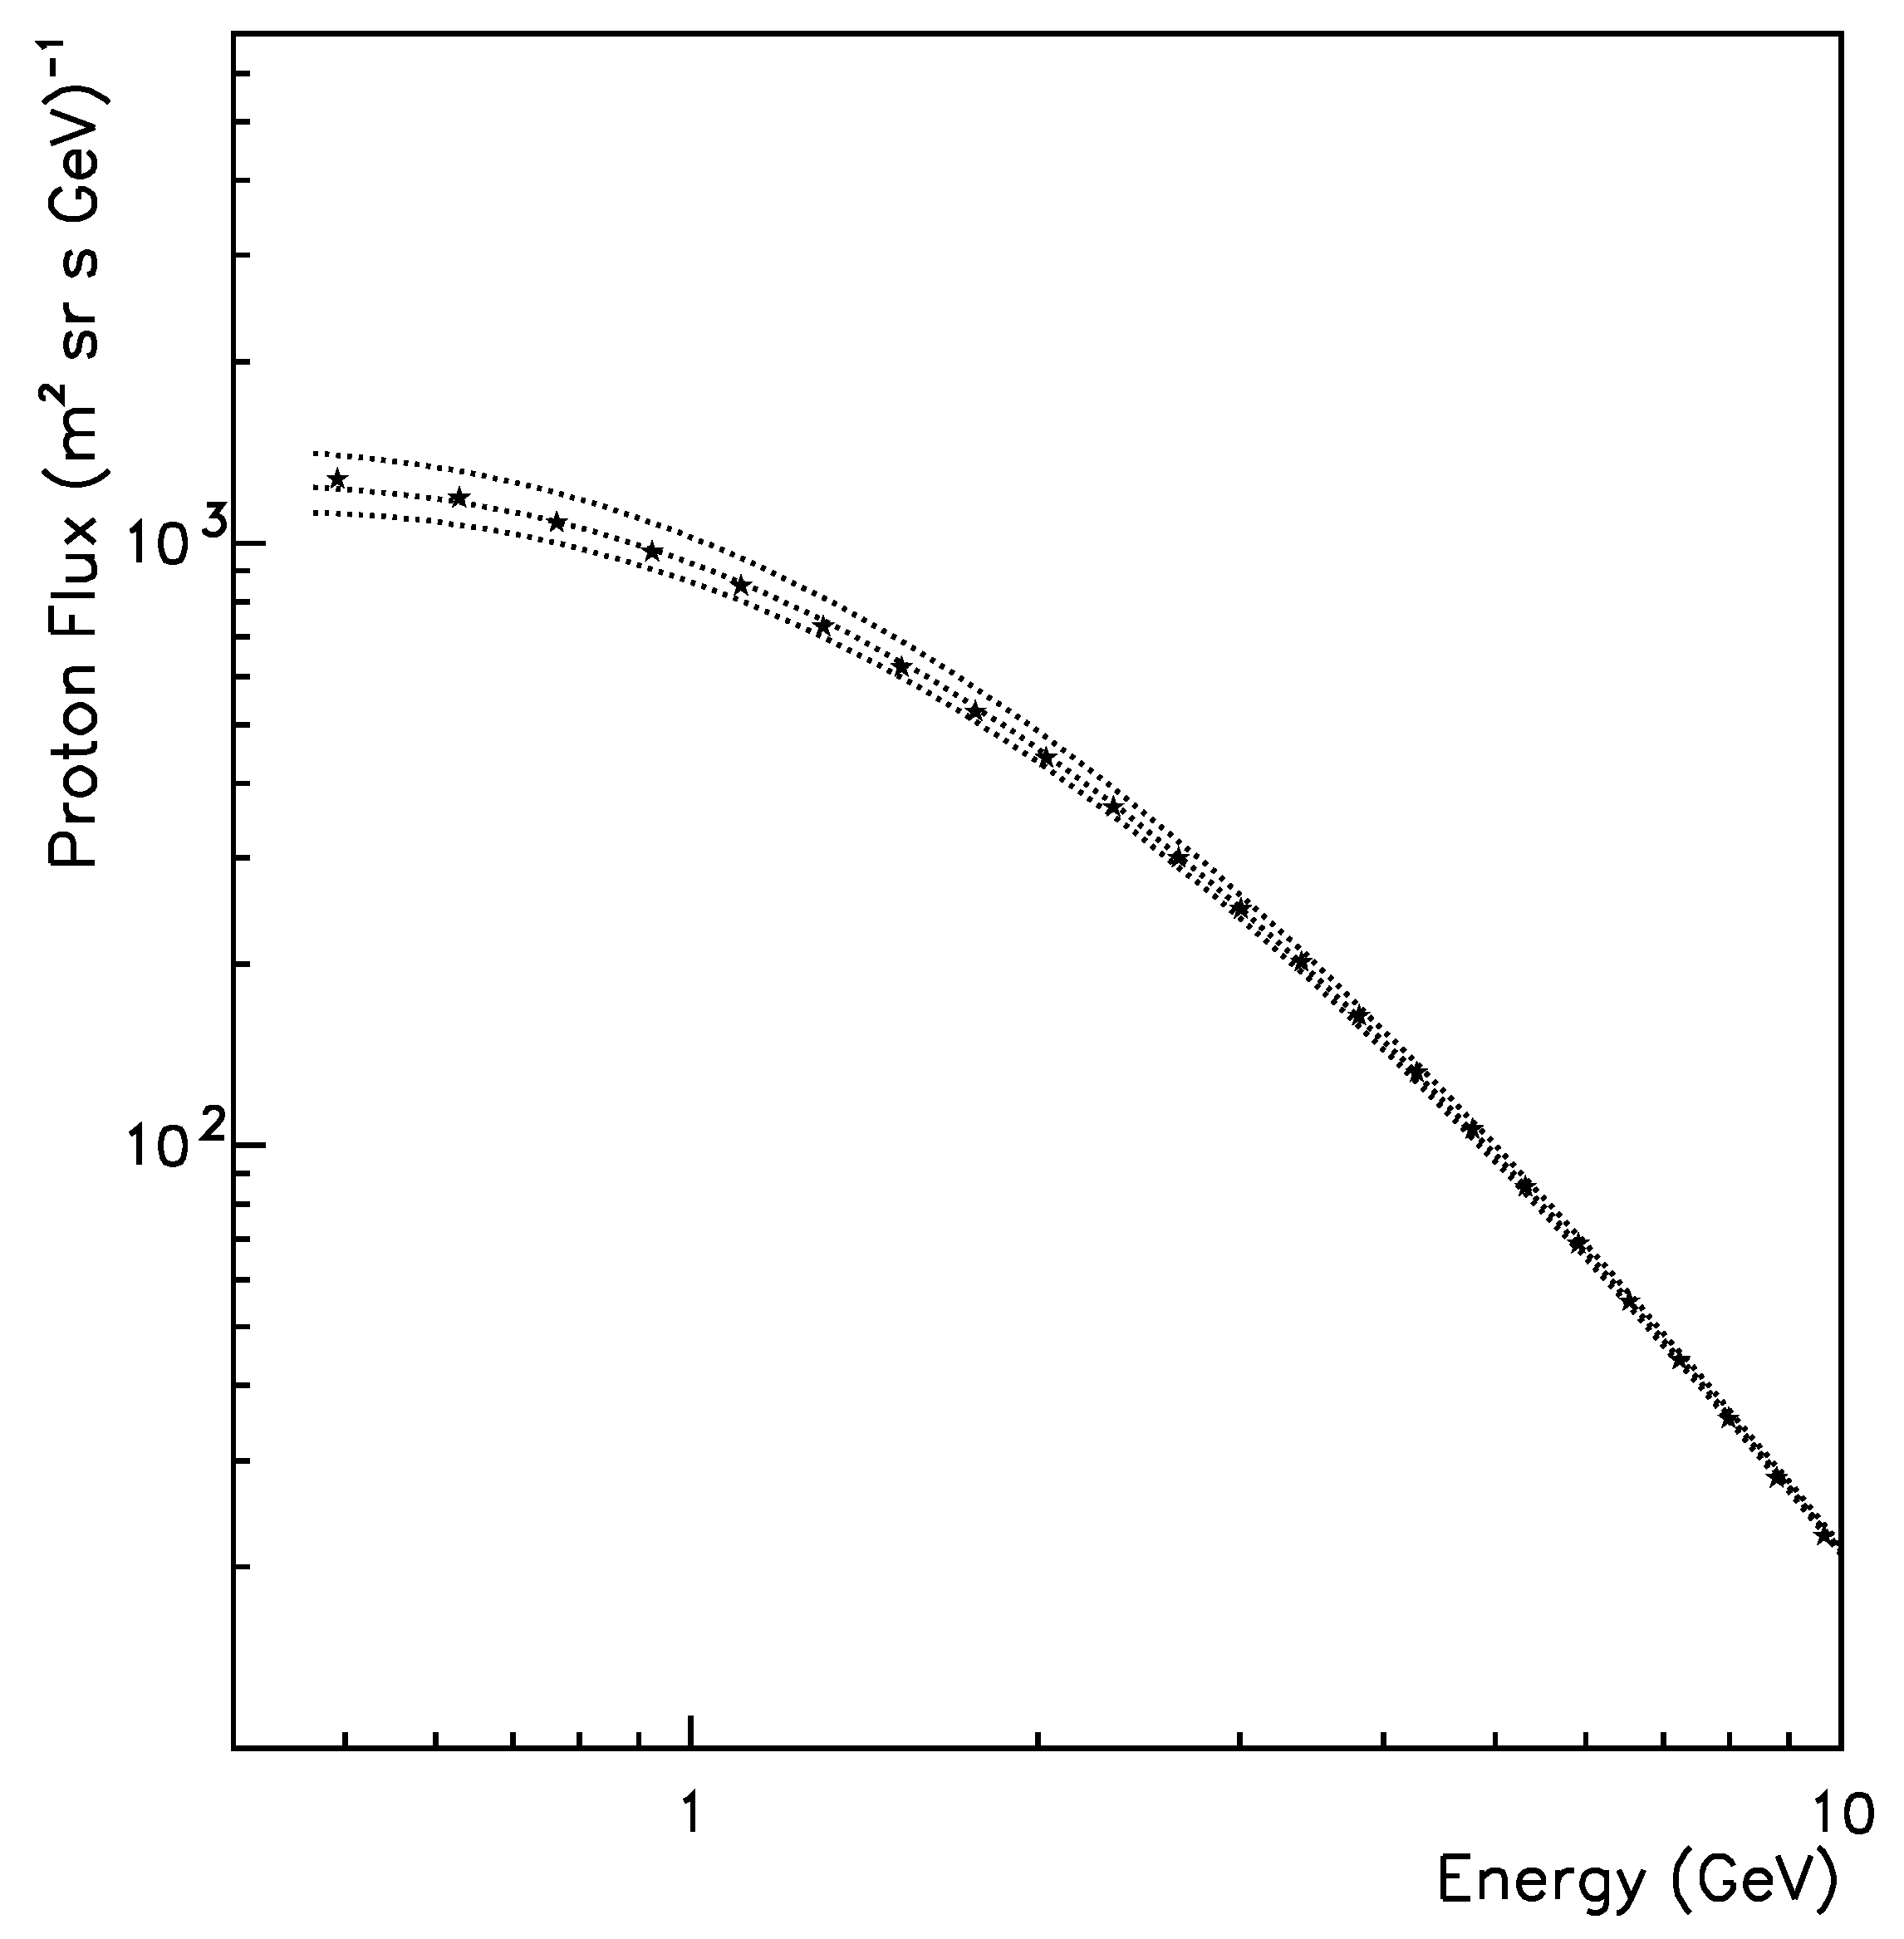
2. LPF and METIS Pre-launch Environmental Studies

The accuracy in estimating the performance of instruments before space missions launch mainly depends on the capability of carrying out good GCR energy spectra and SEP occurrence predictions for the period the missions under consideration are supposed to remain in orbit. In the case of LPF it was focused on the role of particles of galactic and solar origin charging the test masses. The LPF test-mass net charging and shot noise associated with the charging process were estimated in Grimani et al. [9]. Measurements are reported in Armano et al. [21]. The symmetric model in the force-field approximation by Gleeson and Axford [22] (G&A) was used for GCR energy spectra predictions. This model allows for the estimate of cosmic-ray energy spectra in the inner heliosphere at the distance r from the Sun, at the time t, by assuming time-independent interstellar (IS) energy spectra and a solar modulation parameter, ϕ , that can be associated with the energy loss of particles reaching the point of observation from the IS medium. The reliability of this model during positive polarity epochs of the Global Solar Magnetic Field (GSMF) was demonstrated by the BESS experiment data [23]. During negative polarity periods, energy-dependent corrections, due to the GCR drift process in the heliosphere, must be added to the model by G&A [24]. In the present work the IS GCR energy spectra by Burger et al. [25] have been adopted. The same were used to set the solar modulation parameter appearing in http://cosmicrays.oulu.fi/phi/Phi_mon.txt. Consistently, the solar modulation parameter for the LPF predictions have been retrieved from the same database. The Voyager 1 measured the IS GCR energy spectra for the first time in 2013 below 1 GeV n 1 [26]. The adoption of different IS spectra is possible, provided that the solar modulation parameter is properly set by comparing model and data gathered during different periods of solar modulation and solar polarity.
LPF remained in orbit in 2016 and 2017 during the descending phase of the solar cycle N. 24, the weakest solar cycle of the last hundred years (see http://www.sidc.be/silso/datafiles). This period of time was characterized by a positive polarity period of the Sun. Minimum and maximum proton energy spectra predictions for the beginning (BR 2490; 6 February 2016–3 March 2016) and the end (BR 2508; 6 June 2017–2 July 2017) of the LPF mission are reported in Figure 1 as dot-dashed and dotted lines, respectively. These estimates were carried out with the G&A model after the end of the mission when the solar modulation was known for the whole period between 2016 and 2017. The observed monthly averaged sunspot number decreased from 56 through 18 from February 2016 through July 2017. The monthly solar modulation parameter varied from 468 MV c 1 through 323 MV c 1 during the same period. The predicted energy spectra are compared in Figure 1 to the observations of the AMS-02 experiment gathered during the BR 2490 above 450 MeV. No AMS-02 data have been published for the BR 2508 up to present time. Predictions at the beginning of the LPF mission slightly overestimate observations.
The Nymmik model [27,28] was used to estimate the occurrence of SEP events with fluences ranging between 10 6 and 10 11 protons cm 2 for particle energies >30 MeV. In this model the number of expected SEP events (NSEPs) is determined on the basis of the predictions of the mean yearly sunspot number (NSS; NSEPs = 0.0694 NSS), assuming that the SEP fluence distribution follows a power-law trend with an exponential decrease for large fluences as was observed by Nymmik for the solar cycles 20–22. The SEP event occurrence during the solar cycles 22–23 between 1986 and 2004 was studied to test the reliability of the Nymmik model predictions in [29]. The Nymmik model was found to overestimate the SEP occurrence in 1987, 1988, 1990, 1992, 1993, 1994, 1995, 1996, 1999 (observed-to-expected SEP event ratio <1) and to underestimate the same in 1986, 1989, 1991, 1997, 1998, 2000, 2001, 2002, 2003, 2004 (observed-to-expected SEP event ratio >1). The observed-to-expected SEP event ratio was always <2 except in 1986 (3.3), 2001 (2.3) and 2004 (2.1). According to the Nymmik model between 1 and 3 SEP events every 6 months were expected during the LPF mission based on the predicted minimum and maximum SSN. None have been observed.
The G&A and Nymmik models were also used to estimate the dose that will be absorbed by the cerium-treated lenses of the polarimeter of the METIS coronagraph on board the Solar Orbiter. Hadrons above 10 MeV n 1 and electrons above 1 MeV will traverse approximately 1.2 g cm 2 of material penetrating the polarimeter lenses. In Telloni et al. [20] minimum, average, and maximum dose estimates have been carried out by considering the contribution of particles of galactic, interplanetary, and solar origin during minimum and maximum solar cycles of the last 100 years. The average dose absorbed by the polarimeter during the extended mission has been estimated to be 2000 Gy. However, a dose ranging between 100 Gy year 1 and 800 Gy year 1 may be absorbed by the polarimeter in case of minimum and maximum SEP event occurrence.
The loss of transmittance of the polarimeter lenses has been studied with laboratory tests with sources of γ radiation and particle beams. Protons in the range 7–50 MeV causing a dose absorption in the lenses of 1.4 × 10 18 MeV m 2 s 1 , 0.05 MeV electrons with a fluence of 8.8 × 10 21 m 2 illuminating the lenses optical glass for 20.6 h and 10 6 Gy of gamma radiation of 1.17 and 1.33 MeV energies from a 60 Co source generated a similar loss of transmittance of less than 10% for wavelengths ranging between 400 nm and 700 nm. Based on these tests, the estimated average dose absorption during the Solar Orbiter mission lifetime is expected to cause a negligible loss of lenses transmittance. Moreover, during the first three years of the Solar Orbiter mission the dose received by the METIS polarimeter will remain <100 Gy year 1 [20] because a very low solar modulation and a positive polarity of the GSMF are expected for the period (see http://www.sidc.be/silso/home). For the remaining part of the mission, dose calculations will be updated in case of intense SEP event occurrence. The performance of the METIS visible and ultraviolet detectors traversed by a high cosmic-ray flux is presently under study.

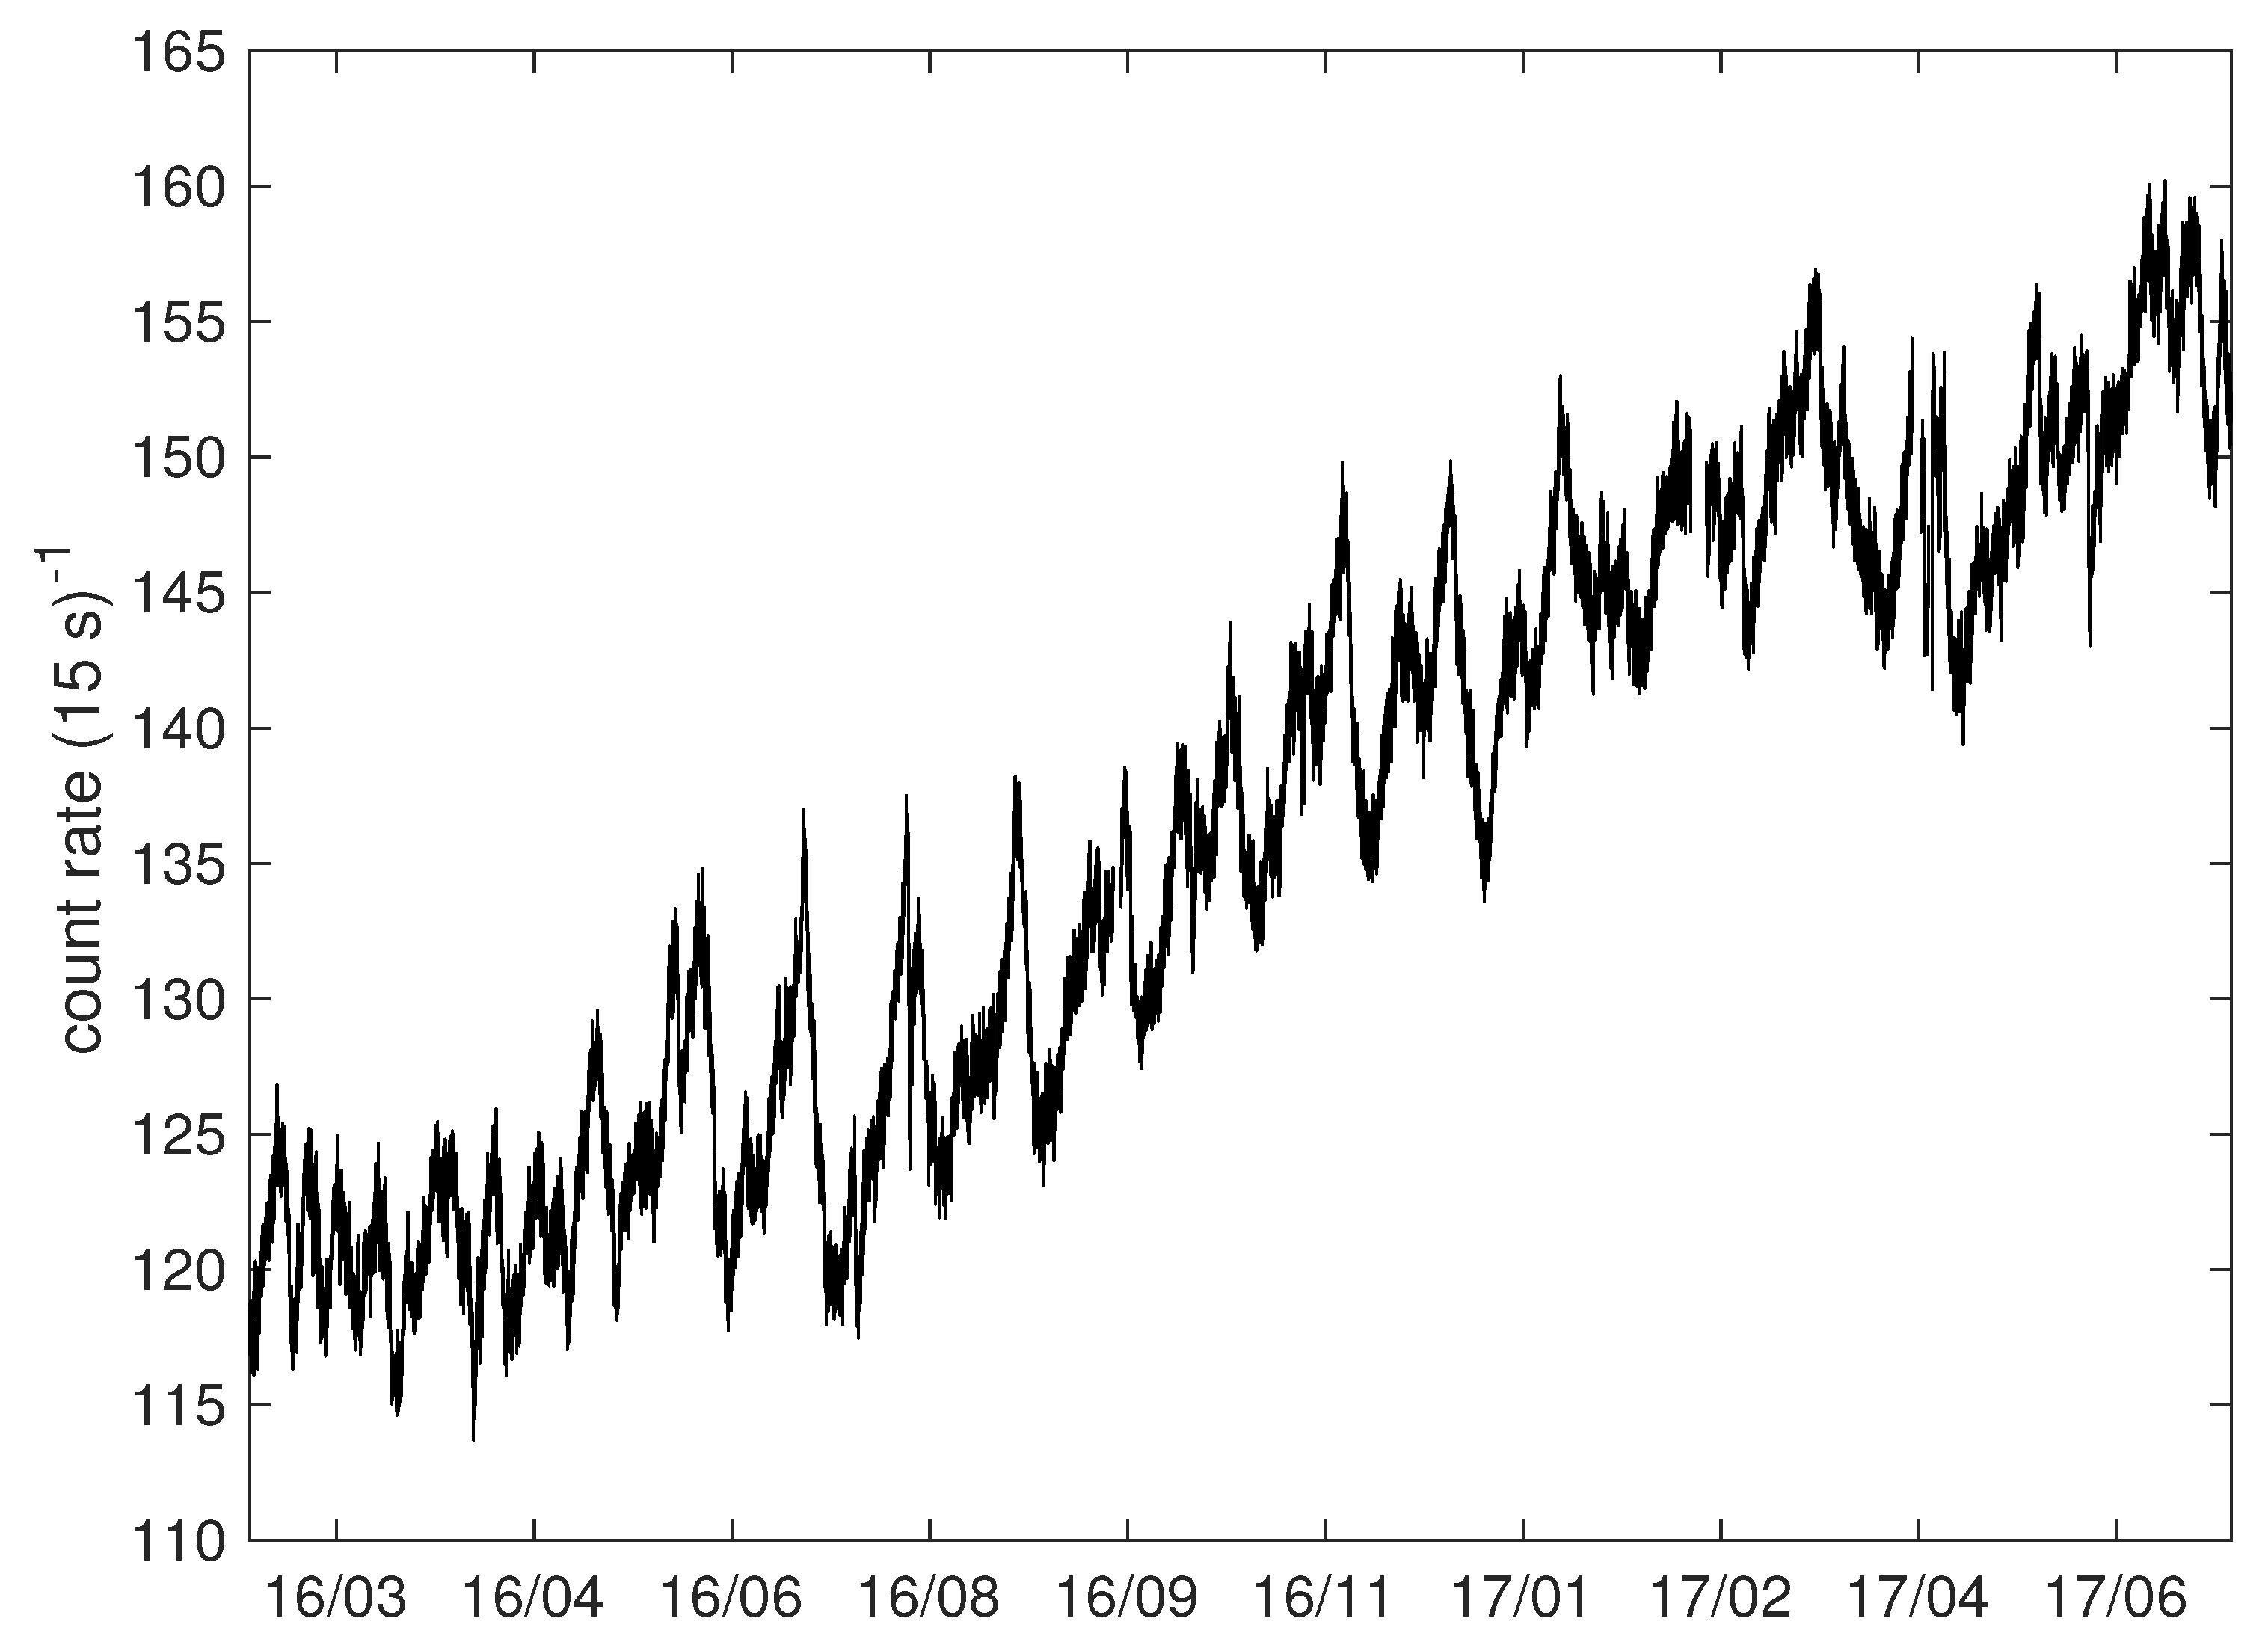
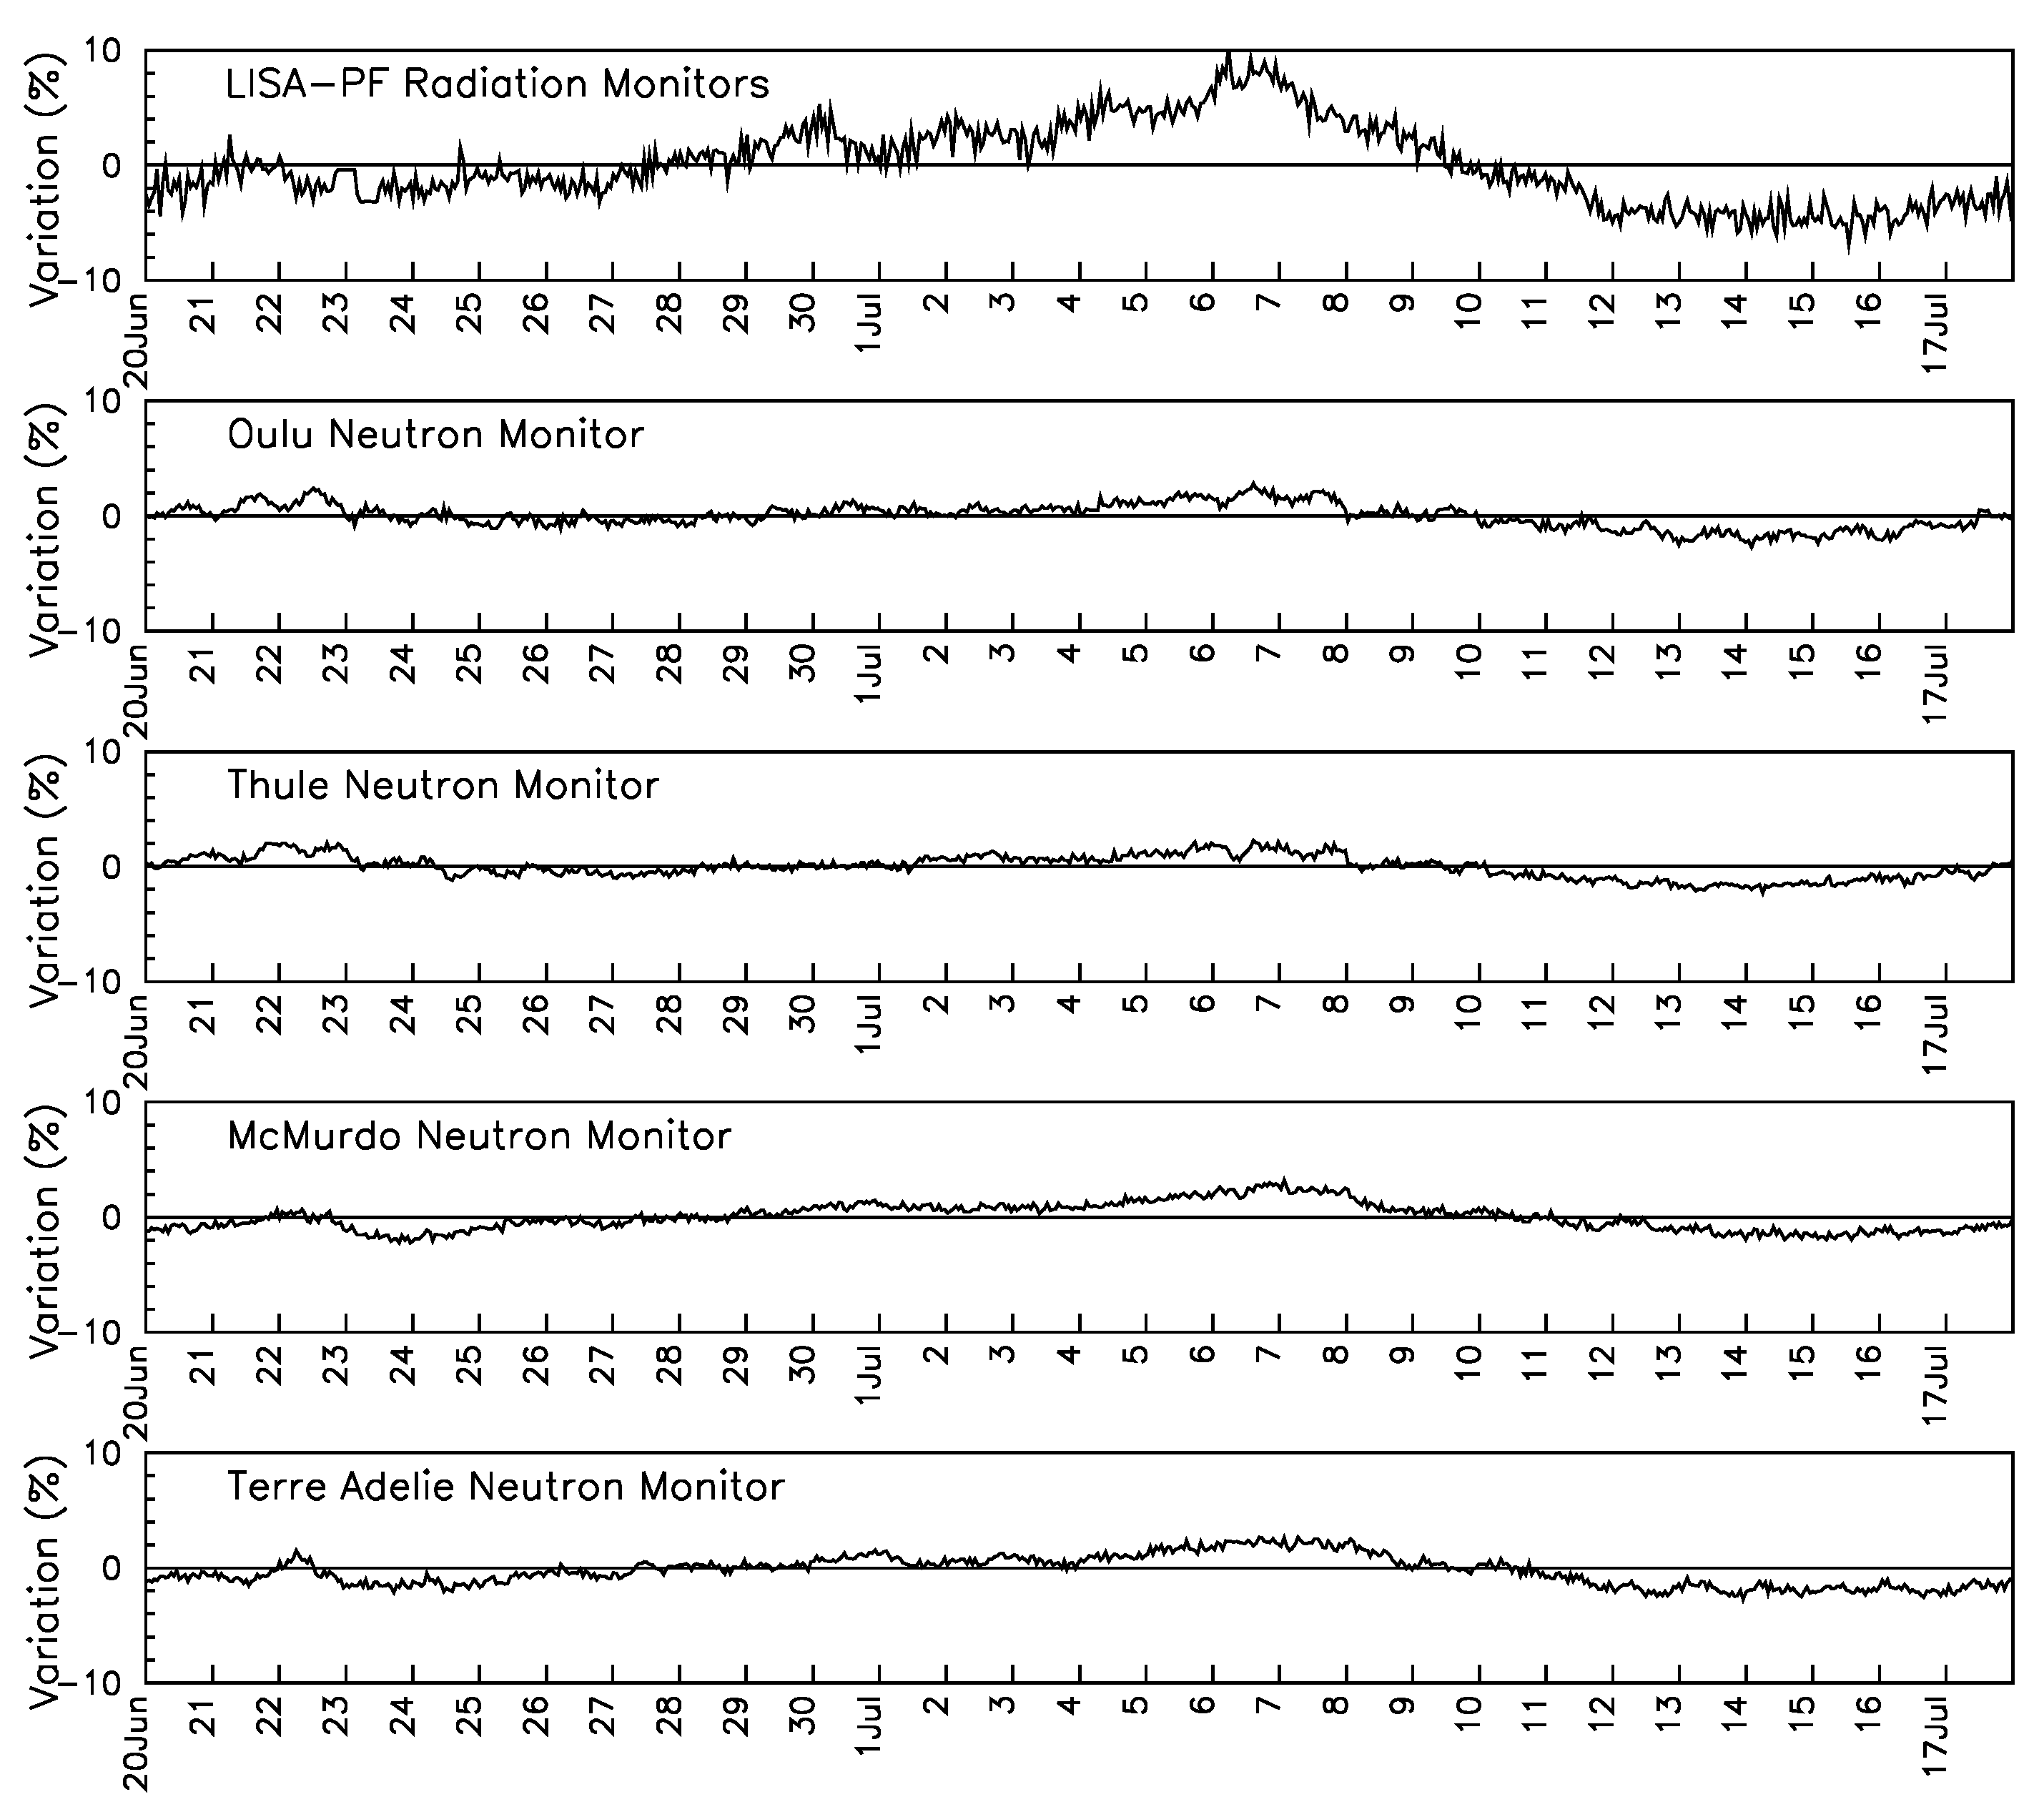
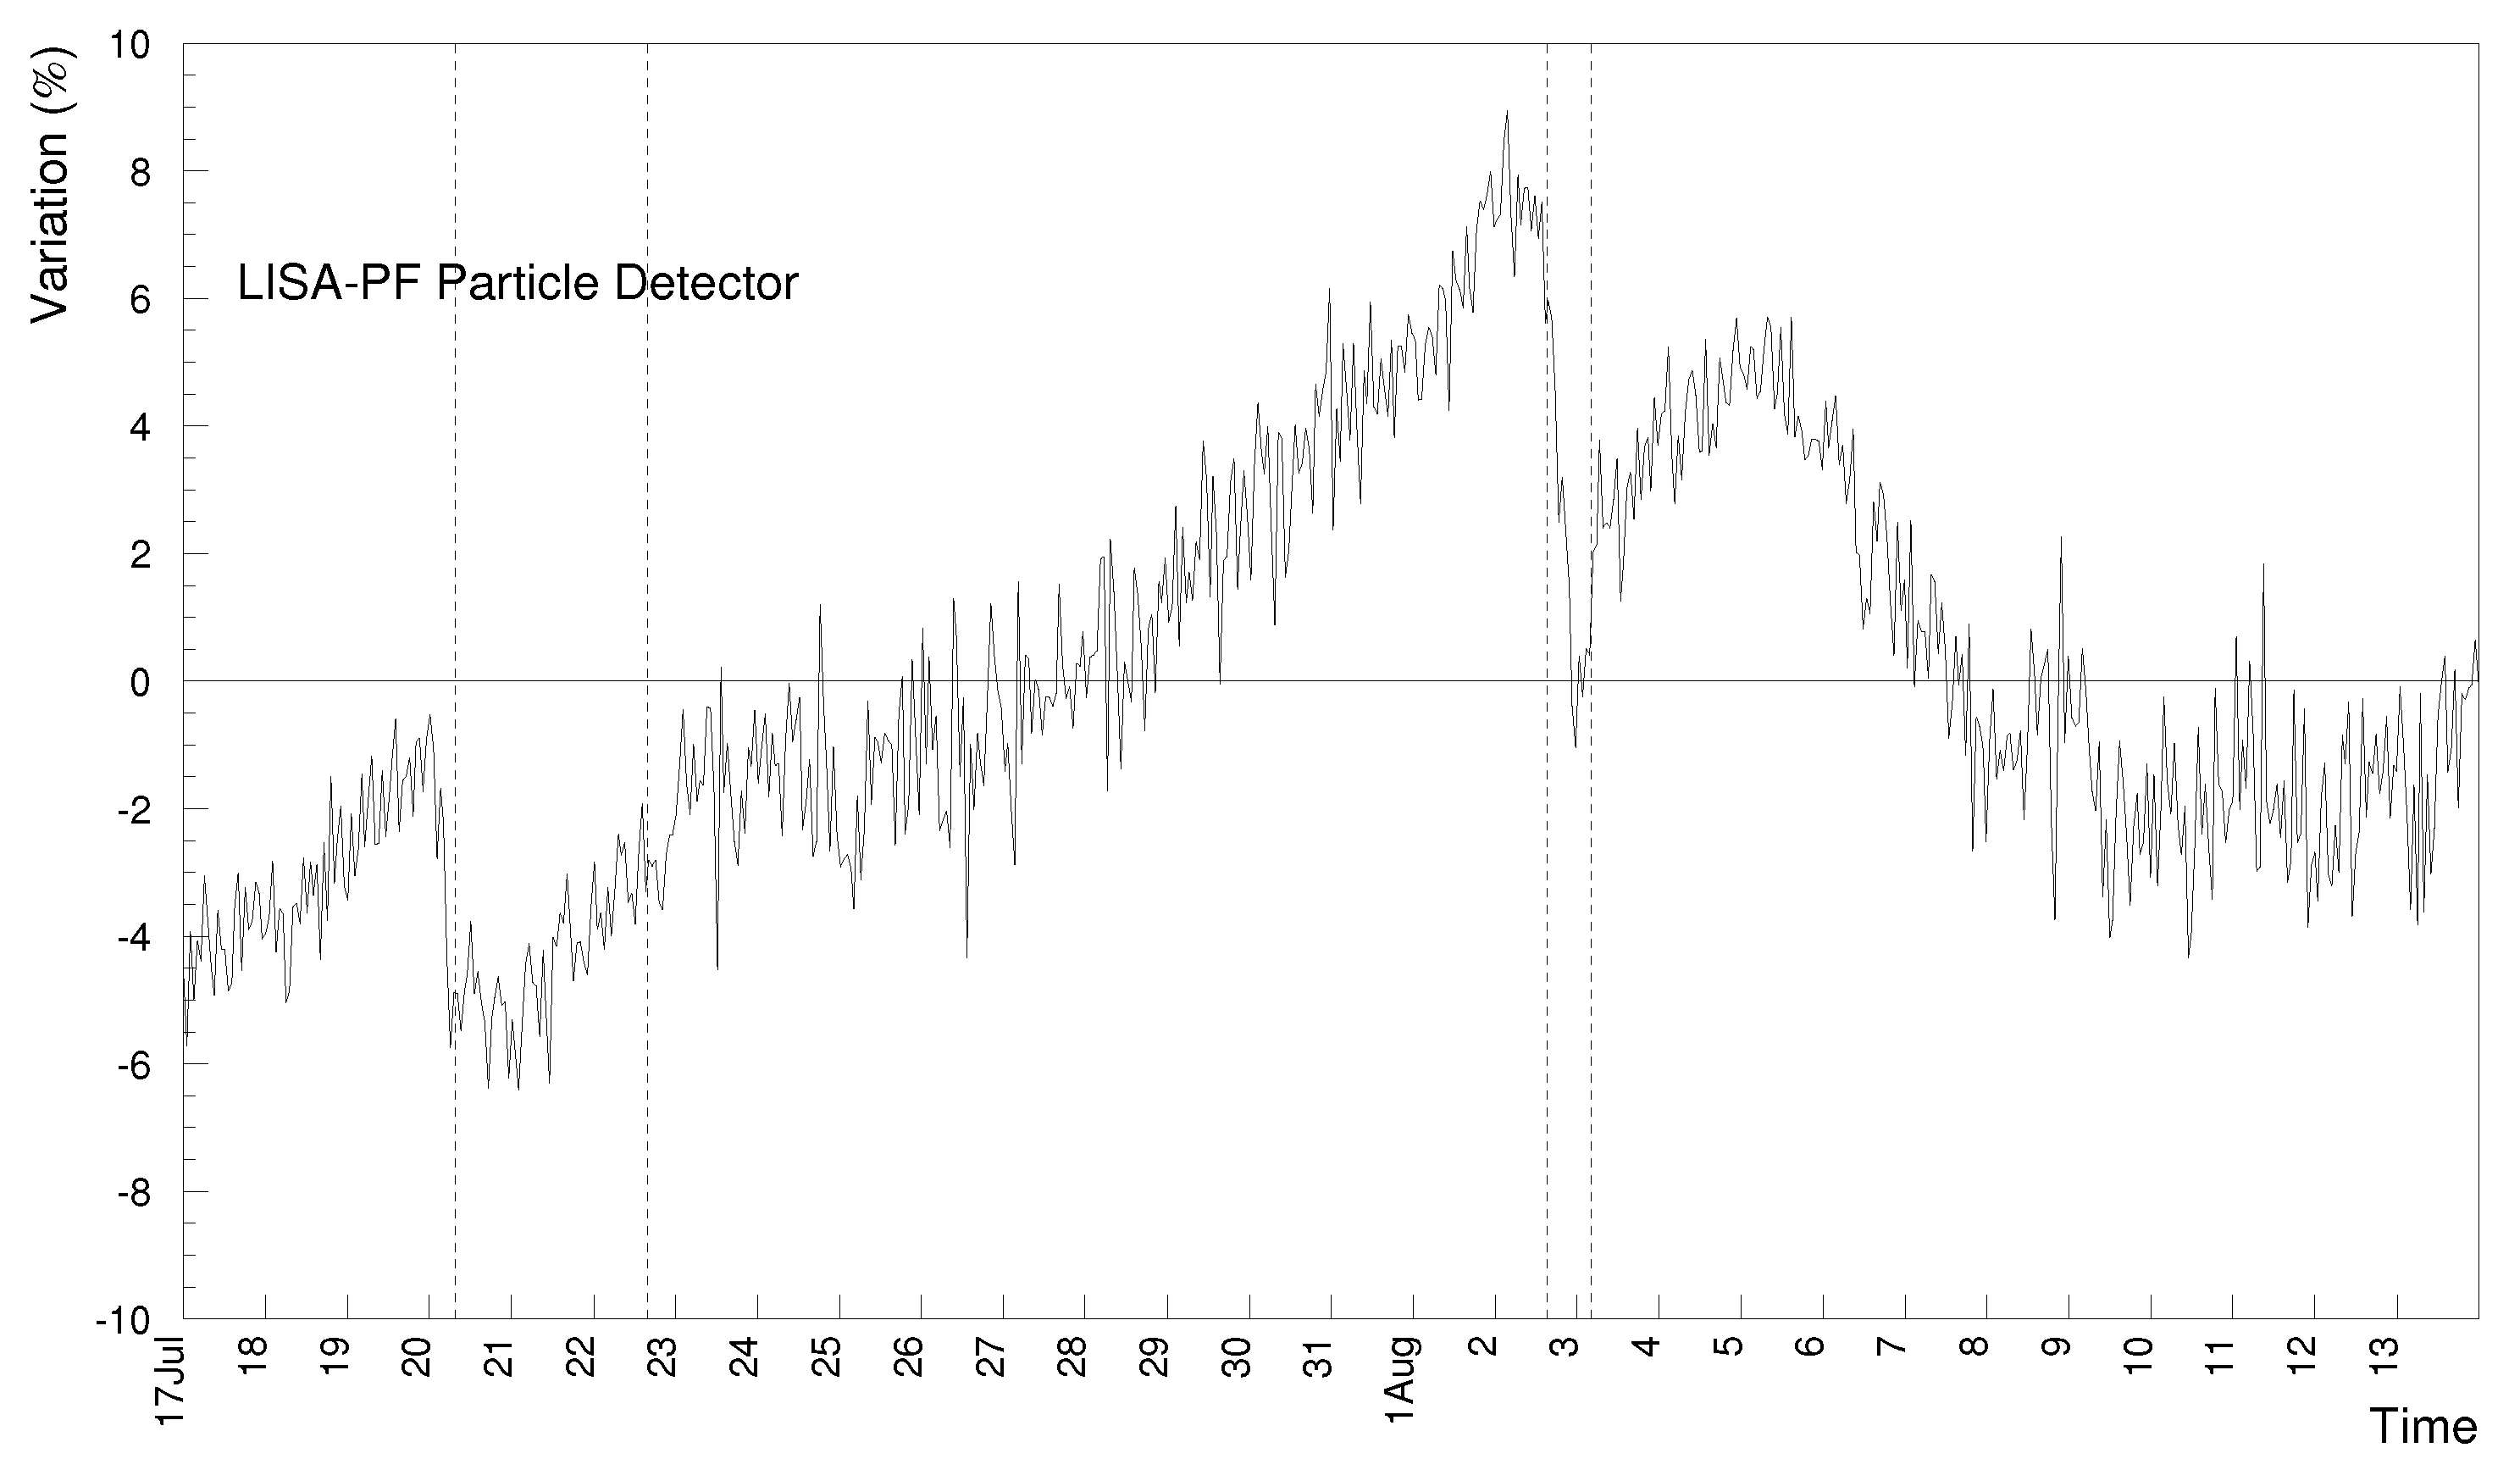
3. GCR Flux Long and Short-Term Variations Observed with LPF

The years 2016 and 2017 were characterized by a low solar modulation and the presence of near-equatorial coronal holes and equatorward extensions of polar coronal holes (see https://sdo.gsfc.nasa.gov/data/aiahmi/). In Figure 2, the complete set of cosmic-ray data gathered with the PD on board LPF is shown. The increasing trend of the data is due to the decreasing solar modulation during the LPF mission [30]. Observations are also characterized by the presence of 45 recurrent variations >2 days, 3 FDs and 23 non-recurrent variations <2 days [12,13]. The commencement of each recurrent depression was set at the beginning of each continuous decrease of the count rate observed for more than 12 h. Depressions lasting more than 1 day and amplitude >1.5% were considered. Recurrent GCR flux depressions presented the same periodicities of the Sun rotation and higher harmonics and appeared associated, in most cases, with the transit of high-speed solar wind streams and corotating interaction regions. FDs were detected at the passage of ICMEs while other, non-recurrent GCR flux depressions shorter than 2 days were mainly observed at heliospheric current sheet crossing (HCSC). Finally, non-recurrent small enhancements <2 days were observed at plasma compression regions between subsequent corotating high-speed solar wind streams. To select <2 days GCR count rate depressions and peaks, variations of duration >0.75 days (18 h) with intensities >2% were studied in order to set the statistical significance of the selection criterion to 2 σ , given the 1% statistical uncertainty on hourly averaged PD single count data. In Table 1, minimum and maximum GCR flux percent changes with respect to average values observed during each indicated BR are shown. In Figure 3, Figure 4, Figure 5, Figure 6, Figure 7 and Figure 8 the LPF PD observations gathered during the BR 2495, 2497 and 2502 are compared to contemporaneous solar wind parameters and high-latitude hourly averaged NM observations. Figure 3, Figure 4 and Figure 5 indicate the evolution of the GCR flux intensity profile with respect to those of the interplanetary magnetic field negative x component (−B x ) in the Geocentric Solar Ecliptic (GSE) coordinate system, the magnetic field intensity and solar wind bulk speed. It is possible to notice that the GCR flux intensity and the solar wind speed appear anticorrelated.
In Figure 6, Figure 7 and Figure 8 it can be observed that polar NM observations vary by less than 2% revealing the energy dependence of GCR short-term variations and making simple particle detectors in space optimum instruments to follow in situ the dynamics of individual short-term variations (see also [13]). The AMS-02 experiment proton energy differential flux data averaged over each BR present experimental errors on each data point ranging from 5% at hundreds of MeV through 2% above 100 GeV. Based on the LPF observations between 2016 and 2017, individual interplanetary structures modulated the GCR flux at 1 AU by approximately ±10%. Therefore, GCR short-term modulations must be properly taken into account, in addition to experimental data errors, for precise instrument performance estimates in space. In Figure 9 the AMS-02 proton data (black stars) gathered during the BR 2496 characterized by a solar modulation parameter of 452 MV c 1 are shown [14].
Top and bottom dotted curves in Figure 9 represent the maximum and minimum GCR proton fluxes during the BR 2496 observed on 2 August and 20 July, respectively, according to the observations carried out on board LPF (see Figure 10) and NMs placed at various latitudes. These findings will be taken into account for future mission performance studies.
Three weak FDs were observed on board LPF on 20 July 2016, 2 August 2016 and 27 May 2017 [12,13] at the passage of ICMEs. The first two events are shown in Figure 10, while the last one appears in Figure 11. The transit of ICMEs that generated the FDs are indicated in the figures with dashed lines (see http://www.srl.caltech.edu/ACE/ASC/DATA/level3/icmetable2.htm).

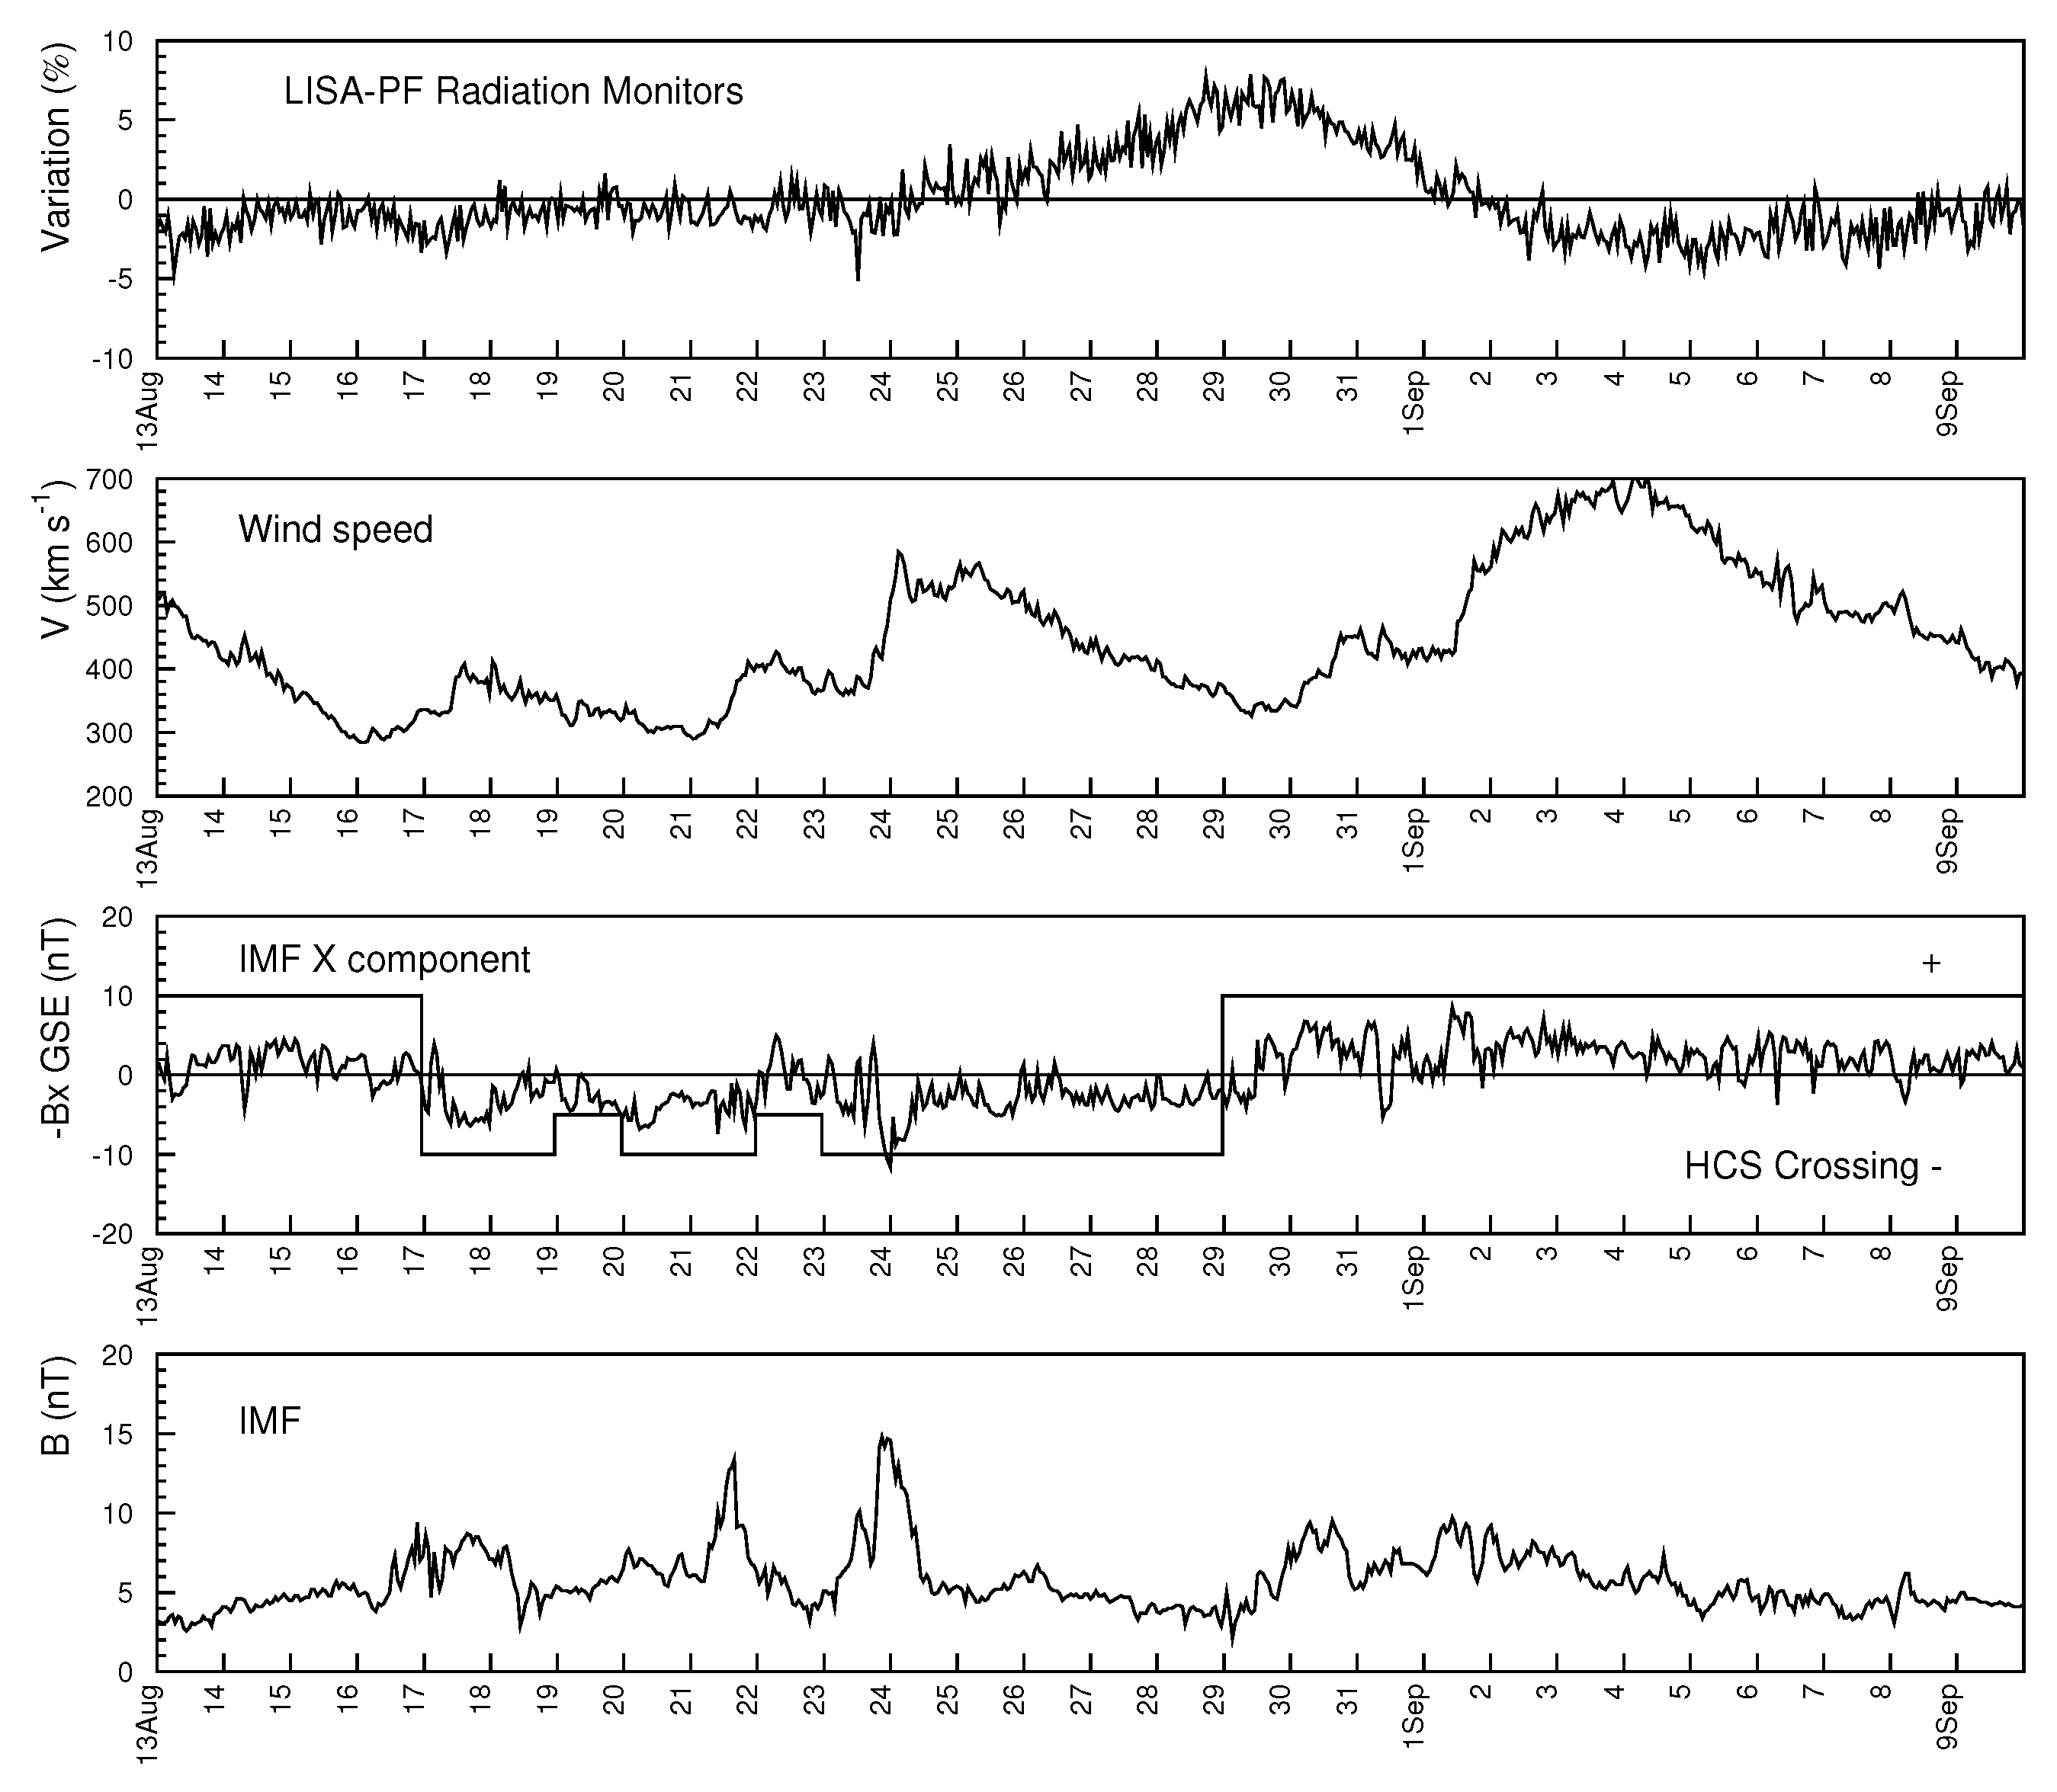
4. Weak FDs Observed in Space and Geomagnetic Storm Forecasting

A large perturbation of the terrestrial magnetic field is called a geomagnetic storm. Geomagnetic storms are associated with near-Earth passage of ICMEs and high-speed solar wind streams. The possibility of forecasting geomagnetic storms by means of FDs was discussed, for instance, in Badruddin and Kumar [31], Kane [32]. In Armano et al. [13] and references therein, it was pointed out that FDs were observed in space, for cosmic-ray particles with energies >70 MeV n 1 , when the interplanetary magnetic field intensity exceeded 20 nT while geomagnetic storms occurred only when the B z component of the interplanetary magnetic field was smaller than −20 nT. In particular, the three FDs observed with LPF were caused by very similar interplanetary magnetic field intensity enhancements ranging between 23 and 25 nT and presented maximum GCR flux decreases of 5.5%, 7%, and 9%. These same FDs produced depressions of 1%–3% in high-latitude NM measurements while low-latitude NMs presented 1% decrease, at most (see Figures 7 and 9 in [12]) because of the energy dependence of the FDs [12,13,33]. The most intense, complete FD observed on board LPF was the one dated 2 August 2016 (about 10% GCR flux decrease in 9 h). This event presented a minimum B z of −9.5 nT and therefore was not accompanied by a geomagnetic storm. Only the very modest FD dated 27 May 2017 (5.5% maximum GCR intensity decrease on board LPF with minimum B z of −22 nT) was associated with a geomagnetic storm characterized by a disturbance storm time index (Dst) of −122 nT. Conversely, the geomagnetic storm occurred on 13 October 2016 (Dst = −102 nT) was not accompanied by a FD in space, despite the interplanetary magnetic field intensity presented a maximum value of 23 nT (see Figure 4 in [13]). It can be concluded that the overall GCR flux is modulated by high-speed solar wind streams, ICME transit and other interplanetary processes that strongly affect the evolution of weak FDs. According to the LPF data, FDs showing in space maximum depressions <10% are suitable proxies for ICME tracking and geomagnetic storm forecasting only if the B z component of the IMF is <−20 nT and the cosmic-ray flux is not depressed by the transit of other interplanetary structures before the ICME passage. For completeness it is added that a fourth, incomplete FD was observed on board LPF on 16 July 2017 [34]. This event was characterized by a maximum percent decrease of the GCR flux of 18% in space, while polar and near-equatorial NM measurements presented percent decreases of 7% and 3%, respectively. This FD was associated with a moderate geomagnetic storm (Dst = −72 nT). The interplanetary magnetic field intensity reached a maximum value of 22 nT and B z a minimum value of −19 nT. It can be concluded that for this event the GCR flux was weakly suppressed by the passage of other interplanetary structures before the ICME transit. Unfortunately, the recovery phase of this FD extended beyond the mission end.

5. Conclusions

Pre-launch mission environmental studies were carried out to estimate the effects of cosmic rays of galactic and solar origin in charging the metal test masses on board the ESA LISA Pathfinder mission and the dose absorbed by the lenses of the polarimeter of the METIS coronagraph hosted on the ESA/NASA Solar Orbiter. A PD was placed on board LPF to monitor the overall flux of particles above 70 MeV n 1 incident on the S/C. A comparison between the LPF PD cosmic-ray data gathered between 2016 and 2017 around the Lagrange point L1 with those of the AMS-02 flown on the ISS allow for disentangling the role of long-term and short-term modulations of the GCR flux at 1 AU. It is found that short-term variations account for GCR flux intensity modulations of approximately ±15% with respect to average measurements carried out during individual BRs. These observations can be used to improve all those studies dedicated to the estimate of the performance of high-sensitivity instruments in space. It was also found that small intensity FDs (<10% GCR flux decrease at the FD dip) observed in space are suitable proxies for the passage of associated ICMEs and for geomagnetic storm forecasting only when the B z component of the interplanetary magnetic field is <−20 nT and the GCR flux is not depressed by the action of other large-scale interplanetary structures preceding the ICMEs associated with the FDs.

Author Contributions

Conceptualization, C.G.; methodology, C.G.; software, M.F.; validation, D.T., S.B., M.V.; formal analysis, C.G., D.T., A.C.; investigation, C.G., D.T.; resources; data curation, A.C. and M.F.; writing—original C.G.; writing—review and editing, all co-authors; visualization, M.F., S.B.; supervision, C.G.; project administration; funding acquisition.

Funding

D.T. was partially supported by the Italian Space Agency (ASI) under contract I/013/12/0.

Acknowledgments

The LISA Pathfinder data can be downloaded from https://www.cosmos.esa.int/web/lisa-pathfinder-archive/home. Sunspot number data were gathered from http://www.sidc.be/silso/home. Data from ACE and Wind experiments are taken from the NASA-CDAWeb website. The ICME catalog appears in http://www.srl.calctech.edu/ACE/ASC/DATA/level3/icmetable2.htm. NMs data are gathered from www.nmdb.eu. The authors thank the PIs of the NM network. The authors are also very grateful to Kevin J. Kieswetter for proofreading the manuscript.

Conflicts of Interest

The authors declare no conflict of interest.

References

  1. Antonucci, F.; Armano, M.; Audley, H.; Auger, G.; Benedetti, M.; Binetruy, P.; Boatella, C.; Bogenstahl, J.; Bortoluzzi, D.; Bosetti, P.; et al. LISA Pathfinder: mission and status. Class. Quantum Gravity 2011, 28, 094001. [Google Scholar] [CrossRef]
  2. Antonucci, F.; Armano, M.; Audley, H.; Auger, G.; Benedetti, M.; Binetruy, P.; Bogenstahl, J.; Bortoluzzi, D.; Bosetti, P.; Brandt, N.; et al. The LISA Pathfinder mission. Class. Quantum Gravity 2012, 29, 124014. [Google Scholar] [CrossRef]
  3. Armano, M.; Audley, H.; Auger, G.; Baird, J.T.; Bassan, M.; Binetruy, P.; Born, M.; Bortoluzzi, D.; Brandt, N.; Caleno, M.; et al. Sub-Femto-g Free Fall for Space-Based Gravitational Wave Observatories: LISA Pathfinder Results. Phys. Rev. Lett. 2016, 116, 231101. [Google Scholar] [CrossRef] [PubMed]
  4. Armano, M.; Audley, H.; Baird, J.; Binetruy, P.; Born, M.; Bortoluzzi, D.; Castelli, E.; Cavalleri, A.; Cesarini, A.; Cruise, A.M.; et al. Beyond the Required LISA Free-Fall Performance: New LISA Pathfinder Results down to 20 μHz. Phys. Rev. Lett. 2018, 120, 061101. [Google Scholar] [CrossRef] [PubMed]
  5. Amaro-Seoane, P.; Audley, H.; Babak, S.; Baker, J.; Barausse, E.; Bender, P.; Berti, E.; Binetruy, P.; Born, M.; Bortoluzzi, D.; et al. Laser Interferometer Space Antenna. arXiv 2017, arXiv:1702.00786. [Google Scholar]
  6. Araújo, H.M.; Wass, P.; Shaul, D.; Rochester, G.; Sumner, T.J. Detailed Calculation of Test-Mass Charging in the LISA Mission. Astr. Phys. 2005, 22, 451–469. [Google Scholar] [CrossRef]
  7. Wass, P.J.; Araújo, H.M.; Shaul, D.N.A.; Sumner, T.J. Test-mass charging simulations for the LISA Pathfinder mission. Class. Quantum Gravity 2005, 22, S311–S317. [Google Scholar] [CrossRef]
  8. Grimani, C.; Vocca, H.; Bagni, G.; Marconi, L.; Stanga, R.; Vetrano, F.; Viceré, A.; Amico, P.; Gammaitoni, L.; Marchesoni, F. LISA test-mass charging process due to cosmic-ray nuclei and electrons. Class. Quantum Gravity 2005, 22, S327–S332. [Google Scholar] [CrossRef]
  9. Grimani, C.; Fabi, M.; Lobo, A.; Mateos, I.; Telloni, D. LISA Pathfinder test-mass charging during galactic cosmic-ray flux short-term variations. Class. Quantum Gravity 2015, 32, 035001. [Google Scholar] [CrossRef]
  10. Richardson, I.G. The Formation of CIRs at Stream-Stream Interfaces and Resultant Geomagnetic Activity. In Recurrent Magnetic Storms: Corotating Solar Wind Streams; American Geophysical Union (AGU): Washington, DC, USA, 2013; pp. 45–58. Available online: https://agupubs.onlinelibrary.wiley.com/doi/abs/10.1029/167GM06 (accessed on 26 November 2019).
  11. Mateos, I.; Diaz-Aguilo, M.; Gibert, F.; Grimani, C.; Hollington, D.; Lloro, I.; Lobo, A.; Nofrarias, M.; Ramos-Castro, J. LISA PathFinder radiation monitor proton irradiation test results. J. Phys. Conf. Ser. 2012, 363, 012050. [Google Scholar] [CrossRef]
  12. Armano, M.; Audley, H.; Baird, J.; Bassan, M.; Benella, S.; Binetruy, P.; Born, M.; Bortoluzzi, D.; Cavalleri, A.; Cesarini, A.; et al. Characteristics and Energy Dependence of Recurrent Galactic Cosmic-Ray Flux Depressions and of a Forbush Decrease with LISA Pathfinder. Astrophys. J. 2018, 854, 113. [Google Scholar] [CrossRef]
  13. Armano, M.; Audley, H.; Baird, J.; Benella, S.; Binetruy, P.; Born, M.; Bortoluzzi, D.; Castelli, E.; Cavalleri, A.; Cesarini, A.; et al. Forbush Decreases and <2 Day GCR Flux Non-recurrent Variations Studied with LISA Pathfinder. Astrophys. J. 2019, 874, 167. [Google Scholar] [CrossRef]
  14. Aguilar, M.; Ali Cavasonza, L.; Alpat, B.; Ambrosi, G.; Arruda, L.; Attig, N.; Aupetit, S.; Azzarello, P.; Bachlechner, A.; Barao, F.; et al. Observation of Fine Time Structures in the Cosmic Proton and Helium Fluxes with the Alpha Magnetic Spectrometer on the International Space Station. Phys. Rev. Lett. 2018, 121, 051101. [Google Scholar] [CrossRef] [PubMed]
  15. Forbush, S.E. On the Effects in Cosmic-Ray Intensity Observed During the Recent Magnetic Storm. Phys. Rev. 1937, 51, 1108–1109. [Google Scholar] [CrossRef]
  16. Forbush, S.E. World-Wide Cosmic-Ray Variations, 1937–1952. J. Geophys. Res. 1954, 59, 525–542. [Google Scholar] [CrossRef]
  17. Forbush, S.E. Cosmic-Ray Intensity Variations during Two Solar Cycles. J. Geophys. Res. 1958, 63, 651–669. [Google Scholar] [CrossRef]
  18. Heber, B.; Dröge, W.; Kunow, H.; Müller-Mellin, R.; Wibberenz, G.; Ferrando, P.; Raviart, A.; Paizis, C. Spatial variation of >106 MeV proton fluxes observed during the Ulysses rapid latitude scan: Ulysses COSPIN/KET results. Geophys. Res. Lett. 1996, 23, 1513–1516. [Google Scholar] [CrossRef]
  19. Antonucci, E.; Romoli, M.; Andretta, V.; Fineschi, S.E.A. Metis: The Solar Orbiter visible light and ultraviolet coronal imager. Available online: https://www.aanda.org/articles/aa/pdf/forth/aa35338-19.pdf. (accessed on 26 November 2019).
  20. Telloni, D.; Fabi, M.; Grimani, C.; Antonucci, E. Metis aboard the Solar Orbiter space mission: Doses from galactic cosmic rays and solar energetic particles. AIP Conf. Proc. 2016, 1720. [Google Scholar] [CrossRef]
  21. Armano, M.; Audley, H.; Auger, G.; Baird, J.T.; Binetruy, P. Born, Charge-Induced Force Noise on Free-Falling Test Masses: Results from LISA Pathfinder. Phys. Rev. Lett. 2017, 118, 171101. [Google Scholar] [CrossRef]
  22. Gleeson, L.J.; Axford, W.I. Solar modulation of galactic cosmic rays. Ap. J. 1968, 154, 1011–1026. [Google Scholar] [CrossRef]
  23. Shikaze, Y.; Haino, S.; Abe, K.; Fuke, H.; Hams, T.; Kim, K.C.; Makida, Y.; Matsuda, S.; Mitchell, J.W.; Moiseev, A.A.; et al. Measurements of 0.2-GeV/n to 20-GeV/n cosmic-ray proton and helium spectra from 1997 through 2002 with the BESS spectrometer. Astropart. Phys. 2007, 28, 154–167. [Google Scholar] [CrossRef]
  24. Grimani, C.; Fabi, M.; Finetti, N.; Tombolato, D. Parameterization of galactic cosmic-ray fluxes during opposite polarity solar cycles for future space missions. In Proceedings of the 30th International Cosmic Ray Conference, Merida, Mexico, 3–11 July 2007; Volume 1, pp. 485–488. [Google Scholar]
  25. Burger, R.A.; Potgieter, M.S.; Heber, B. Rigidity dependence of cosmic ray proton latitudinal gradients measured by the Ulysses spacecraft: Implications for the diffusion tensor. J. Geophys. Res. Space Phys. 2000, 105, 27447–27455. [Google Scholar] [CrossRef]
  26. Stone, E.C.; Cummings, A.C.; McDonald, F.B.; Heikkila, B.C.; Lal, N.; Webber, W.R. Voyager 1 Observes Low-Energy Galactic Cosmic Rays in a Region Depleted of Heliospheric Ions. Science 2013, 341, 150–153. [Google Scholar] [CrossRef] [PubMed]
  27. Nymmik, R. SEP Event Distribution Function as Inferred from Spaceborne Measurements and Lunar Rock Isotopic Data. In Proceedings of the 26th International Cosmic Ray Conference, Salt Lake City, UT, USA, 17–25 August 1999; Volume 6, pp. 268–271. [Google Scholar]
  28. Nymmik, R. Relationships among Solar Activity, SEP Occurrence Frequency, and Solar Energetic Particle Event Distribution Function. In Proceedings of the 26th International Cosmic Ray Conference, Salt Lake City, UT, USA, 17–25 August 1999; Volume 6, pp. 280–283. [Google Scholar]
  29. Grimani, C.; Boatella, C.; Chmeissani, M.; Fabi, M.; Finetti, N. On the role of radiation monitors on board LISA Pathfinder and future space interferometers. Class. Quantum Gravity 2012, 29, 105001. [Google Scholar] [CrossRef]
  30. Benella, S.; Grimani, C.; Fabi, M.; Finetti, N.; Villani, M. Recurrent and non-recurrent galactic cosmic-ray flux short-term variations observed with LISA Pathfinder. In Proceedings of the 36th International Cosmic Ray Conference, Madison, WI, USA, 24 July–1 August 2019; Volume 36, p. 76. [Google Scholar]
  31. Kumar, A. Study of the Forbush Decreases, Geomagnetic Storms, and Ground-Level Enhancements in Selected Intervals and Their Space Weather Implications. Sol. Phys. 2015, 290. [Google Scholar] [CrossRef]
  32. Kane, R.P. Severe geomagnetic storms and Forbush decreases: interplanetary relationships reexamined. Ann. Geophys. 2010, 28, 479–489. [Google Scholar] [CrossRef]
  33. Agarwal, R.; Mi shra, R.K.; Singh, R.; Kukaria, R. Study of intensity fluctuations in cosmic rays during Forbush-decreases. In Proceedings of the International Cosmic Ray Conference, Beijing, China, 11–18 August 2011; Volume 10, p. 264. [Google Scholar] [CrossRef]
  34. Armano, M.; Audley, H.; Baird, J.; Binetruy, P.; Born, M.; Bortoluzzi, D.; Castelli, E.; Cavalleri, A.; Cesarini, A.; Cruise, A.; et al. Measuring the Galactic Cosmic Ray flux with the LISA Pathfinder radiation monitor. Astropart. Phys. 2018, 98, 28–37. [Google Scholar] [CrossRef] [Green Version]
Figure 1. Comparison of predicted proton energy spectra at the beginning (BR 2490; dot-dashed line) and at the end (BR 2508; dotted line) of the LPF mission with AMS-02 experiment measurements carried out during the BR 2490 (black stars).
Atmosphere 10 00749 g001
Figure 2. Fifteen second hourly averaged GCR single count rate observed with the PD on board LPF.
Atmosphere 10 00749 g002
Figure 3. LPF PD counting rate percent change during the BR 2495 (20 June 2016–16 July 2016); first panel. Solar wind speed (second panel), IMF negative x component (−B x ) in the Geocentric Solar Ecliptic (GSE) coordinate system (third panel) and IMF intensity (fourth panel) contemporaneous measurements, gathered by the ACE experiment (nasa-CDAWeb website), are also shown. HCSC crossing (http://omniweb.sci.gsfc.nasa.gov./html/polarity/polarity_tab.html) are indicated in the third panel.
Atmosphere 10 00749 g003
Figure 4. The same as Figure 3 for the BR 2497 (13 August 2016–8 September 2016).
Atmosphere 10 00749 g004
Figure 5. The same as Figure 3 for the BR 2502 (26 December 2016–21 January 2017).
Atmosphere 10 00749 g005
Figure 6. Comparison of LPF PD counting rate percent change with contemporaneous, analogous measurements of polar NMs during the BR 2495.
Atmosphere 10 00749 g006
Figure 7. The same as Figure 6 for the BR 2497.
Atmosphere 10 00749 g007
Figure 8. The same as Figure 6 for the BR 2502. The Jang Bogo NM station data replaced the McMurdo NM data that were not available for the considered time period.
Atmosphere 10 00749 g008
Figure 9. AMS-02 experiment data gathered during the BR 2496 (black stars) [14]. Minimum and maximum values of the proton cosmic-ray spectrum during the same BR are represented by bottom (20 July 2016) and top (2 August 2016) dotted curves.
Atmosphere 10 00749 g009
Figure 10. GCR count rate percent change during the BR 2496 observed with the LPF PD. Dashed vertical lines indicate the passage of ICMEs at the origin of two FDs started on 20 July 2016 and 2 August 2016 (see http://www.srl.caltech.edu/ACE/ASC/DATA/level3/icmetable2.htm).
Atmosphere 10 00749 g010
Figure 11. The same as Figure 10 for the BR 2507. The transit of an ICME generated the FD started on 27 May 2017.
Atmosphere 10 00749 g011
Table 1. GCR count rate short-term percent change with respect to average values observed with LPF during the Bartels rotations 2491-2505 (4 March 2016–12 April 2017). BR numbers and corresponding dates are reported in http://www.srl.caltech.edu/ACE/ASC/DATA/bartels/Bartels2004-2023.pdf. The solar modulation parameter during each BR and dates of observed minimum and maximum GCR flux intensities are also indicated.
BR Number ϕ (MV/c)Maximum Decrease (%)DateMaximum Increase (%)Date
2491475−34 March 2016+326 March 2016
2492468−414 Apr 2016+420 April 2016
2493465−47 May 2016+416 May 2016
2494452−618 June 2016+611 June 2016
2495457−515 July 2016+96 July 2016
2496452−720 July 2016+82 August 2016
2497437−45 September 2016+729 August2016
2498431−39 September 2016+426 September2016
2499406−413 October 2016+522 October 2016
2500385−43 November 2016+520 November 2016
2501386−429 November 2016+517 November 2016
2502370−726 December 2016+713 January 2017
2503360−33 February 2017+312 February 2017
2504351−32 March 2017+315 March 2017
2505356−37 April 2017+420 March 2017

