1. Introduction
Combustion processes generate substantial fine particle and gas emissions to ambient air, which are known to induce globally significant adverse health [
1] and climate effects [
2]. Current levels of urban air particles are associated with mortality and morbidity especially in elderly subjects with cardiovascular disease, asthmatic subjects of all ages, and children. At the same time, growing evidence suggests that air pollution related adverse health outcomes are also seen in the central nervous system and brain [
3]. While combustion-originated fine particles are identified as the major environmental health problem globally, in climate they have both cooling and warming effects, depending on, for example, their composition [
2,
4]. Primarily, aerosol particles scatter sun light, but optical properties of particles are strongly dependent on their composition. Moreover, aerosols have an effect on the physical properties of clouds and, therefore, indirectly influence the climate. Black Carbon (BC) particles, which form in incomplete combustion, have been estimated to be the second strongest contributor to current global warming, after CO
2 emissions [
5]. Studies show that the deposition of atmospheric BC darkens snow, reduces snow albedo, and accelerates glacier and snowpack melting in particular in the Arctic and e.g., in the Himalayas region with the warming effect of BC particles [
6]. In the Nordic Countries, air pollution levels are typically low, but Residential Wood Combustion (RWC) appliances are ubiquitous, and are the main source of ambient air particulate pollutants. RWC of the Nordic countries has also been estimated to influence the Arctic climate mainly due to its high BC emissions [
2,
4,
7,
8].
In RWC, various combustion technologies and wood fuels are used, which all generate different specific particulate and gaseous emissions [
9]. In addition, operational practices have large effects on the emissions and fine particle properties [
10,
11,
12]. Typically, complete combustion produces mainly highly scattering non-absorbing ash and incomplete combustion more absorbing soot (i.e., BC). Additionally, particle size and morphology vary [
13], which affects the climate- and health-related properties of the emissions [
14]. In addition, incomplete combustion produces significant amounts of organic compounds that are partly in the particulate phase and partly in the gaseous phase during exhaust to ambient air. The major emission problems are connected to the batch-wise combustion in cookstoves, stoves, and masonry heaters where emission factors are high and particles are composed of soot and organic material, including high contents of polycyclic aromatic hydrocarbons (PAHs).
It is estimated that exposure to primary fine particles from RWC is associated with approximately 200 premature deaths yearly in Finland [
15]. About 35% of Finnish national fine particle emissions and more than 50% of BC particles are originated from RWC [
16,
17]. About a third of RWC originated fine particles are emitted from small heating boilers, a third from masonry heaters and a third from sauna stoves (SS) [
17]. Of the emissions of carcinogenic benzo(a)pyrene, about 67% are originated from SS [
18,
19]. Thus, SS have been estimated to be a key source of particulate pollution in Finland.
SS are used to heat sauna rooms by convection and radiation. SS are typically made of steel and are typically not designed to substantially reserve heat. About 50%–70% of the released energy can be recovered as heat in the stones on the stove and in the sauna room, and consequently the exhaust gas temperature is typically high. The momentary need of heating in the sauna room is very high, so SS are also operated at high power [
11]. According to earlier studies, the emission factors of BC and other fine particles from sauna stoves are often substantially higher than from other appliances [
9,
10] and the emissions are also potentially more toxic than in other appliance types (e.g., [
20]). Thus, SS are a significant source of emissions from both a climate and health point of view.
In terms of combustion technology, sauna stoves on the market are very conventional, because there are no legislative requirements that limit particle emissions of SS. According to Construction Products Regulation (CPR) of the EU, CE (Conformité Européenne) Mark Certification Testing has been required for SS since 2013. This has probably also affected the particle emissions of SS, although CE-testing does not require any kind of particle measurement. This is the first study presenting scientific measurements of SS emissions after the act came into force. As the emission factors used to estimate emissions on a national scale have been based on a limited and possibly outdated set of measurements, there is an urgent need to get more information about the emissions of commercially available sauna stoves. Updating the emission inventory and clarifying the present status of the SS technology lays the foundation for the planning of possible mitigation measures.
In this study, a new measurement concept for comparing the operation, thermal efficiency, and real-life fine particle and gaseous emissions of SS was utilized. Altogether, 10 different SS models were investigated. In addition, in two SS, the effect of fuel moisture content on emissions was studied. In one SS, different fuel species and fuels with and without bark were investigated. The results were applied to update the emission factors of SS, which will be used in the national emission inventories reported to the United Nations Economic Commission for Europe (UNECE), Convention on Long-range Transboundary Air Pollution (CLRTAP) and EU. Furthermore, the updated, more reliable emission factor estimates improve the evaluation of future emission scenarios and possibilities to enhance air quality in Finland.
2. Experiments
2.1. Combustion Facilities and Appliances
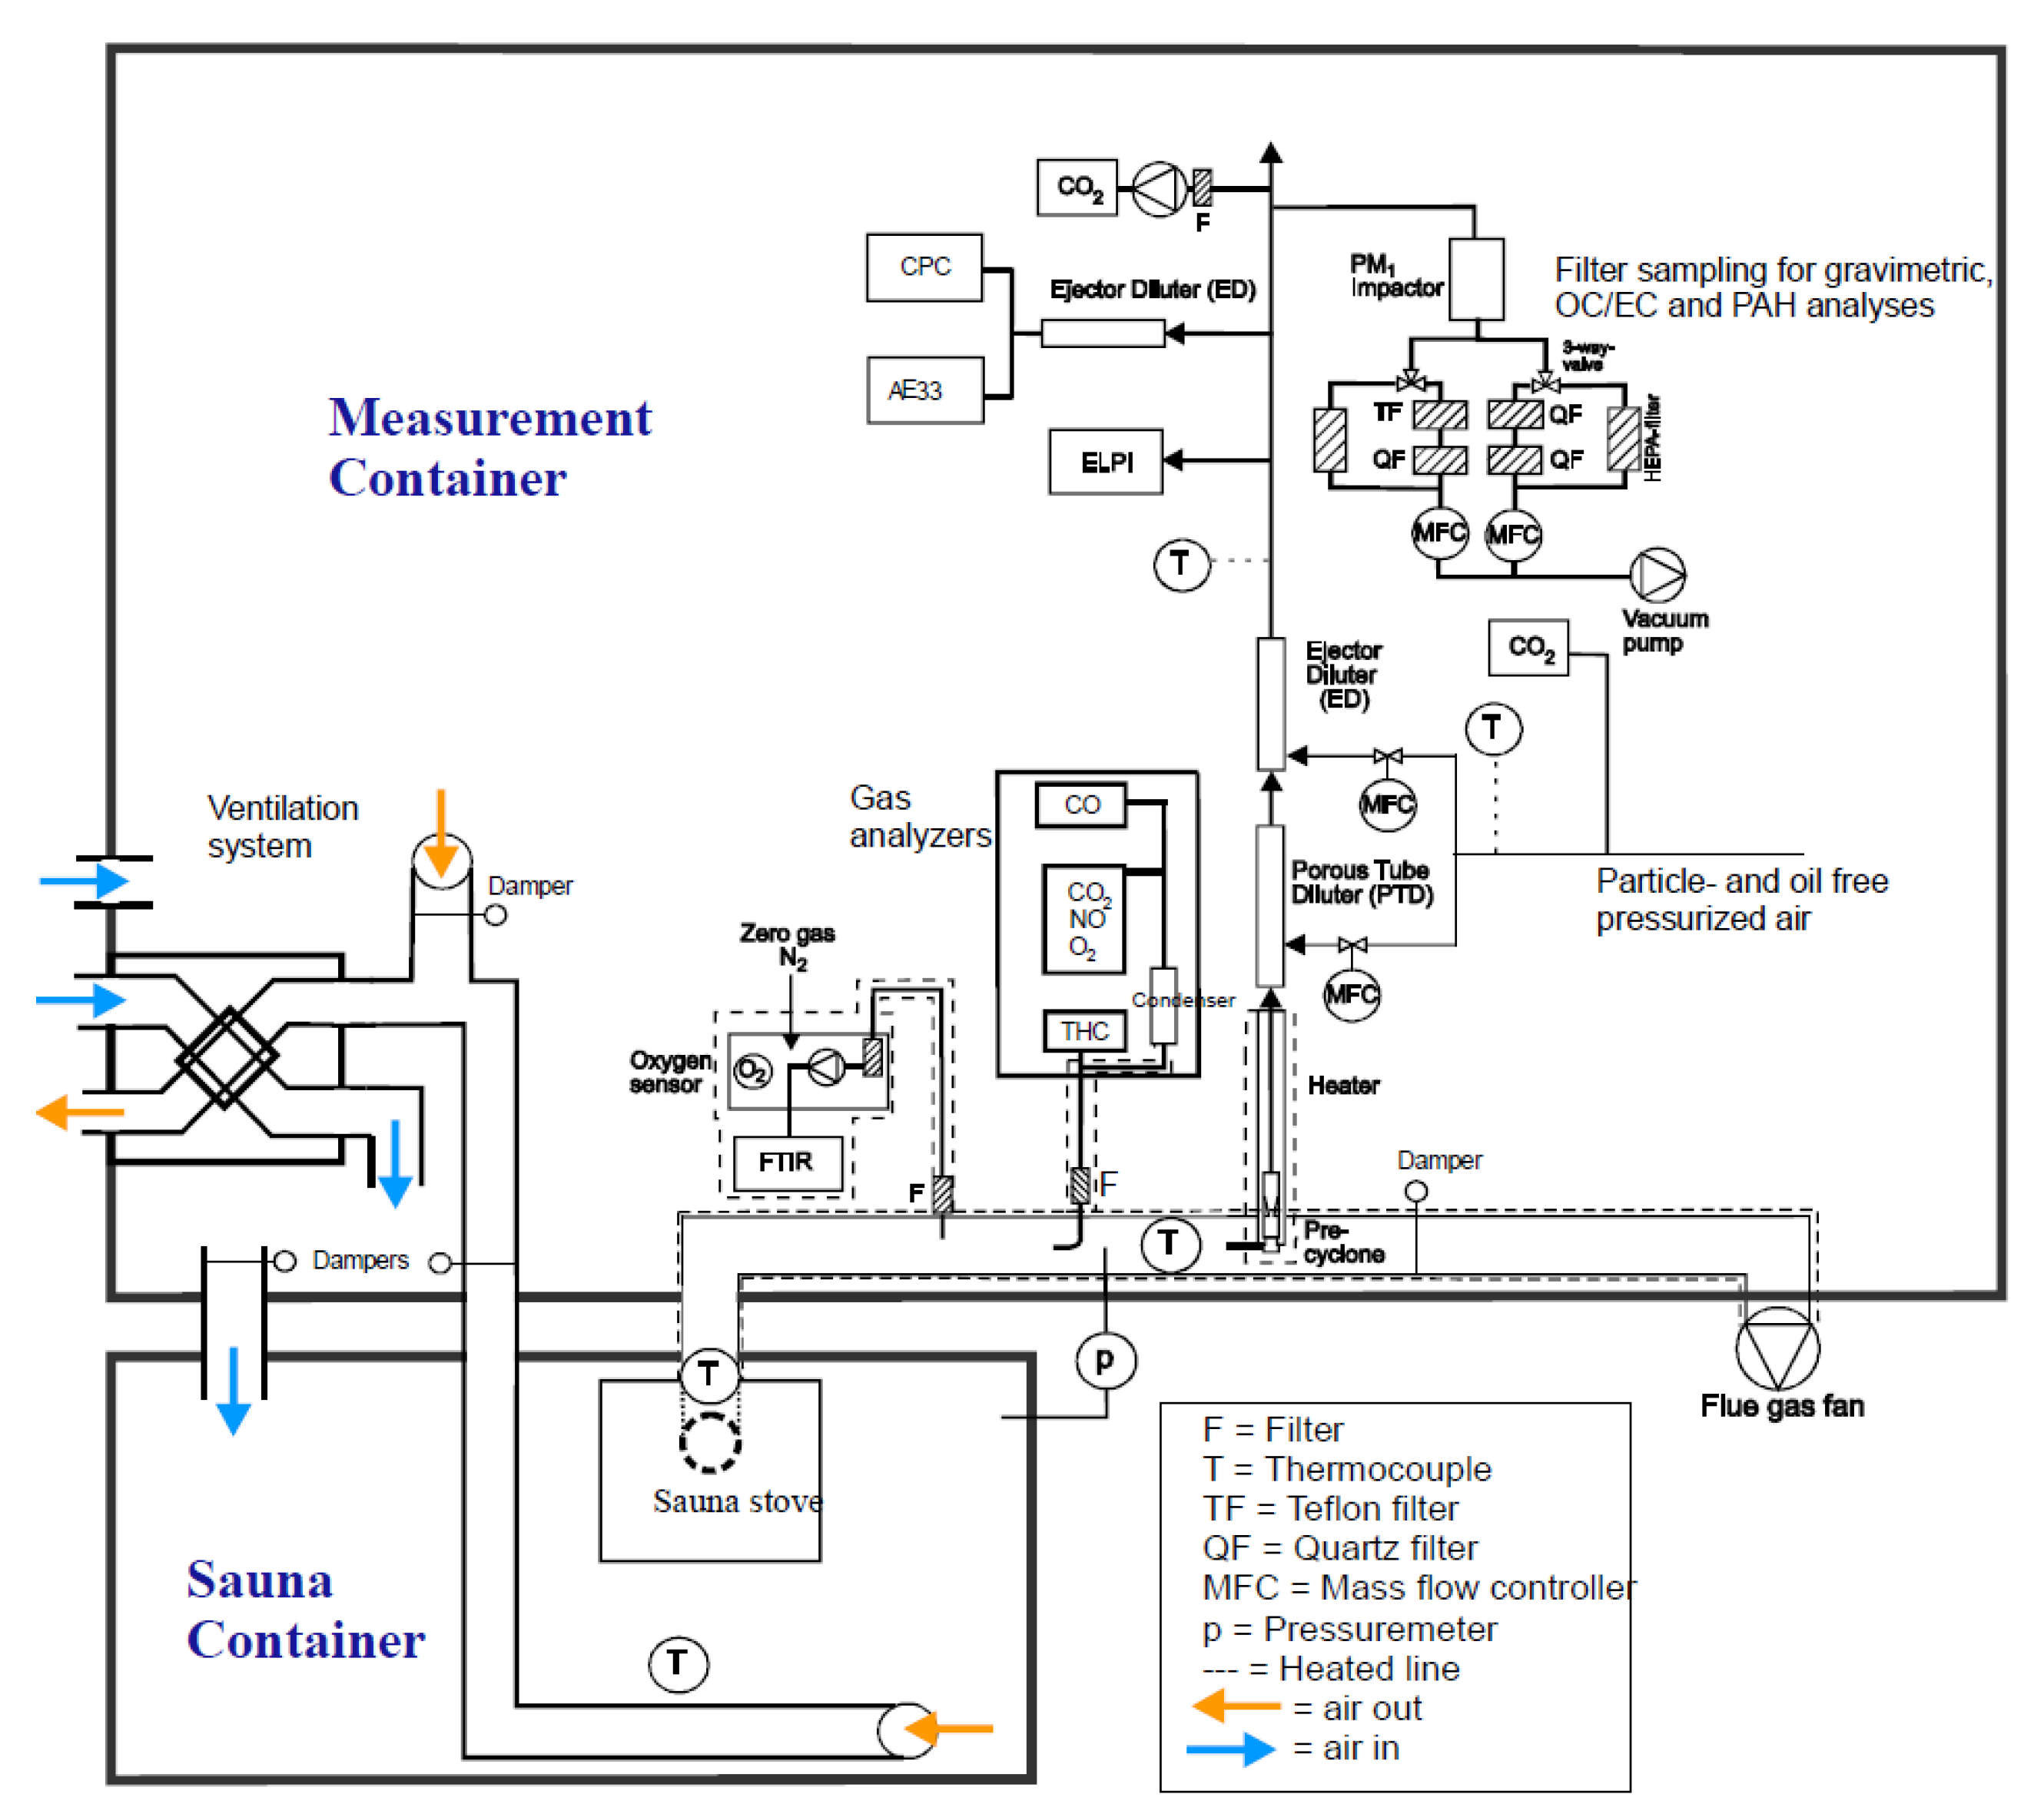
The experiments were conducted in the small-scale combustion simulator (SIMO) at the University of Eastern Finland (
http://www.uef.fi/en/web/fine/simo). The SIMO is a facility that allows testing of various small-scale wood combustion appliances in near to real-life conditions. The facility consists of a measurement container containing all the measurement equipment and air ventilation systems, and a sauna container, which represents a typical wood-fired SS-heated sauna room. The setup allows multiple parameters (e.g., ventilation, pressures, airflows, temperatures, combustion parameters, and emission sampling settings) to be monitored and controlled simultaneously. The flue gas flows through a steel chimney with a flue gas fan for controlling and adjusting the draught throughout the experiment (
Figure 1).
A typical design of a firebox in SS is an upright firebox with a small glass door and a conventional (rift) grate. The combustion air is supplied in two or three stages to the firebox. The primary air flows through the grate and in practice regulates the combustion rate. Most of the tested SS are equipped with secondary air supply, which is fed to the upper part of the firebox via small holes or rifts to enhance secondary combustion of unburned gases. Combustion air also leaks to the firebox via a firebox door, because these are typically not air-tight.
In this study, 10 (S1−S10) different commercially available SS (in Finland) were investigated. Schematic pictures of sauna stove structures are presented in the
Supplementary Material (Figure S1). S1−4, 8, and 9 were traditional steel stoves, S5 had long flue gas ducts at both sides of the stove, and in S6, 7, and 10 the outer shells of the stoves were covered with stones. S3 was equipped with a 30 dm
3 water tank. S1−9 had (unique) grates of varying sizes, whereas S10 was not equipped with a grate. Firebox volumes were nearly similar in all SS. Detailed information of SS are presented in
Table 1.
2.2. Operational Practices
The sauna stoves, which were placed in the sauna room of the sauna container, were operated in a manner that represents normal everyday use. Draught in the flue gas stack was set to 6 Pa at ignition and was allowed to increase naturally as the stack became hot during combustion. Ventilation in the sauna room was set to an air change rate of three times per hour before the experiment. The flow rate of the outgoing air was measured with a TSI LCA301 rotating vane anemometer, and the flow was adjusted by controlling the exhaust duct fan speed. The sauna room volume was 16 m
3, so the flow rate of the outgoing air was set to 13.3 dm
3/s. Incoming air flow was also adjusted so that the pressure difference between the sauna room and flue gas duct before adjusting the draught was 0 Pa, and there was no air flow through the sauna stove (see
Figure 1). The doors to the air-tight sauna container were kept closed during experiments, so air exchange could be monitored and controlled.
Three batches were combusted with a total loading of 7 kg (3 kg + 3 kg + 1 kg). The ignition batch consisted of three 500 g logs, three 250 g logs, four 100 g sticks, four 40 g sticks and about 200 g of kindling. The two additional batches consisted of six and two 500 g logs, respectively. With S10 only two batches were combusted (3 kg + 4 kg). Sticks and chips from fuel wood were used as ignites and placed on top of the ignition batch. The batch was ignited from the top with matches. Data collection was started 1 min after ignition. In all of the tests, each additional batch was added when the CO2 concentration in the flue gas dropped to 25% of the previous batch’s maximum or when the CO2 concentration dropped to 3%, whichever condition was reached first. The same principle was also used to determine measurement ending times. The tests were repeated three times. Birch wood was used as fuel in all combustion appliances.
The wood moisture content was approximately 11% for all experiments, except for the S2 and S3 when it was 17%. After the S3 experiments, it was noted that the moisture content has a dramatic effect on the emissions and the tests were continued with wood with 11% moisture content providing more representative and reproducible emissions. However, to clarify the effects of wood moisture, comparable tests with different moisture contents were done with S1 and S8. In the results section, the moisture content is coded so that S1_11 means Sauna Stove 1, moisture content 11%.
In addition, to study the effect of wood species and bark on the emissions, several single tests with different dry (10% moisture content) wood species (birch, spruce, pine and alder, both with and without bark) were done in S8 appliance using identical operational protocol than in S1−9. Although it was not possible to repeat the experiments with different wood species, the results give additional information about the effect of fuel species on the emissions.
2.3. Emission Measurements
2.3.1. Gas Analyses
The raw flue gas sample for gas analysis was directed to the analyzers through an insulated and heated (180 °C) sample line (
Figure 1) with a ceramic filter to remove particles from the sample. Two Siemens ULTRAMAT 23 gas analyzers were used to measure carbon dioxide (CO
2), carbon monoxide (CO), and nitrogen oxide (NO). Volatile organic compounds (VOCs) were measured with a Fourier Transform Infrared analyzer (FTIR, Gasmet Technologies Ltd., Northampton, UK).
2.3.2. Aerosol Dilution for Particle Measurement
In order to perform a reliable and representative sampling for the aerosol sample, and to adjust the sample concentrations suitable for particle analyzers, the sample was led through a two-phase dilution system. First, the sample flow from the stack was led through a sampling probe with a 10 μm pre-cyclone. After the heated (200 °C) probe, the first stage of dilution was performed with a porous tube diluter (PTD) to avoid particle losses and water vapor condensation [
21]. The second stage of dilution was carried out with an ejector diluter (ED) that also provided a stabile flow of sample toward the rest of the sampling system. The dilution ratio (DR) was controlled with an online computer-based system and was set to a constant value of 90 (expect for S1_11, S1_18, and S2_17) for the whole experiment. DR was calculated from the CO
2 concentrations in the flue gas, diluted sample, and dilution air (see
Section 2.4.3). Vaisala GMP343 CO
2 probes were used to measure dilution air and diluted flue gas CO
2 concentrations. Particle and oil free air was produced with air compressors with integrated cleaning and drying units. Air flow to the PTD and ED were controlled with dedicated mass flow controllers (MFC) for each line. An additional ED diluter was used upstream of the most sensitive instruments (Aethalometer and CPC, see
Section 2.3.3 and
Figure 1) to further dilute the sample by a factor of 8.6.
2.3.3. Real-Time Particle Measurement and Analyses
Concentrations from particle measurements made with on-line instruments were calculated in real-time using a custom-built analysis program. Particle number concentrations were measured using an ultrafine condensation particle counter Model 3776 (UCPC, TSI Inc., Shoreview, MN, USA) with a flow rate of 1.5 lpm and particle diameter detection range of 2.5 nm to 3 µm. Black carbon (BC) mass concentration and the absorption Ångström exponent (AAE) were measured using an Aethalometer (AE33-7, Magee Scientific, Berkeley, CA, USA) with a flow rate of 2 lpm and using a 1 s timebase. AAE is a measurable parameter that describes the wavelength-dependence of optical absorption by black carbon or other light-absorbing particles. The calculation of AAE was done as described in Helin et al. [
22]. The average AAEs were calculated from instantaneous AAE values weighted with BC mass concentrations. Particle mass concentrations and number size distributions (7 nm to 10 µm) were measured with an electrical low pressure impactor (ELPI, Dekati Inc., Kangasala, Finland) with sintered impactor plates and a flow rate of 10 lpm.
2.3.4. Filter Sampling and Analyses
Particles were collected on PTFE filters for gravimetric and chemical analyses, as well as quartz fiber filters for organic and elemental carbon (OC/EC) analyses (
Figure 1). In this sampling system a vacuum pump is used to create a sample flow, which is kept constant with mass flow controllers. The diluted sample is first led through an impactor, which is used to remove particles with an aerodynamic diameter of over 1 µm. Sample collection is started when the sample flow is switched through collection filters via a three-way valve (Teflon and quartz filters in
Figure 1). Sample collection is stopped by using the three-way valve to switch the sample flow to a bypass line without interrupting the constant sample flow. Using the bypass flow allows sample collection to be started and paused without causing pressure changes in the diluted sample lines, and thus interrupting other simultaneous sampling or measurements.
The organic (OC) and elemental carbon (EC) content of the collected samples were analyzed with a thermal-optical carbon analyzer (Sunset Laboratory Inc.). Analyses were performed using the NIOSH protocol.
A total of 30 polycyclic aromatic hydrocarbon (PAH) compounds (naphthalene, acenaphthylene, acenaphthene, fluorene, phenanthrene, anthracene, 1-methylphenanthrene, fluoranthene, pyrene, benzo[c]phenanthrene, benzo[a]anthracene, cyclopenta[c,d]pyrene, triphenylene, chrysene, 5-methylchrysene, benzo[b]fluoranthene, benzo[k]fluoranthene, benzo[j]fluoranthene, benzo[e]pyrene, benzo[a]pyrene, perylene, indeno[1,2,3-c,d]pyrene, dibenzo[a,h]anthracene, benzo[g,h,i]perylene, anthanthrene, dibenzo[a,l]pyrene, dibenzo[a,e]pyrene, coronene, dibenzo[a,i]pyrene and dibenzo[a,h]pyrene) were analyzed from the PTFE filter samples. The samples were extracted to dichloromethane and the analysis was carried out as described by Lamberg et al. [
9]. PAH compounds were analyzed by using a gas chromatograph mass spectrometer (6890N GC, equipped with 5973 inert Mass Selective Detector, Agilent Technologies). HP-17-MS column was used for the separation of the compounds. The equipment was operated with selected ion monitoring (SIM) mode. The detection limit of the method was 0.1 ng/mg. The sum of the known genotoxic PAH compounds was calculated according to WHO [
23].
2.4. Data Processing
2.4.1. Fuel Mass Flow, Power, and Thermal Efficiency
Average fuel mass flow (kg/h) was calculated based on combustion time and amount of fuel combusted. The average thermal efficiency and power were determined according to the EN 15821 taking into account energy loss in the unburned carbonaceous char residue (0.5%), thermal heat losses of flue gas, and chemical heat losses (based on flue gas CO concentration).
2.4.2. Air-to-Fuel Ratio
The air-to-fuel ratio (
λ) was calculated from raw flue gas
CO2 concentration using the equation
where
CO2,ST is the stoichiometric flue gas
CO2 concentration and
CO2,FG is the
CO2 concentration in raw flue gas. In wood combustion,
CO2,ST is 202,000 ppm (dry) [
24].
2.4.3. Sampling Dilution Ratio
The sampling dilution ratio (
DR) was calculated from dry
CO2 concentrations using the following formula:
where
CO2,D is the
CO2 concentration in diluted flue gas,
CO2,FG is the
CO2 concentration in raw flue gas, and
CO2,BG is the
CO2 concentration in dilution air.
DR was kept constant throughout the experiments with automation.
2.4.4. Universal Emission Conversion Factor
The instantaneous (
i) Universal Emission conversion Factor (
UEFi) is defined as follows:
where
CO2,ST is the stoichiometric flue gas
CO2 concentration and
O2,N is the flue gas
O2 concentration used for oxygen normalization. In wood combustion,
O2,N is 130,000 ppm. The
UEF combines the oxygen normalization (internal dilution of combustion process) and dilution correction (see Equation (2)) needed to compensate sample dilution occurring in the sampling system. This factor enables a straight-forward emission factor determination from any combustion process of interest when using dilution sampling system.
2.4.5. Normalization Factor
Concentrations are normalized to normal temperature and pressure (
NTP). Normalization factor (
N) is calculated as follows:
where
Ts is the sample air temperature (K),
Tn is normal temperature (293.15 K),
Ps is ambient air pressure (Pa) and
Pn is normal air pressure (101,325 Pa).
2.4.6. Real-Time Calculation of Particle Concentration
Instantaneous dilution corrected, normalized, and oxygen normalized particle concentration (
Ci) can be determined as presented below:
where
C is the uncorrected instantaneous particle concentration and
UEFi is the universal emission conversion factor. Average particle concentration for a sequence of real-time measurements can be calculated as the arithmetic mean of corrected instantaneous concentrations.
2.4.7. Calculating Particle Concentrations of Periodic Sampling
When particles are sampled on a filter, the average
UEF for the sampling period must be calculated as the harmonic mean of instantaneous values. This is because the factor is changing strongly due to the varying air-to-fuel ratios and e.g., during the ignition period the high factors would overestimate ignition emissions when using an arithmetic mean of the
UEF. The mean
UEF for a sampling period is
where
n is the number of measurement values. Now the dilution corrected, normalized, and oxygen normalized periodic particle concentration (
Cave) can be defined as follows:
2.5. Emission Inventories
Finland reports it annual air pollutant emissions to EU and the Convention on Long-Range Transboundary Air Pollution under UNECE (CLRTAP). Emissions of residential wood combustion the Finnish inventory are calculated with methods explained in Savolahti et al. [
17]. The scheme includes emission estimates for 15 types of wood burning appliances, including sauna stoves. For each appliance type, annual emissions are a product of wood consumption and source-specific emission factors. In the case of stoves, the applied emission factor for each pollutant is a combination of two separate emission factors: one for normal and one for smoldering combustion, the latter representing typical user mistakes, which lead to higher emissions. Emission factors of normal combustion are obtained from a measurement setting where the stoves are used properly. The increase coefficients used for smoldering combustion are based on both measurements and expert judgement. The estimated share of smoldering combustion determines the applied emission factors. Emission factor for particle mass (PM
2.5) was converted from that of PM
1 using a coefficient of 1.033.
Savolahti et al. [
8] estimated wood consumption in sauna stoves to be 8.9 PJ in 2015. In that study, the impact of a hypothetical legislation that would force modern SS on the market was explored. Since the measurements from current SS show notably lower emissions than in the past, we now use the term “modern sauna stoves” for those appliances that have been bought after 2013. For modern sauna stoves, we used the average emission factors of all the measured stoves in this study. We also revised the emission factors of conventional sauna stoves (appliances bought before 2013). Since no data of the sold appliances is available, we used an average lifetime of 12.5 years for sauna stoves to estimate the renewal rate of the appliance stock.
3. Results and Discussion
3.1. Combustion Conditions, Temperatures, and Thermal Efficiency
All SS performed as expected, providing sufficient heating for the sauna room and stones in the stoves (
Figure S2). Except for draught, standard deviations of repeated measurement results were low, typically below 10% of measured values of combustion time, fuel mass flow, power, temperatures, air-to-fuel ratio or thermal efficiency (
Table 2). Combustion time varied between 73 and 109 min and during that time the sauna room was heated up to 68−102 °C, depending on the stove. Average flue gas temperature varied from 298 to 458 °C whereas the highest temporary values were 386−645 °C which indicates rather poor heat recovery to stove stones and to the sauna room with most of the stoves. Air-to-fuel ratio varied remarkably between the stoves, its average values ranged from 2.1 to 3.4. Due to high temperatures of flue gas and relatively high air-to-fuel ratios, the thermal efficiencies were only between 58% and 72% (with dry wood). The highest thermal efficiency was found from S5 (due to long flue gas ducts). Draught conditions were set equal for each experiment but increased individually during the combustion process. This is mainly due to individual structures of each stove (diameter and length of flue gas ducts). Clear correlations between combustion parameters (e.g., air-to-fuel ratio vs. temperatures, draught, or fuel mass flow) were not found. As a conclusion, it seems that every SS was individual in terms of sauna operation.
3.2. PM1 Concentrations
There was high variation in fine particle emissions between different SS. There were 9-fold differences in the PM
1 concentrations between the lowest and the highest emissions with dry wood (
Table 3,
Figure 2). A very high PM
1 concentration, namely 392 mg/Nm
3, was measured in S6 although the thermal efficiency was among the highest of the measured SS (69.8%,
Table 2). In conventional batchwise-fired appliances the emissions increase when the wood gasification rate is temporarily too high [
25]. However, in this case the combustion rate was moderate (4.5 kg/h). Additionally, if the air-to-fuel ratio remains too low during the combustion, this typically increases emissions [
25]. In this case the air-to-fuel ratio was 2.2 which seems not to be too low for complete combustion. In addition, this stove was equipped with secondary air inlets. In natural draught appliances such as sauna stoves the secondary air flow is very sensitive to operating conditions and probably S6 did not work in a proper way.
High concentrations were also measured from S2 (PM1 225 mg/Nm3) and S8_11 (PM1 311 mg/Nm3), but this is due to fact that only primary air was used in these runs. Clearly lower concentrations were found from S1, S9, and S10 where PM1 was 63, 72, and 46 mg/Nm3 with dry birch wood, respectively. In S1 and S9, low concentrations are probably due to secondary air, which reacts quite efficiently in the combustion process. The stove S10 operates without a grate and without any separate secondary air supply. In general, the lack of grate should decrease the combustion rate due to less efficient penetration of combustion air into the fuel bed, and therefore excessively high combustion rates and consequent air-starved conditions do not occur. In addition, the cylindrical design of the firebox, which is thermally insulated by the surrounding stones in S10, seemed to be optimal in respect to PM1 emissions and, most probably, combustion gas temperatures remained sufficiently high in the firebox and flue gas channel to reach relatively good combustion conditions.
The measured average concentration values were clearly lower than in previous literature for SS [
9,
10,
11,
26]. Savolahti et al. [
17] used average PM
1 value of 580 mg/Nm
3 (range of 50–2340 mg/Nm
3) in their emission inventory, whereas in this study, the average concentration was 151 mg/Nm
3 (range of 43–392 mg/Nm
3). When comparing the results of this study to Savolahti et al. [
17], it has to be noted that the previous data includes only a limited number of experiments and SS types. Lower emissions from new sauna stoves may result from the conjecture that the high emission SS models have not been available in the market anymore after the CE-marking in 2013.
The highest PM concentrations from RWC appliances, ranging from 400 to 1200 mg/Nm
3, have been measured from fireplaces and open fireplaces, but also old type wood-fired chimney stoves (WS) may produce high particle emissions [
27,
28]. Alves et al. [
28] measured PM concentration of 340–1300 mg/Nm
3 from WS, but also lower concentrations, from 73 to 140 mg/Nm
3 [
29,
30] have been found from modern type appliances. Nyström et al. [
31] found that elevated burn rates increased PM emissions independent of the wood species used. With normal burn rate in a WS, the PM concentration was 52 mg/Nm
3, while with high burn rate it elevated to 141 mg/Nm
3. Our study shows that the effect of burn rate is also dependent on combustion appliance model. In general, the particle emissions vary between combustion appliance type, but are also dependent on operational practices and fuel species (e.g., [
11]. see ch. 3.8). In addition, the sampling techniques have an effect on emission factors [
32,
33]. Thus, literature values vary remarkably and are not fully comparable to each other. When compared to other Finnish appliance types (masonry heaters), conventional masonry heaters have PM
1 concentrations between 28 and 464 mg/Nm
3 whereas from modern masonry heaters, concentrations are lower, 34–100 mg/Nm
3 [
9,
10,
11,
32,
34,
35,
36]. Thus, the emission levels from least emitting SS are rather low, in the same order of magnitude as in modern log wood combustion appliances. However, the variation of particle emission is high, and the development of lower emission SS in the future would require systematic studies on the effects of constructional and operational parameters on emissions in more detail.
3.3. BC and EC Concentrations, and Absorption Ångström Exponent
When dry birch wood was used, average BC and EC concentrations were 72 and 73 mg/Nm
3, respectively, with 3–6-fold differences between the lowest and highest emission stove (
Table 3). The highest BC emission (134 mg/Nm
3) was measured from the S8. The lowest average BC concentration of a full combustion experiment was 28 mg/Nm
3 (S1_18). These BC concentrations are on a similar level than in many other batch-wise fired appliances, which vary between 9–143 mg/Nm
3 for CMH [
10,
11,
29], 12–82 mg/Nm
3 for MMH [
10,
11,
32], and 30–140 for WS [
37]. Interestingly, in S7, a relatively higher BC portion of total particle emission was found when compared to other stoves which may result from the nonsymmetrical firebox geometry.
The interpretation of these differences in BC emissions is not straight forward because there are many factors affecting soot formation and its oxidation in RWC appliances (e.g., [
38,
39]). In some studies, it has been found that while the overall combustion efficiency improves, BC emission may even increase [
32,
40]. The flame zone always contains fuel-rich areas even in the presence of overall excess air during combustion. The combustion temperature affects both the amount of soot formed in the flames [
41] and its burning out in the outer zone of flames. Therefore, the SS physical design, influencing wood gasification rate, temperature conditions, combustion air mixing, and combustion gas residence times, affects soot formation and burnout in a complicated manner.
Particle concentrations were typically high during the first batch in all experiments. Ignition was very important especially regarding BC emissions (
Figure 3). In the first batch, firebox temperature is low, amount of excess air high, and flows throughout the firebox low. Thus, flames are quiescent and typically hit the firebox top which probably leads to disturbed BC burnout. For the stoves with generally high emission levels, high BC peaks after the fuel addition were observed (e.g.,
Figure 3, S8). The low emission stoves produced clearly lower emissions in the second batch. Notably, S10 emitted extremely low emissions during the second batch compared to the first batch. As discussed earlier, it seems that (very) optimal combustion conditions are possible, even without separate secondary air input. In the case where the secondary air is supplied and it takes part in the combustion process, the emissions are low (e.g., S1 and S9). If the secondary air does not react, it cools the combustion process and increases emissions as seemed to be the case with S6.
A good correlation between BC and EC concentrations (
Figure 4) is observed, indicating that both parameters can be used in the estimation of emissions. At low concentrations, BC values are generally higher than EC, but at higher concentrations the opposite is true. We found no clear explanation for this anomaly in our data. Organic coatings on BC cores should enhance absorption [
42], but there was no correlation between organic content and BC:EC ratio in this study. However, Cappa et al. [
43] found coatings to have a neglectable effect on absorption enhancement, indicating that enhancement is also dependent on the emission source. It is also possible that the real-time filter loading correction of the Aethalometer [
44] could not compensate for the high loadings achieved when measuring stoves with high emissions. The automatic tape advance function was turned off for these experiments to avoid gaps in concentration data during measurements, and thus the filter loadings during some experiments were significantly higher than intended by the manufacturer. There are also uncertainties regarding the thermal-optical carbon analysis, especially the separation between OC and EC [
45].
Average AAE values varied between 1.17 and 1.33 for dry wood and ranged up to 1.60 for the highest fuel moisture content. It is traditionally assumed that the AAE for fossil fuel emissions is approximately 1, and approximately 2 for biomass combustion emissions [
46]. These AAE values are commonly used in the source apportionment of environmental aerosols between fossil fuel and biomass burning sources. Internal mixing of BC with non-absorbing materials or non-BC absorbers can increase overall absorptivity and AAE [
47], and for example Zotter et al. [
48] measured AAEs ranging from 1.68 to 2.09 for wood combustion emissions in ambient aerosol. The AAE values in this study were significantly lower than the assumed value of 2 for biomass burning. However, studies on black carbon source apportionment generally focus on atmospheric aerosols, and emissions have been subject to atmospheric aging before measurement. Therefore, the low AAE values in this study may be explained by the lack of photochemical aging of the measured emission. This is supported by Tasoglou et al. [
49], who measured an AAE of 1.01 for fresh biomass emissions and observed a clear increase in AAE after photochemical aging in a smog chamber.
If the 18% and 28% fuel moisture experiments are excluded from the data, AAE does not correlate with OC/EC or the BC content of PM
1. Therefore, the average organic content of emissions does not seem to affect AAE. However, temporal analysis of BC content and AAE reveals, that when the ratio of PM
1 to BC is high (see also
Figure S3), indicating a high organic aerosol content, AAE values increase (
Figure 3). The decoupling between AAE and average OC/EC ratio may therefore be explained by the temporal emission patterns. When OC and BC are co-emitted, BC particles are effectively coated, increasing AAE. If peak OC emissions do not coincide with peak BC emissions, BC coating does not occur, and AAE remains near 1 (
Figure 3).
The results of this study show that it is possible to achieve remarkably low BC emissions from sauna stoves by optimizing sauna stove design. However, the BC emissions of the first batch even from the stoves with the lowest emission are substantial. More research is needed in order to uncover the factors affecting BC formation and oxidation in SS. A better understanding of these factors would provide a basis for developing wood combustion appliances (SS and other) with lower BC emissions.
3.4. OC and PAH Concentrations
Particulate organic emissions varied remarkably between studied cases (see e.g.,
Figure S3). The variation of PAH emissions was especially high between studied cases (
Figure 5). When using dry birch wood, OC and total PAH concentrations were 27 times and 89 times higher from the highest emission stove (S6) than from the lowest emission stove (S9), respectively (
Table 3 and
Table 4).
The differences between single PAH compounds were even higher. E.g., BaP concentration varied from 4 to 1400 µg/Nm
3 between different experiments. Thus, the combustion technology/completeness of combustion likely affects the human health effects of emissions remarkably. OC and total PAH concentrations correlated linearly rather well, and thus OC gives indication also for the level of PAH emissions. The most general PAH compounds were Pyr (on average 11% of total PAHs), Fla (9.6%), BaA (8%), BaP (7.9%), Chr (7.4%), and BbF (7.2%). The mass fractions of BcP, CcdP, BkF, BjF, BeP, I123cdP, and BghiP of the total analyzed PAH were between 3%–6% and the mass fractions of Phe, Tri, Per, DahA, Antha, and Cor were 1%–3%, respectively. Mass fractions of other single PAH (10 compounds) were minor (below 1% of total PAH). Portion of genotoxic PAH of the total PAH concentration was constant, 87%, independent of PAH concentration or combustion appliance. Additionally, the distribution of PAHs was independent of appliance model. This is in agreement with Nyström et al. [
31] who observed that PAH profile is independent on burning conditions or wood fuel species.
For S2, S6, and S8 (high PM
1), organic material dominated the chemical composition of particles. In addition, the mass fraction of PAH of PM
1 was high, 3.5%–3.8% in these stoves. In literature, there is high variation between portions of PAH of PM
1 in different combustion appliances and conditions (
Figure 5), depending on the combustion conditions. From pellet appliances, the PAH portion is typically below 0.1%, whereas in smoldering combustion conditions, the portion can be almost 10%. However, the PAH concentration and the PAH portion of PM
1 have a clear connection (
Figure 5) and it seems that when PM
1 is high, also PAH emission is high. In the range higher than 1000 µg/Nm
3, the portion of PAH of PM
1 is drastically increased. Interestingly, it may indicate some kind of threshold, which is dependent on combustion conditions and could be used for evaluation of health and climate effects of particulate matter, e.g., in development of future combustion technologies. In this study, real time organic particle measurements that could further reveal the mechanisms behind this phenomenon were not possible. However, according to previous studies, particulate organic matter is mainly emitted during the ignition phase and especially after the addition of wood logs in batch combustion processes (e.g., [
36]).
3.5. Particle Number Concentration
Particle number concentrations measured by the CPC varied only slightly, from 3.1 × 10
7 #/Ncm
3 to 6.1 × 10
7 #/Ncm
3. Particle number size distributions were unimodal for most of the time, varied strongly between the combustion phases, and were always dominated by submicron particles. The typical mode size during first batch varied between 70 and 200 nm, and the largest mode sizes were observed with high emission stoves after the adding of fuel (~300 nm) while smallest modes occurred during the phases of glowing embers phase (typically 50–80 nm) (see
Supplementary Material, Figure S5). Typically, number concentrations were extremely high just after ignition. The particle number concentration did not correspond with the completeness of combustion. On the contrary, the lowest number concentrations were found when the PM
1, BC, and PAH concentrations were the highest (see
Figure S4). In previous studies, it has also been observed that the particle number concentration was related to the particle size; incomplete combustion produced lower particle number emissions but larger particle sizes than more complete combustion [
25]. A possible explanation for this is that at high emission concentrations the prevailing high soot particle concentrations in the flue gas provide surface area for condensation of volatile ash species which in turn decreases nucleation of new ash particles in the cooling flue gas, which has been earlier suggested as the main mechanism responsible for the particle number emission [
10,
52].
3.6. CO, NO, and VOC Concentrations
Concentrations of CO, NO, and single VOC compounds are presented in
Table 5. The lowest CO concentrations were measured from S1 and the highest from S6. CO levels were similar to other RWC appliances, and varied between 1900 and 7000 mg/Nm
3. For WS, CO levels of 1600 to 10,700 mg/Nm
3 as an average of the whole combustion cycle have been reported [
53,
54], whereas masonry heaters have produced from 1100 to 5500 mg/Nm
3 of CO, depending on combustion technology [
25]. CO concentrations were high during the first batch, but in contrast to particle concentrations, levels were high also during glowing embers phase. High peaks were also observed after the addition of fuel from high emission SS (S2, S3, S6, S8). The CO emissions from glowing embers could be decreased by optimizing the fuel addition timing because this decreases the period of “flameless combustion”, when residual char burning is solely dominated by oxygen diffusion-limited char gasification, leading to high CO formation. The emissions from embers were problematic especially for S10, which was not equipped with a grate, and therefore the penetration of combustion air into the char bed is less optimal.
The variation of NO concentrations between the stoves was minor. This in mainly due to the fact that NOx compounds in flue gas are formed from fuel nitrogen in RWC. At high temperatures (over 1400 °C), NOx is also formed from N
2 in combustion air, but this is unlikely in RWC. VOC data from FTIR was not available from all tests, but high differences in VOC emissions between studied cases were observed as in other emission components. For example, a 56-fold difference was found between S6 and S10 regarding CH
4 concentrations (
Table 5). The six most abundant single VOCs were methane, propene, benzene, ethylene, acetic acid, and 1,3-butadiene, and the relative portions of these compounds of the total VOC were, on average, 23.9%, 14.3%, 12.4%, 11.1%, 9.6%, and 9.3%, respectively, comprising more than 80% of measured VOC compounds by FTIR.
3.7. Effect of Fuel Moisture on the Emissions
The effect of fuel moisture content on emissions was studied with S1 and S8 (low and high emission stoves). Using moist birch wood extended the combustion time and lowered the flue gas and sauna temperature (see
Figure S2). In addition, the air-to-fuel ratio was higher with moist wood than dry wood fuel (
Table 2). Thus, the thermal efficiency was lower with moist wood especially in S1 (difference 8.4%).
Fuel moisture content had a clear effect on the emissions. When using moist (18%) wood, CO concentrations increased 1.35- and 1.15-fold in S1 and S8, respectively, when compared to dry fuel (11%). Similarly, particle number concentrations (measured by CPC) were 1.35 and 1.46 times higher in S1 and S8, respectively, than when using dry wood. In contrast, for other emission components, the emissions decreased clearly when using moist wood (18%) when compared to dry wood. In particular, PAH concentrations were 9.6-fold and 5.5-fold and BC concentrations 1.8-fold and 2.8-fold with dry wood (11%) compared with moist (18%) wood in S1 and S8, respectively. When using wet wood (28%), PAH, OC, and BC emissions were higher than with moist wood, but lower than with dry wood, except for OC. When using moist wood, OC was slightly higher than with dry wood, but the ratio of OC/EC clearly increased (from 0.18 to 0.41) due to lower EC concentrations. Interestingly, the portion of PAHs of PM1 was clearly lower with moist wood than with dry wood. It has to be noted that in the CE testing standards for most of the RWC appliances the permitted moisture content of wood is between 12% and 20%. Hence, according to this study, the fuel moisture content should be always taken into account when RWC emission measurements are conducted.
Based on literature, it is difficult to find a clear conclusion on the effect of fuel moisture on the emissions. Shen et al. [
55] tested poplar wood (moisture contents of 5%, 14%, and 27%) in a brick cooking stove and found that except for EC, emissions increased when fuel moisture content increased. Price-Allison et al. [
56] investigated a freshly felled wood, a seasoned wood, and a kiln dried wood, and observed that, generally, PM emissions increased when wood moisture content increased. However, the result was partially dependent on fuel species. With beech, PM emissions were the lowest with seasoned wood. In straw combustion, Korenaga et al. [
57] reported that emission of PAHs was the highest for dry crop straw, and the lowest value was observed with moisture content of 15%, after that (moisture content >20%), PAH emissions again increased. Our study supports these observations.
One possible explanation for the effect of fuel moisture on BC is that increasing moisture content decreases flame temperatures, and the formation of soot from PAH precursors was inhibited by low flame temperatures. This is because the conversion of simple precursors to more complex PAHs and further into nascent soot is a temperature-driven process and lower flame temperatures might have inhibited the formation of heavier aromatic compounds which serve as precursor of soot [
58]. For example, Nielsen et al. [
59] suggested that decreased local flame temperatures due to air-starved conditions decreased the conversion of PAHs into nascent soot. Furthermore, increasing moisture can lead to enhanced OH-radical formation in the oxidizing flame conditions, improving the burnout of soot and/or its precursors.
3.8. Effect of Fuel Species and Bark on the Emissions
The effect of fuel species and bark on the emissions were studied from S8. The PM
1 concentration was the highest with alder and birch (with bark) and the lowest with spruce wood (
Figure 6). The EC emissions were lowest with spruce. The CO concentration was the lowest with pine and spruce and the highest with alder. The NO concentration was clearly highest with alder. In general. the effect of bark on the emissions was minor. The clearest effect was found from NO emissions, which were 13%–30% lower without bark than with bark wood logs. This is probably due to higher N content in bark than in stem wood [
60]. For PM
1, EC, and CO, the concentrations without bark were higher than those with bark with spruce and pine, whereas these were lower with alder and birch. Taking into account all experiments, the maximum differences between the tests were 2–3-fold with different wood species. Maximum differences were about 1.5-fold between the tests with and without barks. Overall, wood species and bark have effects on the emissions, but wood species is more important. In general, wood bark material as a fuel is known to cause higher PM emissions than stem wood, due to its high ash content [
53]. However, the amount of bark in logwood is so small that other effects influencing the quality of combustion are more important.
3.9. Emission Inventories
The average emission factors for PM
1 and BC obtained in this study were considerably lower than those previously used in emission inventories (
Table 6). This indicates that substantial development has occurred in the sauna stove technology during the 2010s. The large variation in emissions between sauna stoves also prompted to further inspect the previously used emission factors, since they were based on a limited sample of models. We coined the term modern sauna stove to represent the appliances that have been on the market since the introduction of the CE-labeling in 2013. The emission factors for conventional sauna stoves were also changed. In our revised inventory data from all previous measurements [
9,
10,
11,
26,
61,
62] conducted in Finland are included to extend the data of conventional SS. Emission factors for BC in conventional sauna stoves were estimated as a percentage of PM
1, using the results of this study. The emission factor for PM
1 in smoldering combustion was estimated to be three times higher than in normal combustion. The studied smoldering combustion conditions were representing typical user mistakes, which lead to higher emissions. The changes in the emission calculation scheme will be implemented in future editions of the national emission inventory.
We estimated that the share of modern sauna stoves would be 15% in 2015 and 97% in 2030. Using the projected wood consumption presented in Savolahti et al. [
8], we recalculated the PM
2.5 and BC emissions from SS for 2015 and 2030 (
Figure 7). The new estimate for PM
2.5 emissions was 39% lower than the previous one, mainly due to the changed emission factor of conventional sauna stoves. New projection for PM
2.5 emissions in 2030 was 71% lower than the previous one, since most of the conventional sauna stoves were assumed to be replaced by modern sauna stoves by then.
Within the specific appliance groups, sauna stoves remain the largest source of both PM
2.5 and BC emissions in the updated 2015 estimate, but not in 2030. Savolahti et al. [
8] estimated that emissions from sauna stoves would remain close to current levels in 2030, and that implementing regulations to force less-emitting stoves on the market would produce considerable emission reductions. According to this study, these less-emitting stoves are already on the market, and the emissions might decrease even without measures. However, uncertainties remain, as there was a significant variation in the emissions of the measured models (a factor of nine between the lowest and the highest emissions). No data was available on what models have been the most popular, and we opted to use the average emission factors over all the measured models. The large variation in emissions between the models shows that there still exists huge reduction potential in the emissions of sauna stoves. This potential could be realized if the share of the least polluting models could be increased. Before any possible incentives can be created, a coherent and practical method to test particle emissions from the stoves should be validated.
4. Conclusions
In this study, a new measurement concept for comparing the operation, thermal efficiency, and real-life fine particle and gaseous emissions of SS was utilized. In addition, a novel, simple, and universal emission calculation procedure for the determination of nominal emission factors was developed for which the equations are presented for the first time. Fine particle and gaseous concentrations from 10 different types of SS were investigated. It was found that each SS model was an individual in relation to stove performance: stove heating time, air-to-fuel ratio, thermal efficiency, and emissions. It was also observed that the thermal efficiency is not directly connected with the emissions and the maximum temperature of the sauna room (e.g., because of different heat storing capacities of the stoves). The average thermal efficiency of stoves was 63% and was typically higher with high emission stoves than low emission stoves.
Nine-fold differences in fine particle mass (PM
1) concentrations, and about 90-fold differences in polycyclic aromatic hydrocarbons (PAH) concentrations were found between the SS, when dry (11% moisture content) birch wood was used and, thus, there is a huge potential to decrease emissions by developing stoves. The structural properties of stoves (amount of stones, firebox design, grate, flue gas ducts and its lengths, secondary air, etc.) had an effect on operational parameters of saunas (e.g., room temperature) and emissions but it was not possible to clarify them in this study. However, the effect of grate seemed to be minor, and, moreover, secondary air did not lead to clearly lower emissions in all cases when comparing SS models without secondary air supply. This is in contrast to earlier studies on the effects of secondary air supply in logwood fired masonry heaters [
32,
63] in which air-staging caused substantial emission reductions. In the appliances with low emissions, the ignition and emissions during first batch are the most important phases, whereas in the high emission stoves, a larger portion of emissions was emitted during the second and third batch. Therefore, the SS physical design, influencing wood gasification rate, temperature conditions, combustion air mixing, and combustion gas residence times, affects emission formation and burnout in a complicated manner.
The particle chemical composition from the low emission stoves was comparable with the particle properties of modern masonry heaters and modern stoves, where EC dominates the particulate emissions and OC content was minor. The results of this study show that it is possible to achieve surprisingly low BC emissions from sauna stoves. However, the BC emissions of the first batch even from the stoves with the lowest overall emission are substantial. More research is needed in order to uncover the mechanisms behind BC formation and oxidation in RWC appliances.
The moisture content of wood logs had a remarkable effect on the emissions of stoves. By using moist (18%) wood, particle number and carbon monoxide concentrations increased, but interestingly, PM1, PAH, and black carbon (BC) concentrations clearly decreased when comparing to dry wood. E.g., PAH concentrations were 5.5–9.6 times higher with dry wood than with moist wood. Thus, fuel moisture content should be taken into account more accurately in testing standards and when comparing emission results. Between wood species, 2–3-fold maximum differences in the emissions were found, whereas about 1.5-fold differences were observed between bark-containing and debarked wood logs.
The results are used to update the Finnish emission inventories. The average PM1-concentration was 151 mg/Nm3, which is clearly lower than that used in emission inventories at the moment. This suggests that, overall, the designs of sauna stoves available on the market have improved during the 2010s. The findings of this study were used to update the calculation scheme behind the inventories, causing the estimates for total PM emissions from SS in Finland to decrease by almost 40% in 2015. Furthermore, PM2.5 emissions from SS are projected to decrease significantly by the 2030 due to the renewal of appliances. However, wood-fired sauna stoves are still estimated to be the highest individual emission source of fine particles and black carbon in Finland.

 ,
, 


