Nanoparticle Behaviour in an Urban Street Canyon at Different Heights and Implications on Indoor Respiratory Doses


Abstract
1. Introduction
2. Experiments
2.1. Aerosol Measurements
2.2. Aerosol Dosimetry
3. Results and Discussion
3.1. Aerosol Measurements
3.2. Aerosol Dosimetry
4. Conclusions
Supplementary Materials
Author Contributions
Funding
Acknowledgments
Conflicts of Interest
Abbreviations
| Fin | the particle infiltration factor |
| da | aerodynamic diameter |
| dai | aerodynamic diameter of the ith aerosol size class |
| dm | electrical mobility diameter |
| Cc | Cunningham slip factor |
| ρ0 | reference density (1 g cm−3) |
| ρ | particle density |
| χ | particle dynamic shape factor |
| H | head region of the respiratory system |
| TB | tracheobronchial region of the respiratory system |
| R | region of the respiratory system (R = H, TB, Al) |
| Al | alveolar region of the respiratory system |
| FR(dai) | particle regional deposition fractions per as a function of the aerodynamic diameter |
| Vt | tidal volume |
| CTot | Outdoor aerosol total number concentrations (1 s time resolution) |
| t | time |
| tr | indoor residence time |
| texp | exposure time to outdoor aerosol and period of operation of indoor aerosol emission sources |
| tday | daily time spent indoor |
| C(dai,t) | average aerosol concentration over a single inspiratory act as a function of time and of aerodynamic diameter |
| DR(dai,t) | aerosol number doses deposited in the regions R of the respiratory system, as functions of time (t) and of the aerodynamic diameter |
| total regional aerosol doses | |
| total aerosol doses deposited into the respiratory system | |
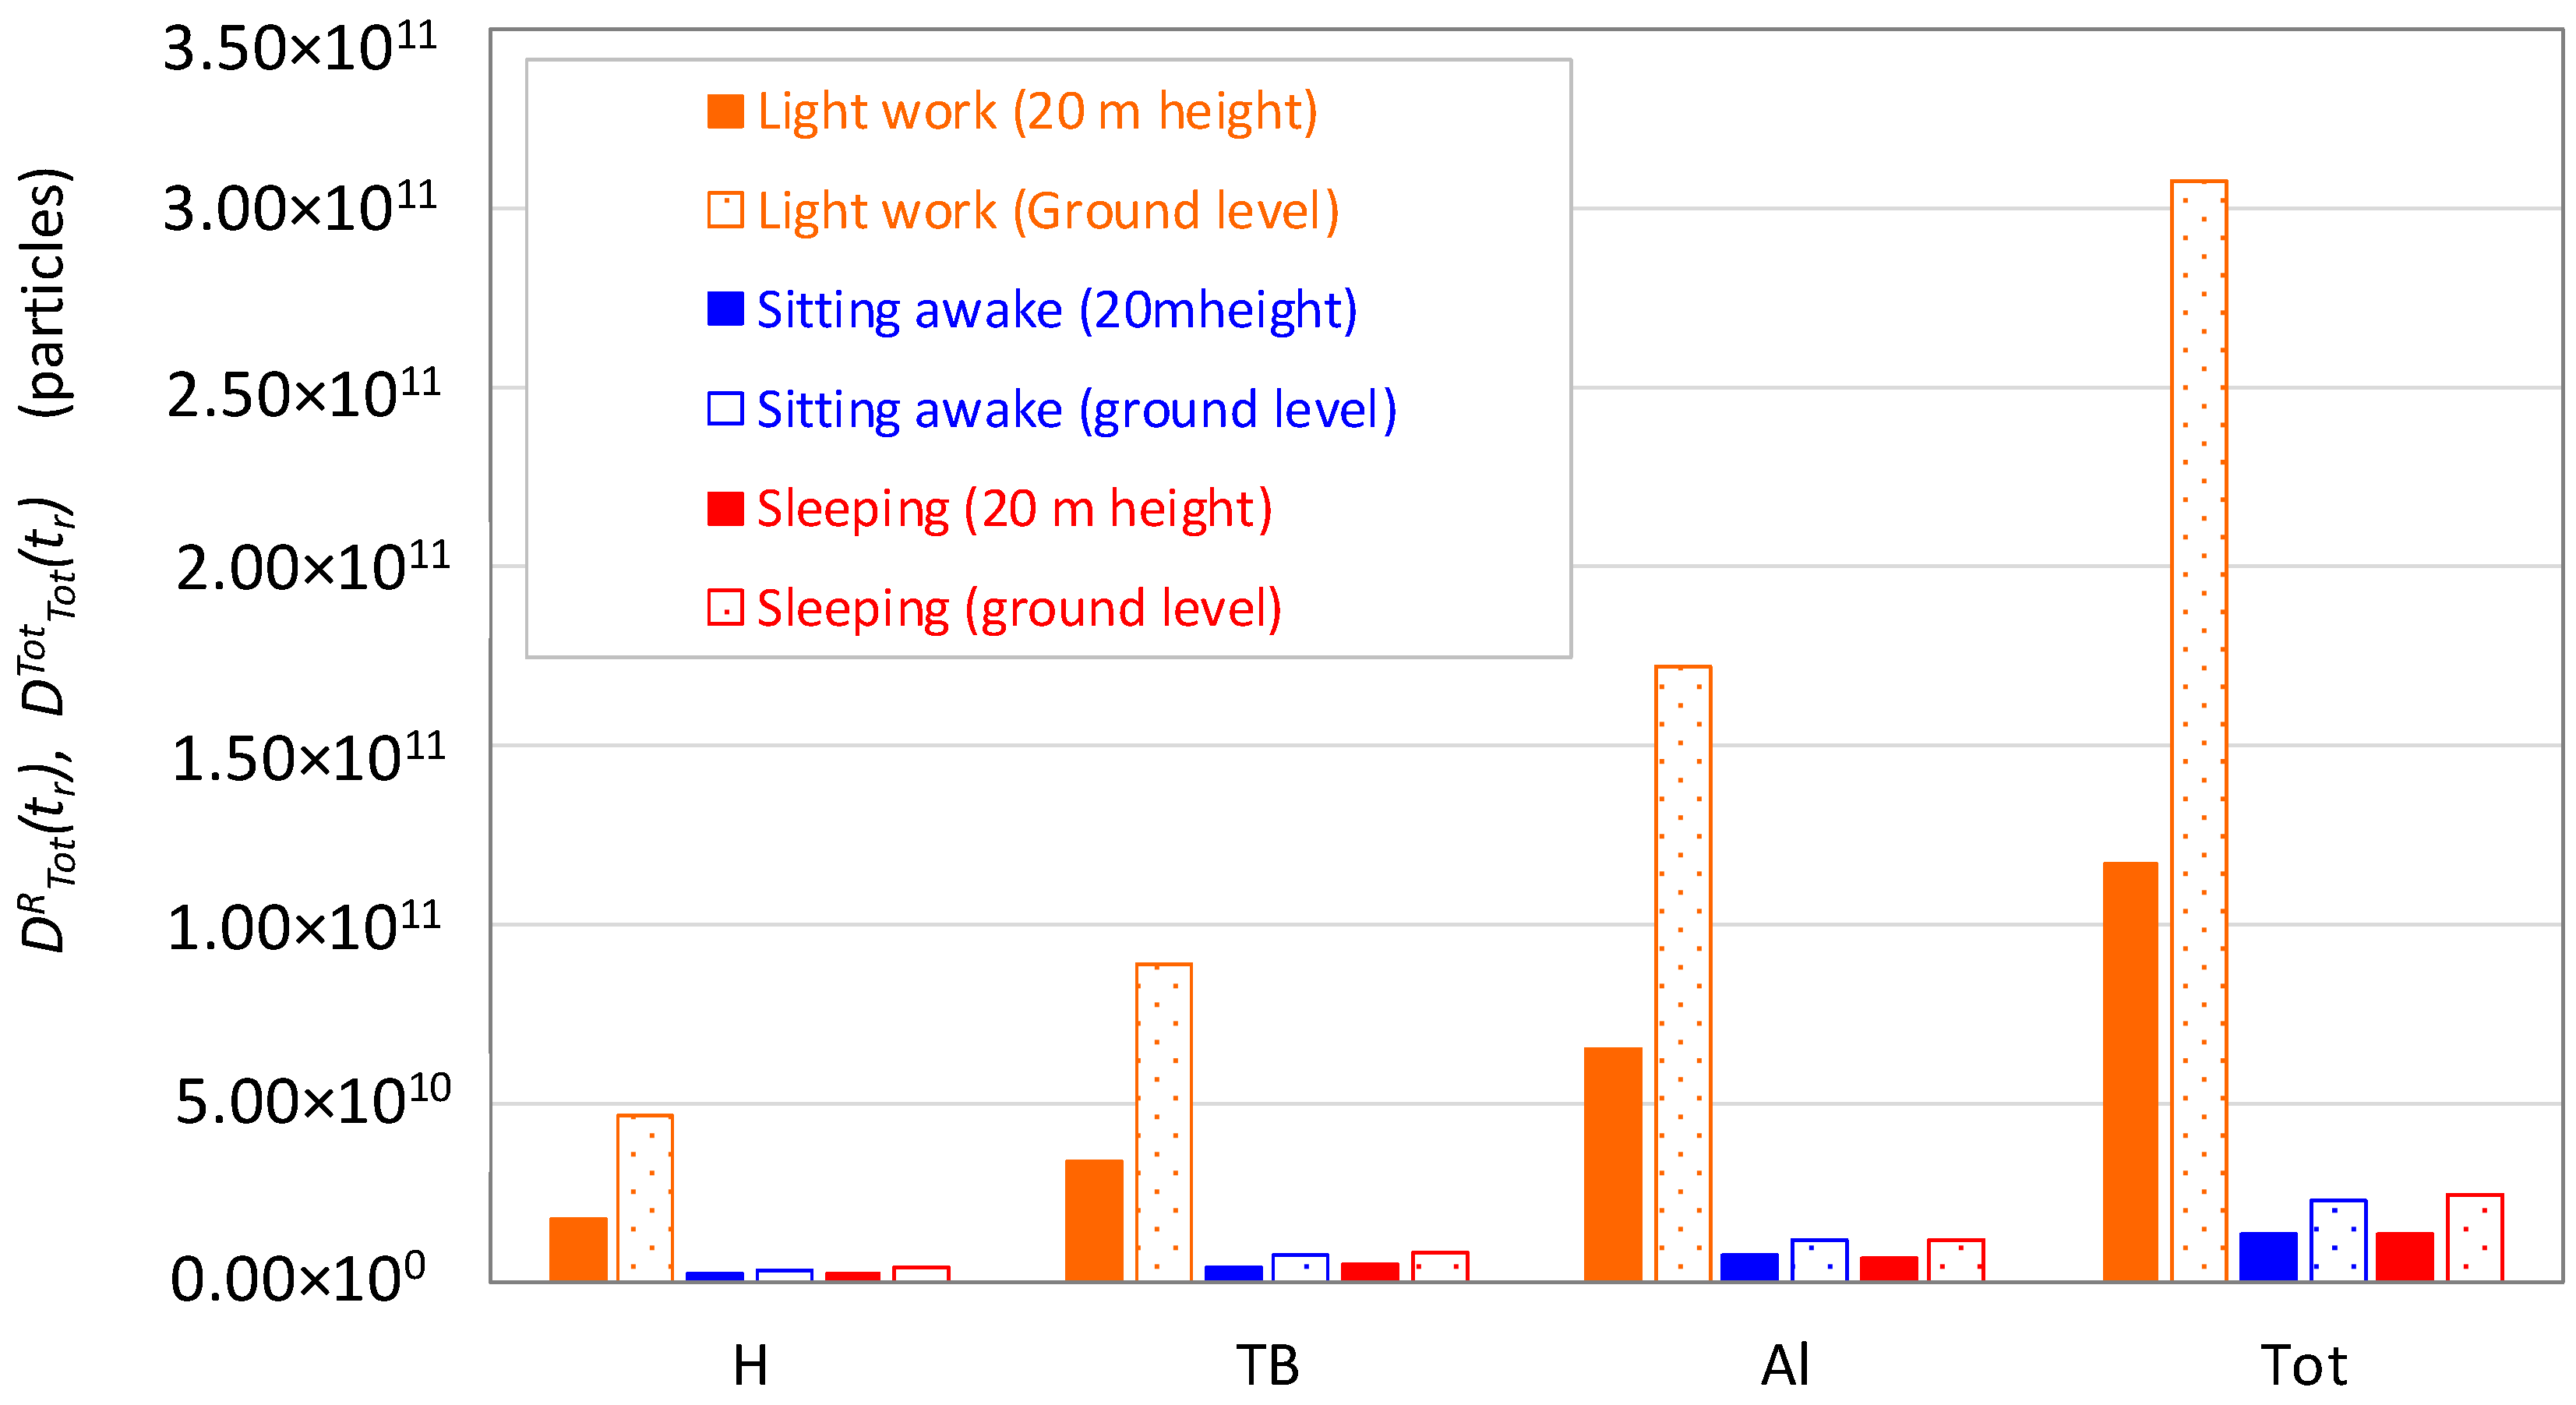
| cumulative regional doses over a given indoor residence time (tr) | |
| cumulative total doses over a given indoor residence time | |
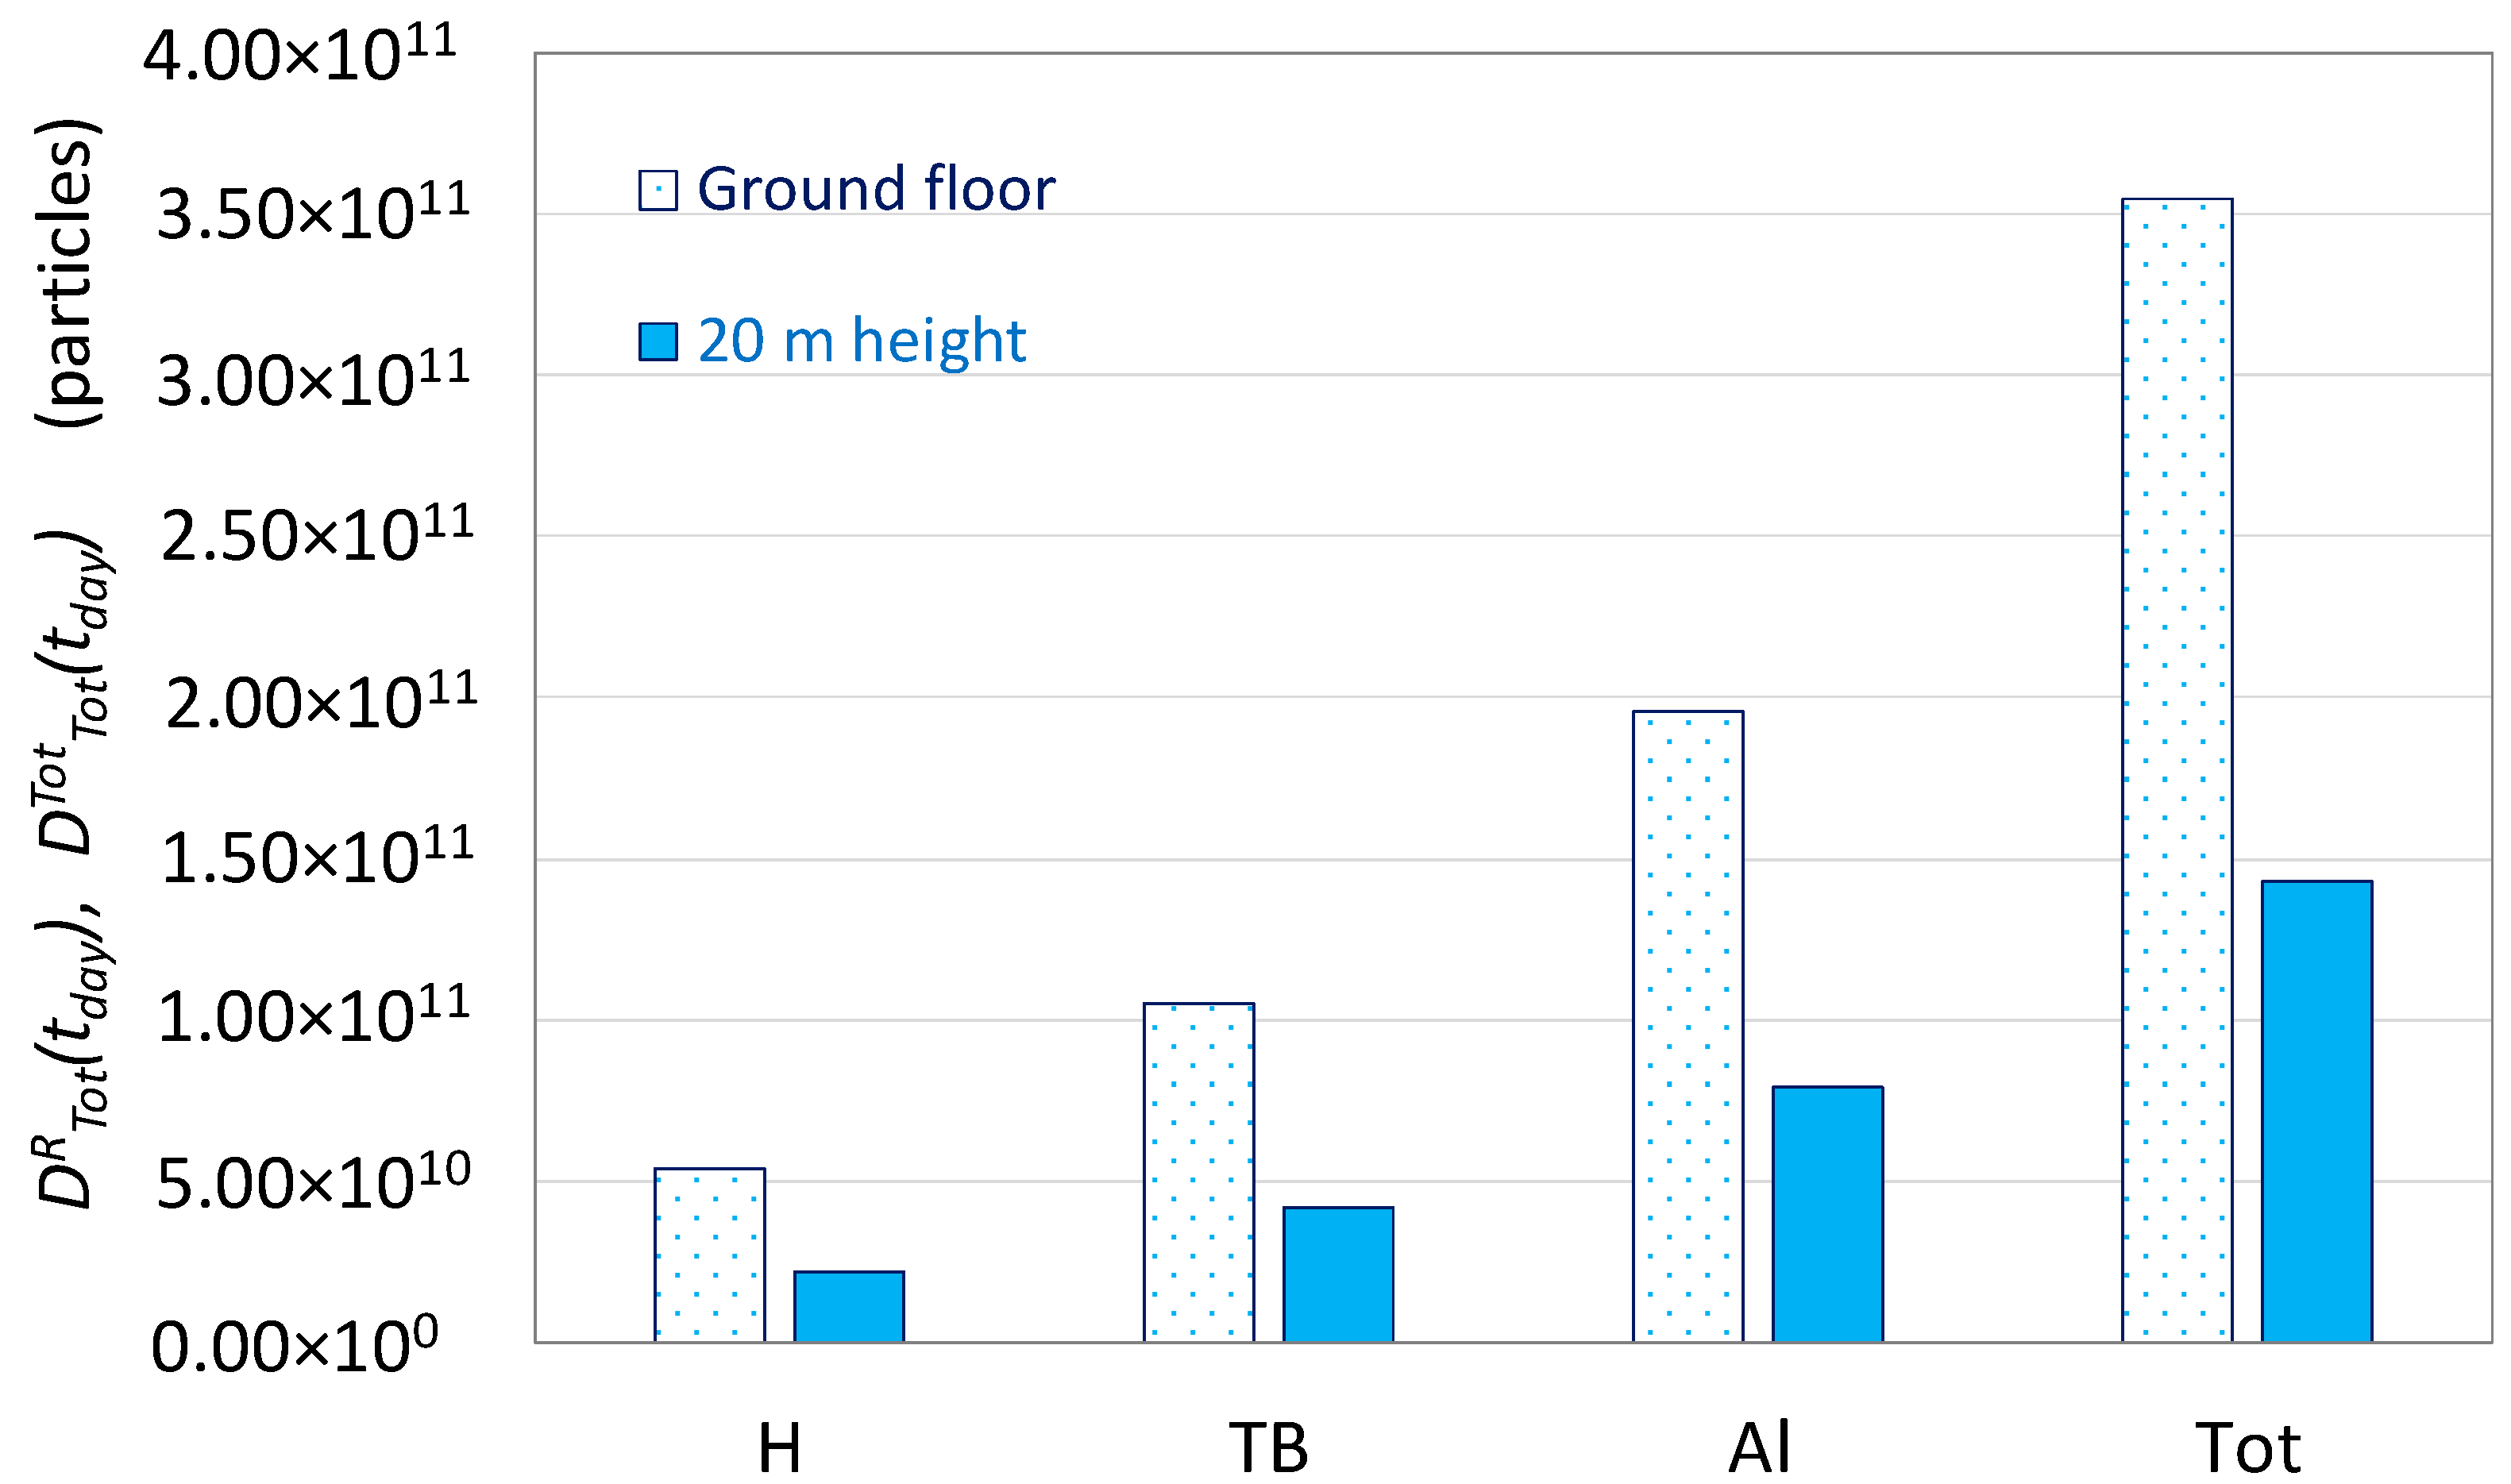
| cumulative regional daily dose | |
| cumulative total daily dose | |
| cumulative regional daily dose per unit time (tday) | |
| cumulative total doses over a given exposure time to outdoor aerosol or during the period of indoor emission sources operation | |
| per unit time (texp) | |
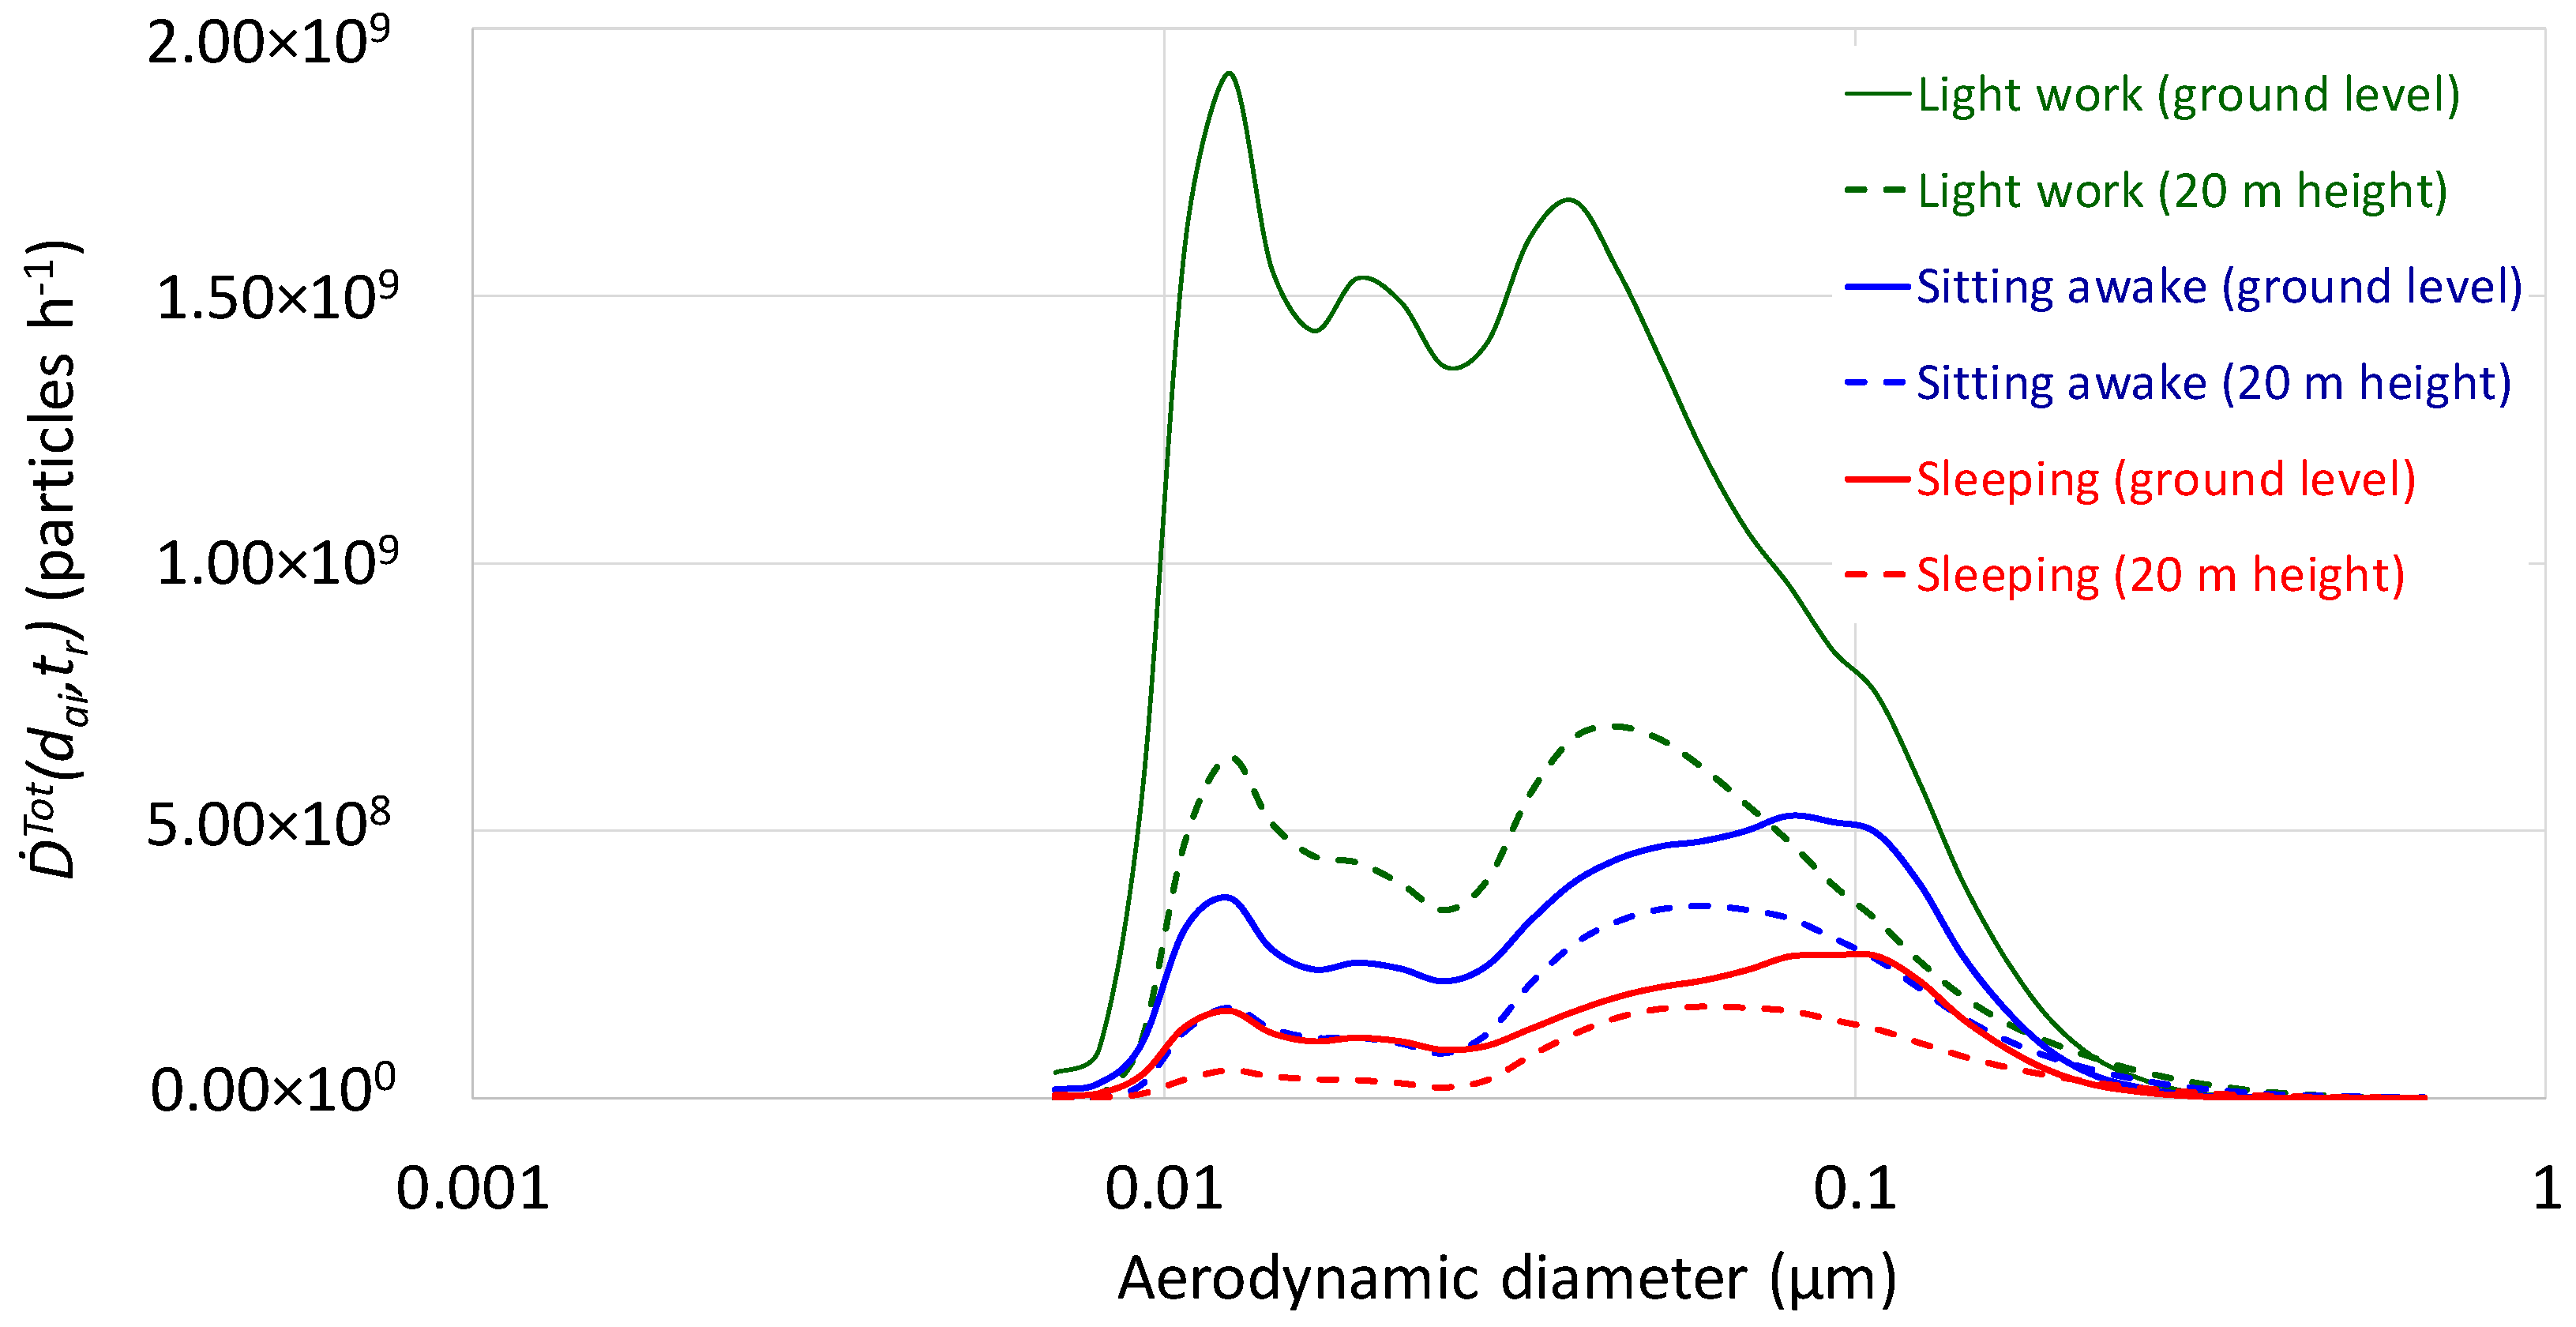
| cumulative total dose size distribution over a given indoor residence time | |
| PBL | planetary boundary layer |
| GMD | geometric mean diameter |
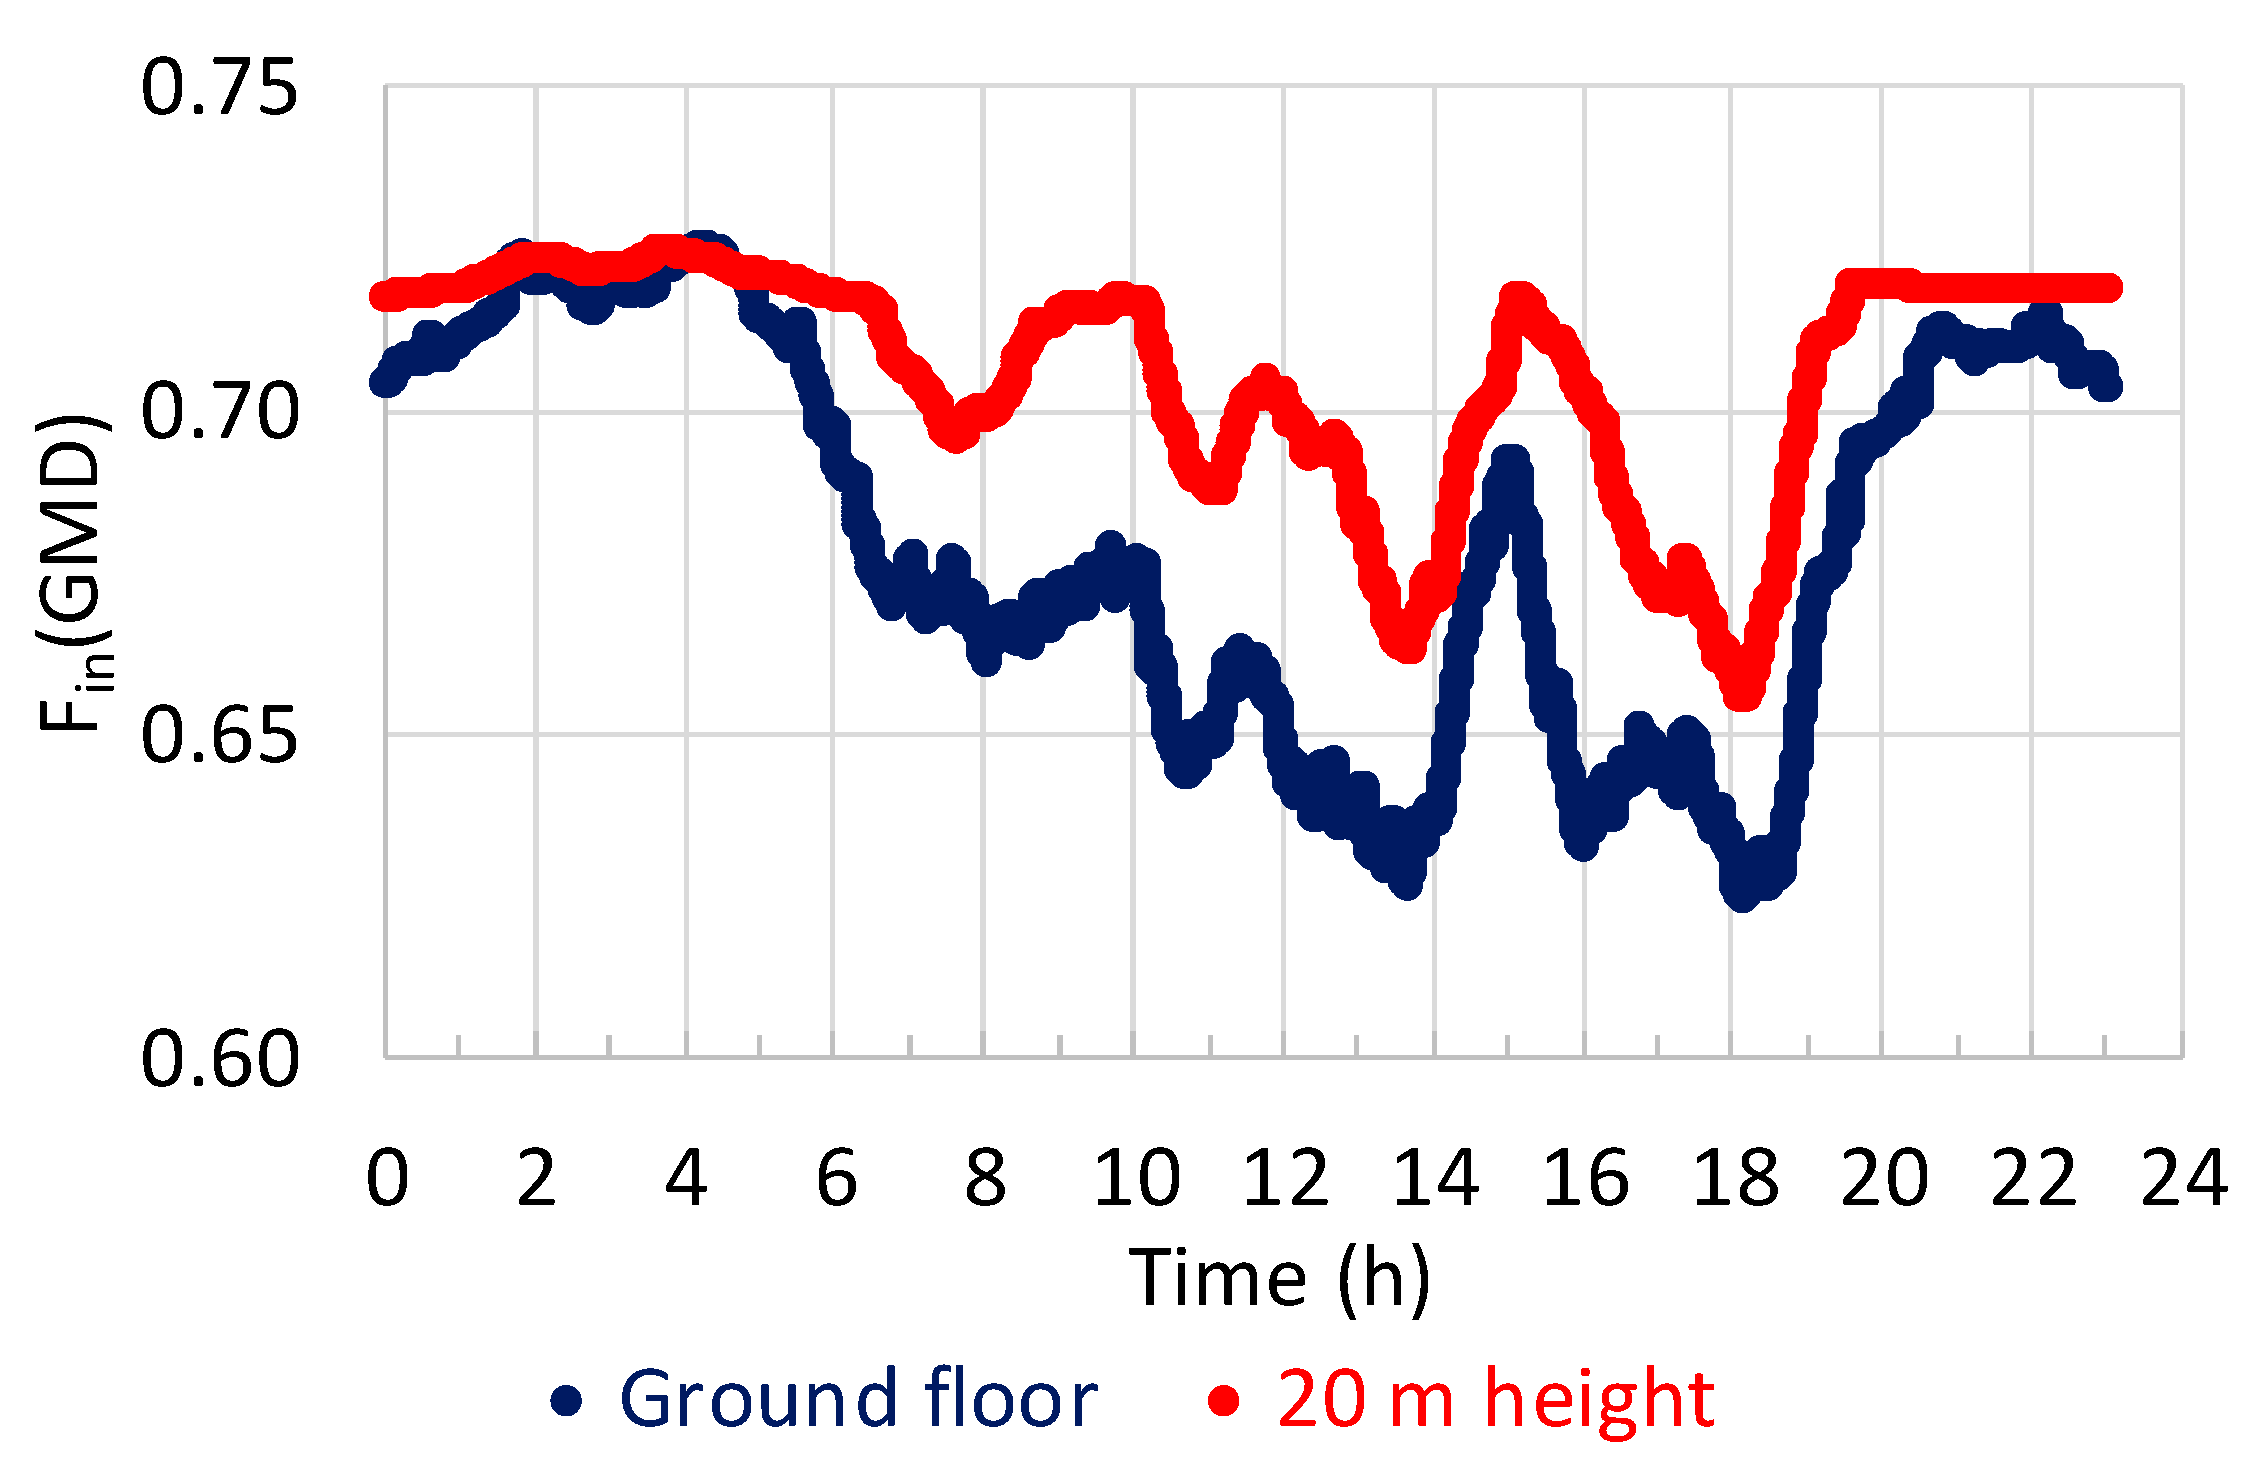
| Fin(GMD) | 1h mobile average infiltration factor calculated at the GMD |
References
- World Health Organization (WHO). Air Pollution. Available online: https://www.who.int/airpollution/en/ (accessed on 18 September 2019).
- Lehtomäki, H.; Korhonen, A.; Asikainen, A.; Karvosenoja, N.; Kupiainen, K.; Paunu, V.; Savolahti, M.; Sofiev, M.; Palamarchuk, Y.; Karppinen, A.; et al. Health Impacts of Ambient Air Pollution in Finland. Int. J. Environ. Res. Public Health 2018, 15, 736. [Google Scholar] [CrossRef] [PubMed]
- Tang, C.S.; Wu, T.Y.; Chuang, K.J.; Chang, T.Y.; Chuang, H.C.; Candice Lung, S.; Chang, L.T. Impacts of In-Cabin Exposure to Size-Fractionated Particulate Matters and Carbon Monoxide on Changes in Heart Rate Variability for Healthy Public Transit Commuters. Atmosphere 2019, 10, 409. [Google Scholar] [CrossRef]
- Wang, Y.; Xiong, L.; Tang, M. Toxicity of inhaled particulate matter on the central nervous system: Neuroinflammation, neuropsychological effects and neurodegenerative disease. J. Appl. Toxicol. 2017, 37, 644–667. [Google Scholar] [CrossRef] [PubMed]
- International Agency for Research on Cancer (IARC). Monographs on the Evaluation of Carcinogenic Risks to Humans. International Agency for Research on Cancer. In Outdoor Air Pollution; WHO Press: Lyon, France, 2015; Volume 109. Available online: http://monographs.iarc.fr/ENG/Monographs/vol109/index.php (accessed on 10 September 2019).
- Brauer, M.; Koutrakis, P.; Spengler, J.D. Personal exposures to acidic aerosols and gases. Environ. Sci. Technol. 1989, 23, 1408–1412. [Google Scholar] [CrossRef]
- Isaxon, C.; Gudmundsson, C.; Nordin, E.Z.; Lönnblad, L.; Dahl, A.; Wieslander, G.; Bohgard, M.; Wierzbicka, A. Contribution of indoor-generated particles to residential exposure. Atmos. Environ. 2015, 106, 458–466. [Google Scholar] [CrossRef]
- Heo, J.; Wu, B.; Abdeen, Z.; Qasrawi, R.; Sarnat, J.A.; Sharf, G.; Shpund, K.; Schauer, J.J. Source apportionments of ambient fine particulate matter in Israeli, Jordanian, and Palestinian cities. Environ. Pollut. 2017, 225, 1–11. [Google Scholar] [CrossRef]
- Pagano, P.; De Zaiacomo, T.; Scarcella, E.; Bruni, S.; Calamosca, M. Mutagenic activity of total and particle-sized fractions of urban particulate matter. Environ. Sci. Technol. 1996, 30, 3512–3516. [Google Scholar] [CrossRef]
- Li, N.; Sioutas, C.; Cho, A.; Schmitz, D.; Misra, C.; Sempf, J.; Wang, M.; Oberley, T.; Froines, J.; Nel, A. Ultrafine particulate pollutants induce oxidative stress and mitochondrial damage. Environ. Health Perspect. 2003, 11, 455–460. [Google Scholar] [CrossRef]
- Chen, R.; Hu, B.; Liu, Y.; Xu, J.; Yang, G.; Xu, D.; Chen, C. Beyond PM2.5: The role of ultrafine particles on adverse health effects of air pollution. Biochim. Biophys. Acta 2016, 1860, 2844–2855. [Google Scholar] [CrossRef]
- Manigrasso, M.; Protano, C.; Vitali, M.; Avino, P. Where do Ultrafine Particles and Nano-Sized Particles come from? J. Alzheimers Dis. 2019, 68, 1371–1390. [Google Scholar] [CrossRef]
- Da Costa, E.; Oliveira, J.R.; Base, L.H.; de Abreu, L.C.; Filho, C.F.; Ferreira, C.; Morawska, L. Ultrafine particles and children’s health: Literature review. Paediatr. Respir. Rev. 2019. [Google Scholar] [CrossRef]
- Viitanen, A.-K.; Uuksulainen, S.; Koivisto, A.J.; Hämeri, K.; Kauppinen, T. Workplace measurements of ultrafine particles—A literature review. Ann. Work Expo. Health 2017, 61, 749–758. [Google Scholar] [CrossRef] [PubMed]
- Avino, P.; Protano, C.; Vitali, M.; Manigrasso, M. Benchmark study on fine-mode aerosol in a big urban area and relevant doses deposited in the human respiratory tract. Environ. Pollut. 2016, 216, 530–537. [Google Scholar] [CrossRef] [PubMed]
- Kangasniemi, O.; Kuuluvainen, H.; Heikkilä, J.; Pirjola, L.; Niemi, J.V.; Timonen, H.; Saarikoski, S.; Rönkkö, T.; Dal Maso, M. Dispersion of a Traffic Related Nanocluster Aerosol Near a Major Road. Atmosphere 2019, 10, 309. [Google Scholar] [CrossRef]
- Manigrasso, M.; Vernale, C.; Avino, P. Traffic aerosol lobar doses deposited in the human respiratory system. Environ. Sci. Pollut. Res. Int. 2017, 24, 13866–13873. [Google Scholar] [CrossRef]
- Manigrasso, M.; Natale, C.; Vitali, M.; Protano, C.; Avino, P. Pedestrians in traffic environments: Ultrafine particle respiratory doses. Int. J. Environ. Res. Public Health 2017, 14, 288. [Google Scholar] [CrossRef]
- Rodríguez, S.; Van Dingenen, R.; Putaud, J.-P.; Dell’Acqua, A.; Pey, J.; Querol, X.; Alastuey, A.; Chenery, S.; Ho, K.-F.; Harrison, R.; et al. A study on the relationship between mass concentrations, chemistry and number size distribution of urban fine aerosols in Milan, Barcelona and London. Atmos. Chem. Phys. 2007, 7, 2217–2232. [Google Scholar] [CrossRef]
- Buonanno, G.; Fuoco, F.C.; Stabile, L. Influential parameters on particle exposure of pedestrians in urban microenvironments. Atmos. Environ. 2011, 45, 1434–1443. [Google Scholar] [CrossRef]
- Koivisto, A.J.; Jensen, A.C.Ø.; Kling, K.I.; Nørgaard, A.; Brinch, A.; Christensen, F.; Jensen, K. Quantitative material releases from products and articles containing manufactured nanomaterials: Towards a release library. Nanoimpact 2017, 5, 119–132. [Google Scholar] [CrossRef]
- Manigrasso, M.; Vitali, M.; Protano, C.; Avino, P. Temporal evolution of ultrafine particles and of alveolar deposited surface area from main indoor combustion and non-combustion sources in a model room. Sci. Total Environ. 2017, 598, 1015–1026. [Google Scholar] [CrossRef]
- Protano, C.; Manigrasso, M.; Avino, P.; Vitali, M. Second-hand smoke generated by combustion and electronic smoking devices used in real scenarios: Ultrafine particle pollution and age-related dose assessment. Environ. Int. 2017, 107, 190–195. [Google Scholar] [CrossRef] [PubMed]
- Manigrasso, M.; Vitali, M.; Protano, C.; Avino, P. Ultrafine particles in domestic environments: Regional doses deposited in the human respiratory system. Environ. Int. 2018, 118, 134–145. [Google Scholar] [CrossRef] [PubMed]
- Koivisto, A.J.; Kling, K.I.; Fonseca, A.S.; Bluhme, A.B.; Moreman, M.; Yu, M.; Costa, A.L.; Giovanni, B.; Ortelli, S.; Fransman, W.; et al. Dip coating of air purifier ceramic honeycombs with photocatalytic TiO2 nanoparticles: A case study for occupational exposure. Sci. Total Environ. 2018, 630, 1283–1291. [Google Scholar] [CrossRef] [PubMed]
- Manigrasso, M.; Protano, C.; Astolfi, M.L.; Massimi, L.; Avino, P.; Vitali, M.; Canepari, S. Evidences of copper nanoparticle exposure in indoor environments: Long-term assessment, high-resolution field emission scanning electron microscopy evaluation, in silico respiratory dosimetry study and possible health implications. Sci. Total Environ. 2019, 653, 1192–1203. [Google Scholar] [CrossRef] [PubMed]
- Hubal, E.A.C.; Sheldon, L.S.; Burke, J.M.; McCurdy, T.R.; Berry, M.R.; Rigas, M.L.; Zartarian, V.G.; Freeman, N.C. Children’s exposure assessment: A review of factors influencing children’s exposure, and the data available to characterize and assess that exposure. Environ. Health Perspect. 2000, 108, 475–486. [Google Scholar] [CrossRef]
- Morawska, L.; Ayoko, G.A.; Bae, G.N.; Buonanno, G.; Chao, C.Y.H.; Clifford, S.; Fu, S.C.; Hänninen, O.; He, C.; Isaxon, C.; et al. Airborne particles in indoor environment of homes, schools, offices and aged care facilities: The main routes of exposure. Environ. Int. 2017, 108, 75–83. [Google Scholar] [CrossRef]
- Śmiełowska, M.; Marć, M.; Zabiegała, B. Indoor air quality in public utility environments-a review. Environ. Sci. Pollut. Res. 2017, 24, 11166–11176. [Google Scholar] [CrossRef]
- Quang, T.N.; He, C.; Morawska, L.; Knibbs, L.D.; Falk, M. Vertical particle concentration profiles around urban office buildings. Atmos. Chem. Phys. 2012, 12, 5017–5030. [Google Scholar] [CrossRef]
- Goel, A.; Kumar, P. Vertical and horizontal variability in airborne nanoparticles and their exposure around signalised traffic intersections. Environ. Pollut. 2016, 214, 54–69. [Google Scholar] [CrossRef]
- Kuuluvainen, H.; Poikkimäki, M.; Järvinen, A.; Kuula, J.; Irjala, M.; Dal Maso, M.; Keskinen, J.; Timonen, H.; Niemi, J.V.; Rönkkö, T. Vertical profiles of lung deposited surface area concentration of particulate matter measured with a drone in a street canyon. Environ. Pollut. 2018, 241, 96–105. [Google Scholar] [CrossRef]
- TSI Particle Technology. 2009. Available online: https://www.tsi.com/mwg-internal/de5fs23hu73ds/progress?id=RIM4jnSl3c1lzZ_fGE6mizpum3DwsAGjm7nr4S7XilQ,&dl (accessed on 10 September 2019).
- Jeong, C.-H.; Greg, J.; Evans, G.J. Inter-comparison of a fast mobility particle sizer and a scanning mobility particle sizer incorporating an ultrafine water based condensation particle counter. Aerosol Sci. Technol. 2009, 43, 364–373. [Google Scholar] [CrossRef]
- Bennett, D.H.; Koutrakis, P. Determining the infiltration of outdoor particles in the indoor environment using a dynamic model. Aerosol Sci. 2006, 37, 766–785. [Google Scholar] [CrossRef]
- De Boor, C. A Practical Guide to Splines; Springer: New York, NY, USA, 1978. [Google Scholar]
- Hussein, T.; Löndahl, J.; Paasonen, P.; Koivisto, A.J.; Petäjä, T.; Hämeri, K.; Kulmala, M. Modeling regional deposited dose of submicron aerosol particles. Sci. Total Environ. 2013, 458, 140–149. [Google Scholar] [CrossRef] [PubMed]
- Asgharian, B.; Hofmann, W.; Bergmann, R. Particle deposition in a multiple-path model of the human lung. Aerosol Sci. Technol. 2001, 34, 332–339. [Google Scholar] [CrossRef]
- International Commission on Radiological Protection (ICRP). Publication 66: Human Respiratory Tract Model for Radiological Protection; Elsevier Science: Oxford, UK, 1994. [Google Scholar]
- Hussein, T.; Saleh, S.S.A.; dos Santos, V.N.; Boor, B.E.; Koivisto, A.J.; Löndahl, J. Regional Inhaled Deposited Dose of Urban Aerosols in an Eastern Mediterranean City. Atmosphere 2019, 10, 530. [Google Scholar] [CrossRef]
- Khlystov, A.; Stanier, C.; Pandis, S.N. An algorithm for combining electrical mobility and aerodynamic size distributions data when measuring ambient aerosol special issue of aerosol science and technology on findings from the fine particulate matter supersites program. Aerosol Sci. Technol. 2004, 38, 229–238. [Google Scholar] [CrossRef]
- Lipponen, P.; Hänninen, O.; Sorjamaa, R.; Gherardi, M.; Gatto, M.P.; Gordiani, A.; Cecinato, A.; Romagnoli, P.; Gariazzo, C. Aerosol Processes in PAH Infiltration and Population Exposure in Rome; EAC: Prague, Czech Republic, 2013. Available online: https://appsricercascientifica.inail.it/expah/documenti/Lipponen%20et%20al.2013.EAC%20Prague%20on%20EXPAH%20Slides(v5).pdf (accessed on 23 September 2019).
- Hänninen, O.; Sorjamaa, R.; Lipponen, P.; Cyrys, J.; Lanki, T.; Pekkanen, J. Aerosol-based modelling of infiltration of ambient PM2.5 and evaluation against population-based measurements in homes in Helsinki, Finland. J. Aerosol Sci. 2013, 66, 111–122. [Google Scholar] [CrossRef]
- Hu, M.; Peng, J.; Sun, K.; Yue, D.; Guo, S.; Wiedensohler, A.; Wu, Z. Estimation of size-resolved ambient particle density based on the measurement of aerosol number, mass, and chemical size distributions in the winter in Beijing. Environ. Sci. Technol. 2012, 46, 9941–9947. [Google Scholar] [CrossRef]
- Perrino, C.; Pietrodangelo, A.; Febo, A. An atmospheric stability index based on radon progeny measurements for the evaluation of primary urban pollution. Atmos. Environ. 2001, 35, 5235–5244. [Google Scholar] [CrossRef]
- Avino, P.; Manigrasso, M. Dynamic of submicrometer particles in urban environment. Environ. Sci. Pollut. Res. Int. 2017, 24, 13908–13920. [Google Scholar] [CrossRef]
- Manigrasso, M.; Febo, A.; Guglielmi, F.; Ciambottini, V.; Avino, P. Relevance of aerosol size spectrum analysis as support to qualitative source apportionment studies. Environ. Pollut. 2012, 170, 43–51. [Google Scholar] [CrossRef] [PubMed]
- Zhang, L.; Gong, S.; Padro, J.; Barrie, L. A size-segregated particle dry deposition scheme for an atmospheric aerosol module. Atmos. Environ. 2001, 35, 549–560. [Google Scholar] [CrossRef]
- Chen, C.; Zhao, B. Review of relationship between indoor and outdoor particles: I/O ratio, infiltration factor and penetration factor. Atmos. Environ. 2011, 45, 275–288. [Google Scholar] [CrossRef]
- Manigrasso, M.; Protano, C.; Martellucci, S.; Mattei, V.; Vitali, M.; Avino, P. Evaluation of the Submicron Particles distribution between mountain and urban site: Contribution of the transportation for defining environmental and human health issues. Int. J. Environ. Res. Public Health 2019, 16, 1339. [Google Scholar] [CrossRef] [PubMed]


© 2019 by the authors. Licensee MDPI, Basel, Switzerland. This article is an open access article distributed under the terms and conditions of the Creative Commons Attribution (CC BY) license (http://creativecommons.org/licenses/by/4.0/).
Share and Cite
Manigrasso, M.; Protano, C.; Vitali, M.; Avino, P. Nanoparticle Behaviour in an Urban Street Canyon at Different Heights and Implications on Indoor Respiratory Doses. Atmosphere 2019, 10, 772. https://doi.org/10.3390/atmos10120772
Manigrasso M, Protano C, Vitali M, Avino P. Nanoparticle Behaviour in an Urban Street Canyon at Different Heights and Implications on Indoor Respiratory Doses. Atmosphere. 2019; 10(12):772. https://doi.org/10.3390/atmos10120772
Chicago/Turabian StyleManigrasso, Maurizio, Carmela Protano, Matteo Vitali, and Pasquale Avino. 2019. "Nanoparticle Behaviour in an Urban Street Canyon at Different Heights and Implications on Indoor Respiratory Doses" Atmosphere 10, no. 12: 772. https://doi.org/10.3390/atmos10120772
APA StyleManigrasso, M., Protano, C., Vitali, M., & Avino, P. (2019). Nanoparticle Behaviour in an Urban Street Canyon at Different Heights and Implications on Indoor Respiratory Doses. Atmosphere, 10(12), 772. https://doi.org/10.3390/atmos10120772