The 2017–2018 Winter Drought in North China and Its Causes


1
Center for Monsoon System Research, Institute of Atmospheric Physics, Chinese Academy of Sciences, Beijing 100190, China
2
College of Earth and Planetary Sciences, University of Chinese Academy of Sciences, Beijing 100049, China
3
Public Meteorological Service Center, China Meteorological Administration, Beijing 100081, China
4
Joint Center for Global Change Studies, Beijing 100875, China
*
Author to whom correspondence should be addressed.
Atmosphere 2019, 10(2), 60; https://doi.org/10.3390/atmos10020060
Submission received: 13 January 2019
/
Revised: 26 January 2019
/
Accepted: 28 January 2019
/
Published: 1 February 2019
(This article belongs to the Special Issue Monsoons)
Abstract
:A meteorological drought was observed over North China in the 2017–2018 winter, which was accompanied by record-breaking consecutive non-precipitation days over many regions of central North China. Inspection on historical observations beginning in 1951 suggest that it was the fourth driest winter during the past 67 years. The possible cause of this drought was then analyzed. It has been suggested that the co-occurrence of the positive phase of the Eurasian (EU) teleconnection pattern and La Niña have played a crucial role. On one hand, both the positive phase of the EU pattern and La Niña could have enhanced the lower-tropospheric northerly winds over East Asia. The northward water vapor transport towards North China was thereby weakened, providing an unfavorable moisture environment for precipitation. On the other hand, the EU-like wave pattern in the mid-latitude was conducive to anomalous descending motion over mid-latitude East Asia, creating an unfavorable dynamical condition for precipitation. A combination of the above two effects lead to the occurrence of the North China drought in the 2017 winter.
1. Introduction
North China is one of the most populated regions and one of the main wheat-producing regions in China. Being located in the relatively dry temperate of East Asia, it often suffers from droughts due to the fluctuations of precipitation such as in the winters of 2008–2009 [1] and 2009–2010 [2]. In the winter of 2017–2018, precipitation was excessively below normal over central North China leading to a widespread meteorological drought over Beijing Municipality, Inner Mongolia Province, Hebei Province, and Shandong Province [3] (as seen in Figure 1). The number of consecutive non-precipitation days reached up to 145 days in Beijing from 23 October 2017 to 16 March 2018 and exceeded 120 days in parts of Inner Mongolia Province and Hebei Province, all of which break the records that can be traced to the early 1950s when the meteorological observation network in China was established. Understanding the causes of this wintertime drought is important not only for the scientific community but also for the operational climate centers.
The East Asian winter monsoon (EAWM) is a direct factor influencing wintertime precipitation over China. It does this by altering large-scale circulation, vertical motion, and water vapor transport [4,5]. Below (above)-normal precipitation is often observed over Eastern and Southeastern China during strong (weak) EAWM winters [4,6,7,8]. It is straightforward to attribute the changes of precipitation over East Asia to anomalous behaviors of the EAWM. Nevertheless, considering that the EAWM is a regional phenomenon driven by both the tropical and extra-tropical atmospheric processes and atmospheric external forcing [9,10], it may be more fundamental to explore the local and remote drivers for variations of precipitation over China.
The El Niño-Southern Oscillation (ENSO) is a main driver for the variations of wintertime precipitation over China [11,12,13,14]. Although its influences on the precipitation show some asymmetry between warm and cold ENSO phases [15,16,17] and depend on the flavors of ENSO [18], below-normal and above-normal precipitation is generally observed over Southeast China during La Niña and El Niño winters, respectively [11,13]. The mechanism lies in the anomalous lower-tropospheric cyclone (anticyclone) near the Philippines excited by the cold (warm) ENSO via the Gill-type Rossby wave response due to the ENSO-induced anomalous diabatic heating (cooling) over the western North Pacific [19,20]. Accompanied by the anomalous Philippines cyclone (anticyclone), the anomalous northerly (southerly) wind belonging to the western portion of the cyclone (anticyclone) would enhance (reduce) the climatological mean lower-tropospheric northeasterly winds. It thereby weakens (strengthens) the northward water vapor transport towards East Asia, facilitating less (more) precipitation over Southeast China.
The extra-tropical atmospheric teleconnection is a second important driver for the wintertime precipitation over East Asia. For example, a wave-like pattern along the subtropical jet can influence the precipitation over Southeast China significantly [21]. The thermal advection and vertical differential vorticity advection associated with this wave pattern can lead to anomalous vertical motion over Southeast China, creating a favorable dynamical environment to alter precipitation. In addition, the Eurasian (EU) pattern that propagates roughly along the polar front jet can influence the precipitation over North China [22]. Moreover, the close association between the North Atlantic sea surface temperature (SST) and the EU pattern [22] implies the possible influences of the North Atlantic SST on the precipitation over North China. In this study, the basic features and the possible causes of the 2017–2018 winter drought were analyzed. It will be shown that a combination of the La Niña background with the positive phase of the EU pattern was an important cause for the drought observed in the 2017–2018 winter. Section 2 describes the data and methods used in this study. Section 3 describes the observed drought over North China in the 2017 winter, and Section 4 discusses the possible causes. Finally, Section 5 presents the conclusion and discusses some remaining issues.
2. Data and Methods
The monthly mean atmospheric reanalysis data were taken from the National Center for Environmental Prediction/National Center for Atmospheric Research (NCEP/NCAR) reanalysis dataset with a horizontal resolution of 2.5° × 2.5° spanning the period from 1948 to the present [23]. In addition to the monthly mean data, the 6-hourly NCEP/NCAR data was also employed to calculate the water vapor fluxes. The precipitation data came from two sources. One was the monthly global land precipitation dataset named precipitation reconstruction over land (PREC/L), which has the same horizontal resolution and time coverage as the NCEP/NCAR reanalysis dataset [24]. The other source was observed monthly mean precipitation from 160 Chinese stations, which were used to compare with the results derived from PREC/L dataset. The station precipitation data were provided by the China Meteorological Administration and covered the period from 1951 onward. The monthly mean global SST data came from the Met Office Hadley Centre’s sea ice and SST datasets (HadISST), which had 1° × 1° horizontal resolution and covered the period from 1870 to the present [25]. The monthly mean Niño-3.4 index was downloaded from the Climate Prediction Center, National Oceanic and Atmospheric Administration [26].
This study focused on the boreal winter, defined as the mean of December, January, and February. The winters from 1951–2017 were studied after taking into consideration the overlap of all the datasets. Here the winter of 2017 referred to the 2017–2018 winter. Linear regression analysis and composite analysis were employed in this study, and the confidence level was evaluated with the Monte Carlo bootstrapping technique [27] with 10,000-times resampling.
3. Observed North China Drought in the 2017 Winter
Figure 1a,b shows the anomalies of normalized precipitation in the 2017 winter, where the normalized precipitation was defined as the precipitation divided by its climatology. It is clear that decreased precipitation was observed over many regions of China. The deficiency of precipitation was most remarkable over North China, where the precipitation was approximately 90% less than the climatology, resulting in severe drought. This feature was highly consistent in both station observation (Figure 1a) and PREC/L data (Figure 1b). To reveal the severity of the drought from a climate perspective, a precipitation index was constructed by averaging the winter mean precipitation over 17 stations (shown as dots in Figure 1a) in North China. Figure 1c shows the normalized North China precipitation index (NCPI) for the period 1951–2017. The value of normalized NCPI was −1.56 in the 2017 winter, which was only larger than those in the winters of 1998 (−1.65), 1967 (−1.57) and 1983 (−1.57). This result suggests that the 2017 winter was the fourth driest winter during the past 67 years and the second driest winter during the past 20 years.
4. Possible Causes
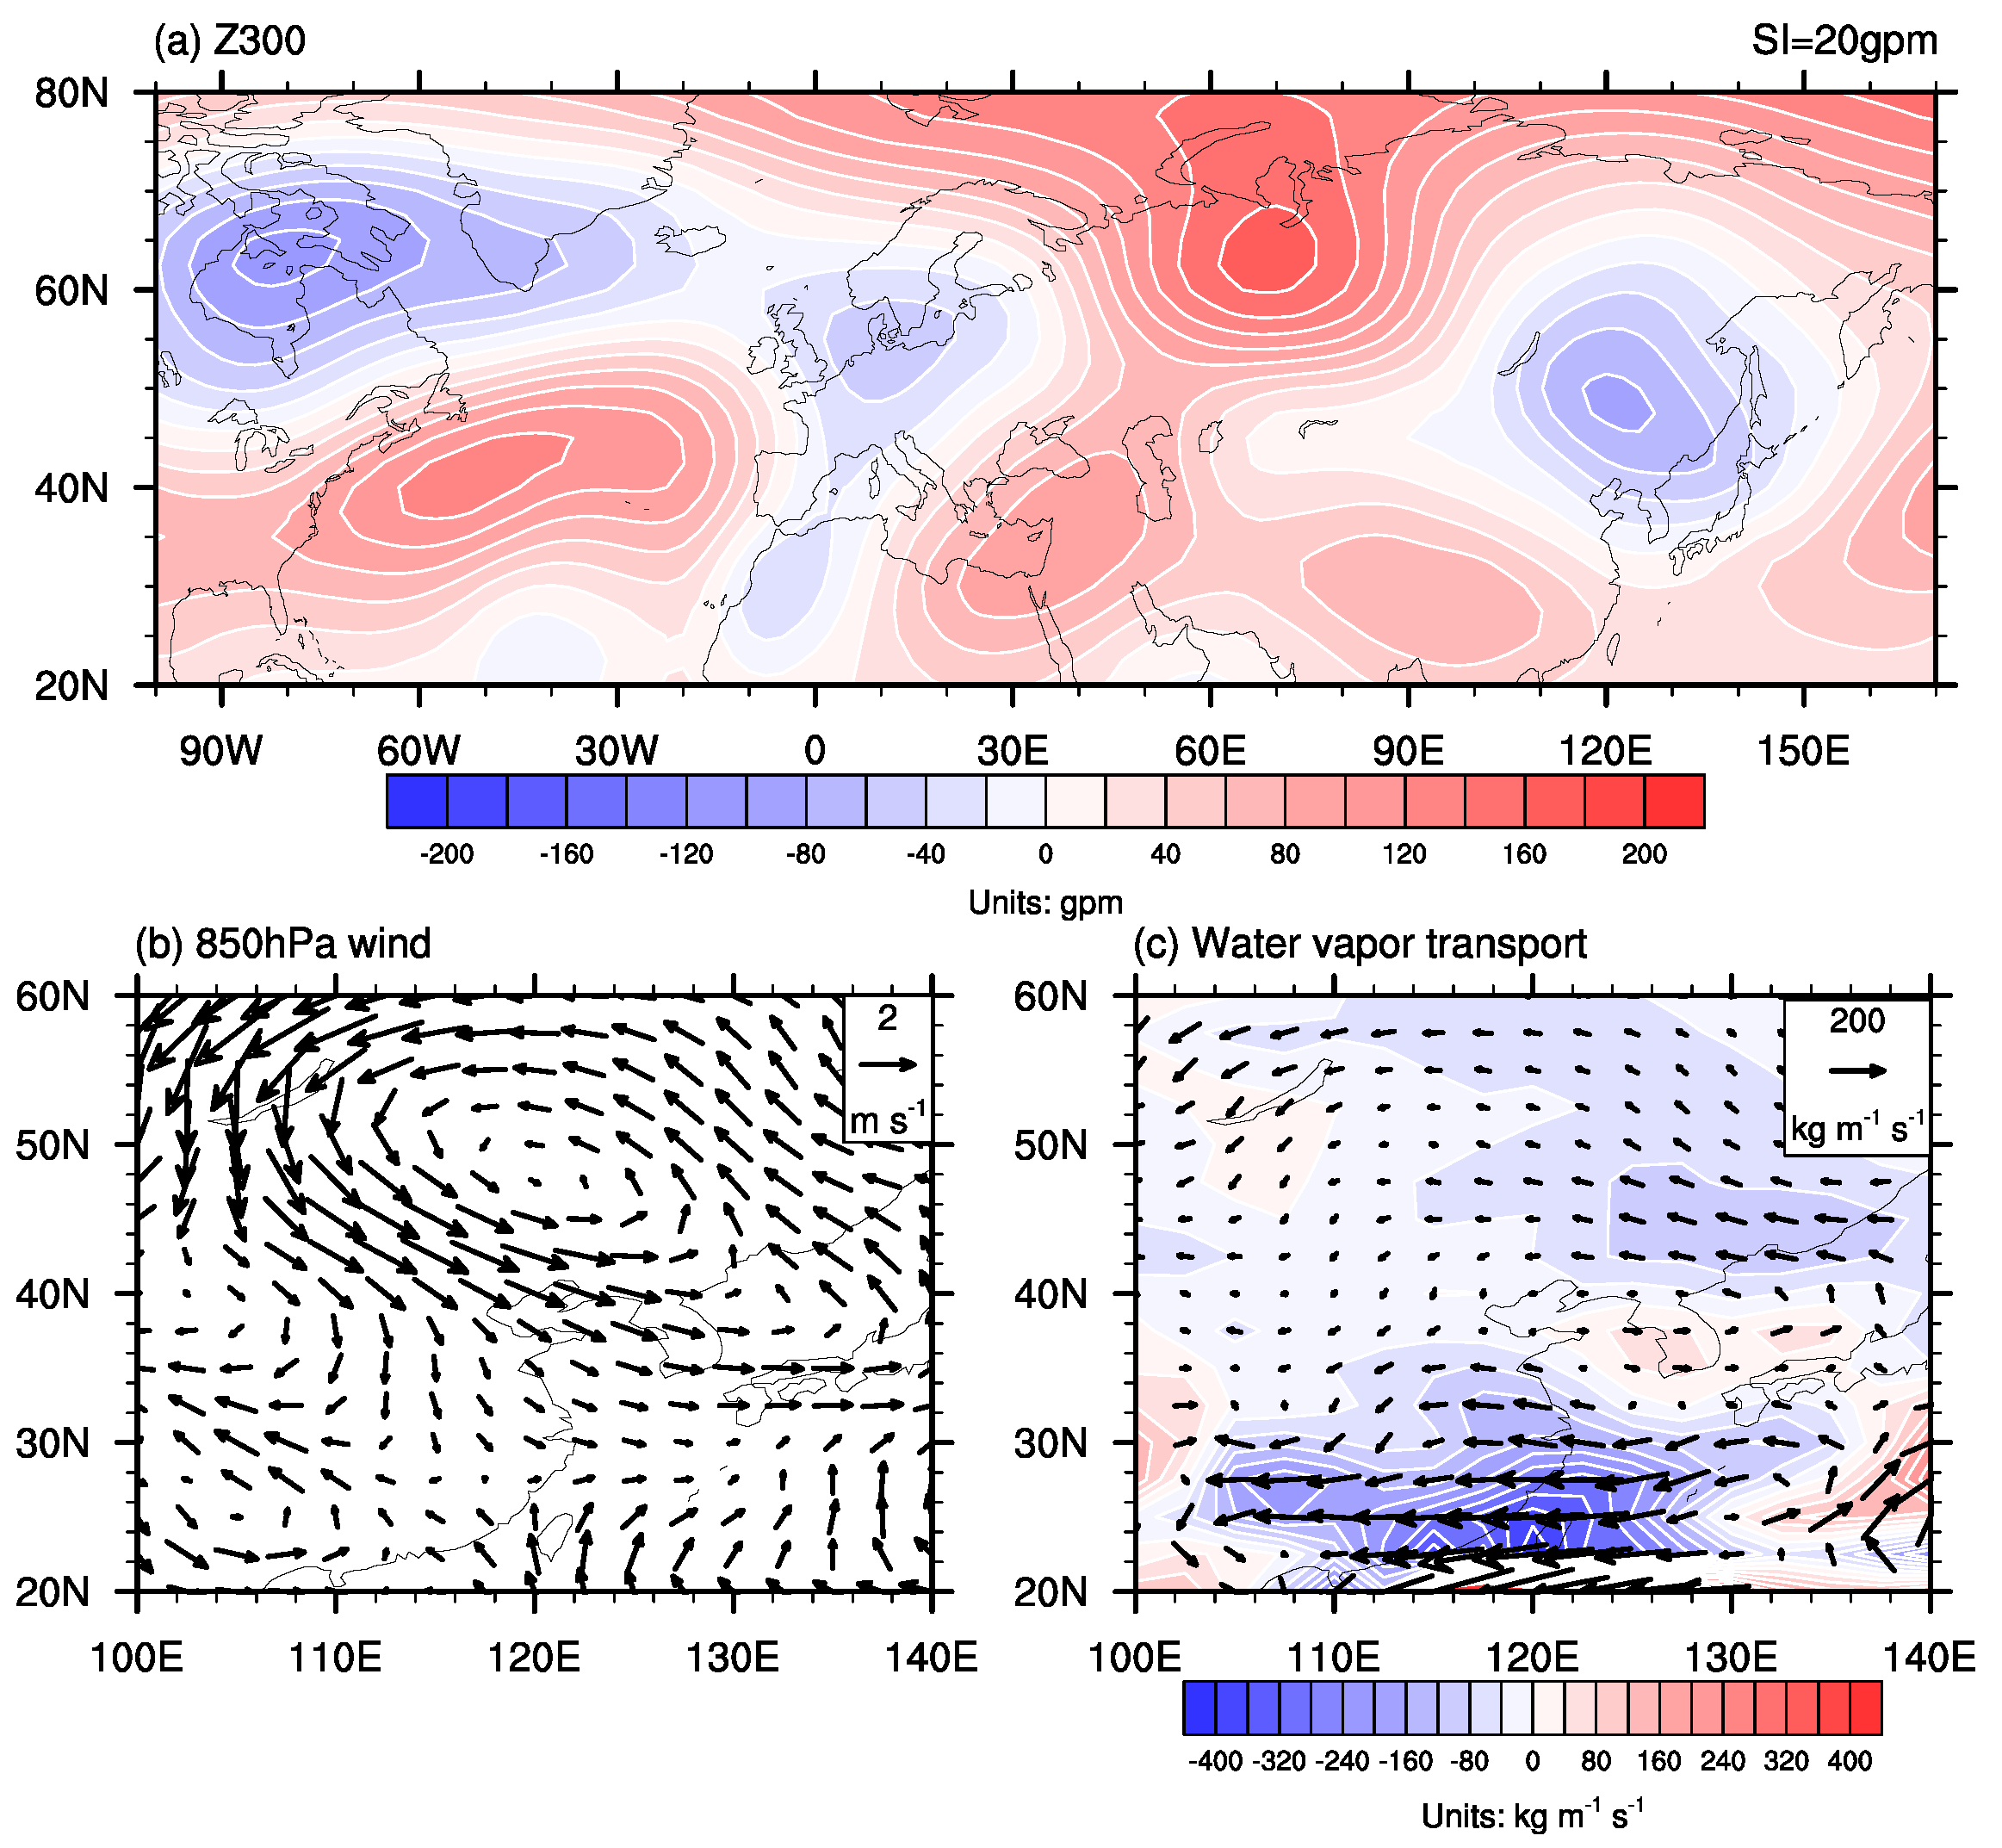
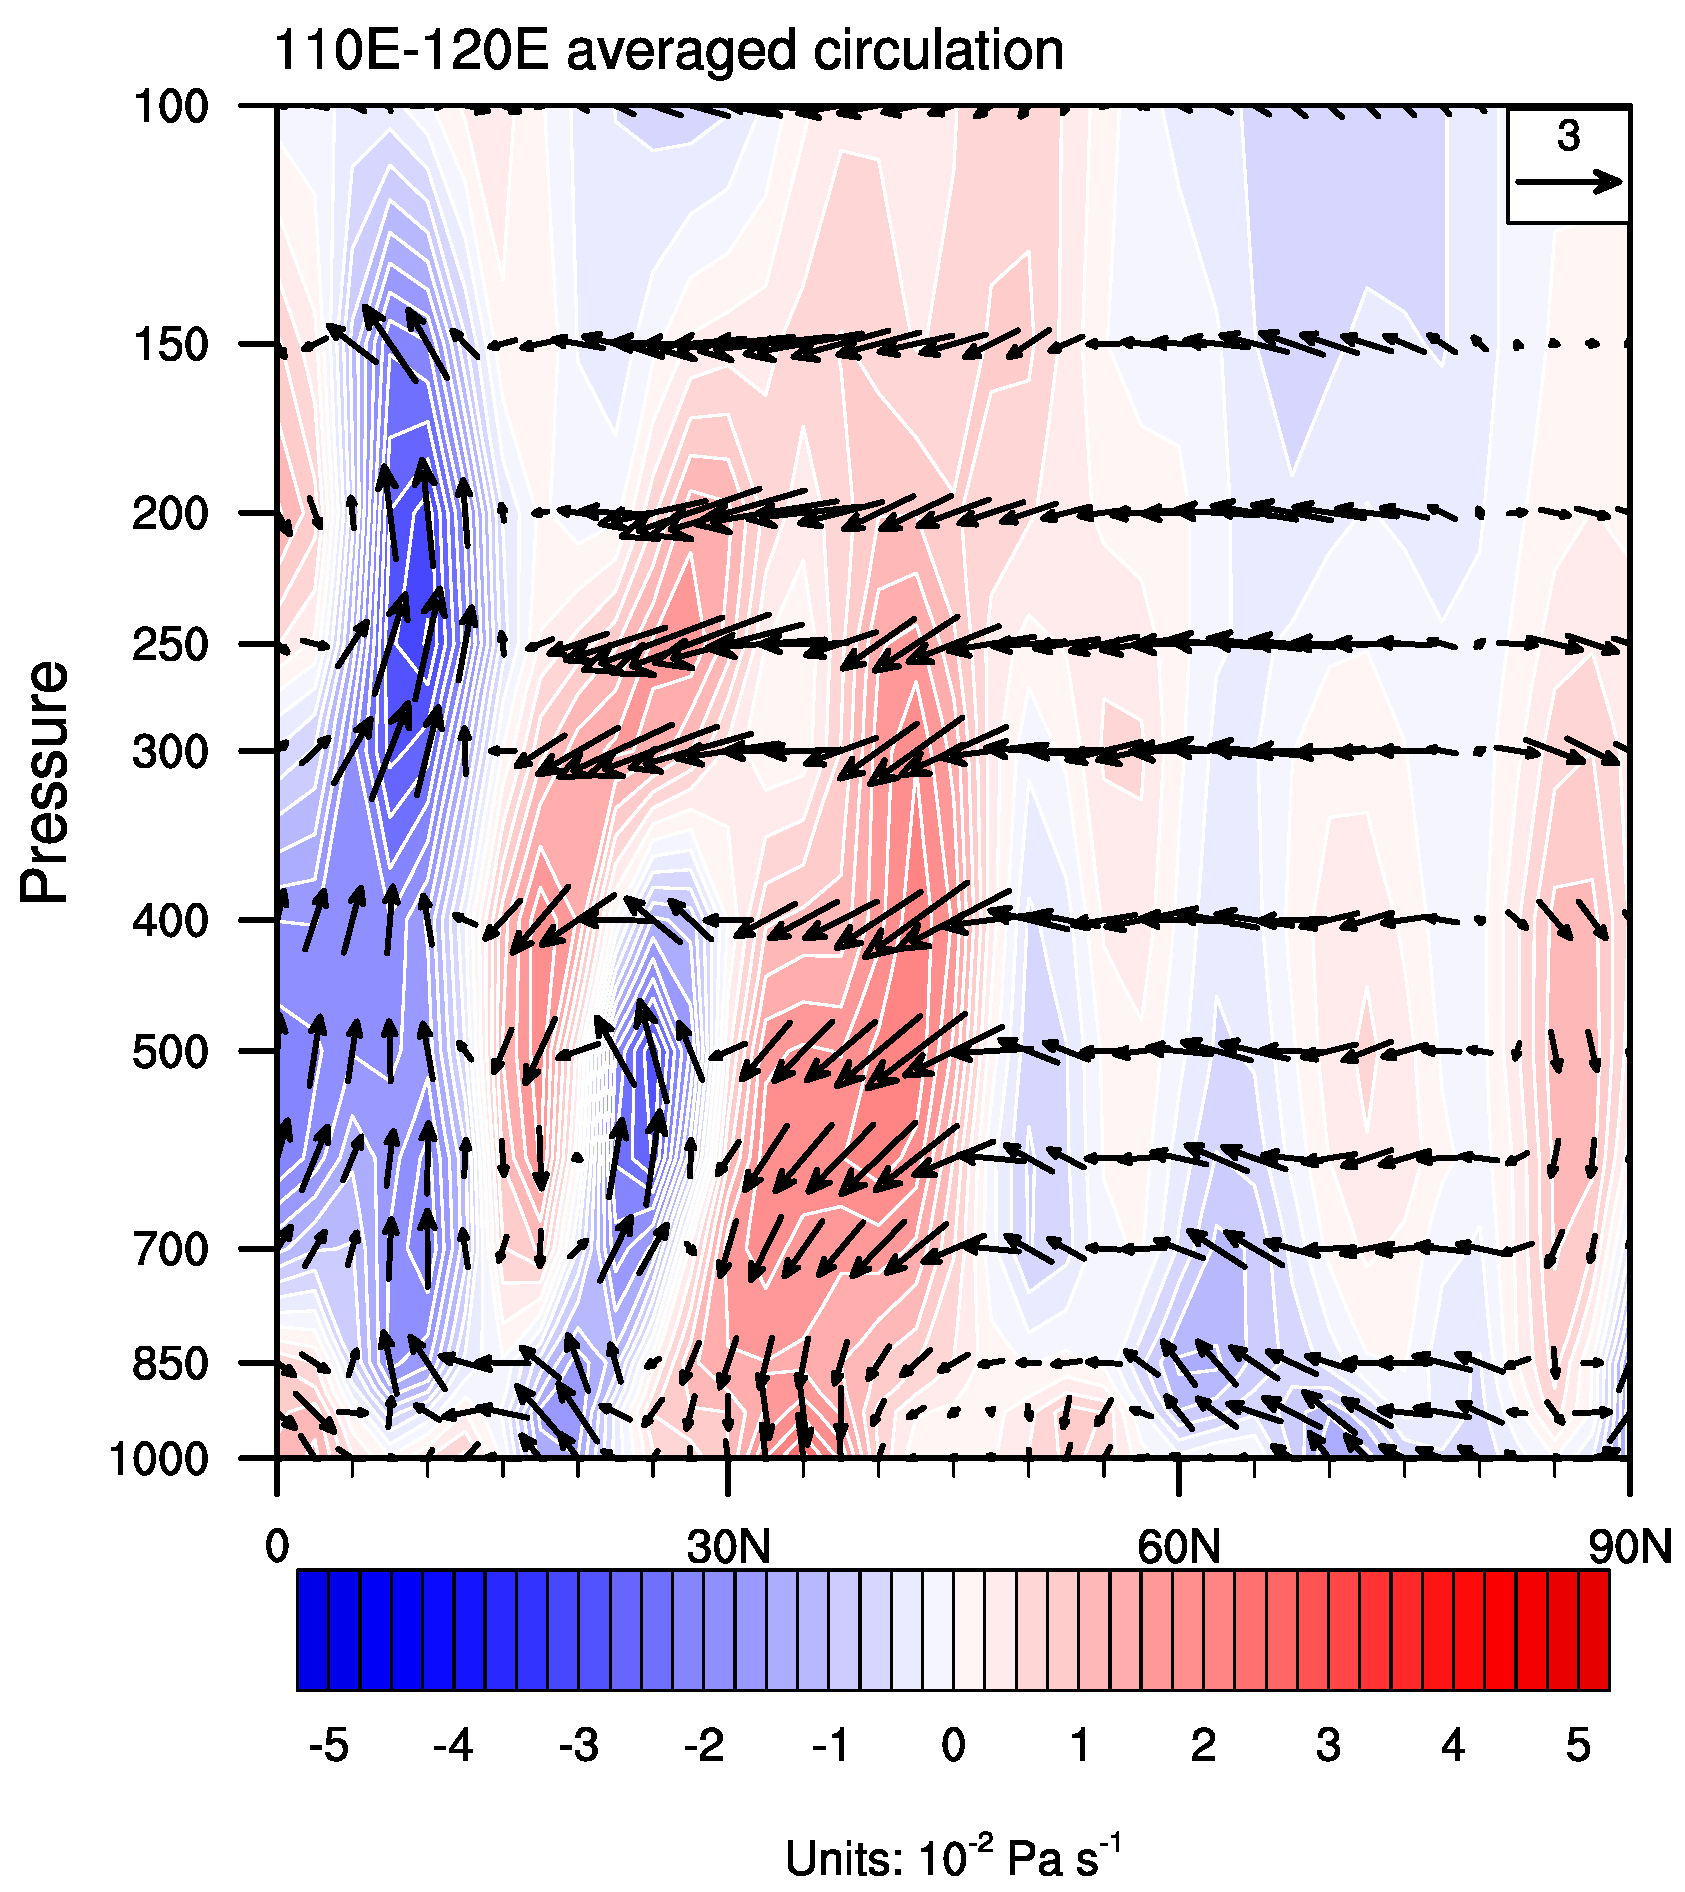
Figure 2 shows the atmospheric circulation anomalies associated with the 2017 winter drought. A zonally-oriented wave-like pattern stretches from the North Atlantic to East Asia (Figure 2a), which quite resembles the positive phase of the EU pattern [22,28]. The winter mean EU index was 1.44 in the 2017 winter, consistent with the observed EU-like geopotential height anomalies shown in Figure 2a. This EU-like wave train features an anomalous barotropic cyclonic center over Northeast China (Figure 2a) that can also be observed in the lower troposphere (Figure 2b). The northeasterly wind anomalies belonging to the western portion of the cyclone enhance the climatological mean lower-tropospheric northeasterly winds (e.g., Figure 1 of Reference [29]). As a result, the northward water vapor transport from the tropical region to mid-latitude East Asia was weakened (Figure 2c), providing an unfavorable moisture condition for precipitation in most parts of East Asia. In addition, vertical motion was weaker-than-normal over North China as indicated by the anomalous descending motion from 30° N to 45° N (Figure 3). Hence, both the moisture condition and the dynamical condition facilitated less precipitation over North China, leading to drought in the 2017 winter.
To understand the typical climatic condition that favors drought over North China, regression analyses were performed with the normalized negative NCPI (Figure 4 and Figure 5). The negative NCPI was employed so that the regressed results corresponded to the drought condition. It revealed that the North China drought was usually accompanied with enhanced northwesterly (Figure 4b) and weakened northward water vapor transport (Figure 4c) over East Asia, both of which could be attributed to the anomalous barotropic cyclone centered over the Sea of Japan (Figure 4a). The anomalous cyclone was part of a zonal wave-like pattern extending from the North Atlantic to East Asia in the troposphere (Figure 4a), which again quite resembled the positive phase of the EU pattern [22,28]. North China is located to the west of this anomalous cyclone and to the east of the upstream anomalous anticyclone (Figure 4a). In the presence of background westerly winds (e.g., Figure 1g of Reference [30]) and vertical westerly shear, the strong anticyclonic vorticity advection in the upper troposphere and the weaker one in the lower troposphere excited anomalous descending motion above North China (Figure 5) according to the quasi-geostrophic omega equation. As a result, destructive moisture condition and a dynamical environment suppressed precipitation over North China. This physical picture agrees quite well with the situation observed in the 2017 winter (Figure 2 and Figure 3), confirming the important role of the positive phase of the EU pattern in the 2017 winter drought.
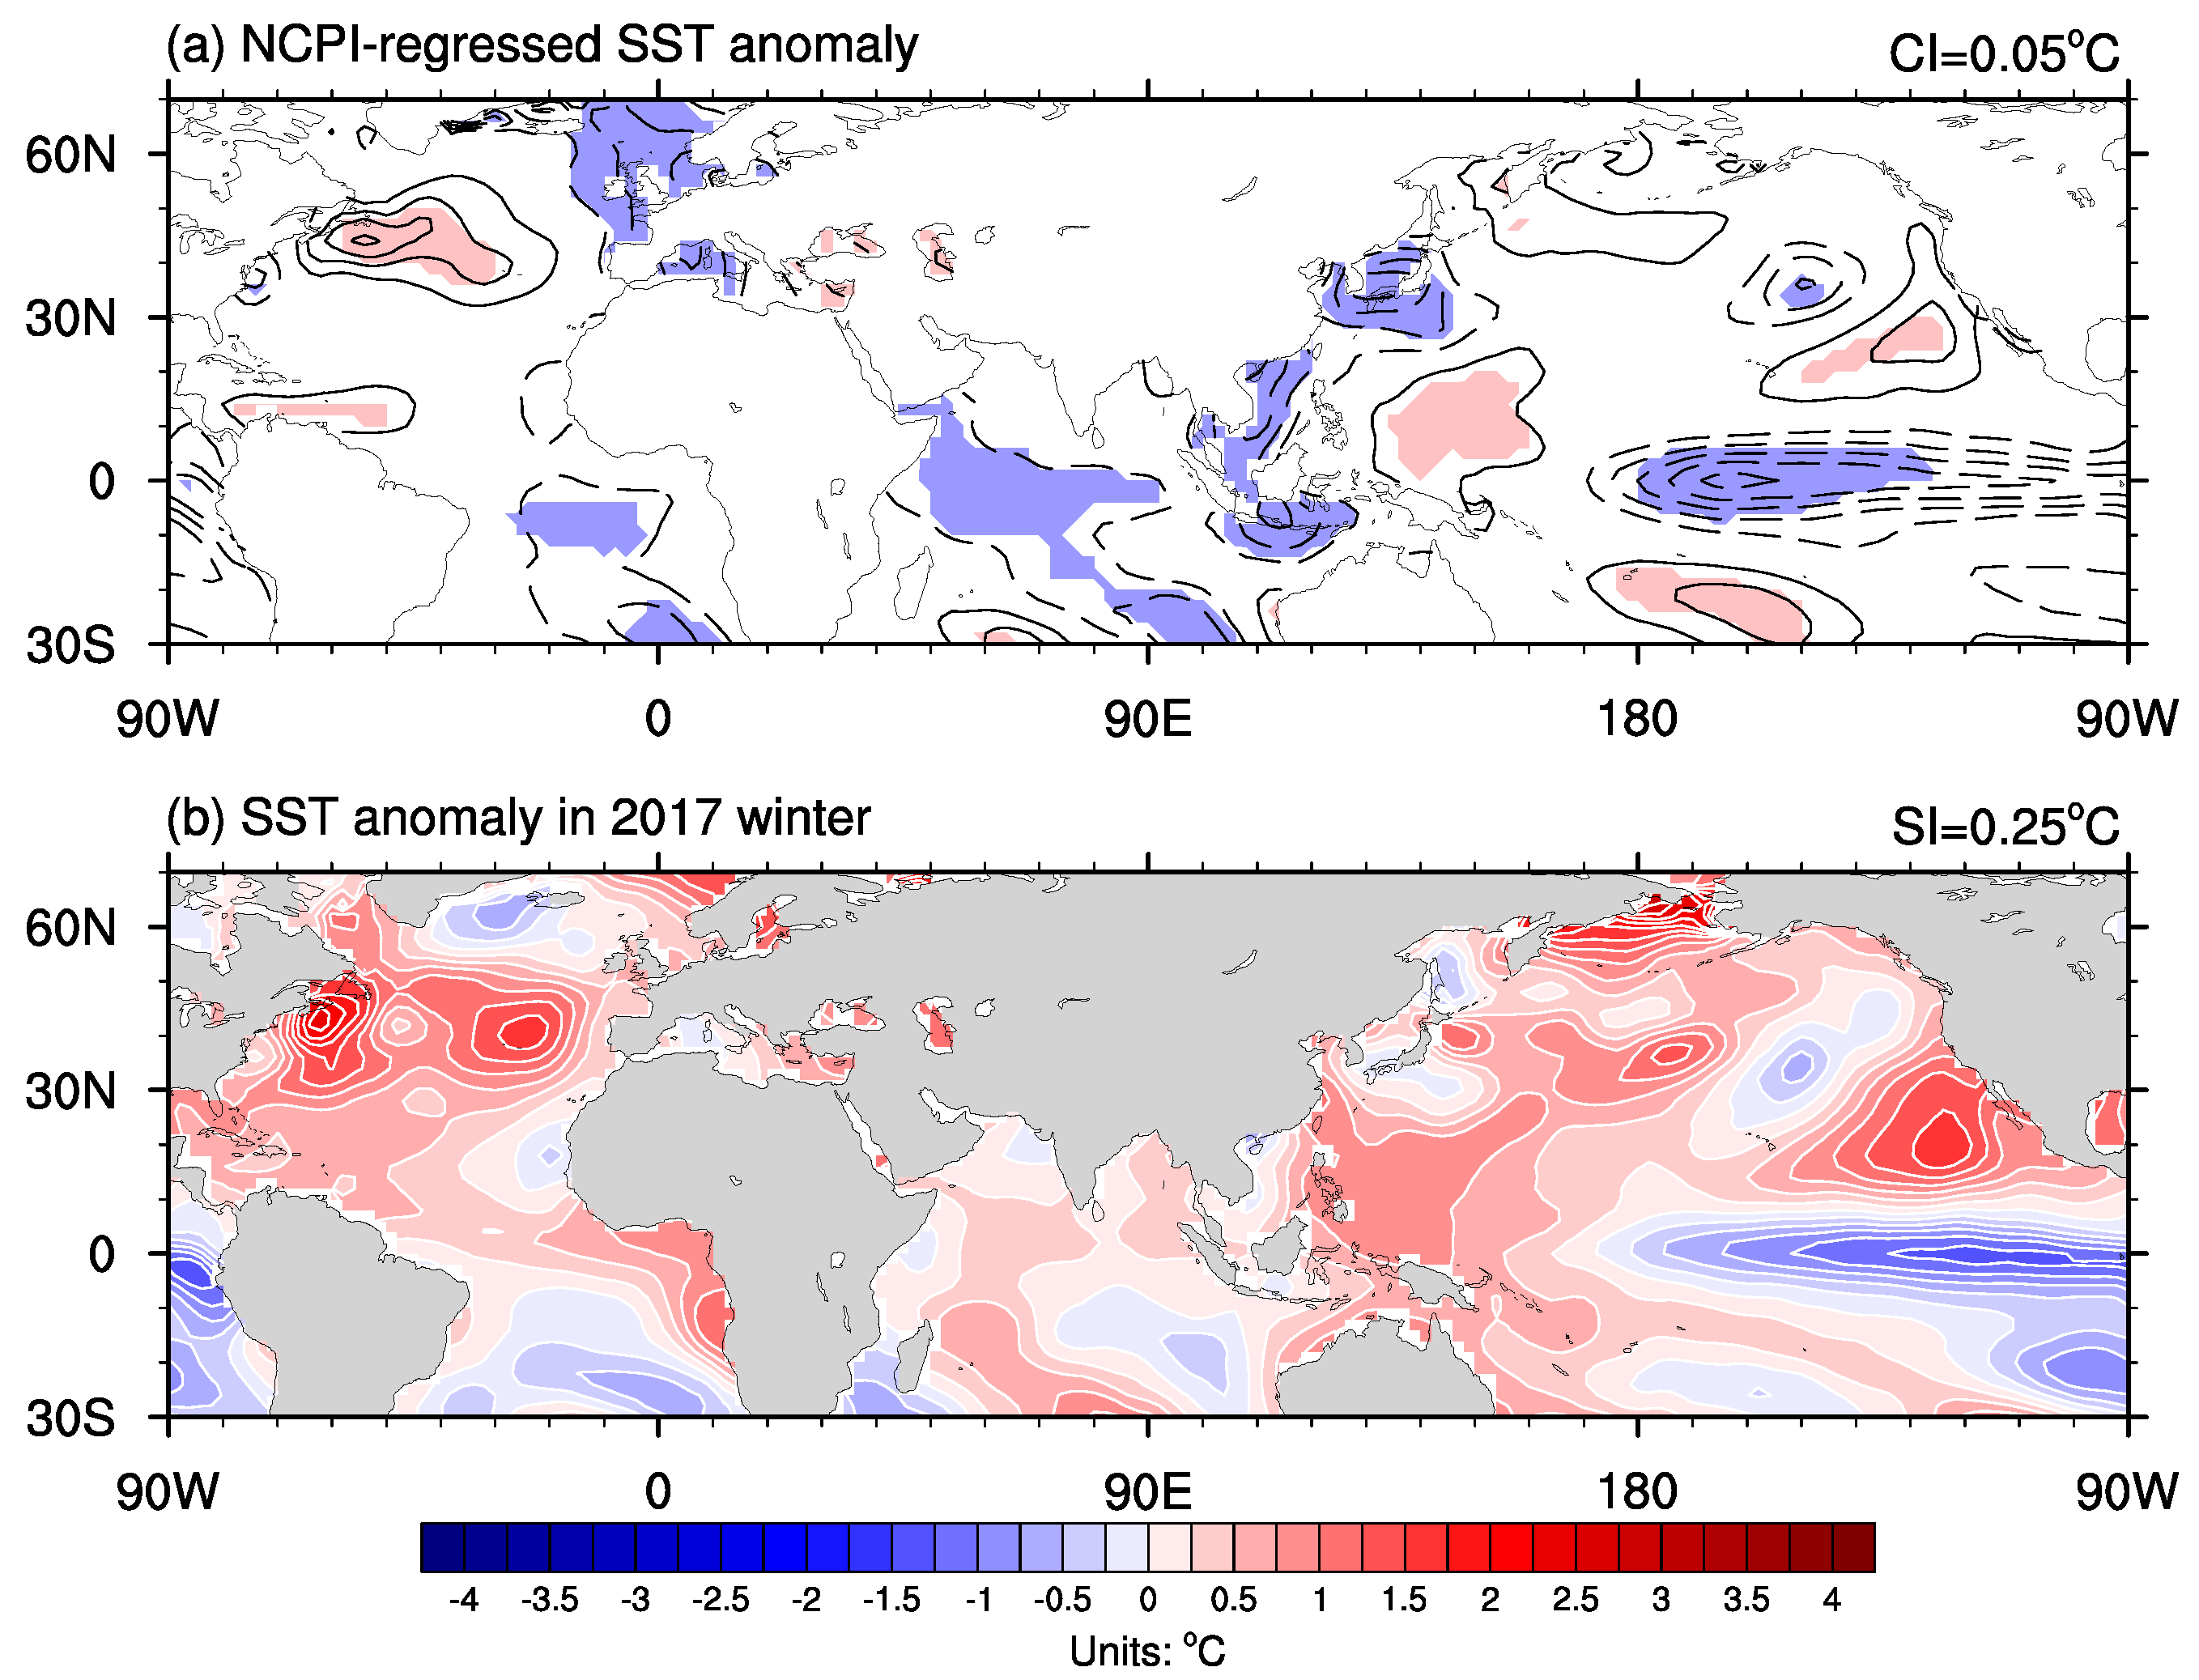
In addition to the positive phase of the EU-like atmospheric circulation, it is possible that variations of the North China drought are linked to some atmospheric external forcing, so the NCPI was regressed onto the SST, sea ice, and snow cover extent to check this possibility. No clear signal was found in the sea ice and snow cover, but a clear La Niña-like SST pattern was observed in the Pacific corresponding to the North China drought (Figure 6a). Previous studies suggested that La Niña could excite an anomalous lower-tropospheric cyclone near the Philippines via Gill-type Rossby wave response and weaken the northward water vapor transport [17]. In addition, the NCPI-regressed SST pattern quite resembled the SST anomalies observed in the 2017 winter (Figure 6b). These results imply that La Niña was very likely playing some role in causing the 2017 winter drought over North China.
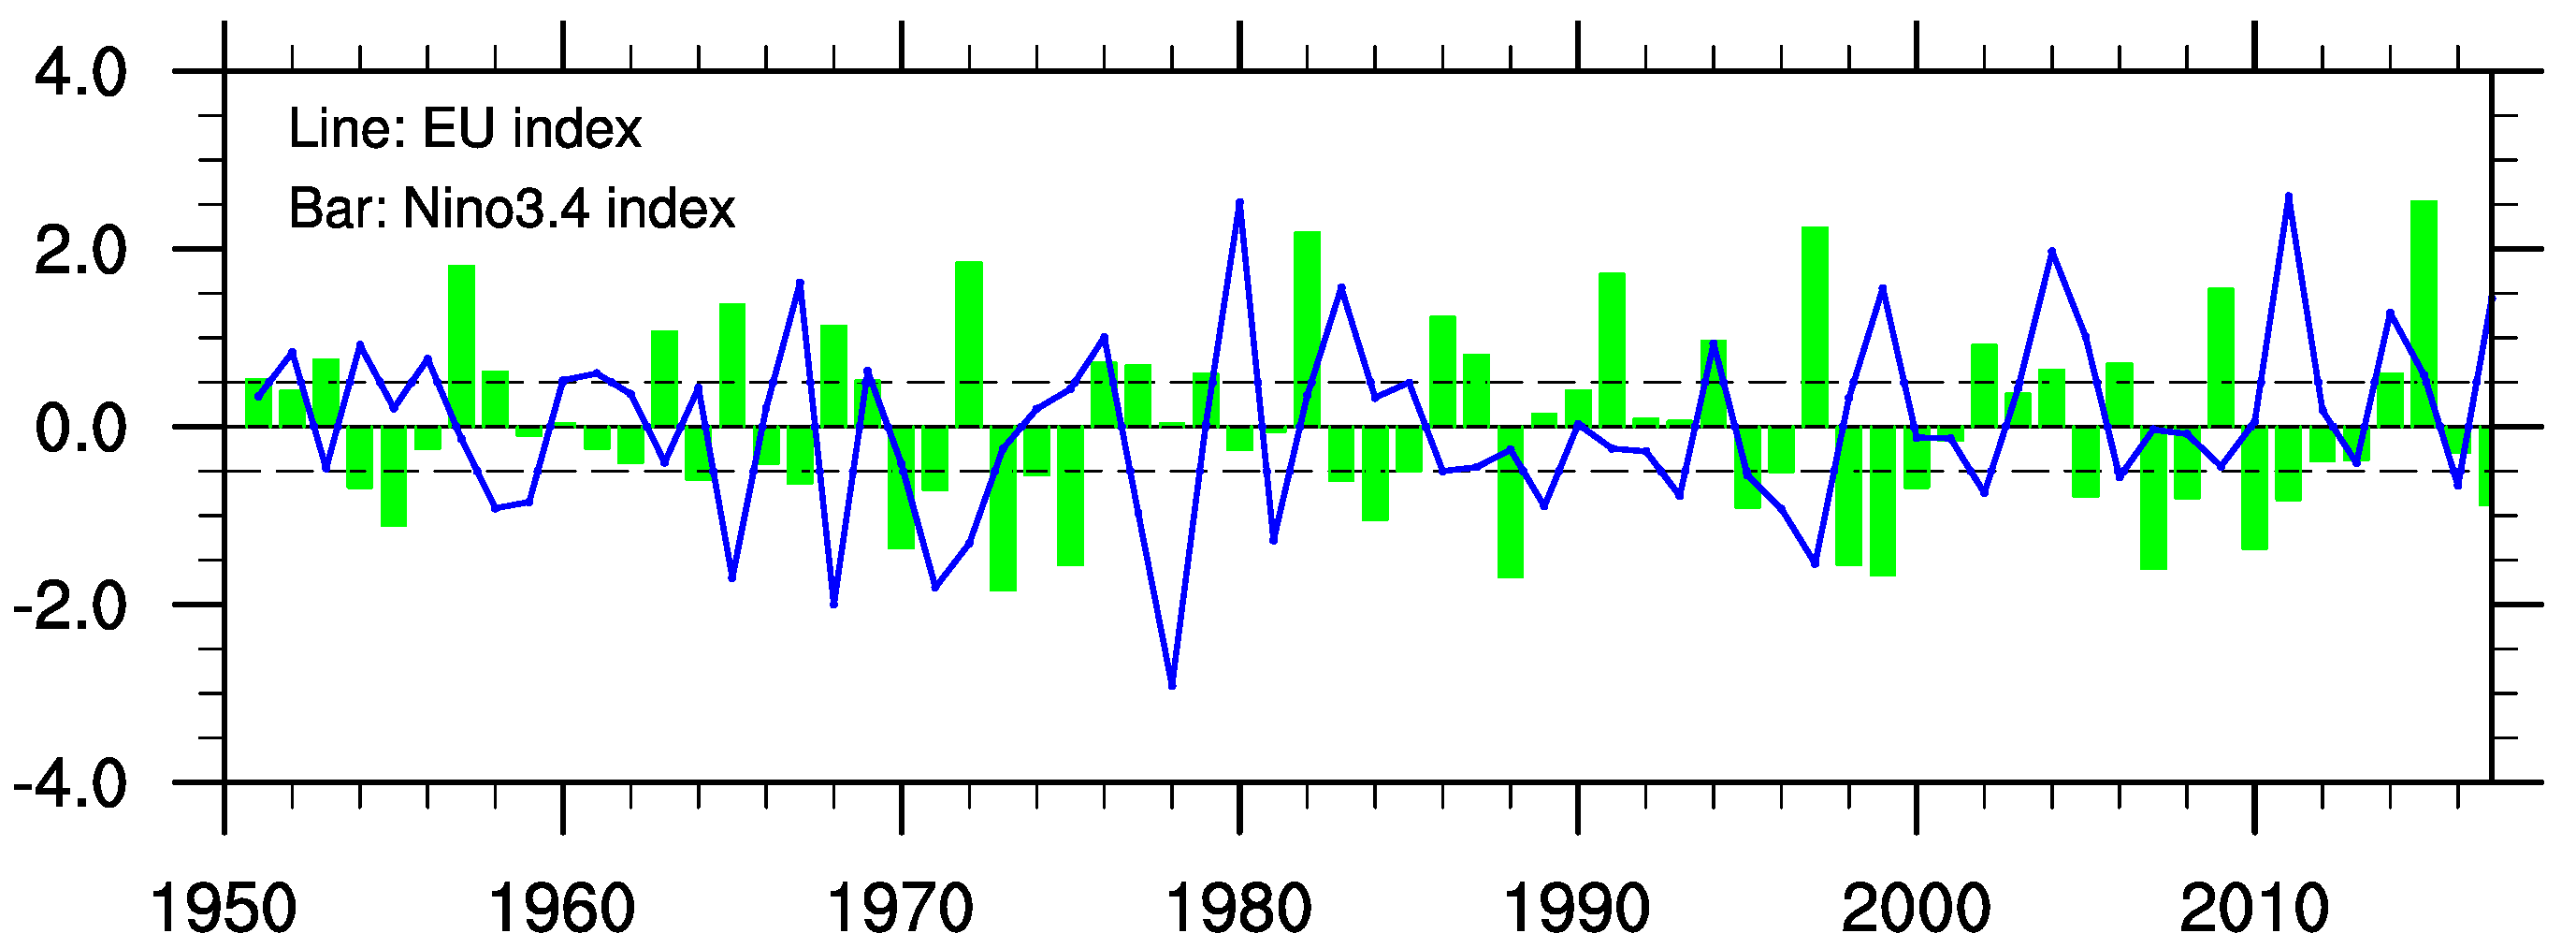
To further examine the possible role of the positive EU pattern and La Niña in the 2017 winter drought, a composite analysis was performed by examining three groups of winters. Group one consisted of 23 winters with positive EU pattern alone (Table 1), which was defined as winters whose normalized winter mean EU index (Figure 7) was greater than 0.5. Group two consisted of 18 La Niña winters alone (Table 1), which was defined as winters whose normalized winter mean Niño-3.4 index (Figure 7) was smaller than −0.5. Group three consisted of seven winters that had both a positive EU pattern and a La Niña pattern (Table 1), and was defined as the overlap of group one and group two.
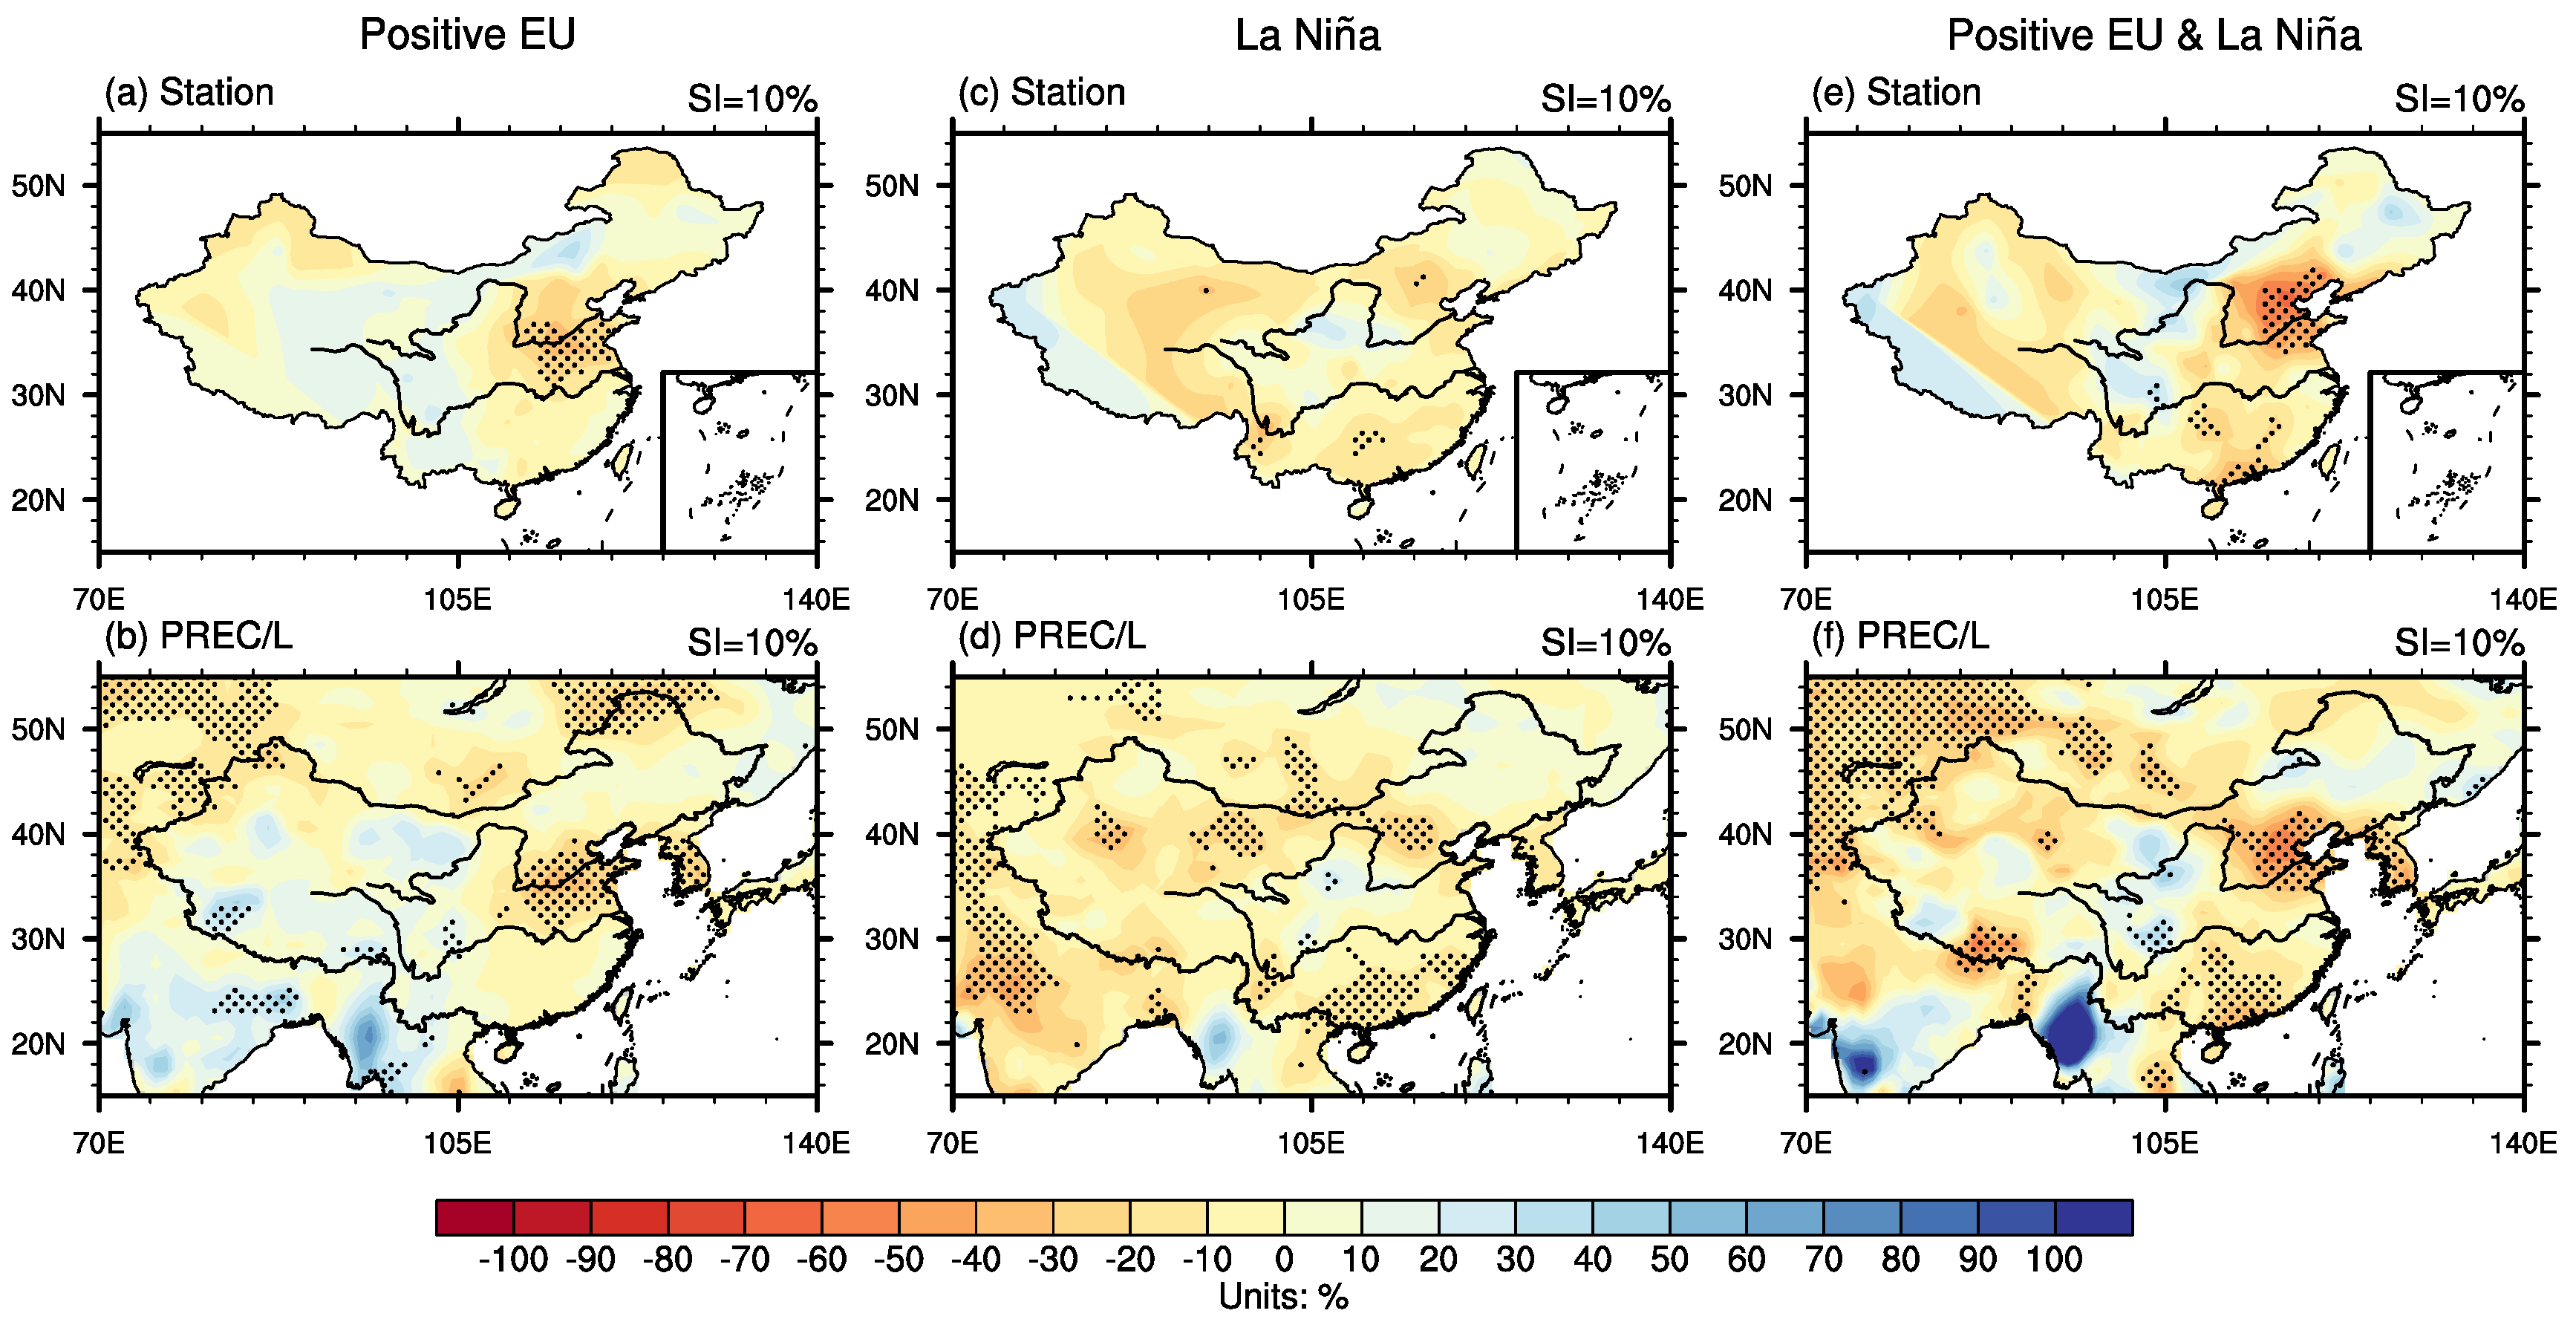
Figure 8 shows the composite anomalies of the normalized precipitation in the three groups based on both station observation and PREC/L data. During winters with positive EU pattern alone, reduced precipitation was observed between the lower reaches of the Yellow River and the Yangtze River (Figure 8a,b). However, the location of the precipitation deficiency was in the southern part of North China and is different from that observed in the 2017 winter (Figure 1a,b). During La Niña winters alone, reduced precipitation was mainly observed in South China (Figure 8c,d). Although precipitation deficiency was also observed over central North China, these signals were only statistically significant in very limited regions (Figure 8c) and showed many discrepancies between station observations and PREC/L data (Figure 8c,d). These results suggest that neither the positive EU pattern nor La Niña alone can explain the 2017 winter drought in North China. In contrast to the above two cases, the composite in group three showed strong and significant precipitation deficiency over central North China and a weaker but still significant reduction of precipitation over South China (Figure 8e,f). The above precipitation pattern showed remarkable resemblance to that observed in the 2017 winter (Figure 1a,b). In addition, an inspection of Table 1 revealed that three out of the four driest winters over North China (1967, 1983, and 2017) belong to group three. Hence, these results suggest that a combination of the positive phase of the EU pattern and La Niña was the key to lead to the North China drought in the 2017 winter.
5. Conclusions and Discussion
Based on precipitation data from Chinese stations and the PREC/L dataset, atmospheric data from the NCEP/NCAR reanalysis dataset and SST data from the HadISST dataset, this study investigated the characteristics of the drought that occurred over North China in the 2017 winter and its possible causes. It revealed that the seasonal mean precipitation in the 2017 winter was approximately 90% less than the climatology over central North China including Beijing and parts of Inner Mongolia and Hebei Province (Figure 1). This was the fourth most severe drought over central North China since 1951, when the meteorological observation network in China was established. In particular, no precipitation was observed in Beijing from 23 October 2017 to 16 March 2018. This 145 day-long period also sets a new record for consecutive non-precipitation days since 1951.
Analyses suggest that the 2017 winter drought in North China is closely tied to the occurrence of La Niña and the presence of a positive EU-like wave train originating from the North Atlantic (Figure 2a, Figure 4a, and Figure 6). However, neither La Niña nor the positive phase of the EU pattern alone could explain the occurrence of the 2017 drought (Figure 8a–d). In contrast, the simultaneous presence of the two was the key to the occurrence of the drought (Figure 8e,f). On one hand, the positive EU-related barotropic cyclonic anomaly over northern East Asia featured enhanced lower-tropospheric northwesterly winds in mid-latitude East Asia [22]. Meanwhile, La Niña also enhanced the lower-tropospheric northeasterly winds in subtropical East Asia by exciting an anomalous lower-tropospheric cyclone near the Philippines [17]. Hence, the northward water vapor transport (Figure 2c and Figure 4c) was suppressed by the enhanced northerly winds over entire East Asia (Figure 2a and Figure 4a), providing an unfavorable moisture environment for precipitation over North China. On the other hand, the configuration of the positive EU-like wave train facilitates anomalous descending motion over mid-latitude East Asia (Figure 3 and Figure 5), provided an unfavorable dynamical condition for precipitation over North China. As a result, both the moisture and the dynamical environment was conducive to less precipitation and drought over North China.
In addition to the La Niña-like SST pattern in the Pacific, strong North Atlantic SST warming was also observed to accompany the North China drought in 2017 and other similar winters (Figure 6), which quite resembled the SST pattern that could excite the positive phase of the EU pattern (e.g., Figure 11b of Reference [22]). This similarity motivated us to explore the possible prediction potential of the North China drought based on SST signals over both the North Atlantic and the tropical eastern Pacific. However, no good results were obtained. This failure may be understood because the variability of the EU pattern cannot be fully explained by the North Atlantic SST [22]. Nevertheless, further diagnostic and modelling [31] efforts will be devoted to understanding the mechanism and prediction potential of the North China drought in future studies.
Author Contributions
L.W. (Lin Wang) designed the research, W.C. improved the analyzing scheme, L.W. (Lijuan Wang) and Y.L. performed the analyses, L.W. (Lin Wang) and L.W. (Lijuan Wang) wrote the paper, and all authors interpreted the results and revised the paper.
Funding
This work was supported by the National Key Research and Development Program of China (2018YFC1506003), the National Natural Science Foundation of China (41721004, 41405053), the Chinese Academy of Sciences (QYZDY-SSW-DQC024), and the Fundamental Research Funds for the Central Universities.
Acknowledgments
We thank the three anonymous reviewers for their helpful comments to refine the study.
Conflicts of Interest
The authors declare no conflicts of interest.
References
- Gao, H.; Yang, S. A severe drought event in northern China in winter 2008–2009 and the possible influences of La Niña and Tibetan Plateau. J. Geophys. Res. Atmos. 2009, 114, D24104. [Google Scholar] [CrossRef]
- Barriopedro, D.; Gouveia, C.M.; Trigo, R.M.; Wang, L. The 2009/10 drought in China: Possible causes and impacts on vegetation. J. Hydrometeorol. 2012, 13, 1251–1267. [Google Scholar] [CrossRef]
- Sun, S.; Gao, G. China Climate Impact Assessment. National Climate Center, China Meteorological Administration. 15 February 2018. Available online: https://cmdp.ncc-cma.net/upload/upload2/yxpj/qhpj_m180200.doc (accessed on 30 January 2019).
- Wang, L.; Chen, W. How well do existing indices measure the strength of the East Asian winter monsoon? Adv. Atmos. Sci. 2010, 27, 855–870. [Google Scholar] [CrossRef]
- Zhou, L.T. Impact of East Asian winter monsoon on rainfall over southeastern China and its dynamical process. Int. J. Climatol. 2011, 31, 677–686. [Google Scholar] [CrossRef] [Green Version]
- Wang, L.; Chen, W. An intensity index for the East Asian winter monsoon. J. Clim. 2014, 27, 2361–2374. [Google Scholar] [CrossRef]
- Ge, J.W.; Jia, X.J.; Lin, H. The interdecadal change of the leading mode of the winter precipitation over China. Clim. Dyn. 2016, 47, 2397–2411. [Google Scholar] [CrossRef]
- Jia, X.J.; Ge, J.W. Interdecadal changes in the relationship between ENSO, EAWM, and the wintertime precipitation over China at the end of the twentieth century. J. Clim. 2017, 30, 1923–1937. [Google Scholar] [CrossRef]
- Chang, C.P.; Ding, Y.H.; Lau, N.C.; Johnson, R.H.; Wang, B.; Yasunari, T. The Global Monsoon System: Research and Forecast, 2nd ed.; World Scientific: Singapore, 2011. [Google Scholar]
- Wang, L.; Lu, M.M. The East Asian winter monsoon. In The Global Monsoon System: Research and Forecast, 3rd ed.; Chang, C.P., Kuo, H.C., Lau, N.C., Johnson, R.H., Wang, B., Wheeler, M.C., Eds.; World Scientific: Singapore, 2017; pp. 51–61. [Google Scholar]
- Zhang, R.H.; Sumi, A.; Kimoto, M. A diagnostic study of the impact of El Niño on the precipitation in China. Adv. Atmos. Sci. 1999, 16, 229–241. [Google Scholar] [CrossRef]
- Zhang, R.H.; Sumi, A. Moisture circulation over East Asia during El Niño episode in Northern winter, spring and autumn. J. Meteorol. Soc. Jpn. 2002, 80, 213–227. [Google Scholar] [CrossRef]
- Wang, L.; Feng, J. Two major modes of the wintertime precipitation over China. Chin. J. Atmos. Sci. 2011, 35, 1105–1116. [Google Scholar]
- Wu, R.G.; Hu, Z.Z.; Kirtman, B.P. Evolution of ENSO-related rainfall anomalies in East Asia. J. Clim. 2003, 16, 3742–3758. [Google Scholar] [CrossRef]
- Gao, R.L.; Zhang, R.H.; Wen, M.; Li, T.R. Interdecadal changes in the asymmetric impacts of ENSO on wintertime rainfall over China and atmospheric circulations over western North Pacific. Clim. Dyn. 2018. [Google Scholar] [CrossRef]
- Zhang, R.H.; Li, T.R.; Wen, M.; Liu, L.K. Role of intraseasonal oscillation in asymmetric impacts of El Niño and La Niña on the rainfall over southern China in boreal winter. Clim. Dyn. 2015, 45, 559–567. [Google Scholar] [CrossRef]
- Zhang, R.H.; Min, Q.Y.; Su, J.Z. Impact of El Niño on atmospheric circulations over East Asia and rainfall in China: Role of the anomalous western North Pacific anticyclone. Sci. China Earth Sci. 2017, 60, 1124–1132. [Google Scholar] [CrossRef]
- Feng, J.; Wang, L.; Chen, W.; Fong, S.K.; Leong, K.C. Different impacts of two types of Pacific ocean warming on Southeast Asian rainfall during boreal winter. J. Geophys. Res. Atmos. 2010, 115, D24122. [Google Scholar] [CrossRef]
- Zhang, R.H.; Sumi, A.; Kimoto, M. Impact of El Niño on the East Asian monsoon: A diagnostic study of the ′86/87 and ′91/92 events. J. Meteorol. Soc. Jpn. 1996, 74, 49–62. [Google Scholar] [CrossRef]
- Wang, B.; Wu, R.G.; Fu, X.H. Pacific-East Asian teleconnection: How does ENSO affect East Asian climate? J. Clim. 2000, 13, 1517–1536. [Google Scholar] [CrossRef]
- Hu, K.M.; Huang, G.; Wu, R.G.; Wang, L. Structure and dynamics of a wave train along the wintertime Asian jet and its impact on East Asian climate. Clim. Dyn. 2018, 51, 4123–4137. [Google Scholar] [CrossRef]
- Liu, Y.Y.; Wang, L.; Zhou, W.; Chen, W. Three Eurasian teleconnection patterns: Spatial structures, temporal variability, and associated winter climate anomalies. Clim. Dyn. 2014, 42, 2817–2839. [Google Scholar] [CrossRef]
- Kalnay, E.; Kanamitsu, M.; Kistler, R.; Collins, W.; Deaven, D.; Gandin, L.; Iredell, M.; Saha, S.; White, G.; Woollen, J.; et al. The NCEP/NCAR 40-year reanalysis project. Bull. Am. Meteorol. Soc. 1996, 77, 437–471. [Google Scholar] [CrossRef]
- Chen, M.Y.; Xie, P.P.; Janowiak, J.E.; Arkin, P.A. Global land precipitation: A 50-yr monthly analysis based on gauge observations. J. Hydrometeorol. 2002, 3, 249–266. [Google Scholar] [CrossRef]
- Rayner, N.A.; Parker, D.E.; Horton, E.B.; Folland, C.K.; Alexander, L.V.; Rowell, D.P.; Kent, E.C.; Kaplan, A. Global analyses of sea surface temperature, sea ice, and night marine air temperature since the late nineteenth century. J. Geophys. Res. 2003, 108, 4407. [Google Scholar] [CrossRef]
- Climate Prediction Center Internet Team. Climate Prediction Center, National Oceanic and Atmospheric Administration Center for Weather and Climate Prediction, National Oceanic and Atmospheric Administration/National Weather Service. Available online: http://origin.cpc.ncep.noaa.gov/products/analysis_monitoring/ensostuff/detrend.nino34.ascii.txt (accessed on 30 January 2019).
- Efron, B.; Tibshirani, R.J. An Introduction to the Bootstrap; Chapman and Hall/CRC: New York, NY, USA, 1993. [Google Scholar]
- Wallace, J.M.; Gutzler, D.S. Teleconnections in the geopotential height field during the Northern Hemisphere winter. Mon. Weather Rev. 1981, 109, 784–812. [Google Scholar] [CrossRef]
- Chen, W.; Graf, H.F.; Huang, R.H. The interannual variability of East Asian winter monsoon and its relation to the summer monsoon. Adv. Atmos. Sci. 2000, 17, 48–60. [Google Scholar]
- Wang, L.; Liu, Y.Y.; Zhang, Y.; Chen, W.; Chen, S.F. Time-varying structure of the wintertime Eurasian pattern: Role of the North Atlantic sea surface temperature and atmospheric mean flow. Clim. Dyn. 2018. [Google Scholar] [CrossRef]
- Wang, J.; Zhu, Z.; Qi, L.; Zhao, Q.; He, J.; Wang, J.X.L. Two pathways of how SST anomalies drive the interannual variability of autumnal haze days in the Beijing–Tianjin–Hebei region, China. Atmos. Chem. Phys. Discuss. 2018. [Google Scholar] [CrossRef]
Figure 1.
(a) Precipitation anomalies of normalized precipitation in the 2017 winter based on station observation; (b) same as (a), but based on PREC/L data; (c) the normalized winter mean normalized North China precipitation index (NCPI) for the period 1951–2017. Shading intervals (SIs) are 10% in (a,b). Dots in (a) indicate the 17 stations to construct the NCPI.

Figure 2.
The anomalies of (a) 300 hPa geopotential height, (b) 850 hPa winds, and (c) water vapor transport (vector) and its intensity (shading) in the 2017 winter. SIs are 20 gpm in (a) and 40 kg m−1 s−1 in (c).
Figure 2.
The anomalies of (a) 300 hPa geopotential height, (b) 850 hPa winds, and (c) water vapor transport (vector) and its intensity (shading) in the 2017 winter. SIs are 20 gpm in (a) and 40 kg m−1 s−1 in (c).

Figure 3.
The anomalies of meridional circulation (vector) and vertical velocity in pressure coordinates (shading) averaged over 110° E–120° E in the 2017 winter. SIs are 0.25 × 10⁻² Pa s−1, and vertical components of the vectors were multiplied by a factor of 100 for visual purpose.
Figure 3.
The anomalies of meridional circulation (vector) and vertical velocity in pressure coordinates (shading) averaged over 110° E–120° E in the 2017 winter. SIs are 0.25 × 10⁻² Pa s−1, and vertical components of the vectors were multiplied by a factor of 100 for visual purpose.

Figure 4.
Regressed winter mean (a) 300 hPa geopotential height, (b) 850 hPa winds, and (c) water vapor transport (vector) and its intensity (shading) onto the normalized negative NCPI for the period 1951–2017. Contour intervals (CIs) are 10 gpm in (a) and 10 kg m−1 s−1 in (c), with zero contour being omitted. Shading indicates the 95% confidence level based on the 10,000-times bootstrap resampling.

Figure 5.
Regressed winter mean meridional circulation (vector) and vertical velocity in pressure coordinates (shading) averaged over 110° E–120° E onto the normalized negative NCPI for the period 1951–2017. CIs are 0.2 × 10⁻² Pa s−1, and vertical components of the vectors are multiplied by a factor of 100 for visual purpose. Shading indicates the 95% confidence level based on the 10,000-times bootstrap resampling.

Figure 6.
(a) Regressed winter mean SST onto the normalized negative NCPI for the period 1951–2017; (b) the SST anomalies in the 2017 winter. CIs are 0.05 °C in (a) with zero contour being omitted, and SIs are 0.25 °C in (b). Shading in (a) indicates the 95% confidence level based on the 10,000-times bootstrap resampling.

Figure 7.
The normalized winter mean EU index (blue line) and Niño-3.4 index (green bar) for the period 1951–2017.
Figure 7.
The normalized winter mean EU index (blue line) and Niño-3.4 index (green bar) for the period 1951–2017.

Figure 8.
Composite anomalies of winter mean normalized precipitation during winters with positive EU pattern alone based on (a) station observation from Chinese stations and (b) PREC/L dataset; (c,d) are the same as (a,b), but for the composite during La Niña winters alone; (e,f) are the same as (a,b), but for the composite during winters with both positive EU pattern and La Niña. SIs are 10%, and dots indicate the 95% confidence level based on the 10,000−times bootstrap resampling.


Table 1.
Three groups of winters with the positive phase of EU pattern alone (group 1), La Niña alone (group 2), and both positive EU pattern and La Niña (group 3).
Table 1.
Three groups of winters with the positive phase of EU pattern alone (group 1), La Niña alone (group 2), and both positive EU pattern and La Niña (group 3).
| Group No. | Criterion | Year |
|---|---|---|
| 1 | Positive EU | 1954, 1955, 1964, 1967, 1970, 1971, 1973, 1974, 1975, 1983, 1984, 1988, 1995, 1996, 1998, 1999, 2000, 2005, 2007, 2008, 2010, 2011, 2017 |
| 2 | La Niña | 1952, 1954, 1956, 1960, 1961, 1967, 1969, 1976, 1980, 1983, 1994, 1999, 2004, 2005, 2011, 2014, 2015, 2017 |
| 3 | Positive EU and La Niña | 1954, 1967, 1983, 1999, 2005, 2011, 2017 |
© 2019 by the authors. Licensee MDPI, Basel, Switzerland. This article is an open access article distributed under the terms and conditions of the Creative Commons Attribution (CC BY) license (http://creativecommons.org/licenses/by/4.0/).
Share and Cite
MDPI and ACS Style
Wang, L.; Wang, L.; Liu, Y.; Chen, W. The 2017–2018 Winter Drought in North China and Its Causes. Atmosphere 2019, 10, 60. https://doi.org/10.3390/atmos10020060
AMA Style
Wang L, Wang L, Liu Y, Chen W. The 2017–2018 Winter Drought in North China and Its Causes. Atmosphere. 2019; 10(2):60. https://doi.org/10.3390/atmos10020060
Chicago/Turabian StyleWang, Lijuan, Lin Wang, Yuyun Liu, and Wen Chen. 2019. "The 2017–2018 Winter Drought in North China and Its Causes" Atmosphere 10, no. 2: 60. https://doi.org/10.3390/atmos10020060
Note that from the first issue of 2016, this journal uses article numbers instead of page numbers. See further details here.