Spatial and Temporal Distribution of Aerosol Optical Depth and Its Relationship with Urbanization in Shandong Province


1
College of Geomrtics, Shandong University of Science and Technology, Qingdao 266590, China
2
College of Earth Science and Engineering of Shandong University of Science and Technology, Qianwangang Road, Huangdao Zone, Qingdao 266590, China
3
Qingdao Yuehai Information Service Co., Ltd., Qingdao 266590, China
*
Author to whom correspondence should be addressed.
Atmosphere 2019, 10(3), 110; https://doi.org/10.3390/atmos10030110
Submission received: 29 January 2019
/
Revised: 20 February 2019
/
Accepted: 27 February 2019
/
Published: 1 March 2019
(This article belongs to the Special Issue Urban Atmospheric Aerosols: Sources, Analysis and Effects)
Abstract
:In the process of rapid urbanization, air environment quality has become a hot issue. Aerosol optical depth (AOD) from Moderate Resolution Imaging Spectroradiometer (MODIS) can be used to monitor air pollution effectively. In this paper, the Spearman coefficient is used to analyze the correlations between AOD and urban development, construction factors, and geographical environment factors in Shandong Province. The correlation between AOD and local climatic conditions in Shandong Province is analyzed by geographic weight regression (GWR). The results show that in the time period from 2007 to 2017, the AOD first rose and then fell, reaching its highest level in 2012, which is basically consistent with the time when the national environmental protection decree was issued. In terms of quarterly and monthly changes, AOD also rose first and then fell, the highest level in summer, with the highest monthly value occurring in June. In term of the spatial distribution, the high-value area is located in the northwestern part of Shandong Province, and the low-value area is located in the eastern coastal area. In terms of social factors, the correlation between pollutant emissions and AOD is much greater the correlations between AOD and population, economy, and construction indicators. In terms of environmental factors, the relationship between digital elevation model (DEM), temperature, precipitation, and AOD is significant, but the regulation of air in coastal areas is even greater. Finally, it was found that there are no obvious differences in AOD among cities with different development levels, which indicates that urban development does not inevitably lead to air pollution. Reasonable development planning and the introduction of targeted environmental protection policies can effectively alleviate pollution-related problems in the process of urbanization.
1. Introduction
With the acceleration of China’s industrialization process and the continuous growth of energy consumption, atmospheric aerosols have gradually become one of the main atmospheric pollutants [1,2,3,4], and research on China’s atmospheric pollution continues to intensify. In recent years, air pollution has greatly affected people’s health and daily lives. Aerosols, which play an important role in the atmospheric environment, have been a major concern of the social science community.
Atmospheric aerosol refers to a stable mixture of solid particles and liquid particles that are suspended in air. They generally have diameters between 0.001 and 100 μm. Atmospheric aerosols are mainly derived from human activities [5,6,7,8,9] (such as petrochemical fuel use, industrial exhaust emissions) and natural production [7,10]. Aerosols affect atmospheric visibility and human health [11,12,13]. Studies have shown that in cities, atmospheric aerosol concentration is closely related to chronic diseases, such as emphysema and tracheitis, and the changing trend in aerosol concentration is basically consistent with the frequency of respiratory disease development during the same period, and the two are positively correlated [13]. Atmospheric aerosols also affect the balance of atmosphere–ground radiation through direct [14,15,16] and indirect [10,17] climate effects, which is one of the most uncertain factors in climate change. The effects of aerosols on climate have attracted great attention from the scientific community [18,19]. The Aerosol Optical Depth (AOD), as one of the most basic optical properties of aerosols, is defined as the integral of the extinction coefficient of the medium in the vertical direction, which describes the reduction effect of aerosols on light. The MODIS AOD is a kind of data with wide coverage and more accuracy compared with other sources of currently available aerosol data, and it is also a key factor used to evaluate the degree of atmospheric pollution and to determine the aerosol climate effect [20,21,22,23,24,25]. It is often used in the study of aerosol change characteristics and regional climatic effects. In recent years, domestic and foreign scholars conducted a lot of research on the spatial and temporal distribution and variation characteristics of AOD [14,26,27,28,29,30,31], atmospheric environmental pollution monitoring [32], climate change impact [2,27], and other aspects of this topic and have made great progress.
In the process of urbanization, economic development also increases energy consumption and pollutant emissions. High-intensity human activities also cause the release of a large amount of harmful particulate matter into the atmosphere, seriously affecting air quality and human health. Studying the relationship between AOD and urbanization is of great significance for maintaining and improving the quality of the atmospheric environment [6,8,9,10,17,33,34,35,36].
Most of the above studies on the relationship between AOD and urbanization used population or economic factors to represent the level of urban development, but the influences of the topographic environment and climate cannot be ignored in the aerosol research process [18,37,38]. This paper uses Shandong province, China as an example to analyze the spatial and temporal distribution and change rules of AOD and its relationship with the urbanization development process, as follows: (1) The spatial and temporal distribution and change characteristics of AOD are analyzed on year, quarter and month time scales, which reveals the spatial distribution and change rules of AOD in Shandong province; (2) the correlations between AOD change and social and economic factors, such as the urban population, urban economic development data, and the main pollution emission data are analyzed to determine the degree of influence of various indicators on air quality; and (3) the correlation between AOD and urban level distribution is analyzed to study the response of AOD to urbanization. Since AOD is greatly affected by the topographic environment and climatic temperature, this paper takes into account elevation, temperature, and precipitation when studying the relationship between AOD and urbanization to better analyze and explain the correlation between them. This study can provide decision-making support for the environmental protection of cities in Shandong province [39,40], as well as providing as reference for similar analysis of cities in other provinces.
2. Study Area, Materials, and Methodology
2.1. Study Area
This study used Shandong Province as the analysis object and carried out research on the spatiotemporal distribution and variation characteristics of aerosol optical depth and its response to urbanization. Shandong Province is located on the eastern coast of China. The territory includes a peninsula and inland area. The peninsula protrudes into the Bohai Sea and the Yellow Sea. It is opposite the Liaodong Peninsula and includes Qingdao, Yantai, and Weihai, as well as most or part of Weifang, Rizhao, Dongying, and Binzhou. The inland part is bordered by Hebei, Henan, Anhui, and Jiangsu provinces from north to south, including Liaocheng, Dezhou, Jinan, Tai’an, Laiwu, Dongying, Zibo, Zaozhuang, Linyi, Jining, and the remaining parts of Weifang, Rizhao, Dongying, and Binzhou. The location map of Shandong Province is shown in Figure 1.
The air quality in coastal and inland cities of Shandong Province is affected by the ocean to varying degrees. The air quality in coastal cities is obviously directly controlled by the ocean [41,42,43]. However, the air quality in inland cities is less affected by the ocean. Generally, the wind speed in coastal areas is higher than that in inland areas, and the atmospheric diffusion conditions are good. Moreover, there are obvious differences in temperature and rainfall among cities in the province. The annual average temperature in the province decreases from southwest to northeast, and in the hilly areas of the peninsula, it is lower than in other regions. The annual average precipitation in most parts of Shandong Province is between 600 mm and 750 mm, and this has greater distribution in the north than in the south. The population density, economic strength, and urbanization levels of the cities in Shandong Province are quite different, and the urbanization development in Shandong Province is relatively unbalanced.
Based on the above analysis, when studying the spatial and temporal distribution and variation characteristics of aerosol optical data in Shandong province and their relationship with the level of urbanization, social factors such as urban population, urban construction area, and sewage discharge should be taken into account as well as the impact of the urban geographical location and climate.
2.2. Materials
The data used in this paper mainly included MODIS aerosol data from 2007 to 2017, total urban population data of Shandong Province, the green land area for urban construction, the secondary industry gross output value, urban soot, sulfur dioxide, nitrogen oxide emissions, the urban annual average temperature, precipitation, and digital elevation data.
2.2.1. Aerosol Data
AOD is defined as the integral of the extinction coefficient of the medium in the vertical direction, and it describes the effect of aerosol on light attenuation. It is one of the most important parameters of aerosols, the key physical quantity that characterizes the degree of atmospheric turbidity, and an important factor for determining the climatic effects of aerosols. The aerosol data used in this paper were derived from the MODIS c6 aerosol product released by the National Aeronautics and Space Administration (NASA) website. This product combines two inversion algorithms: the Dark Target (DT) algorithm and the Deep Blue (DB) algorithm. Many domestic scholars have verified the AOD dataset MODIS product at a wavelength of 550 nm, and AOD has been studied in some parts of China using the product. It is believed that MODIS aerosol products have reached the corresponding quality requirements and can be used to study the distribution and variation of terrestrial AOD in China [44,45,46]. This study used the AOD dataset with a resolution of 10 km for MODIS4, and the time series used was from 1 January 2007 to 31 December 2017.
2.2.2. Urbanization Related Data
Urbanization is a process in which the population of a region becomes relatively concentrated in cities from towns, which leads to the growth of the urban population, the expansion of urban land, and changes in the social and economic structure. This study analyzed the correlations between AOD values and the population density, the green land area for urban construction, and the regional secondary industry gross product in Shandong province, and explores the influences of these three factors on AOD value changes. During the process of urbanization, the emissions from gas pollution change continuously, which has a significant impact on AOD. This study also analyzed the relationships between AOD and soot, sulfur dioxide, and nitrogen oxides. The six elements of data were all sourced from the Shandong Provincial Bureau of Statistics. The soot, sulfur dioxide, and nitrogen oxide data are the total emissions of the index in the whole province in each year, the sources of which include industrial production as well as from factors related to people’s daily lives.
Urbanization not only includes the population and social economy, but also involves cultural education, politics, transportation, and other aspects of information. It is impossible to fully understand the relationship between urbanization and AOD by relying on a single indicator. Indicators of China at the city level include the number of first-line brands, GDP, the per capita income, 211 universities, multinational top 500 entry numbers, major companies’ strategic city rankings, airport throughput, large company entry, consulate number, and international routes. A total of ten indicators were calculated to comprehensively represent the development level of urbanization. In this paper, the city level data of 17 cities in Shandong Province in 2016 were used, as shown in Figure 2.
2.2.3. Shandong Digital Elevation Model Data
Topography has an impact on the depth of AOD. Most scholars at home and abroad also believe that elevation has an impact on the spatial distribution of AOD. Therefore, Digital Elevation Model (DEM) data was used as one of the influencing factors to study. DEM data of 90 m resolution were downloaded from the China natural resources satellite image cloud service platform, and the data were processed into the same resolution as AOD aerosol data by means of resampling. Figure 3 shows (a) the original DEM data and (b) the resampled DEM data.
2.3. Methodology
The data processing involved in this paper mainly involved the acquisition of aerosol data, projection definition, image cropping, data aggregation, and mean calculation to study the spatial and temporal distribution and variation characteristics of AOD. In this paper, first, AOD data were subjected to Lambert projection, and then the image was cut using Shandong Province as a mask. Finally, the cut AOD data were aggregated and averaged. The obtained aerosol data were first screened to ensure its accuracy before the calculation of AOD, and the valid data (data were considered valid if the percentage of valid pixels in the image data was greater than 50%) were retained. Then, the annual, quarterly, monthly aggregation, and mean values of the aerosol product data were calculated by ArcGIS. The equations are shown in (1) and (2). The monthly average AOD of Shandong Province analyzed in the paper was obtained by accumulating the daily AOD and then averaging. The quarterly average AOD and annual average AOD were obtained by accumulating the monthly average AOD and quarterly average AOD. The monthly division criterion used was the natural month when analyzing the monthly changes in AOD. The quarterly divisions used were spring from March to May, summer from June to August, autumn from September to November, and winter from December to February.
In the equation, is the aerosol aggregated data, which was used to represent the average distribution of the aerosol optical depth, AOD represents the effective aerosol data participating in the superposition, s represents the s-th image data, and S represents the total number of superimposed images.
represents the average value of AOD; is the pixel value of the i-th row and the j-th column in the aerosol optical depth average distribution image calculated by Equation (1); m and n respectively represent the total number of rows and the total number of columns in the image data; and N represents the total number of cells participating in the operation.
This study used the Spearman rank correlation test to measure the correlations between two variables to study the relationship between AOD values and the green land area for urban construction and the urban population. The principle was to sort the original data from large to small and to record the position of the original data as in the sorted list. is called the rank of , and the rank difference is . The Spearman rank correlation coefficient is
The Spearman correlation coefficient was used to analyze the correlation between AOD and the urban population, which was based on a continuous time series and did not consider geographical location characteristics. However, the relationship between precipitation and AOD will change with the geographical location. This paper considered the spatial distribution of the two and finally adopted the Geographically Weighted Regression (GWR) method to explore the relationship between this factor and the urban AOD. The GWR model is shown in (4):
In the Equation (4), x is the independent variable, y is the dependent variable, k is the number of dependent variables, j is the sample point, is the spatial location of the sample point i, is the intercept, and is the equation coefficient, which varies with the spatial location of the sample point. Each local is used to estimate its adjacent spatial observation value. The core of the model is the selection of the spatial weight matrix. In this study, Gaussian function was selected as the method to select the spatial weight coefficient, which is one of the most commonly used methods. The expression equation of Gaussian function is as follows:
GWR is a local form of linear regression used to model spatial variation relations. It constructs an independent equation for each element in the data set, which is used to combine the dependent variables and explanatory variables of elements falling within the bandwidth of each target element. The shape and range of the bandwidth depends on the user’s input parameters, such as the kernel type, bandwidth method, distance, and number of adjacent elements. The commonly used kernel types include FIXED (the kernel surface is created by selecting the bandwidth at a certain distance) and ADAPTIVE (the kernel surface function is created according to the density of element sample distribution). The most commonly used bandwidth methods are CV, AIC, and BANDWIDTH_PARAMETER. In this study, the FIXED type was selected as the core type. The FIXED type was used to select the bandwidth according to a certain distance to create the core surface. It can generate a smoother core surface compared with ADAPTIVE. This study adopted the AIC method for bandwidth selection to achieve a better fitting degree. AIC determines the best bandwidth by the minimum information criterion, which is a standard to measure the excellent performance of statistical model fitting. The AIC function expression is as follows:
where the trace tr(S) of the hat matrix S is a function of the bandwidth b, and is the maximum likelihood estimate of the variance of the random error term, and . For the same sample data, the bandwidth corresponding to the geographic weighted regression weight function with the minimum AIC value is the optimal bandwidth. This study applied it to analyze the differences in AOD among cities with different development grades, because it is a suitable way to test the differences between the unpaired data of independent samples. The main principle of the Wilcoxon rank-sum method is to assume that there are no significant differences between the samples. The following test parameters were calculated:
where T is the sum of the smallest rank order of the two groups of independent data. If T is in the test value interval determined by table lookup comparison, then and is not rejected; otherwise, and is rejected. The Z-statistic was used when the data volume was more than 10, and the Z-value was tested with the normal distribution method.
This study analyzed the spatial and temporal distribution of AOD in Shandong Province and its relationship with urbanization from four aspects. Firstly, the spatial and temporal distribution and the variation characteristics of AOD were analyzed by means of aggregation and mean value calculation of AOD. Secondly, the Spearman coefficient was used to analyze the correlation between AOD and urban population, the green land area for urban construction, the secondary industry GDP, and other factors to determine the impacts of urban population growth and social and economic development on AOD in the process of urbanization. Thirdly, GWR was used to explore the correlation degree of precipitation and other weather conditions on the local distribution of AOD. Fourthly, the Wilcoxon rank-sum method was used to compare and analyze the AOD differences among cities with different development levels.
3. Results and Analysis
3.1. Temporal and Spatial Distribution and Variation Characteristics of AOD
3.1.1. Annual Average Distribution and Variation Characteristics of AOD
The 11-year distribution and multi-year average distribution of AOD in Shandong Province from 2007 to 2017 are shown in Figure 4. According to the spatial distribution of AOD in the Shandong region for many years, it is concluded that from 2007 to 2017, although the intensity of the high value center of AOD in Shandong Province had some differences, the characteristics of the regional distribution center were generally of the single-high-low type and remained unchanged. A low center is located in Weihai, Yantai, and eastern Qingdao, an area close to the Yellow Sea and Bohai Sea. The AOD is around 0–0.3, which is related to the high wind speeds and good atmospheric diffusion conditions in the coastal areas. The high center is located in Liaocheng and Jining, Dezhou, Binzhou, Jinan, Tai’an, Laiwu, northern Zibo, Dongying West, and northern Weifang, which are densely populated and industrially developed, with AOD values of around 0.4–0.7.
The average value of the aggregated AOD in Shandong Province from 2007 to 2017 was calculated, and the AOD value changes in Shandong Province from 2007 to 2017 were obtained, as shown in Figure 5. It can be seen from the figure that, in 2007, the mean AOD of the whole province was about 0.39, slightly decreased to 0.37 in 2008, and then increased year by year until reaching its highest peak of 0.53 in 2012. It decreased significantly to 0.46 in 2013 and showed a downward trend year by year from 2014 to 2017. In general, there has been a trend of increasing first and then decreasing in the past 11 years. To further verify this trend, we constructed unitary linear regression functions for the years of 2007–2012 and 2012–2017, respectively, with 2012 as the boundary. As shown in Figure 6, 2007–2012 showed a growth trend with a slope of 0.0267 and an value of 0.7313. The years 2012–2017 showed a downward trend with a slope of −0.0263 and an value of 0.8112. From 2007 to 2012, Shandong Province made great efforts to develop its economy through industry, which brought a serious impact on the environment. Additionally, AOD showed an obvious growth trend. After 2012, Shandong Province changed its economic development model, advocated green development, dealt with polluting enterprises, and maintained a steady downward trend in AOD. The environment has improved markedly.
3.1.2. AOD Quarterly Average Distribution and Variation Characteristics
The 11-year average AOD distribution in spring, summer, autumn, and winter in Shandong Province from 2007 to 2017 is shown in Figure 7. As can be seen from the figure, the AOD in the east of Weihai, Yantai, and Qingdao was very low, ranging from 0 to 0.3, and the change range between each quarter of the year was not large. Additionally, Dezhou, Binzhou, and Jinan were the areas with high AOD values, and AOD changed significantly among the seasons from 0.3 to 1.0. In spring and summer, the AOD in Weihai, Yantai, and eastern Qingdao was relatively low, around 0–0.3. Dezhou, Binzhou, Dongying, Jinan, the northern part of Tai’an, Laiwu, and Weifang were high AOD value areas where the AOD was about 0.6–1.0. The AOD values of Dezhou, Jinan, Binzhou, and Dongying were very high, around 0.8–1.0. In autumn, the AOD value of inland cities in Shandong Province was generally around 0.3–0.6, and in winter, the AOD value of Shandong Province was generally around 0–0.3. If the quarterly average AOD value is greater than 0.5, it is defined as a high value. The high value area of AOD was the largest in summer, followed by spring and autumn, and it was the smallest in winter. The main reasons for the significant differences in AOD between coastal and inland cities can be summarized as follows. Firstly, coastal areas mainly rely on marine resources to develop their economies, while inland areas depend on industrial development economies and therefore have serious air pollution. The hills in central Shandong have weakened the impact of monsoons from the oceans on inland areas, thereby reducing the ability of air pollutants to dissipate.
The mean values of aggregated AOD in Shandong Province during the four quarters (spring, summer, autumn and winter) in 2007 to 2017 were calculated. As shown in Figure 8a, the overall trend of AOD is slowly declining, and the quarterly line changes periodically with the four seasons. The peak values varied significantly in different years, while the lowest values fluctuated less. As can be seen from the Figure 8b, the AOD value in spring in Shandong Province was around 0.35–0.7. The AOD value in summer in Shandong Province was around 0.4–0.8. The AOD value in autumn in Shandong Province was about 0.3–0.45. The AOD value in winter in Shandong province was about 0.2, the lowest value of the four seasons. There are different annual changes in different seasons. The value in autumn and winter is low and stable, and there is no obvious change trend. This is affected by the northern monsoon. The aerosol spreads well and is not easy to aggregate. The spring and summer have higher values and the trend is roughly the same as the average trend of the year. Its value is mainly affected by dust and pollution emissions. But there was an unusually low point in the summer of 2016. The reason for the abnormal AOD in the summer of 2016 is that Shandong province took compulsory measures to close down and rectify a large number of polluting enterprises in the summer of 2016, which resulted in a sharp decline in pollution in this quarter.
3.1.3. AOD Monthly Average Distribution and Variation Characteristics
The distribution of the multi-year average aerosol optical depth in Shandong Province from 2007 to 2017 is shown in Figure 9. It can be seen from the figure that the AOD in Shandong Province was generally around 0–0.3 in January, February, and December. In March, September, October, and November, except for the low AOD values of 0–0.3 in Weihai, Yantai, and eastern Qingdao, the AOD values were generally around 0.4–0.6. In April and May, the AOD values of Liaocheng, Dezhou, Binzhou, Dongying, Jinan, and Weifang in Shandong Province were about 0.4–0.8. In June, July, and August, a large number of high-value areas appeared, namely Liaocheng, Dezhou, Binzhou, Dongying, Jinan, Tai ’an, Laiwu, and Weifang, where the AOD was around 0.8–1.1. In June and July, the AOD in Binzhou and Dongying exceeded 1.1. The high value area of AOD was the largest in June and July, followed by May, then April and August, and the AOD in other months was generally less than 0.5.
The mean values of the monthly aggregated AOD in Shandong province from 2007 to 2017 were calculated, and the AOD changes in Shandong Province during the 12 months from 2007 to 2017 were obtained, as shown in Figure 10. As can be seen from the figure, the monthly variation in AOD in Shandong province presented a single peak, which increased from January onwards, and the maximum value of AOD appeared in June before gradually decreasing. This is consistent with the research results of Zheng Xiaobo et al. Due to dust invasion in spring, the AOD thickness increases. The high temperature in summer promotes the transformation of secondary organic aerosol particles to a great extent. Moreover. Shandong Province is in the peak period of wheat harvest in June each year, and people have the habit of burning straw, so a large amount of artificial aerosol particles are discharged into the atmosphere, resulting in the average aerosol optical thickness reaching the highest value during this period. However, with the increase in rainfall in July and August, the AOD decreases obviously.
3.2. Response Analysis of AOD to Social and Economic Factors
The AOD and socio-economic factor data from Shandong Province from 2007 to 2017 (including total urban population, green land area for urban construction, the regional GDP of the secondary industry, soot emissions, emissions, nitrogen oxide emissions) are shown in Table 1.
It can be seen from Table 1 that from 2007 to 2017, the total urban population, the area of urban green land for construction, and the output value of the secondary industry in Shandong Province all showed an increasing yearly trend due to social development, and the growth rates in the past 11 years were about 7%, 83.42%, and 124.9%, respectively. From 2007 to 2017, the growth rate of green coverage in the built-up area was 83.42%. Although the green coverage rate in the built-up area showed an increasing trend, it was relatively low compared with the growth rate of the output values and the emission change rate of various pollution gases. Therefore, Spearman rank correlation test was adopted to measure the correlations between two variables, and the correlation coefficients are shown in Table 2.
As can be seen from Table 2, AOD has an insignificant positive correlation with the total urban population, the area of urban green land for construction, and the output value of the secondary industry, with correlation coefficients of 0.191, 0.21, and 0.21 respectively, and there were relatively high positive correlations with soot, and nitrogen oxides, with correlation coefficients of 0.393, 0.329, and 0.867, respectively. Among these factors, there was a significant correlation with the bilateral test of nitrogen oxide emissions at the confidence level of 0.01. Generally speaking, an increase in vegetation can increase the ability of the surface to absorb particles, and then AOD will have a significant downward trend. The greening rate of urban District in Shandong Province is increasing year by year as shown in Table 1, but the inhibition effect on AOD is not obvious. Because many people are packed into cities during the process of urbanization, urban construction land expands rapidly, human activities increase significantly, producing a large amount of pollutants (soot, SO2, nitrogen oxides, etc.) that directly acting on aerosol generation. The amount of anthropogenic aerosol is much higher than the amount of aerosol adsorbed by the vegetation.
3.3. Response Analysis of AOD to Terrain and Weather Conditions
The elevation data were resampled to obtain data with the same resolution as AOD, and the pixel values were extracted for the correlation analysis of the average AOD over 11 years. From 2007 to 2017, the AOD data from one year were randomly selected, and then the relevant analysis results with the average temperature and precipitation (annual precipitation depth) of prefecture-level cities in the current year were shown in Table 3.
The correlation coefficient between elevation and AOD was −0.430, and this was a significant correlation at the 0.01 level (both sides), indicating that the altitude has a negative correlation with AOD. The higher the altitude is, the better the pollution gas diffusion will be, and the lower the AOD index will be. Places with higher altitude are not suitable for the development of heavy industry, and they is also not conducive to having a dense population, so the amount of pollution generated is also greatly reduced. The correlation coefficient between temperature and AOD was 0.585, showing a horizontal correlation at the 0.05 level (two sides). An increase in temperature promotes the generation of aerosol transformation and is not conducive to the condensation and transformation of small and medium particles in the air. The correlation coefficient between precipitation and AOD was 0.341. Generally speaking, precipitation has a scouring effect on aerosols, which is negatively correlated with AOD. However, many studies have shown that the interaction between aerosol and precipitation is complex. Precipitation is the main way to remove aerosol particles. However, the increase in aerosol optical thickness inhibits the occurrence of light rain in summer in north China, and convective precipitation is more likely to occur, and the incidence of heavy rain has increased significantly. As a result, the correlation coefficient between AOD and precipitation in the study area is positive. The Geographical Weighted Regression method was used to further analyze the influence of precipitation on AOD in local areas. In the GWR model, the precipitation data from 17 cities were used as the independent variable, and the AOD values of cities were used as the dependent variable to analyze the GWR model. As shown in Figure 11, the GWR model’s fitting degree R2 was 0.74 and the adjusted fitting degree R2 was 0.625. The standardized residual value in 88% of the regions in the whole province ranged from −1.5 to 1.5, indicating that the GWR model had a good fitting effect overall. The urban precipitation in Shandong Province has a significant impact on the temporal and spatial distribution of AOD. In Weihai, the impact of the marine environment was shown to be greater than the adjustment of precipitation, so the residual value was obviously too small.
3.4. Analysis of AOD’s Response to the Urbanization Process
Taking the geographical distribution of AOD in Shandong Province and the spatial distribution of the city level in 2017 as an example, the relationship between AOD and urbanization level was studied. Among the 17 cities in Shandong Province in 2017, Qingdao, Jinan, Yantai and Zibo are second-tier cities with a large scale, developed economy, and frequent human activity. Weifang and Dongying are third-tier cities, with larger areas and more developed economies. Laiwu is a six-line city with a small scale, backward economic development, and a low urbanization level.
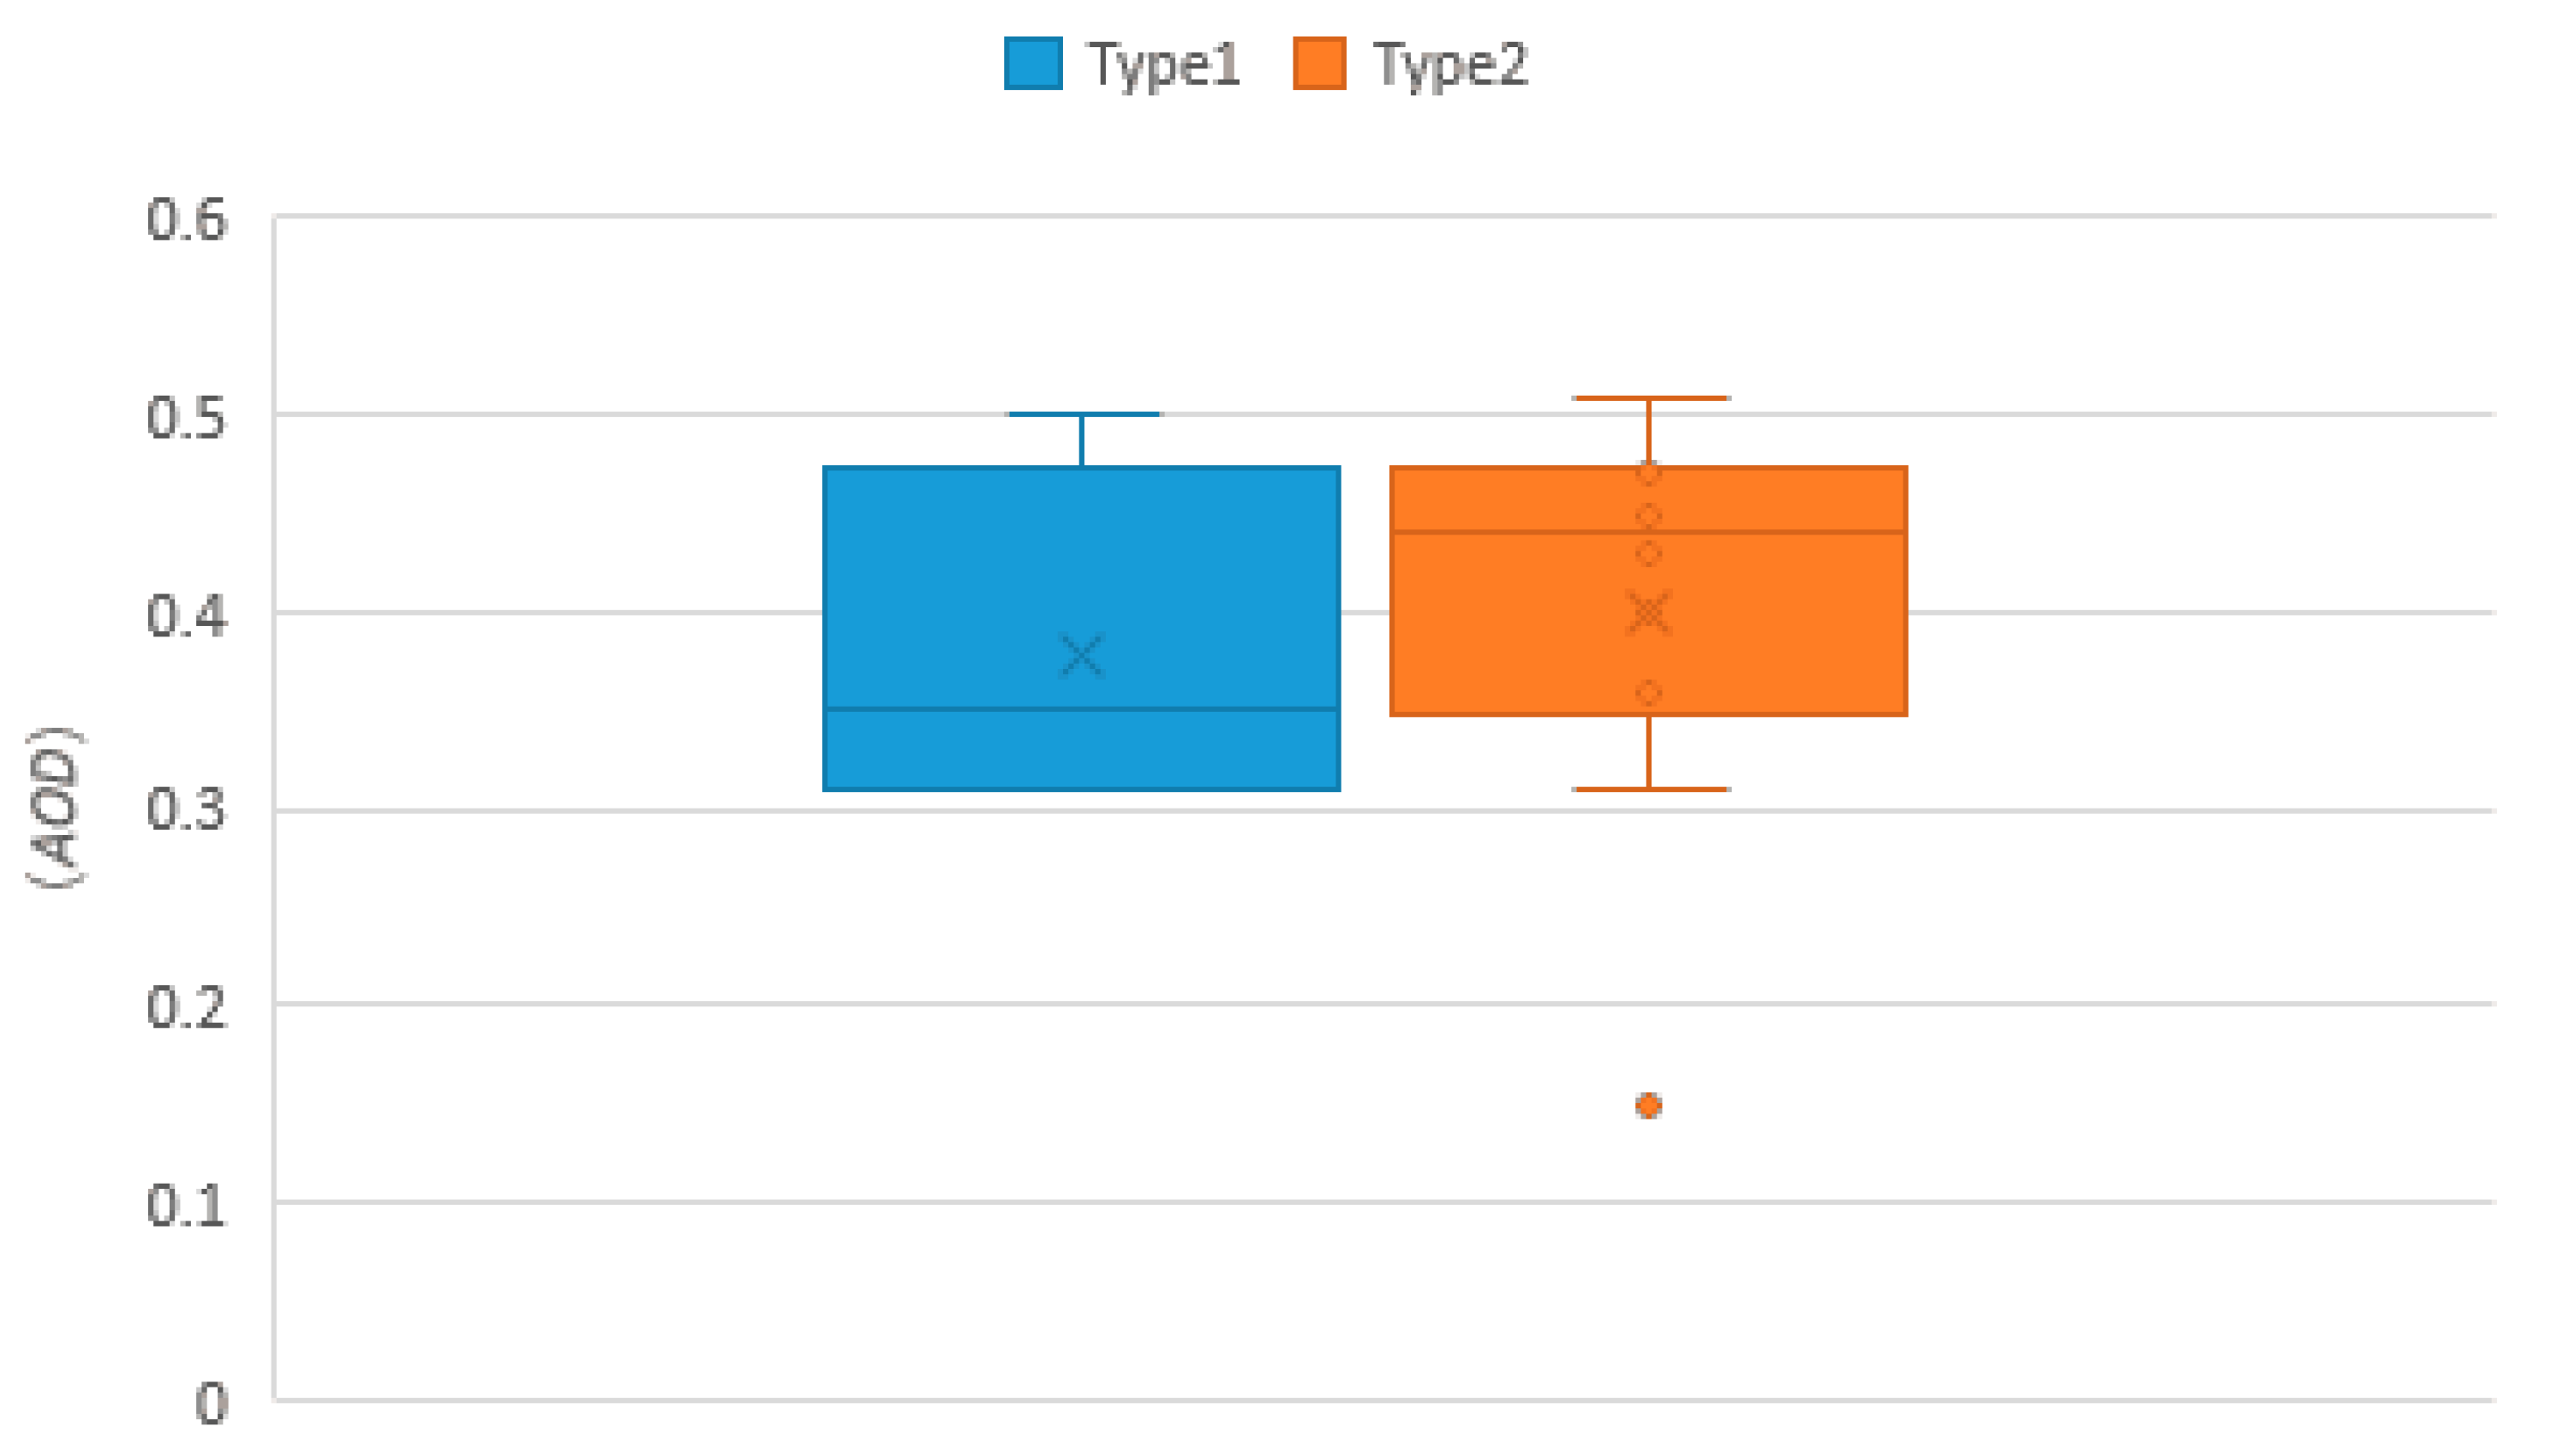
The city grade types are divided into two categories, the second-tier cities are type one, and the third-level cities and below are type two. The two groups of samples were observed using a box chart. The Figure 12 below shows that there were no significant differences in the median, range, maximum value, or minimum value between the two sets of data.
The Wilcoxon rank-sum method was used to detect the differences between AOD data from the two city types. The sum of the order of the first class cities was 28, the sum of the order of the second class cities was 125, the Z value was –0.911, the bilateral test p-value was 0.362, and the exact probability test value was 0.412. These values supported the original hypothesis that there are no significant differences in AOD values between the two city types. This shows that the relationship between the urbanization development process and the current AOD values in Shandong is not obvious.
4. Conclusions
This study analyzed the spatial and temporal distribution and variation characteristics of the AOD in 17 cities on different time scales—yearly, quarterly, and monthly—by applying the daily aerosol MODIS data from Shandong Province from 2007 to 2017, as well as data on the urban population, the green land area for urban construction, the gas pollutant discharge data, the digital elevation data, the average temperature of each city, the precipitation, and the urban development level data. The Spearman coefficient was used to explore the correlations between the multi-year AOD value of Shandong Province and the urban population. GWR was used to analyze the response of AOD spatial distribution to precipitation. The Wilcoxon rank-sum method was used to verify the relationship between urbanization development level and AOD. The conclusions are as follows:
(1) From a spatial point of view, the spatial distribution of the annual average AOD in Shandong Province includes low and high centers. The low centers are Weihai, Yantai, and eastern Qingdao. The seasonal variation of AOD is relatively stable, from 0 to 0.3. One high center is concentrated in the eastern part of Liaocheng, Dezhou, Jinan, Binzhou, and Dongying, where the annual AOD is greater than 0.5. The depth of AOD in this area varies among seasons. The AOD in spring and summer increases obviously, decreases in autumn, and reaches its lowest value in winter, but this is still slightly higher than the low value of the eastern area.
(2) From a time point of view, the AOD of Shandong Province changed between 0.37 and 0.53 from 2007 to 2017, and the overall trend was an increase first, followed by a fall, and the highest value was reached in 2012. The State Council issued a notice on the comprehensive work plan for energy conservation and emission reduction in the “Twelfth Five-Year Plan” in 2011. The Shandong Provincial Government responded positively and gradually changed the economic development model and introduced many environmental protection orders to reduce the industrial pollution. AOD has shown a downward trend since 2012 with a fitting function of and . Shandong Province has the highest AOD (0.4~0.8) in summer, followed by spring (0.35–0.7), then autumn (0.3–0.45), and finally winter (around 0.2). The monthly changes in AOD in Shandong Province are unimodal—high AOD values (greater than 0.5) appear from April to July, and the maximum values of AOD appear in June and July.
(3) There are insignificant positive correlations between AOD and the urban population, the green land area for urban construction, and the secondary industry output value. The correlation coefficients were calculated to be 0.191, 0.21, and 0.21 respectively. There are obvious positive correlations of AOD with soot, , and nitrogen oxides. The correlation coefficients were calculated to be 0.393, 0.329, and 0.867 respectively, and there was a significant correlation with nitrogen oxide emissions at the confidence level of 0.01. This shows that urban development does have a certain impact on air pollution, but pollutant emissions are the most direct cause of air quality deterioration.
(4) AOD is significantly correlated with DEM and average temperature, and the correlation coefficient with DEM was shown to be −0.430 at the significance level of 0.01 (both sides), while the correlation coefficient between temperature and AOD was calculated to be 0.585 at the significance level of 0.05 (both sides). This shows that high terrain areas are conducive to the dissipation of polluting gases. High terrain is not conducive to the development of heavy industry or dense human populations, so the pollutant gas emissions are less under normal circumstances. The higher the temperature is, the higher the AOD value is, which promotes the conversion of secondary organic aerosol particles and is not conducive to the condensation and precipitation of fine particles in the air. The spatial distribution of AOD and precipitation showed good agreement. The fitting degree of RWR of GWR model was 0.74, and the fitting degree of fit R2 was 0.625. However, for coastal cities, the comprehensive regulation of the atmosphere by the ocean is greater than the impact of precipitation on the atmosphere, and the ocean becomes the dominant factor affecting the air quality.
(5) There is no obvious connection between AOD and the urban development level. In the process of development of different cities, economic development has different focuses; depending on resources, the economic composition is not same. Therefore, we can conclude that urban development has a certain impact on the environment, but it can completely reduce the harm to the environment by choosing different economic development models.
This paper analyzed and summarized the spatial distribution and mean change characteristics of AOD in Shandong Province from 2007 to 2017 on annual, quarterly and monthly time scales. It is a powerful reference for understanding the temporal and spatial variations in the atmospheric aerosol optical depth in Shandong Province. It better explains the correlation between AOD and the level of urbanization development and could be a reference for urban development planning and regional atmospheric environmental governance.
Author Contributions
B.A., R.X. and Y.L. conceived and designed the research R.X. and Y.L. performed the experiments and analyzed the data; B.A., B.P. and H.S. contributed materials and analysis tools; R.X. and Y.L. wrote the paper.
Funding
This work was supported by The National Key R&D Program of China (No. 2017YFC1405004), The National Natural Science Foundation of China (No. 41401529).
Acknowledgments
We are very grateful to the editor and reviewers for their meaningful comments and helpful suggestions. This study was supported by The National Key R&D Program of China (No. 2017YFC1405004), The National Natural Science Foundation of China (No. 41401529). We are grateful to the data providers (National Aeronautics and Space Administration (NASA), Shandong Provincial Bureau of Statistics, China Natural Resources Satellite Image Cloud Service Platform) for data sources in the paper.
Conflicts of Interest
The authors declare no conflict of interest.
References
- Cai, K.; Zhang, Q.S.; Li, S.S.; Li, Y.J.; Ge, W. Spatial-temporal variations in NO2 and PM2.5 over the chengdu-Chongqing Economic zone in China during 2005–2015 based on satellite remote sensing. Sensors 2018, 18, 3950. [Google Scholar] [CrossRef] [PubMed]
- Tsai, Y.I.; Kou, S.C.; Lee, W.J.; Chen, C.L.; Chen, P.T. Long-term visibility trends in one highly urbanized, one highly industrialized, and two rural areas of Taiwan. Sci. Total Environ. 2007, 382, 324–341. [Google Scholar] [CrossRef] [PubMed]
- Chow, J.C.; Watson, J.G.; Shah, J.J.; Kiang, C.S.; Loh, C.; Lev-On, M.; Lents, J.M.; Molina, M.J.; Molina, L.T. Megacities and atmospheric pollution. J. Air Waste Manag. Assoc. 2004, 54, 1226–1235. [Google Scholar] [CrossRef] [PubMed]
- Murena, F. Measuring air quality over large urban areas: Development and application of an air pollution index at the urban area of Naples. Atmos. Environ. 2004, 38, 6195–6202. [Google Scholar] [CrossRef]
- Singh, N.; Banerjee, T.; Raju, M.P.; Deboudt, K.; Sorek-Hamer, M.; Singh, R.S.; Mall, R.K. Aerosol chemistry, transport, and climatic implications during extreme biomass burning emissions over the Indo-Gangetic plain. Atmos. Chem. Phys. 2018, 18, 14197–14215. [Google Scholar] [CrossRef]
- Semoutnikova, E.G.; Gorchakov, G.I.; Sitnov, S.A.; Kopeikin, V.M.; Karpov, A.V.; Gorchakova, I.A.; Ponomareva, T.Y.; Isakov, A.A.; Gushchin, R.A.; Datsenko, O.I. Siberian smoke haze over European territory of Russia in July 2016: Atmospheric pollution and radiative effects. Atmos. Oceanic Opt. 2018, 31, 171–180. [Google Scholar] [CrossRef]
- Streets, D.G.; Yan, F.; Chin, M.; Diehl, T.; Mahowald, N.; Schultz, M.; Wild, M.; Wu, Y.; Yu, C.; Forschungszentrum. Anthropogenic and natural contributions to regional trends in aerosol optical depth, 1980–2006. J. Geophysi. Res. Atmos. 2009, 114, D00D18. [Google Scholar] [CrossRef]
- Zhao, Y.; Wang, S.; Duan, L.; Lei, Y.; Cao, P.; Hao, J. Primary air pollutant emissions of coal-fired power plants in China: Current status and future prediction. Atmos. Environ. 2008, 42, 8442–8452. [Google Scholar] [CrossRef]
- Streets, G.D.; Waldhoff, S.T. Present and future emissions of air pollutants in China: SO2, NOx, and CO. Atmos. Environ. 2000, 34, 363–374. [Google Scholar] [CrossRef]
- Li, Z.; Feng, N.; Fan, J.; Liu, Y.; Rosenfeld, D.; Ding, Y. Long-term impacts of aerosols on the vertical development of clouds and precipitation. Nat. Geosci. 2011, 4, 888–894. [Google Scholar] [CrossRef]
- Sesé, L.; Nunes, H.; Cottin, V.; Sanyal, S.; Didier, M.; Carton, Z.; Israelbiet, D.; Crestani, B.; Cadranel, J.; Wallaert, B. Role of atmospheric pollution on the natural history of idiopathic pulmonary fibrosis. Thorax 2017, 73. [Google Scholar] [CrossRef] [PubMed]
- Agarwal, K.S.; Mughal, M.Z.; Upadhyay, P.; Berry, J.L.; Mawer, E.B.; Puliyel, J.M. The impact of atmospheric pollution on vitamin D status of infants and toddlers in Delhi, India. Arch. Dis. Child. 2002, 87, 111. [Google Scholar] [CrossRef] [PubMed]
- Yang, M.; Ding, R.; Wang, S.; Shang, K. The Geological calamity and rainstorm intensity in Lanzhou city. Arid Meteorol. 2005, 23, 54–57. [Google Scholar] [CrossRef]
- Kaiser, D.P.; Qian, Y. Decreasing trends in sunshine duration over China for 1954–1998: Indication of increased haze pollution? Geophys. Res. Lett. 2002, 29, 2042. [Google Scholar] [CrossRef]
- Wild, M.; Gilgen, H.; Roesch, A.; Ohmura, A.; Long, C.N.; Dutton, E.G.; Forgan, B.; Kallis, A.; Russak, V.; Tsvetkov, A. From dimming to brightening: Decadal changes in solar radiation at Earth’s surface. Science 2005, 308, 847–850. [Google Scholar] [CrossRef] [PubMed]
- Zheng, X.; Kang, W.; Zhao, T.; Luo, Y.; Duan, C.; Chen, J. Long-term trends in sunshine duration over Yunnan-Guizhou Plateau in Southwest China for 1961–2005. Geophys. Res. Lett. 2008, 35, 386–390. [Google Scholar] [CrossRef]
- Rosenfeld, D.; Dai, J.; Yu, X.; Yao, Z.; Xu, X.; Yang, X.; Du, C. Inverse relations between amounts of air pollution and orographic precipitation. Science 2007, 315, 1396–1398. [Google Scholar] [CrossRef] [PubMed]
- Zhang, X.Y. Aerosol over China and their climate effect. Adv. Earth Sci. 2007, 22, 12–16. [Google Scholar] [CrossRef]
- Shi, G.; Wang, B.; Zhang, H.; Zhao, J.; Tan, S.; Wen, T. The radiative and climatic effects of atmospheric aerosols. Chin. J. Atmos. Sci. 2008, 32, 826–840. [Google Scholar]
- Ma, J.H.; Zheng, Y.F.; Zhang, H. The optical depth global distribution of black carbon aerosol and its possible reason analysis. Scientia Meteorologica Logica Sinica 2007, 27, 549–556. [Google Scholar] [CrossRef]
- Shan, N.; Yang, X.H.; Shi, Z.J.; Yan, F. Spatial and temporal distribution of aerosol optical depth in China based on MODIS. Sci. Soil Water Conserv. 2012, 10, 24–30. [Google Scholar] [CrossRef]
- Zeng, Q.; Chen, L.; Zhu, H.; Wang, Z.; Wang, X.; Zhang, L.; Gu, T.; Zhu, G.; Zhang, Y. Satellite-based estimation of hourly PM2.5 Concentrations using a vertical-humidity correction method from Himawari-AOD in Hebei. Sensors 2018, 18, 3456. [Google Scholar] [CrossRef] [PubMed]
- Aaron, V.D.; Martin, R.V.; Michael, B.; Ralph, K.; Robert, L.; Carolyn, V.; Villeneuve, P.J. Global estimates of ambient fine particulate matter concentrations from satellite-based aerosol optical depth: Development and application. Environ. Health Perspect. 2010, 118, 847–855. [Google Scholar]
- Yang, J.M.; Qiu, J.H.; Zhao, Y.L. Validation of aerosol optical depth from terra and aqua MODIS retrievals over a Tropical Coastal Site in China. Atmos. Oceanic Sci. Lett. 2010, 3, 36–39. [Google Scholar] [CrossRef]
- Wang, L.; Xin, J.; Wang, Y.; Li, Z.; Liu, G.; Li, J. Evaluation of the MODIS aerosol optical depth retrieval over different ecosystems in China during EAST-AIRE. Atmos. Environ. 2007, 41, 7138–7149. [Google Scholar] [CrossRef]
- Wang, P.; Ning, S.J.; Dai, J.G.; Sun, J.M.; Lv, M.J.; Song, Q.L.; Dai, X.; Zhao, J.R.; Yu, D. Trends and variability in aerosol optical depth over North China from MODIS C6 aerosol products during 2001–2016. Atmosphere 2017, 8, 223. [Google Scholar] [CrossRef]
- Buseck, P.R.; Pósfai, M. Airborne minerals and related aerosol particles: Effects on climate and the environment. Proc. Natl. Acad. Sci. USA 1999, 96, 3372–3379. [Google Scholar] [CrossRef] [PubMed] [Green Version]
- Li, J.W.; Han, Z.W. Numerical simulation of the seasonal variation of aerosol optical depth over eastern China. J. Remote Sens. 2016, 20, 205–215. [Google Scholar] [CrossRef]
- Zheng, X.B.; Lou, Y.X.; Chen, J. Climatology of aerosol optical depth over China from recent 10 years of MODIS remote sensing data. Ecol. Environ. Sci. 2012, 32, 265–272. [Google Scholar]
- Zheng, X.B.; Lou, Y.X.; Zhao, T.L.; Chen, J.; Kang, W.M. Geographical and climatological characterization of aerosol distribution in China. Scientia Geographica Sinica 2012, 32, 876–883. [Google Scholar] [CrossRef]
- Duan, Q.; Mao, J.T. Study on the distribution and variation trends of atmospheric aerosol optical depth over the Yangtze River Delta. Acta Scientiae Circumstantiae 2007, 27, 537–543. [Google Scholar] [CrossRef]
- Su, W.H.; Shen, J.; Zhang, Q.P.; Yin, X.J.; Song, W.Z.; Lu, H.R.; Liu, J.Y.; Yuan, J.W.; Zheng, X.H.; Shen, S.Z. A study of air pollution and aerosol sulfate in the region of Tianjin. Acta Scientiae Circumstantiae 1982, 2, 329–341. [Google Scholar] [CrossRef]
- He, L.J.; Wang, L.C.; Lin, A.W.; Zhang, M.; Xia, X.G.; Tao, M.H.; Zhou, H. What drives changes in aerosol properties over the Yangtze River Basin in past four decades? Atmos. Environ. 2018, 190, 269–283. [Google Scholar] [CrossRef]
- Sogacheva, L.; Rodriguez, E.; Kolmonen, P.; Virtanen, T.H.; Saponaro, G.; de Leeuw, G.; Georgoulias, A.K.; Alexandri, G.; Kourtidis, K.; van der A, R.J. Spatial and seasonal variations of aerosols over China from two decades of multi-satellite observations—Part 2: AOD time series for 1995–2017 combined from ATSR ADV and MODIS C6.1 and AOD tendency estimations. Atmos. Chem. Phys. 2018, 18, 16631–16652. [Google Scholar] [CrossRef]
- Zhao, X.; Gao, Q.; Sun, M.; Xue, Y.; Ma, R.; Xiao, X.; Ai, B. Statistical analysis of spatiotemporal heterogeneity of the distribution of air quality and dominant air pollutants and the effect factors in Qingdao Urban Zones. Atmosphere 2018, 9, 135. [Google Scholar] [CrossRef]
- Li, L.; Chen, J.; Wang, L.; Melluki, W.; Wahid; Zhou, H. Aerosol single scattering albedo affected by chemical composition: An investigation using CRDS combined with MARGA. Atmos. Res. 2013, 124, 149–157. [Google Scholar] [CrossRef]
- Wang, M.X. Aerosols in relation to climate change. Clim. Environ. Res. 2000, 5, 1–5. [Google Scholar] [CrossRef]
- Sun, J.R.; Liu, Y. Possible effect of aerosols over china on east asian summer monsoon (I): Sulfate aerosols. Adv. Clim. Chang. Res. 2008, 4, 53–58. [Google Scholar] [CrossRef]
- Jiang, Y. The Mode analysis of law on the prevention and control of atmospheric pollution: From the illegal punishment to environmental quality objective. J. Beijing For. Uni. 2017, 16, 34–42. [Google Scholar] [CrossRef]
- Jacobson, M.Z. Atmospheric pollution—History, science, and regulation. Phys. Today 2003, 56, 65–66. [Google Scholar] [CrossRef]
- Rowntree, P.R. The influence of tropical east Pacific Ocean temperatures on the atmosphere. Q. J. R. Meteorol. Soc. 2010, 98, 290–321. [Google Scholar] [CrossRef]
- Deng, Z.C.; Sun, Y.L.; Zhou, H.; Song, R.X. A study on quantification of environmental capacity of marine ecology in coastal area—Qingdao city. Marine Environ. Sci. 2009, 28, 438–441. [Google Scholar] [CrossRef]
- Jickells, T. Emissions from the Oceans to the Atmosphere, Deposition from the Atmosphere to the Oceans and the Interactions between Them. In Global Change—The IGBP; Springer: Berlin/Heidelberg, Germany, 2001; pp. 93–96. [Google Scholar] [CrossRef]
- Li, C.C.; Mao, J.Y.; Liu, Q.H.; Chen, J.Z.; Yuan, Z.B.; Liu, X.Y.; Zhu, A.H.; Liu, G.Q. Using MODIS to study the distribution and seasonal variation of aerosol optical thickness in eastern China. Chin. Sci. Bull. 2003, 48, 2094–2100. [Google Scholar] [CrossRef]
- Van, T.T.; Hai, N.H.; Bao, V.Q.; Bao, H.D.X. Remote Sensing-Based Aerosol Optical Thickness for Monitoring Particular Matter over the City. Proceedings 2018, 2, 362. [Google Scholar] [CrossRef]
- Wei, J.; Lin, S. Comparison and evaluation of different MODIS aerosol optical depth products over the Beijing-Tianjin-Hebei region in China. IEEE J. Sel. Topics Appl. Earth Obs. Remote Sens. 2017, 99, 1–10. [Google Scholar] [CrossRef]
Figure 1.
Shandong Province location map.

Figure 2.
City level map.
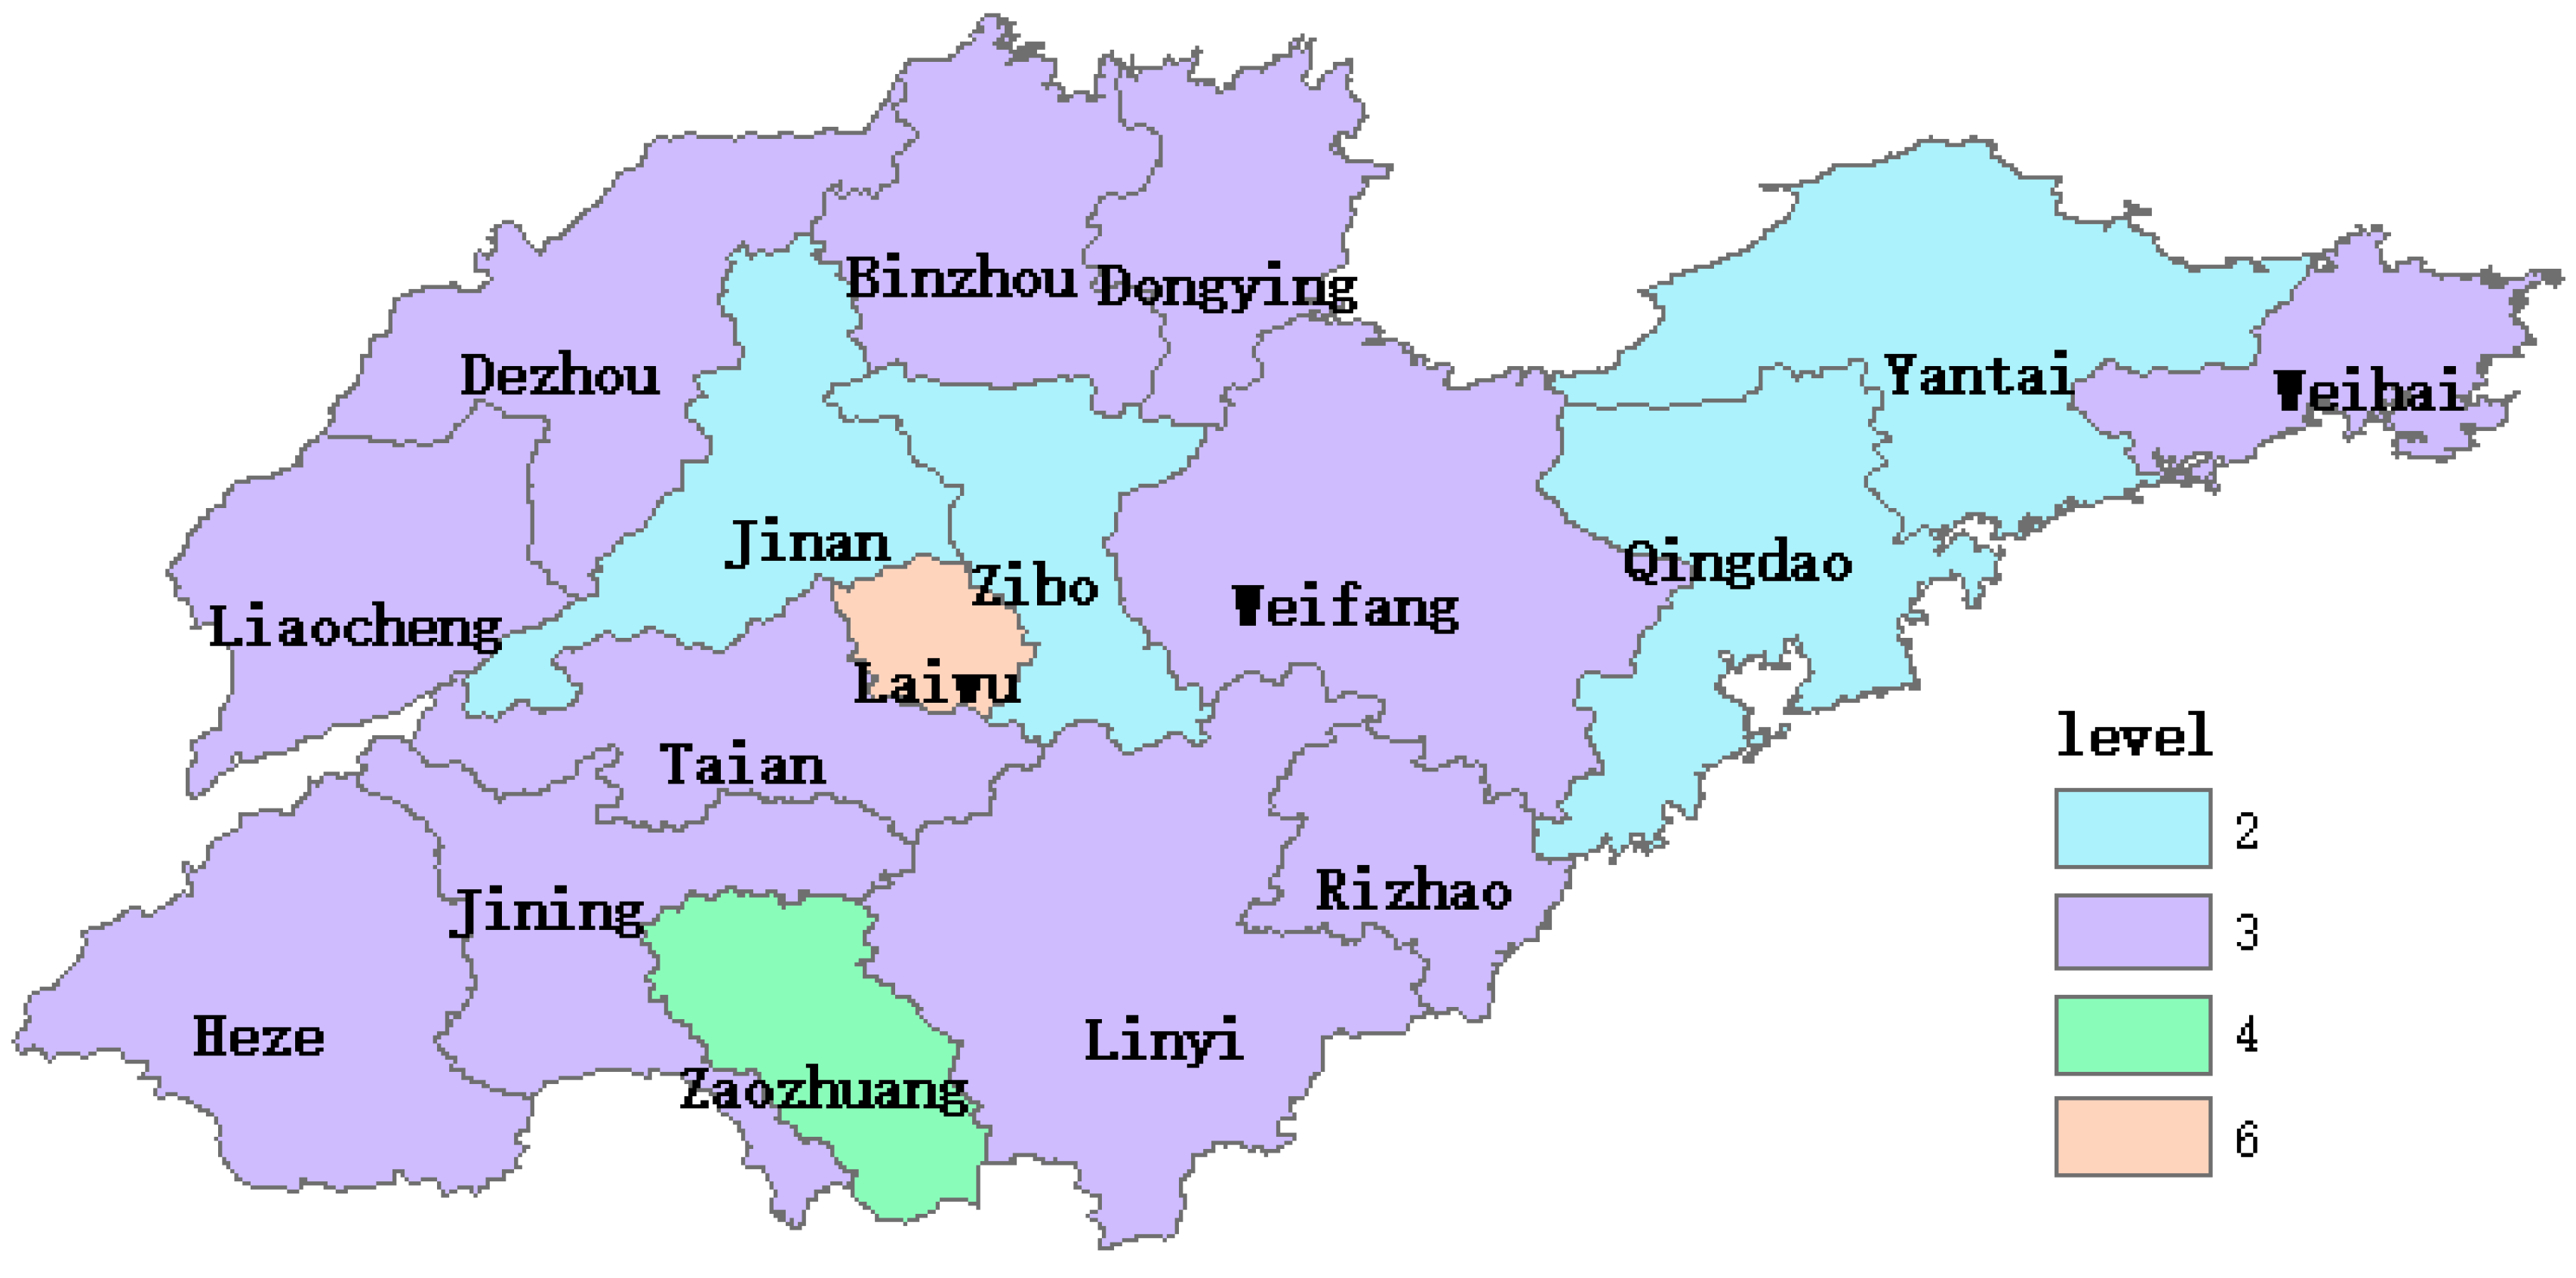
Figure 3.
Digital elevation data.

Figure 4.
Aerosol Optical Depth (AOD) distribution map of Shandong Province.
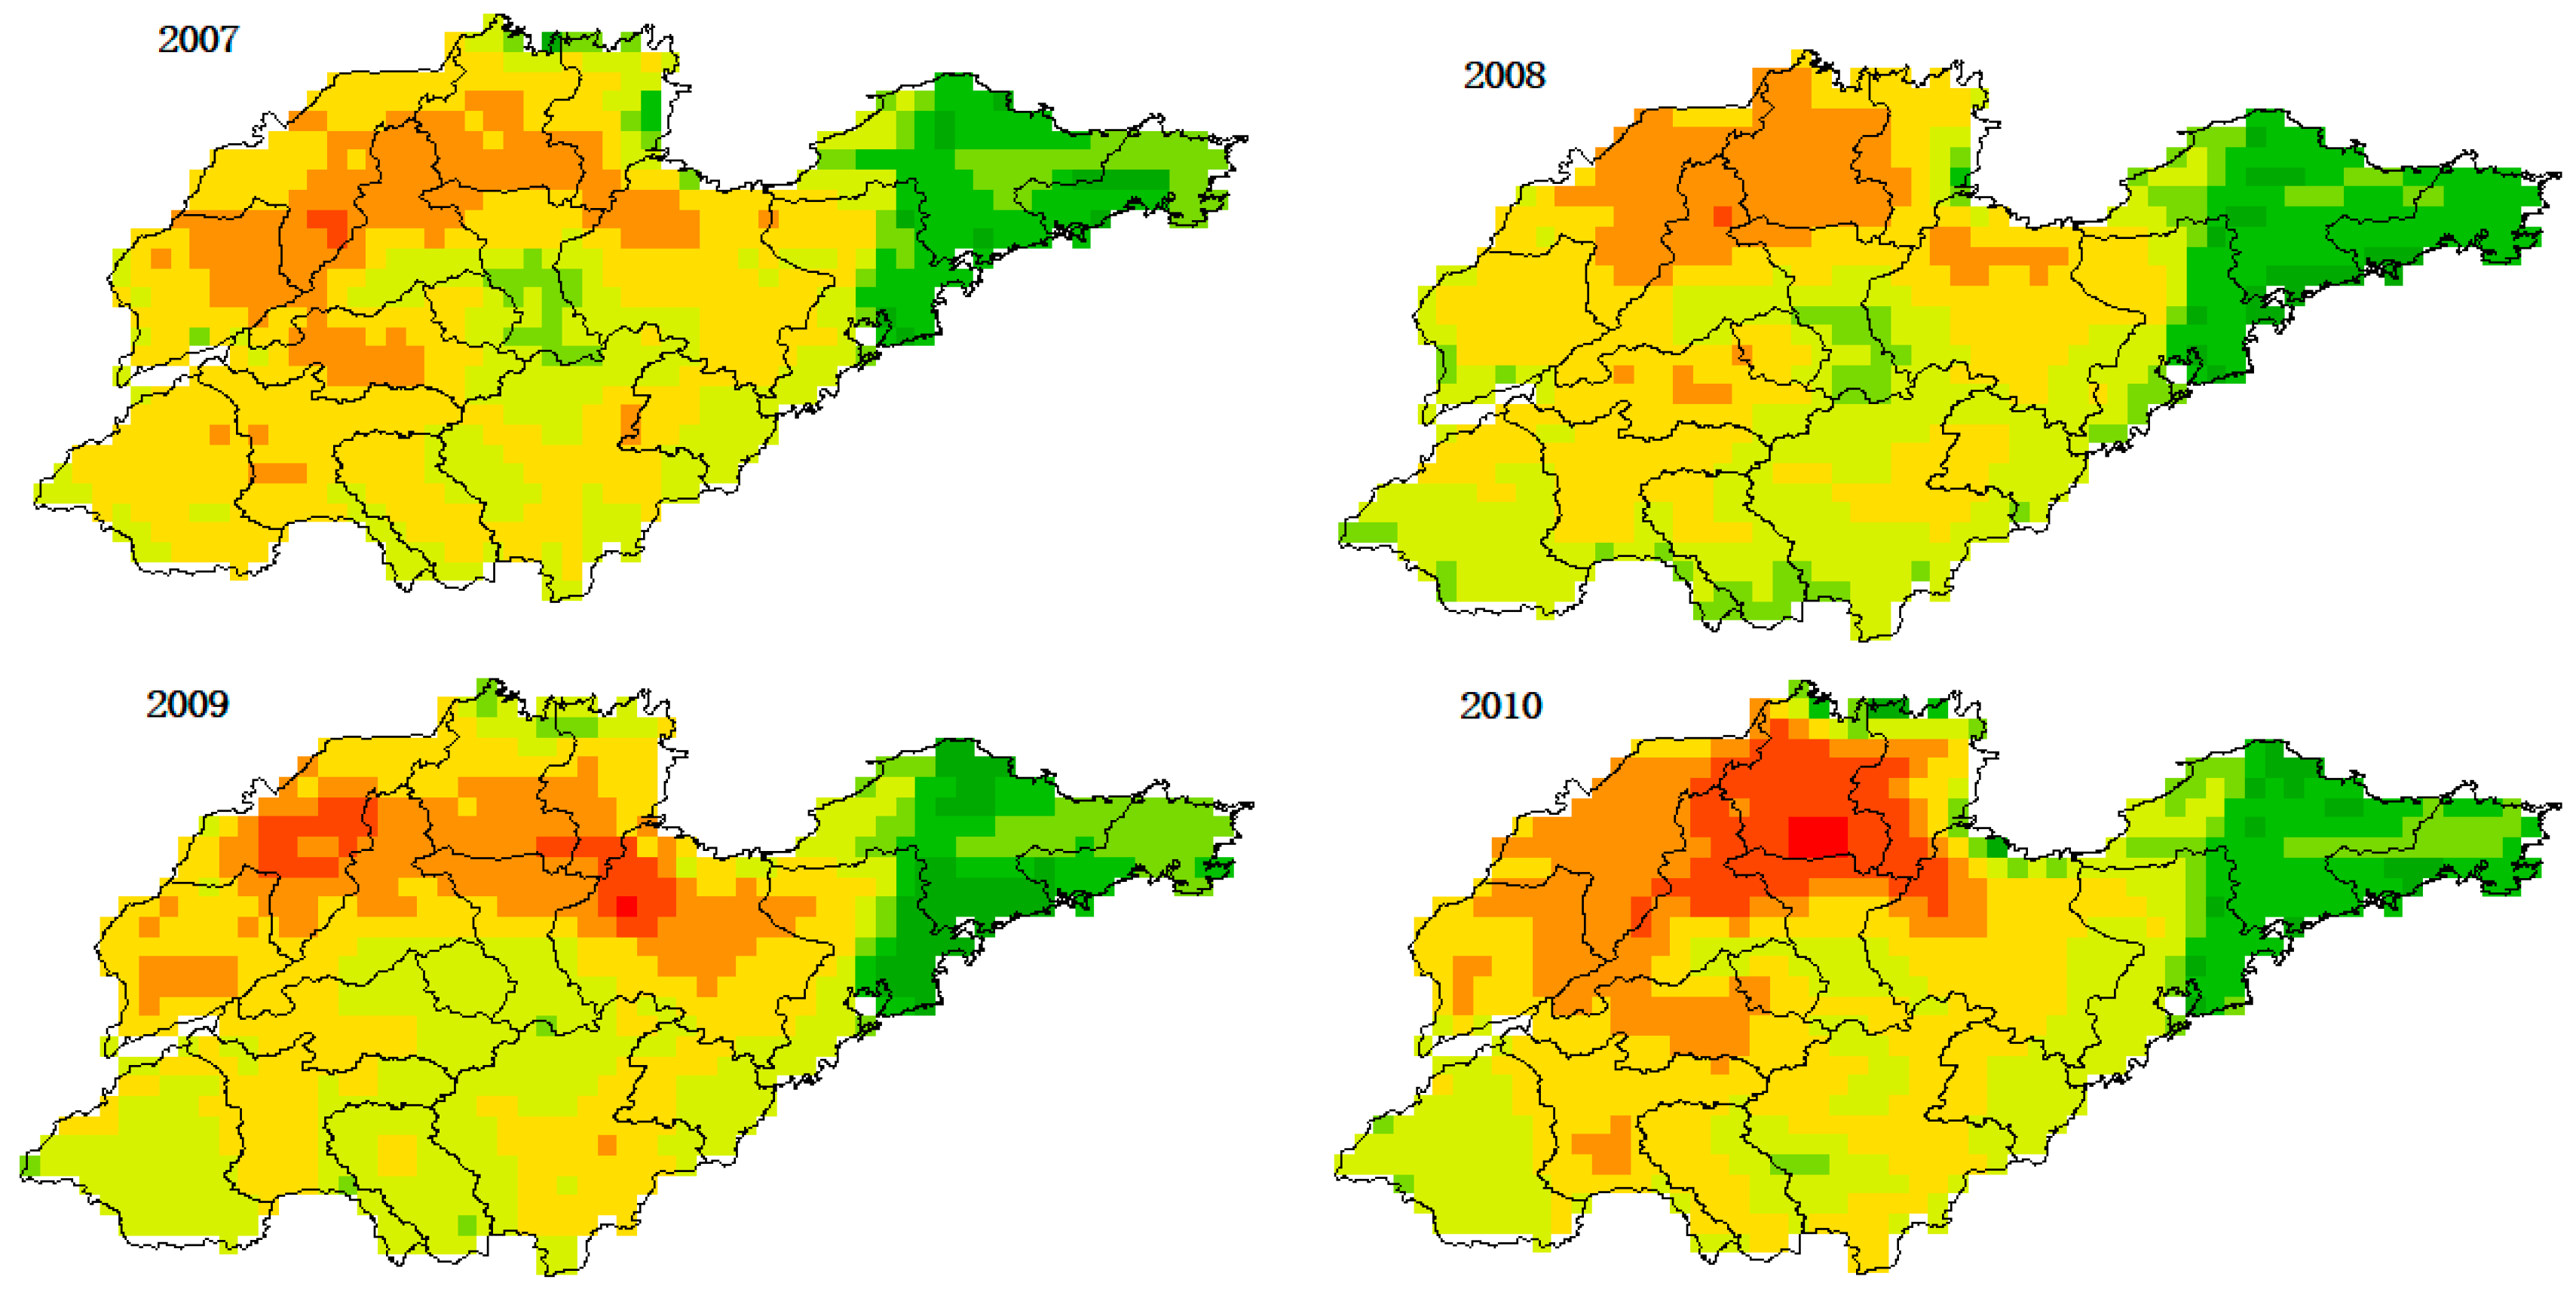
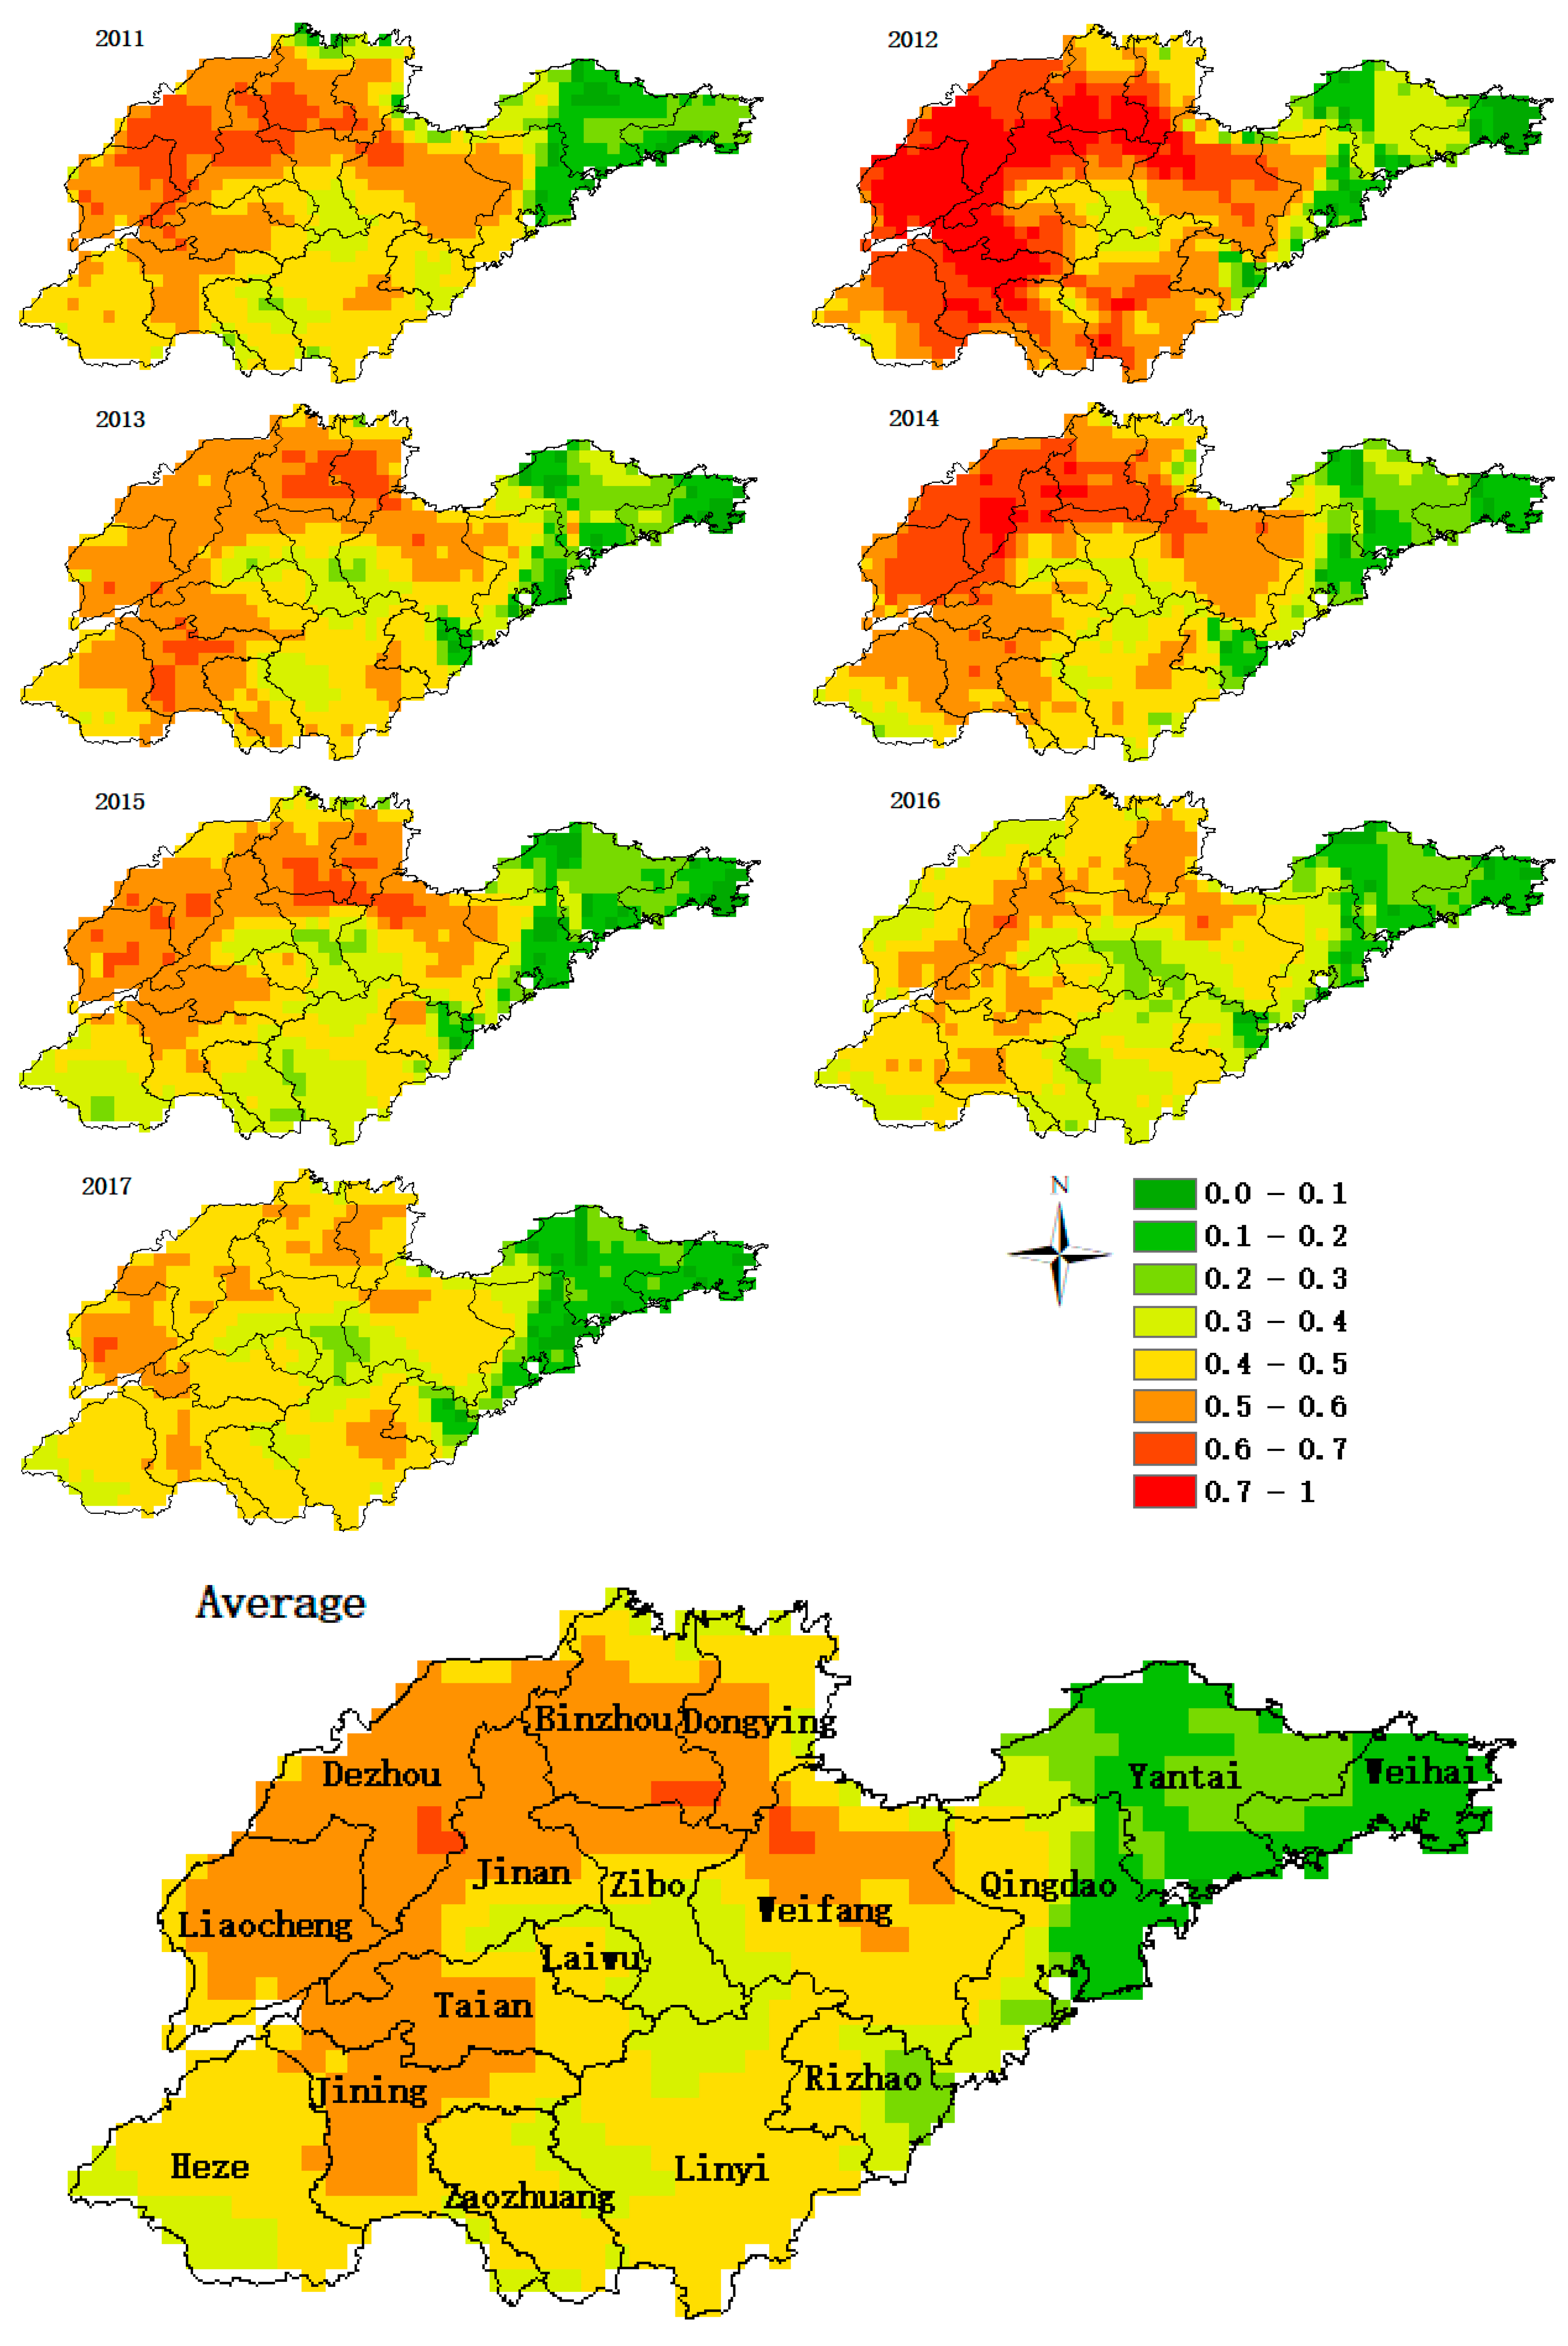
Figure 5.
Annual data chart.

Figure 6.
Linear trend chart. (a) Trends from 2007 to 2012, (b) Trends from 2012 to 2017.
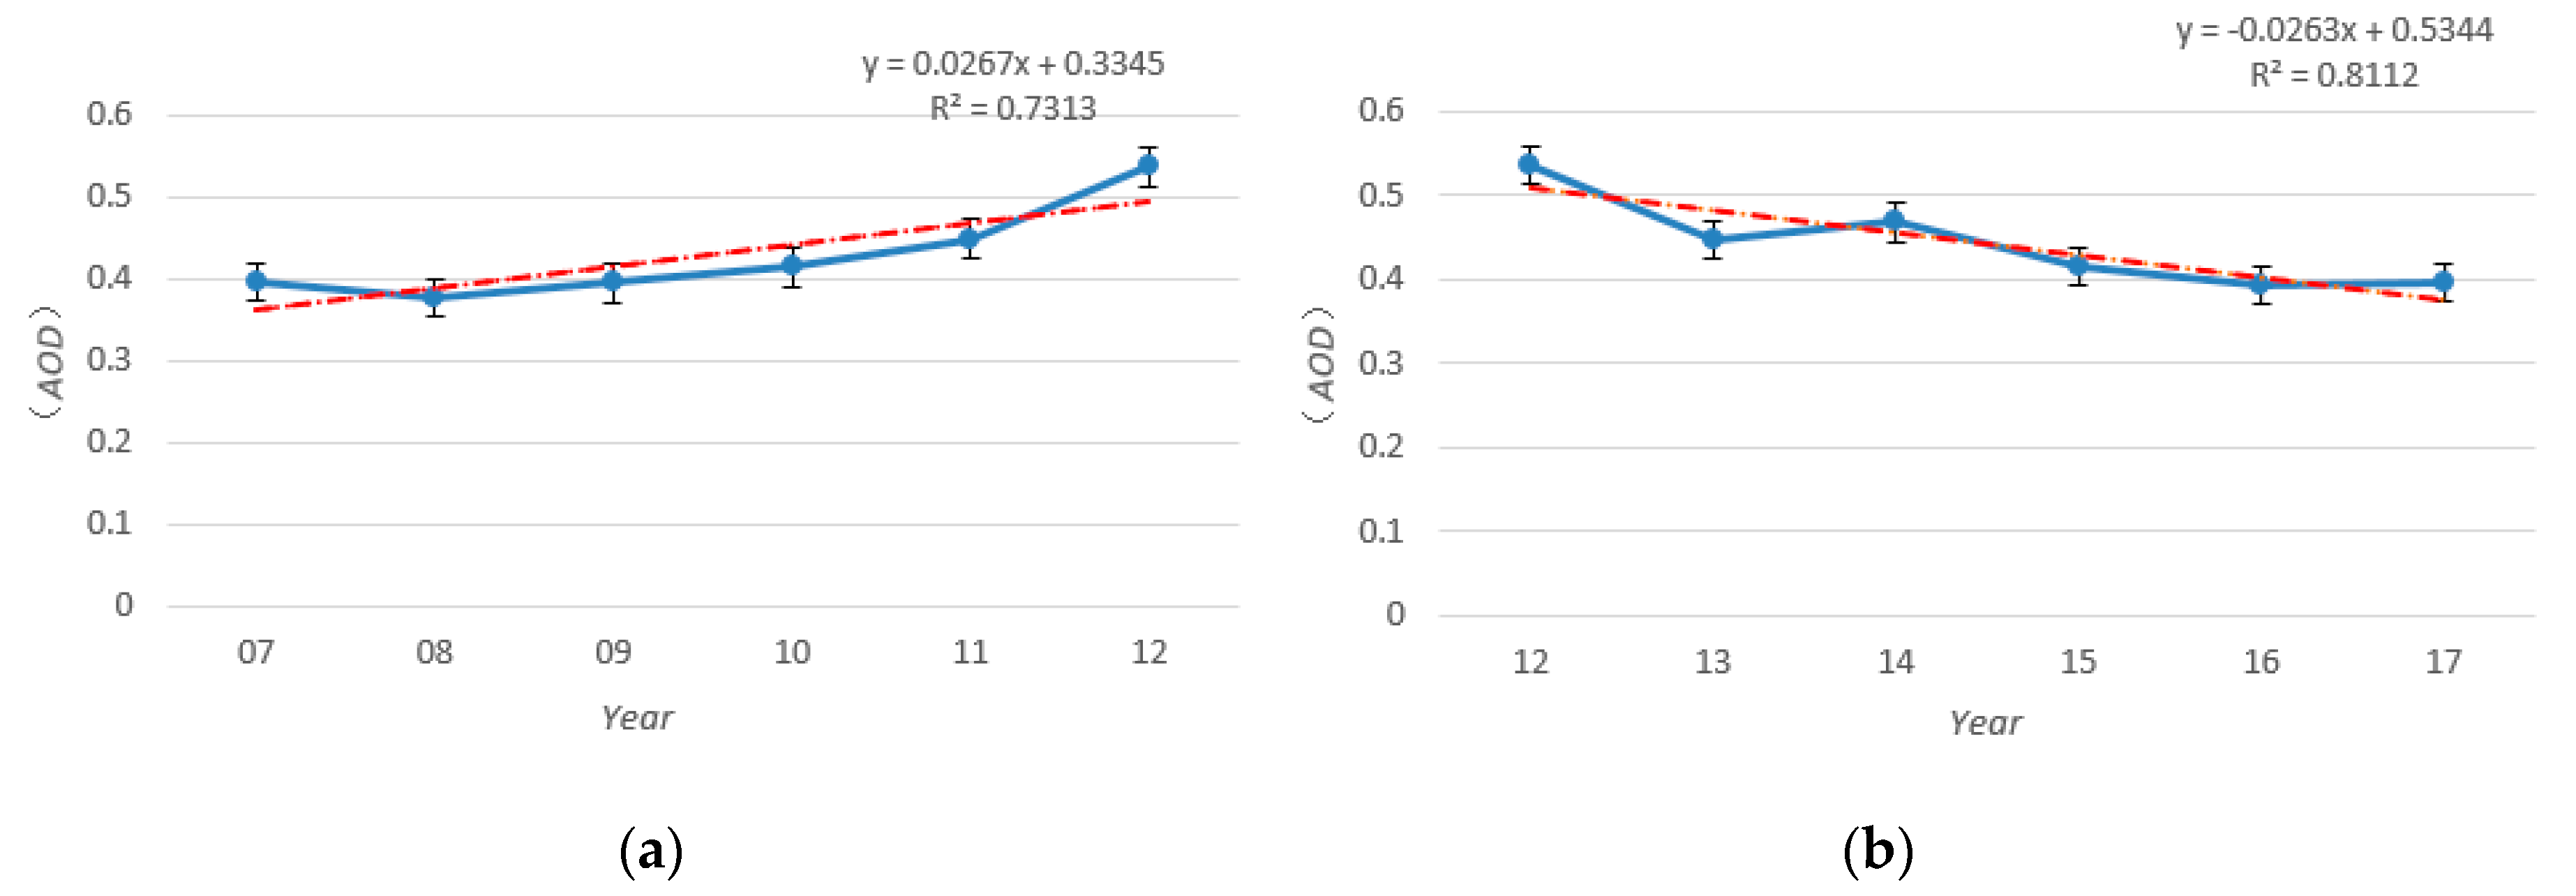
Figure 7.
AOD quarterly distribution map.
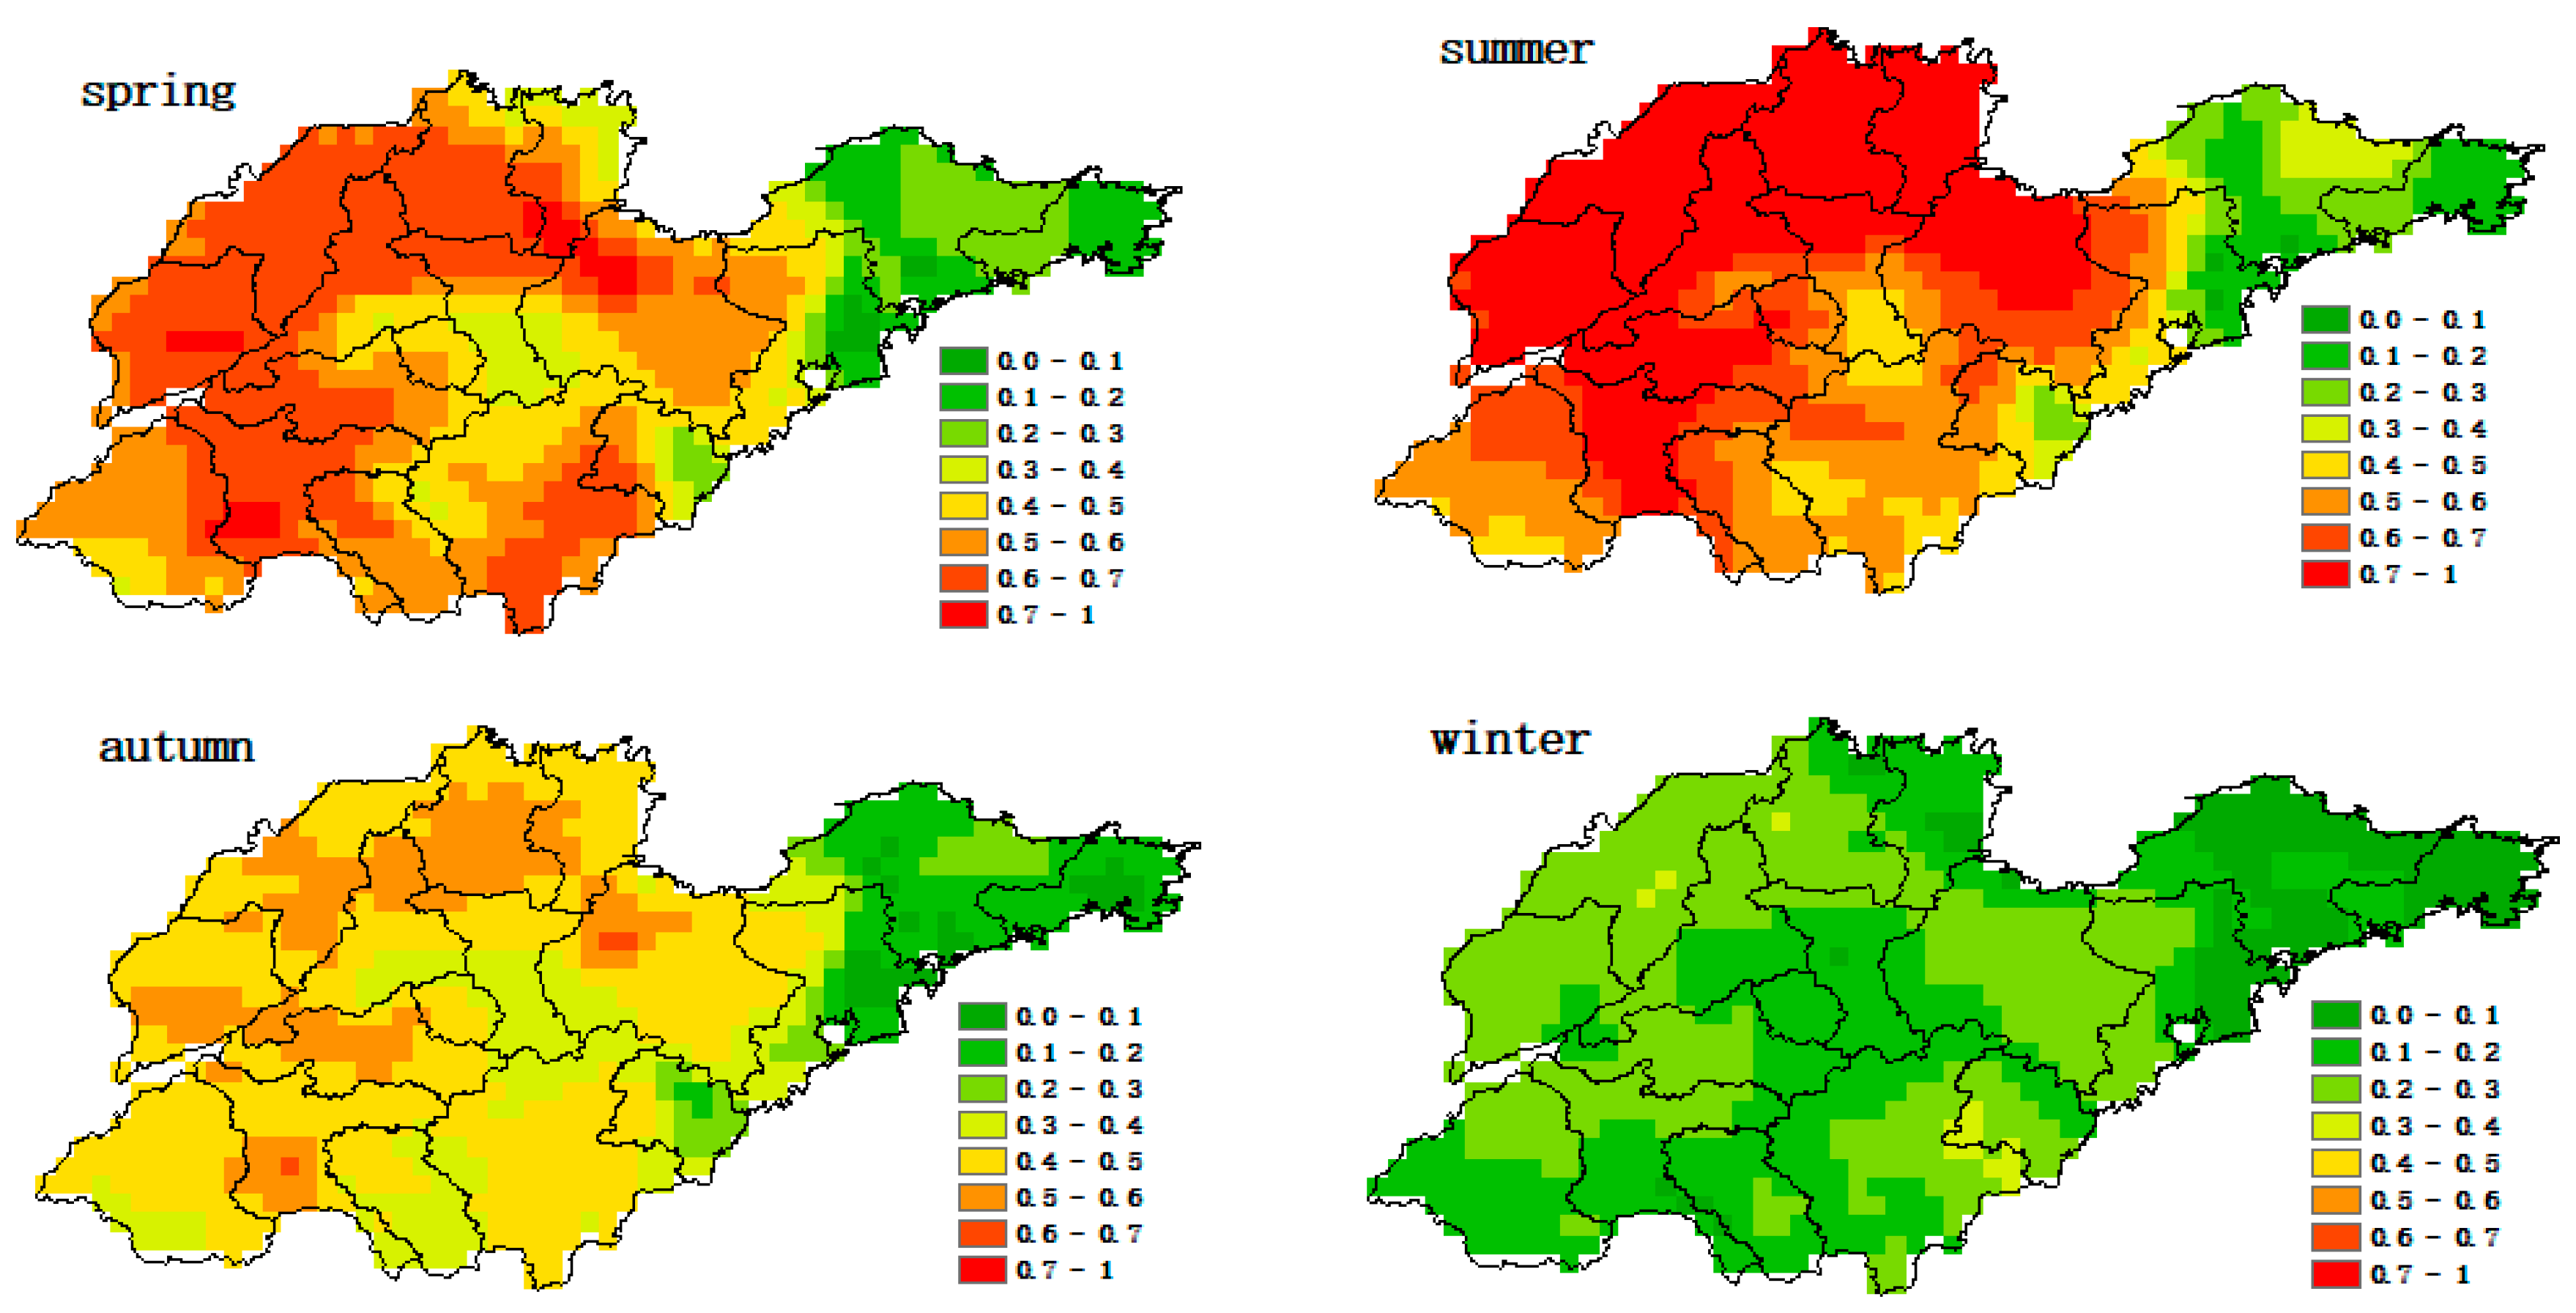
Figure 8.
Quarterly data chart. (a) AOD overall trend chart, (b) Quarterly trend chart.

Figure 9.
Monthly distribution map.
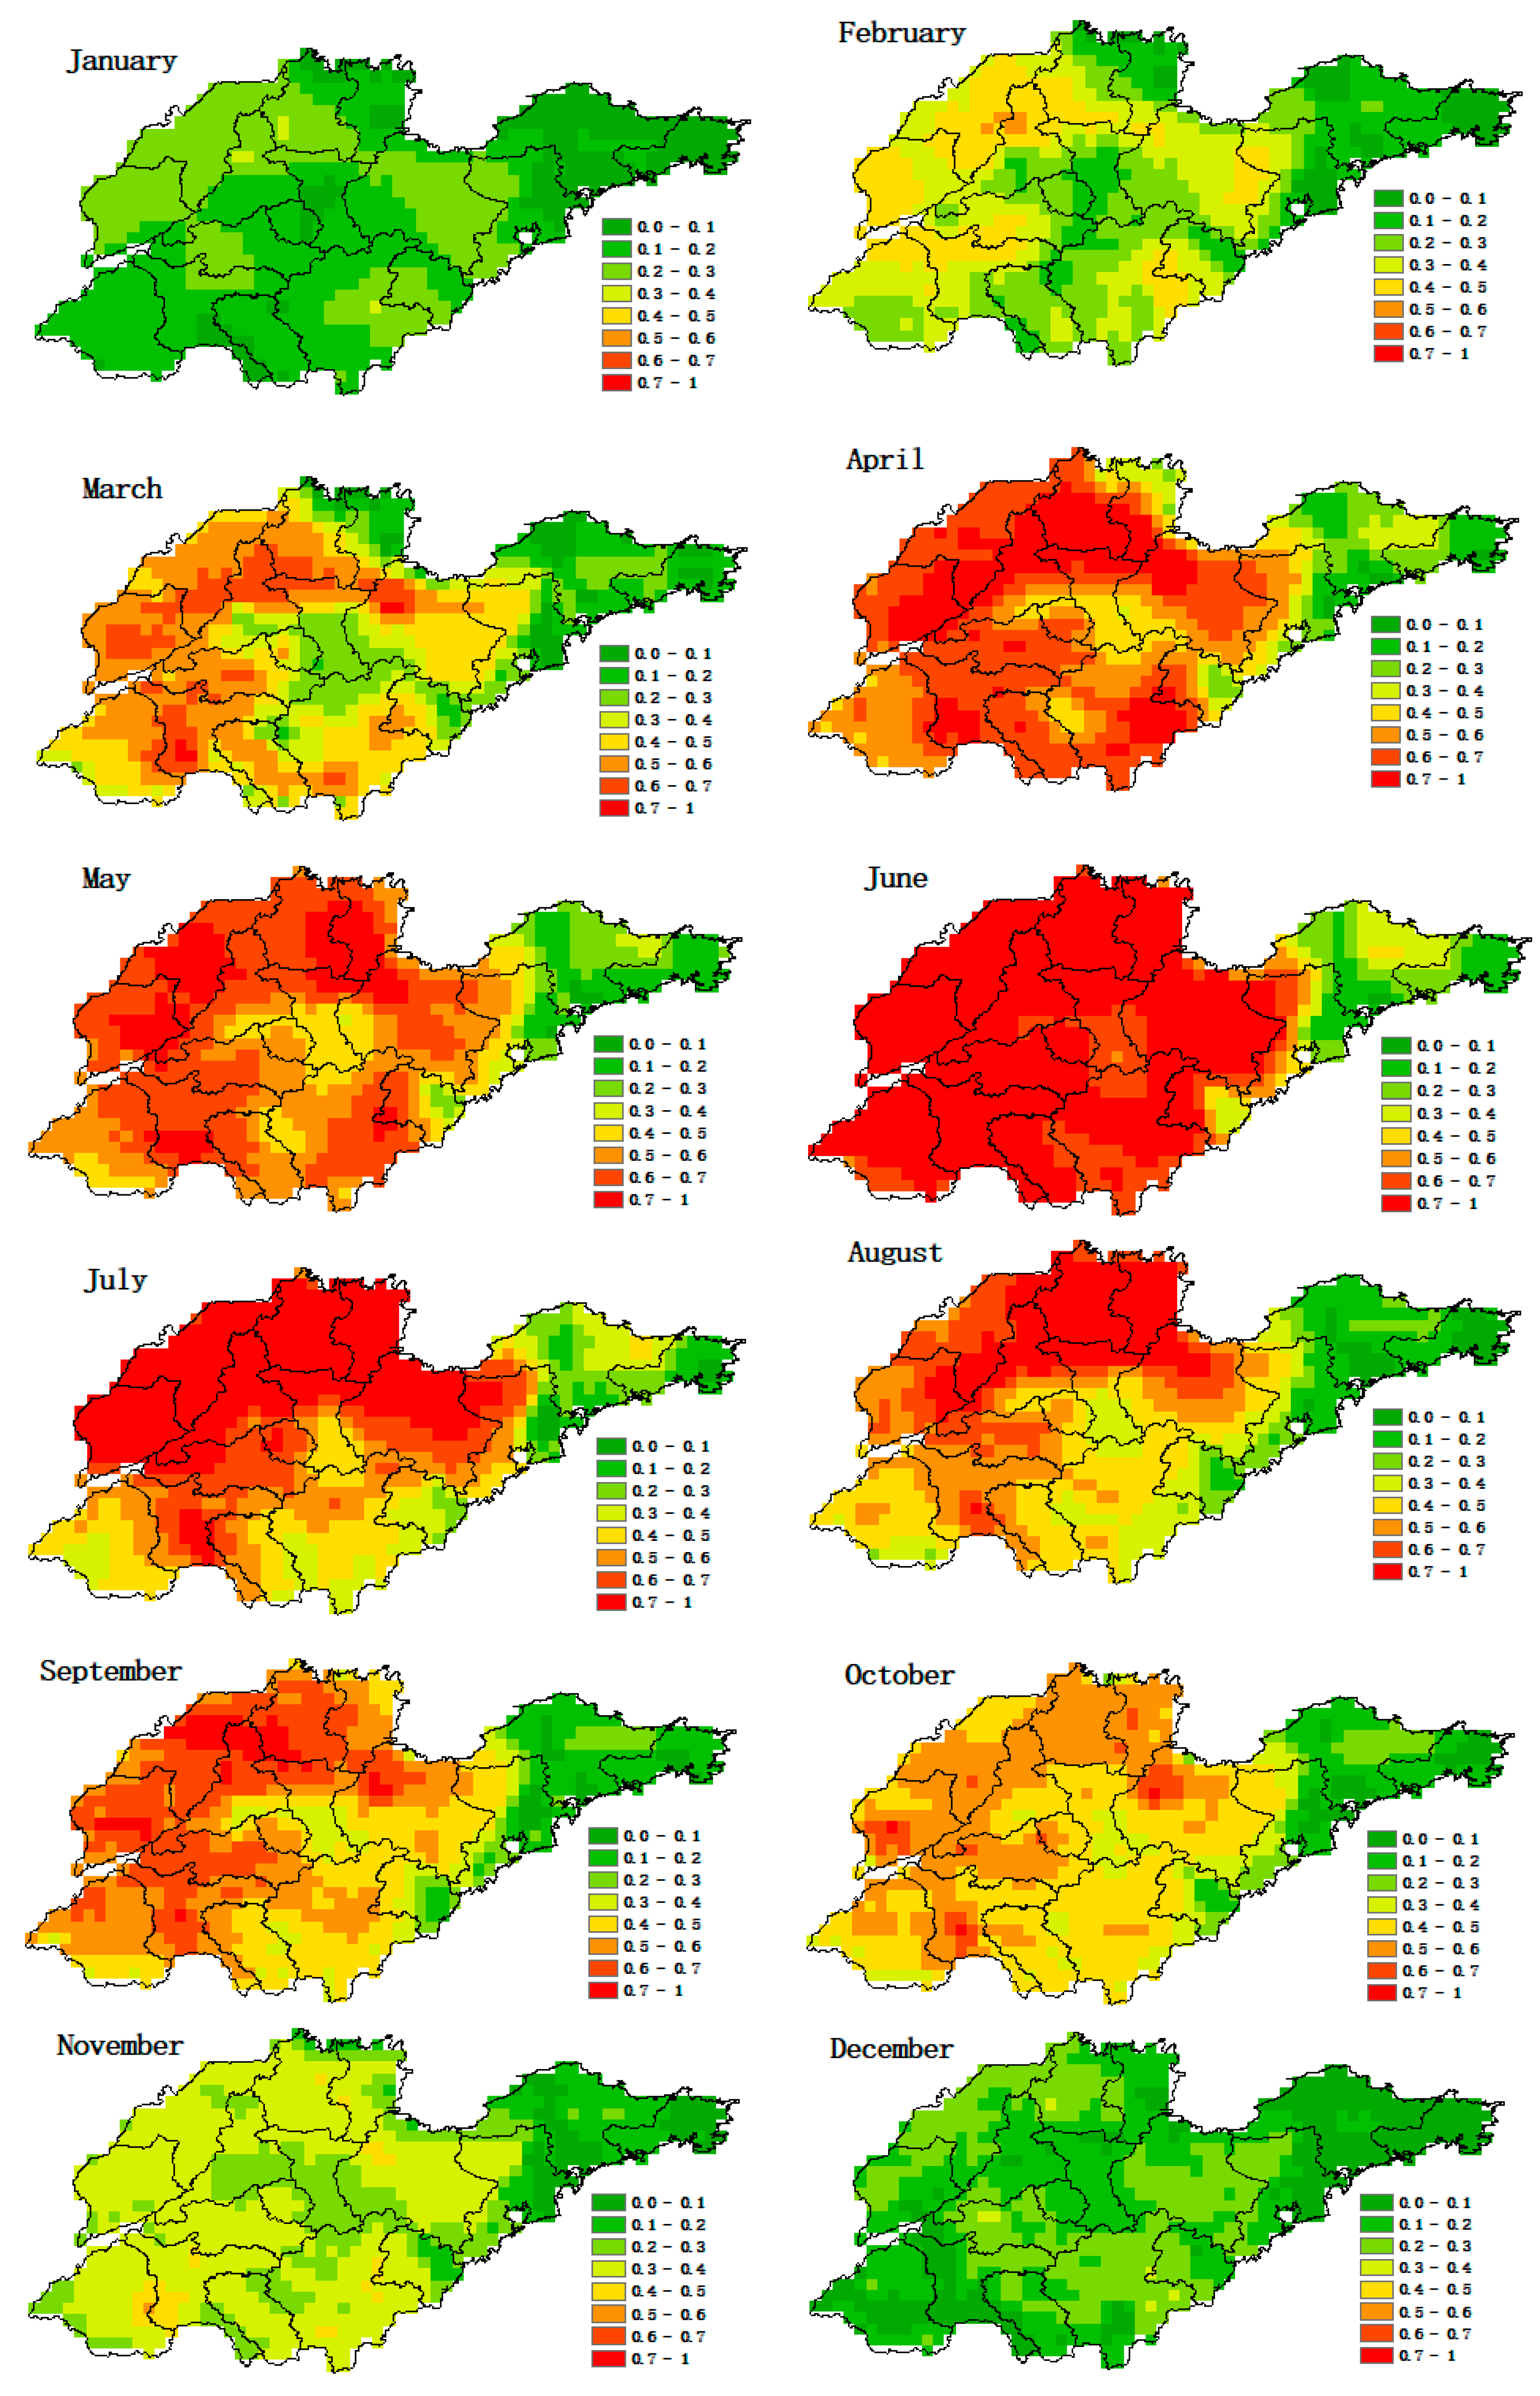
Figure 10.
AOD monthly change chart.
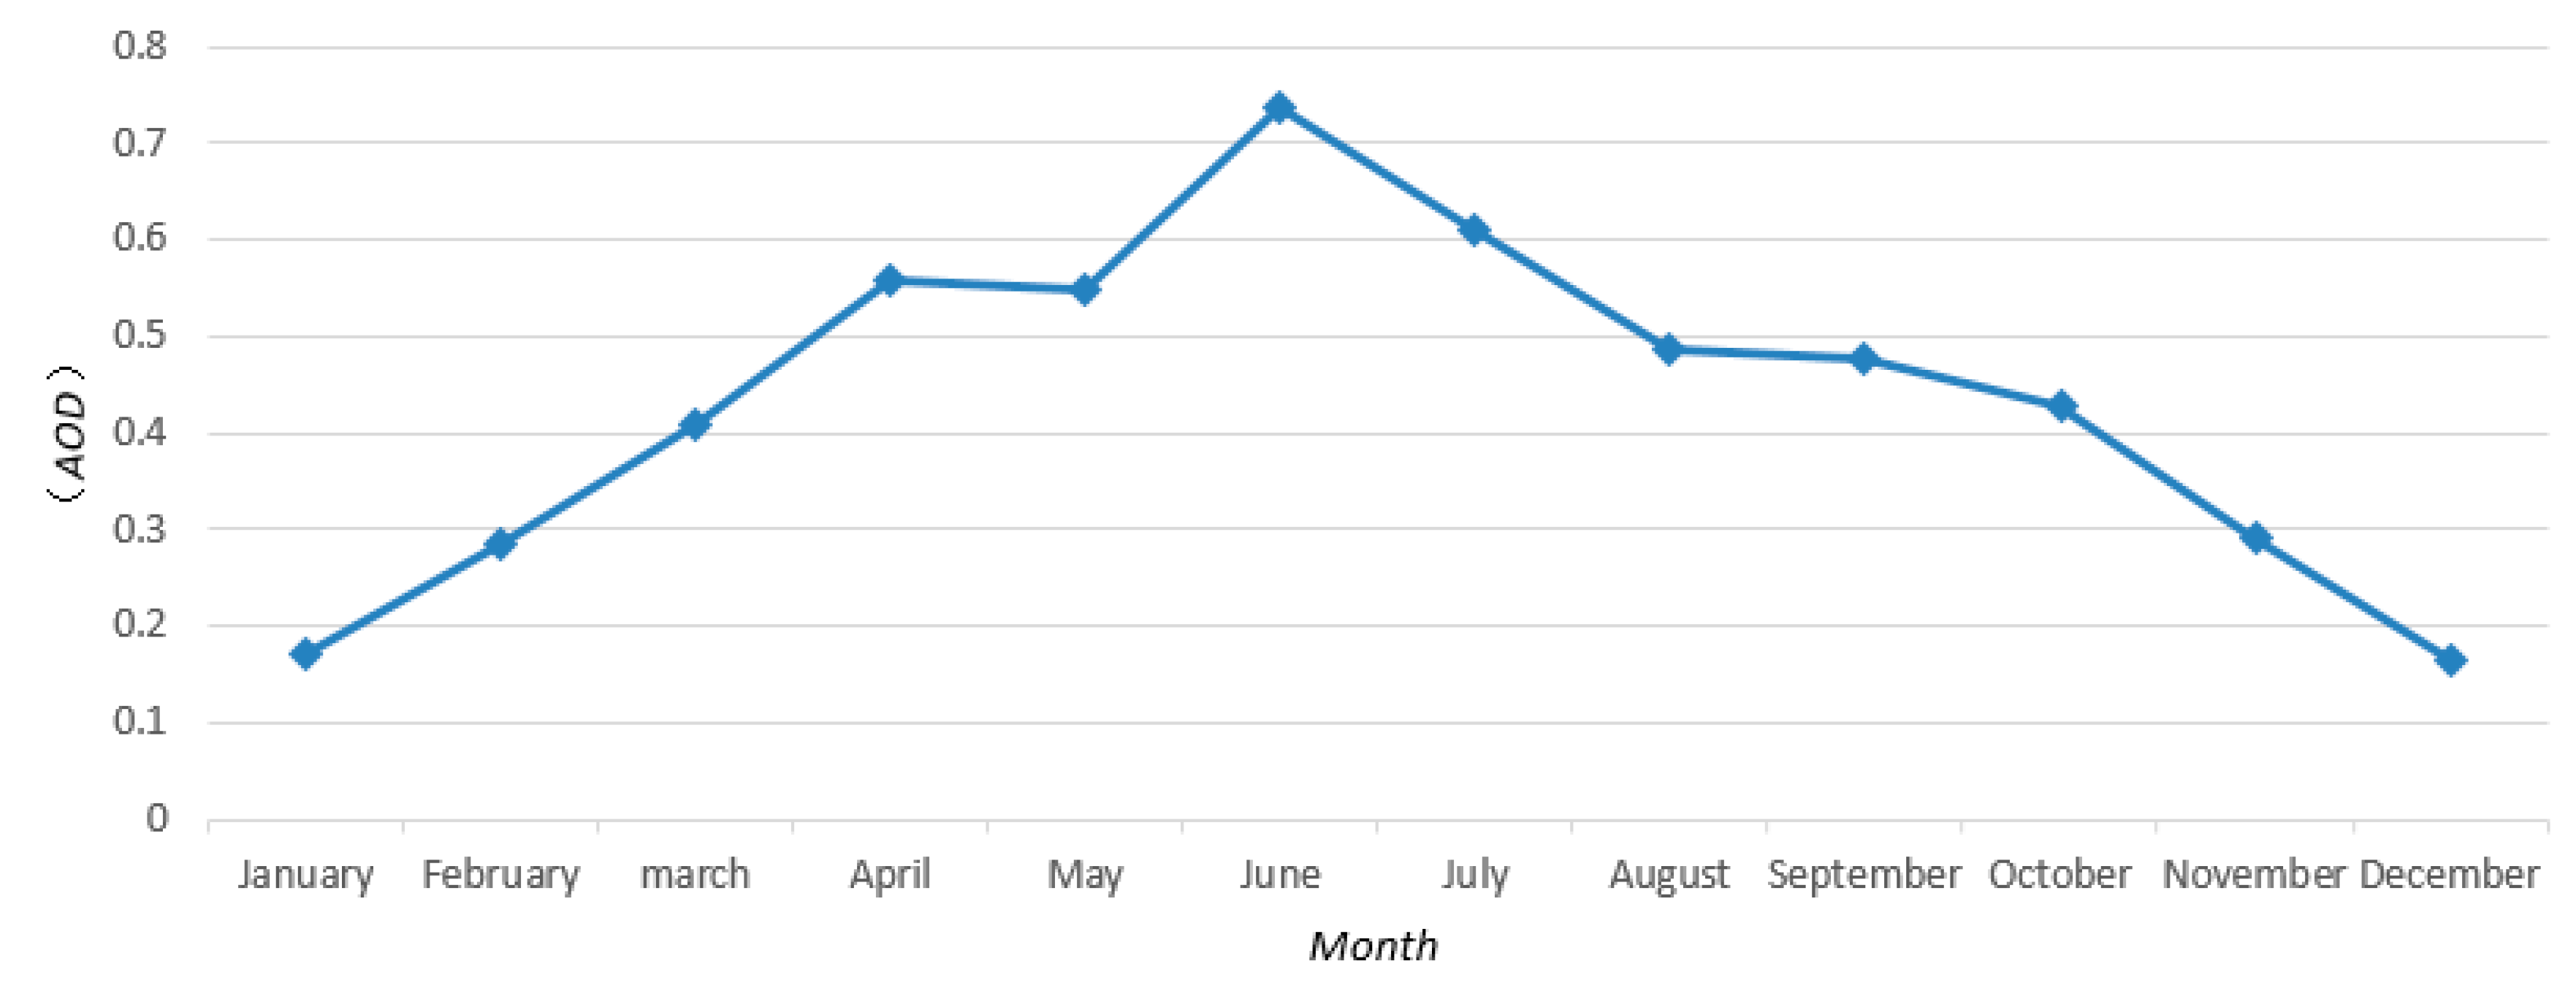
Figure 11.
Geographically Weighted Regression (GWR) result graph.
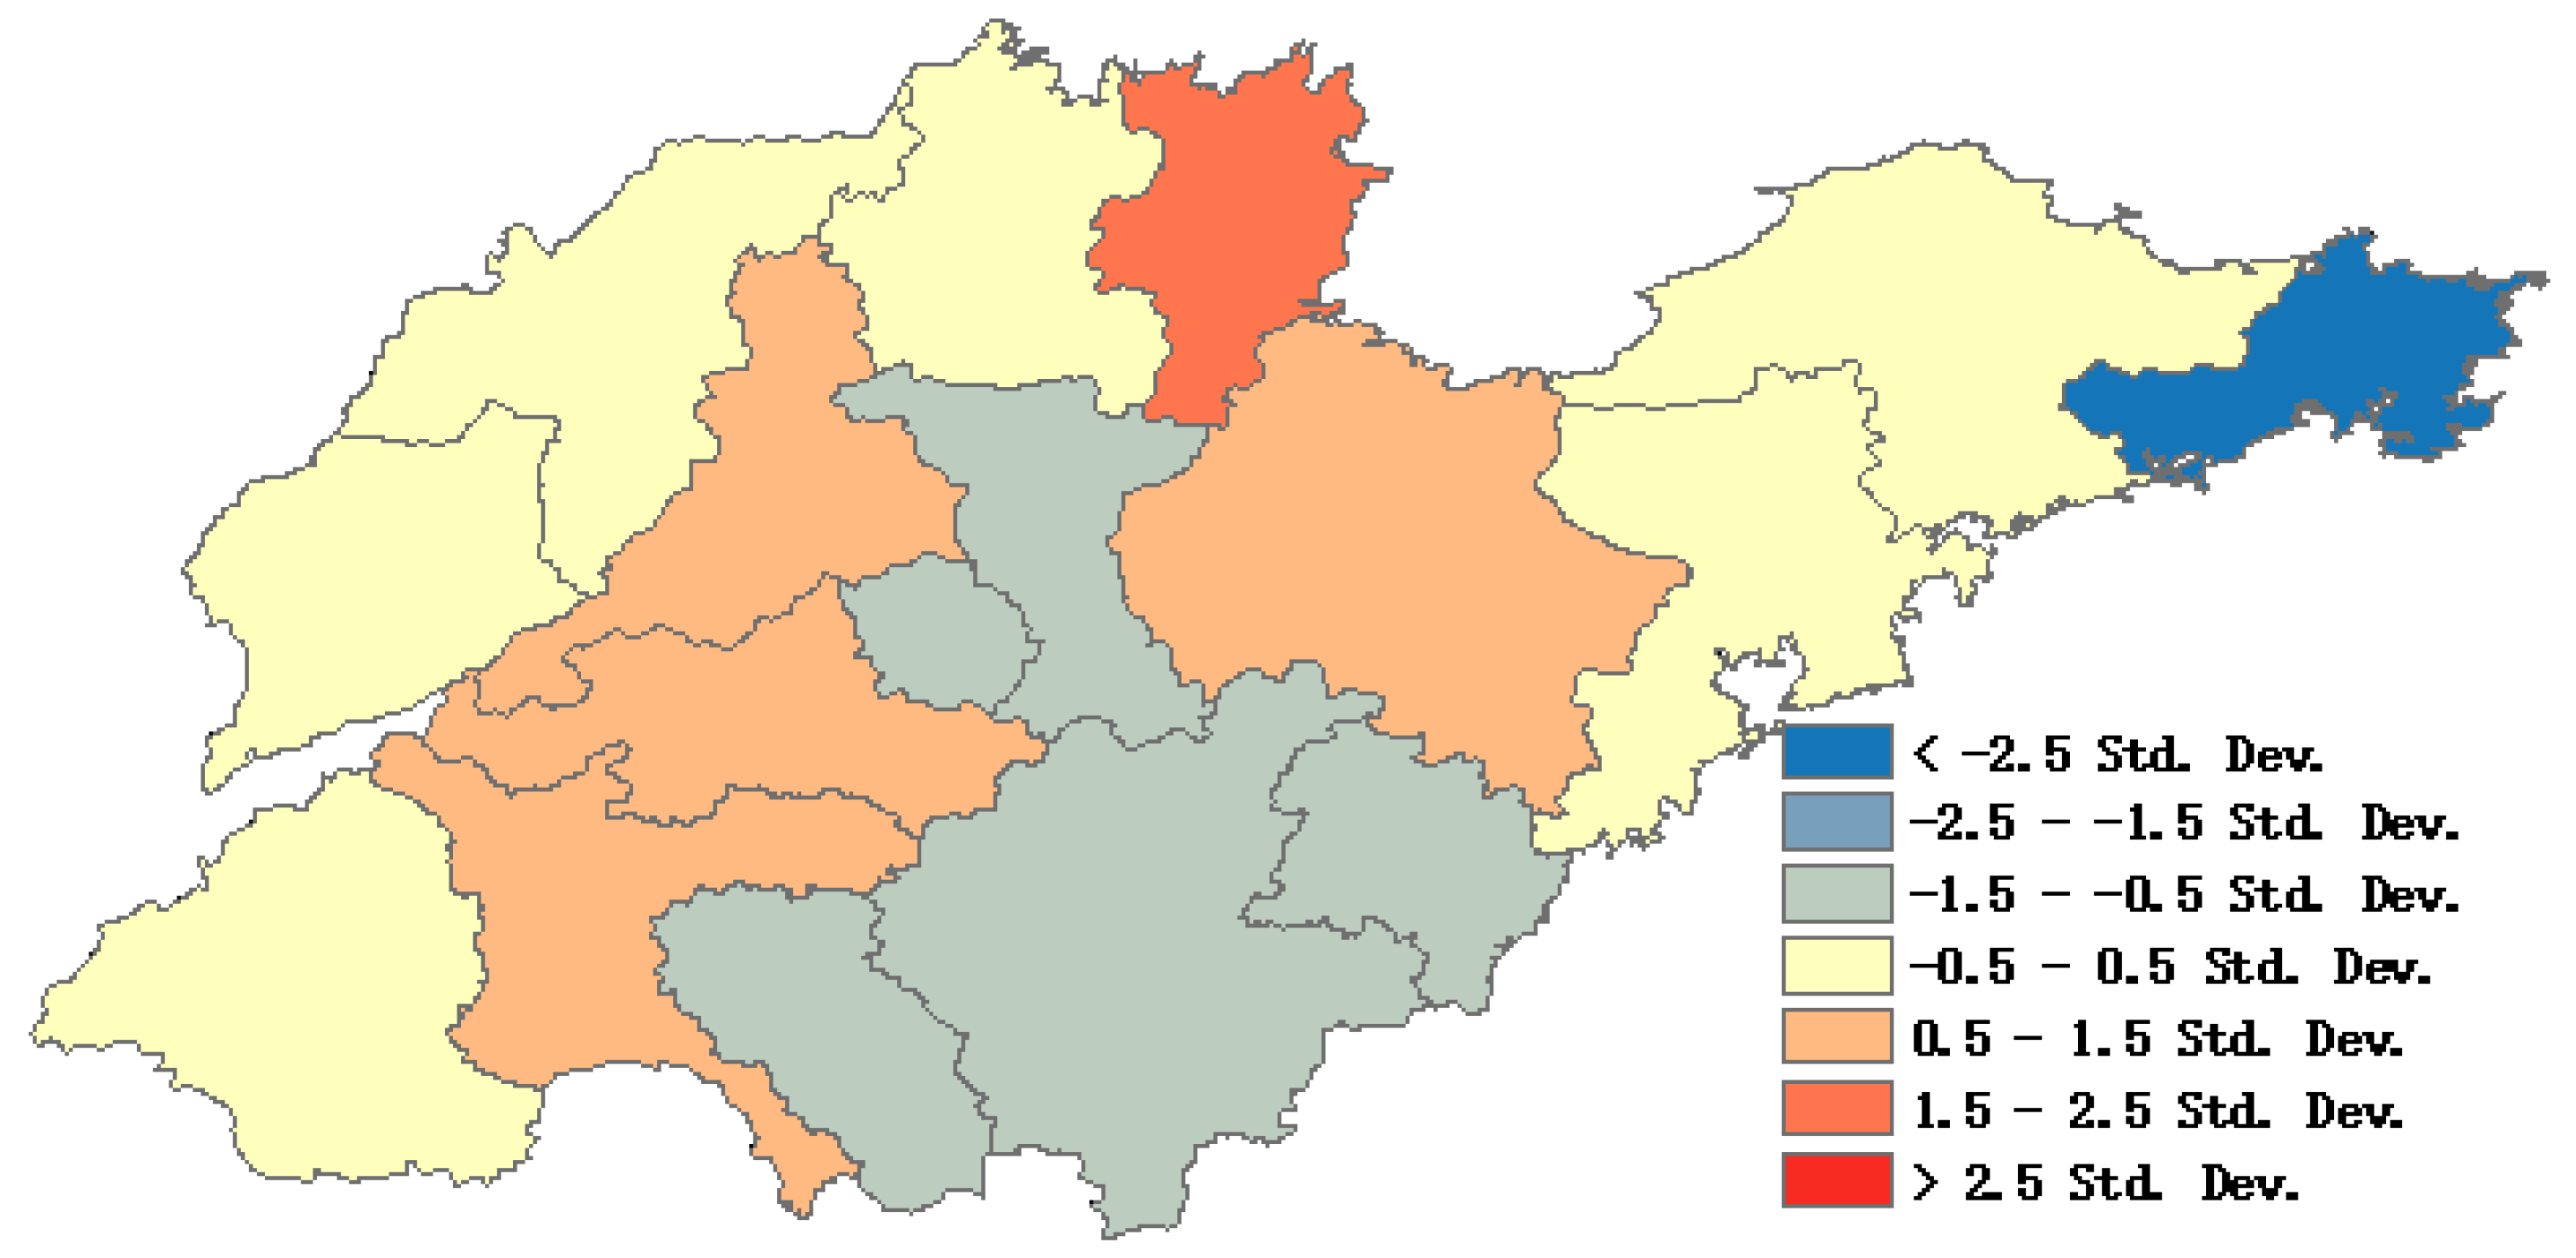
Figure 12.
Box plot analysis results for different city levels.

Table 1.
AOD and socio-economic impact factors.
| Year | AOD | Population (10,000 people) | Green Land Area (ha) | Secondary Industry Regional GDP (100,000,000 Yuan) | Soot (10,000 T) | SO2 (10,000 T) | Nitrogen Oxides (10,000 T) |
|---|---|---|---|---|---|---|---|
| 2007 | 0.3960 | 3436 | 146,076 | 14,839.13 | 46 | 182 | |
| 2008 | 0.3769 | 3532 | 156,957 | 17,839.09 | 44 | 169 | |
| 2009 | 0.3955 | 3548 | 168,408 | 19,219.83 | 42 | 159 | 138 |
| 2010 | 0.4140 | 3839 | 181,055 | 22,163.00 | 39 | 154 | 141 |
| 2011 | 0.448 | 3945 | 188,136 | 24,539.45 | 78 | 183 | 179 |
| 2012 | 0.5363 | 4021 | 199,899 | 26,367.57 | 70 | 175 | 174 |
| 2013 | 0.4475 | 4130 | 217,366 | 28,163.57 | 70 | 164 | 165 |
| 2014 | 0.4673 | 4285 | 232,174 | 29,585.72 | 121 | 159 | 159 |
| 2015 | 0.4153 | 4702 | 240,024 | 30,334.56 | 108 | 153 | 142 |
| 2016 | 0.3916 | 4856 | 253,328 | 31,343.67 | 87 | 113 | 123 |
| 2017 | 0.3962 | 5024 | 267,944 | 32,942.84 | 54 | 74 | 116 |
Table 2.
Coefficient between AOD and Socio-economic factor.
| Factor | Population | Greening Land Area | Secondary Industry Regional GDP | Soot | Nitrogen Oxides | |
|---|---|---|---|---|---|---|
| AOD | 0.191 | 0.21 | 0.21 | 0.393 | 0.329 | 0.867 |
Table 3.
Coefficient between AOD and the environmental impact factor.
| Factor | DEM | Temperature | Precipitation |
|---|---|---|---|
| AOD | −0.430 | 0.585 | 0.341 |
© 2019 by the authors. Licensee MDPI, Basel, Switzerland. This article is an open access article distributed under the terms and conditions of the Creative Commons Attribution (CC BY) license (http://creativecommons.org/licenses/by/4.0/).
Share and Cite
MDPI and ACS Style
Xue, R.; Ai, B.; Lin, Y.; Pang, B.; Shang, H. Spatial and Temporal Distribution of Aerosol Optical Depth and Its Relationship with Urbanization in Shandong Province. Atmosphere 2019, 10, 110. https://doi.org/10.3390/atmos10030110
AMA Style
Xue R, Ai B, Lin Y, Pang B, Shang H. Spatial and Temporal Distribution of Aerosol Optical Depth and Its Relationship with Urbanization in Shandong Province. Atmosphere. 2019; 10(3):110. https://doi.org/10.3390/atmos10030110
Chicago/Turabian StyleXue, Rui, Bo Ai, Yaoyao Lin, Beibei Pang, and Hengshuai Shang. 2019. "Spatial and Temporal Distribution of Aerosol Optical Depth and Its Relationship with Urbanization in Shandong Province" Atmosphere 10, no. 3: 110. https://doi.org/10.3390/atmos10030110
Note that from the first issue of 2016, this journal uses article numbers instead of page numbers. See further details here.