Article

New Interpretative Scales for Lichen Bioaccumulation Data: The Italian Proposal

1
Department of Life Sciences, University of Trieste, Via L. Giorgieri 10, 34127 Trieste, Italy
2
Department of Biology, University of Firenze, Via La Pira 4, 50121 Firenze, Italy
3
TerraData environmetrics, Spin Off of the University of Siena, Via L. Bardelloni 19, 58025 Monterotondo Marittimo (GR), Italy
4
Department of Life Sciences, University of Siena, via Mattioli 4, 53100 Siena, Italy
5
Centre for Ecology, Evolution and Environmental Changes (cE3c), Faculdade de Ciências, Universidade de Lisboa, Campo Grande, 1749-016 Lisbon, Portugal
6
Department of Biological, Geological and Environmental Sciences, University of Bologna, Via Irnerio 42, 40126 Bologna, Italy
7
Department of Biology, University of Pisa, via L. Ghini, 13, 56126 Pisa, Italy
8
Department of Biosciences and Territory (DiBT), University of Molise, C.da Fonte Lappone, 86090 Pesche (Isernia), Italy
9
DIFAR, University of Genova, Viale Cembrano 4, 16148 Genova, Italy
*
Author to whom correspondence should be addressed.
These authors contributed equally to this work.
Atmosphere 2019, 10(3), 136; https://doi.org/10.3390/atmos10030136
Submission received: 26 February 2019 / Revised: 6 March 2019 / Accepted: 8 March 2019 / Published: 13 March 2019
(This article belongs to the Special Issue Biomonitoring of Atmospheric Pollution)

Abstract

:
The interpretation of lichen bioaccumulation data is of paramount importance in environmental forensics and decision-making processes. By implementing basic ideas underlying previous interpretative scales, new dimensionless, species-independent “bioaccumulation scales” for native and transplanted lichens are proposed. Methodologically consistent element concentration datasets were populated with data from biomonitoring studies relying on native and transplanted lichens. The scale for native lichens was built up by analyzing the distribution of ratios between element concentration data and species-specific background concentration references (B ratios), herein provided for Flavoparmelia caperata and Xanthoria parietina (foliose lichens). The scale for transplants was built up by analyzing the distribution of ratios between element concentration in exposed and unexposed samples (EU ratio) of Evernia prunastri and Pseudevernia furfuracea (fruticose lichens). Both scales consist of five percentile-based classes; namely, “Absence of”, “Low”, “Moderate”, “High”, and “Severe” bioaccumulation. A comparative analysis of extant interpretative tools showed that previous ones for native lichens suffered from the obsolescence of source data, whereas the previous expert-assessed scale for transplants failed in describing noticeable element concentration variations. The new scales, based on the concept that pollution can be quantified by dimensionless ratios between experimental and benchmark values, overcome most critical points affecting the previous scales.

Graphical Abstract

1. Introduction

Air quality standards are fundamental references in environmental policy. These standards are mostly set up from data on atmospheric pollutant concentrations obtained by continuous measurements within fully- or semi-automatic apparatus [1]. Nevertheless, the need for evaluating biological effects of low concentrated air pollutants over large geographical areas has made biomonitoring of paramount importance to provide and integrate information on pollutant depositions [2,3]. A fortiori, this is true for trace element pollution. In this respect, the extensive use of lichens as effective bioaccumulators has provided valuable data through the years [4]. A crucial point with potential outcomes for decision making and environmental forensics is the appropriate interpretation of biomonitoring results [5]. This issue has been extensively addressed in the context of human biomonitoring and chemical risk assessment (e.g., [6,7]), but it has also been faced in the field of biomonitoring by mosses and lichens. Indeed, several efforts have been made to achieve high quality standards for the moss bag technique, hence to improve cross-study comparison and guarantee proper result interpretation [8,9]. Even for lichens, efforts have been made to enhance methodological standardization and result interpretation. In particular, in this case, interpretative tools were purposely developed for bioaccumulation data from both native and transplanted lichens.
In biomonitoring techniques based on native lichens (see Table 1 for a glossary), measured element concentrations are usually compared with background element concentration values (BECs; Table 1) and, when these are not available, results are expressed as deviations from the minimum values revealed in the study area, considered as an “internal baseline” [10]. BECs can either be obtained by analyzing literature data (review-based BECs, [2,11]) or assessed by direct large-scale field campaigns (field-assessed BECs [12,13,14]). Both approaches should follow robust methodological guidelines and, in fact, the discussion on their proper assessment in lichen matrices is of current interest [14,15]. Another approach to the interpretation of biomonitoring data from native lichens is the use of interpretative scales [16] based on thresholds identifying classes of increasing element concentrations, and obtained by the meta-analysis of a large set of bioaccumulation data for epiphytic lichens at the national level [17]. The so-called “naturality/alteration scales”, extensively applied until now (e.g., [18,19,20,21,22,23]), were originally proposed by Nimis and Bargagli and consist of seven classes of element concentrations built up on hundreds of data points collected in Italy between the 1980s and the 1990s [16]. Source data referred to 17 elements with a minimum of 100 records each, obtained from at least three biomonitoring surveys carried out in areas characterized by different pollution levels and geomorphology [16]. The simple core idea behind these interpretative scales is undoubtedly powerful. However, as recognized by the same authors, some important issues remained unsolved. In particular, naturality/alteration scales are multi-specific, meaning that the source data referred to manifold lichen species, hence posing an important problem related to the acknowledged species-specificity of lichen bioaccumulation [17,24,25,26]. Moreover, in the intentions of authors, source data should have been reported in an accessible database, so as to allow the inclusion of new records together with important methodological information (e.g., lichen species, geographical location, sample mineralization technique). Unfortunately, this did not occur and the same source data on which the scales were built up remained unpublished.
For biomonitoring techniques based on lichen transplants (Table 1), the interpretation is generally based on the comparison of the elemental concentrations measured in samples exposed in the target study area for 0.5–6(–12) months and those measured in unexposed samples (Table 1) immediately after collection of the bulk material in a proximate-natural site. Even in this case, an interpretative scale is available [27]. The core idea behind this scale, originally proposed by Frati et al. [27], was substantially different from that of naturality/alteration scales, because the data are expressed as a ratio, the so-called exposed-to-control (EC) ratio (Table 1), calculated by dividing the element concentration values of exposed samples (eventually the mean values, if more samples are exposed at the same site) by those of unexposed samples. The resulting “accumulation/loss scale” consisted of five classes built up on arbitrary cutoffs (that is, progressive ±25% deviations from the unitary EC value [27]) on the basis of considerations derived from lichen bioindication studies [27,28].
The aim of this work was to develop new scales, using a methodologically consistent pipeline and revised terminology, based on the meta-analysis of biomonitoring data. In particular, we conceptualized two dimensionless scales for native and transplanted lichens, based on (i) the ratio between element concentration data and species-specific review-based BECs (herein contextually provided), and (ii) the ratio between element concentration values measured in exposed and unexposed lichen samples, respectively. Both scales, along with the previously available ones, were also applied to real case studies in order to assess their relative performance. The new scales are valid for Italy, but being based on a robust conceptual framework, they may easily be implemented in other countries.

2. Data and Methodology

2.1. Data Collection

A literature search was undertaken between April and May 2018, in order to compile a list of eligible biomonitoring studies targeting lichens as bioaccumulators of trace elements, with the main aim of populating two datasets, including (i) bioaccumulation data from biomonitoring studies relying on native lichens (herein, dataset N: i.e., Native) and (ii) bioaccumulation data from biomonitoring studies relying on lichen transplants (herein, dataset T: i.e., Transplants). References were included when based on (a) native lichens, referring to thalli grown at different environmental conditions, from proximate-natural to variously human-impacted ones; and (b) lichen transplants, referring to lichen material purposely collected in areas unaffected by significant levels of airborne pollutants and afterwards exposed in polluted areas for relatively short periods. Studies were then reviewed and excluded when meeting at least one of the following conditions: (i) the study was carried out outside the Italian territory; (ii) data were pooled for different lichen species; or (iii) transplanted samples were exposed for more than four months (non-routine exposure time spans).
Element concentration values were recorded just as reported in the papers, with the exception of values below the limit of instrumental detection (LOD), which were recorded as LOD values. All values were expressed in μg × g−1 dry weight (DW). In addition to the element concentration data, methodological information concerning the acid sample digestion was also recorded, because such a procedure is known to affect the results of elemental analytical determination [15,29,30]. Moreover, relevant information concerning the lichen species, the administrative region of study areas, and the year of data collection or publication (when the former was missing) was recorded as well. Data from lichen transplants were labelled according to their type: (i) element concentration data from unexposed samples, and (ii) element concentration data from exposed samples. The exposure time span of transplants was also recorded, using the week as base unit.

2.2. Data Processing

The dataset N was initially subjected to a methodological screening. In order to enhance data homogeneity, element concentration data obtained with partial acid digestion of lichen samples (i.e., without hydrofluoric acid, HF) were discarded to enhance methodological uniformity and because this mineralization approach, although largely used and safer for operator health, may determine unsatisfactory recoveries for typical tracers of soil contamination [15,31]. Moreover, data before 2008 were also removed (temporal data filtering) to increase methodological comparability. Indeed, older biomonitoring studies were often deficient in methodological details concerning sample processing procedures, with special reference to sample cleaning (i.e., washing vs. manual cleaning) [14] and selection of suitable parts of thalli (i.e., peripheral parts vs. whole thalli) [32], all procedures known to bias the lichen elemental concentration [17]. Also, when these studies reported such information, a substantial methodological heterogeneity was highlighted. By contrast, in the most recent literature, sample washing and the use of whole thalli were abandoned in favor of a manual debris cleaning and the use of peripheral portions of thalli. In addition, all the elements with data deriving from lichen samples collected from less than three administrative Italian regions were excluded, along with those characterized by less than 40 records. Afterwards, the dataset was carefully screened for the occurrence of duplicated records, typing errors, or inconsistent units of measurements. Descriptive statistics were finally calculated for different elements and lichen species; these included the number of records, mean, median, range, quartiles, as well as skewness and kurtosis of the element concentration data distribution.
The construction of the dataset N enabled easy assessment of review-based, methodologically uniform background element concentration values (BECs) for frequently used species. Indeed, following the rank-based approach used for the assessment of quality levels of soils and sediments [33], the 25th percentile of species- and element-specific bioaccumulation data distributions was selected as a background benchmark, and each value below this threshold was regarded as a result of unpolluted conditions. Descriptive statistics, that is, mean, standard deviation, median, and median absolute deviation [34], were provided for the sub-dataset consisting of element concentration values below the BEC threshold (BEC dataset). Median values of the BEC dataset were also tested for inter-specific significant differences using Mann–Whitney’s U test for independent samples.
After having identified species-specific BECs as the 25th percentile of dataset N, each element concentration value in the same dataset was divided by the corresponding BEC value to obtain a new dataset of the same size that included dimensionless values, namely the ratios between element concentration and background values. This simple procedure was inspired by common practices in soil geochemistry. Indeed, many authors [35,36,37] have suggested that the calculation of ratios of element concentrations observed in topsoil to those in the subsoil may provide a reliable indication of contamination [38]. Moreover, this approach is methodologically similar to that used for the expression of results in transplant-based studies (see infra). Such a unitless entity, the B ratio (i.e., Bioaccumulation ratio; Table 1), indicates absence of bioaccumulation with respect to the national background when it is lower than or equal to 1, whereas it indicates bioaccumulation occurrence when it exceeds 1. B ratios, organized in a single column vector (i.e., B ratio dataset; Data S1), were then tested for significant inter-specific differences (Methods S1; Table S1). Finally, skewness and kurtosis of the B ratio distribution were calculated. After appraisal of B ratio distributional shape, the 25th, 75th, 90th, and 95th percentiles were used as interval thresholds to define a five-class interpretative scale.
The dataset T was also subjected to a preliminary methodological screening; data obtained with partial acid digestion of lichen samples were discarded. However, because the dataset was far smaller than the dataset N, no temporal data filtering was performed, and only those elements characterized by less than 25 records were removed.
Each element concentration value referring to exposed samples in the dataset T was divided by the corresponding unexposed mean value, so as to obtain a new dataset that included dimensionless values, namely the ratios between element concentration values of exposed and unexposed lichen samples. This further unitless entity, the EU ratio (i.e., exposed-to-unexposed ratio; Table 1), previously proposed by Frati et al. [27] as EC ratio, and herein terminologically revised, indicates absence of bioaccumulation with respect to a local unaltered situation when it is lower than or equal to 1, whereas it indicates bioaccumulation occurrence when it exceeds 1. EU ratios, organized in a single column vector, were then tested for significant inter-specific differences, as done for the B ratios of native lichens (Methods S1; Table S1). EU ratio data were analyzed to assess the most frequent exposure time spans (expressed in weeks). Data obtained from the analysis of samples exposed for commensurable time spans were then uniformly labelled (e.g., 8 and 9 week-transplants; Section 3.2). Subsequently, data were split into three sub-datasets, homogeneous for transplant exposure time span (i.e., EU ratio sub-datasets; Data S2–S4). Each sub-dataset was further screened for upper outliers according to the Tukey method (i.e., values higher than the third quartile of the distribution plus three times the interquartile range), which makes no distributional assumptions and is applicable to skewed or non-bell-shaped data distributions [39]. After outlier removal, each sub-dataset was further tested for inter-specific differences (Methods S1; Table S1). Finally, skewness and kurtosis of EU ratio distributions were calculated. After appraisal of EU ratio distributional shape, the 25th, 75th, 90th, and 95th percentiles were calculated and corrected to account for the overall uncertainty associated with small-sized datasets. In particular, EU ratio values were corrected by subtracting from them a percentage corresponding to the semi-range of the 95% confidence interval of EU ratio data divided by the mean [40]. The corrected-percentiles were then used as interval thresholds to define a five-class interpretative scale, with the exception of the boundary between Class 1 and Class 2, which was aprioristically established at the unitary value because this represents the discernibility threshold between the occurrence of bioaccumulation (EU ratio > 1) and its absence (EU ratio ≤ 1).
All data analyses and graphics were performed with the software packages Statistica v. 10 (StatSoft Inc., Tulsa, OK, US) and Microsoft Excel (Microsoft Office Professional Plus 2010), with statistical significance tested at α = 0.05 in all cases. Figures were edited with CorelDraw X7.

2.3. Working Examples: Case Studies from NE Italy

The results obtained with the new interpretative scales and with the previous ones for native [16] and transplanted lichens [27] were compared using two case studies from NE Italy, respectively obtained by analyzing (a) native samples of Flavoparmelia caperata and Xanthoria parietina and (b) transplanted samples of Pseudevernia furfuracea.
Samples of F. caperata and X. parietina were collected in 2014 at 40 sampling sites around a coal-fired thermoelectric power plant in the municipality of Monfalcone (NE Italy) [41,42]. Sampling sites were distributed according to a systematic design (regular grid, 2 × 2 km) and, when possible, lichen thalli were collected on the same host tree species. Element concentration (expressed in µg g−1 dry weight (DW)) was measured by Inductively Coupled Plasma Mass Spectrometry (ICP-MS) after total sample mineralization [41]. The severity of pollutant depositions was expressed according to (i) naturality/alteration scales [16] (Table S3) and (ii) the bioaccumulation scale for native lichens proposed here. The results reported were limited to As, Cd, and Cr—three elements of environmental and health concern [43,44] that were randomly extracted from the set of elements included in the dataset N. The random selection was meant to avoid a potential bias due to expert-based selection of elements, possibly leading to a “desired outcome”. For this reason, the random extraction prevailed on other criteria, such as the accuracy achieved in the determination of the elemental content. In this respect, As, Cd, and Cr were characterized by recovery percentages of 109%, 70%, and 98%, respectively [41].
For the transplant case study, we referred to ancillary data of a biomonitoring study aimed at evaluating the contamination of mercury around a waste incinerator located in the northern Friulian plane (NE Italy) [45]. Samples of P. furfuracea were collected in 2008 in a remote area of the eastern Alps and transplanted for 12 weeks to 30 sites distributed along three linear transects centered on the waste incinerator, mostly characterized by agricultural land use [45]. Element concentration (expressed in µg g−1 DW) was measured by ICP-MS after total sample mineralization [45]. EU ratios were calculated and used to assess the severity of pollutant depositions according to (i) the accumulation/loss scale [27] and (ii) the bioaccumulation scale for lichen transplants proposed here. Even in this case, the results reported were limited to As, Cd, and Cr, for which recovery percentages were 99%, 94%, and 101%, respectively [45].
Cartographic representations showing sampling and transplant sites and the outcome of the application of different interpretative scales were provided. Cartographic elaborations were performed with QGIS 2.18.27 ‘Las Palmas’.

3. Results and Discussion

3.1. Native Lichens

3.1.1. Source Data and Species-Specific BECs

The dataset N included 32,187 bioaccumulation data points from native lichen samples. Element concentration data referred to 42 elements measured in samples of five lichen species collected in 18 administrative Italian regions. Species included Flavoparmelia caperata, Parmelia sulcata, and Xanthoria parietina (foliose lichens), as well as Evernia prunastri and Pseudevernia furfuracea (fruticose lichens). After the methodological and temporal data filtering, the dataset N included 3773 records for 11 elements of environmental concern analyzed in the context of 11 studies (either published or not; in the latter case, methodologically consistent data were provided by the authors; Data S1). Data referred to samples of the lichen species F. caperata and X. parietina (Table 2; Figure S1) collected in five Italian regions (Friuli Venezia Giulia, Lazio, Liguria, Molise, and Toscana).
The foliose lichen species F. caperata and X. parietina are the most used species in biomonitoring based on native lichens across Italy [4]. Indeed, such species are widespread, with very abundant populations from the submediterranean to the submontane belt [46], providing adequate sampling density for a reliable assessment of pollutant deposition patterns [10]. Overall, F. caperata and X. parietina accounted for 79.6% and 20.6%, respectively, of data. All elements, except for V, included data from both lichen species (Table 2). The methodological data filtering resulted in a substantial reduction of the dataset (−88.3%). However, the final data sizes, separately reported for each element and species, were comparable to those reported by Nimis and Bargagli [16] in their multi-specific interpretative scales (Table S3).
When inter-specific differences were tested on median values of the BEC dataset (Section 2.2), significant differences were highlighted for 9 out of 10 elements (p < 0.05), with the exception of Hg, characterized by very low values in both species (Table 3). F. caperata exhibited higher concentrations of As, Cd, Cu, Pb, and Zn, whereas X. parietina had more Al, Cr, Ni, and Ti.
Our findings were in agreement with those of Nimis et al. [17]. Indeed, these authors highlighted higher Cd and Zn in F. caperata than in X. parietina and an opposite pattern for Al and Fe [17]. Limited to Cd, Zn, and Al (Fe was excluded from our analyses), such a pattern fully matched our results, both when inter-specific differences were statistically tested in the BEC dataset (cf. the outcome of non-parametric statistical testing carried out for BECs in Table 3) and in the entire dataset N (Table 2).
The review-based BECs for F. caperata and X. parietina were generally comparable in terms of order of magnitude to those previously published for other lichens. Nevertheless, our BEC values were often lower than review-based BECs reported for pooled foliose lichen species [2] and for Hypogymnia physodes [11], interestingly with the only exception of Al and Ti for X. parietina (cf. Table 3 and Table S2). BECs for F. caperata and X. parietina were also compared to field-assessed BECs for the fruticose lichen Pseudevernia furfuracea based on total acid sample digestion [15]. Even in this case, the reference values for the two foliose species were either lower than or comparable with the lowest BECs reported by the authors (cf. Table 3 and Table S2).
Such data comparisons highlighted an overall pattern of comparability between the magnitude of different species-specific sets of BECs (with few exceptions, e.g., Hg). With respect to P. furfuracea, the lower BECs of F. caperata and X. parietina may reflect both different approaches (review-based vs. field-based BEC assessment) and lichen morphology [47]. By contrast, the higher review-based BECs reported by Bargagli are plausibly the result of aged source data, which likely included methodologically inconsistent records and bioaccumulation data from improperly defined background contexts. In this light, the assessment of review-based BECs for biological matrices should be regarded as an accurate and dynamic process, providing for the collection of methodologically uniform data for single species and involving periodical adjustments aimed at including the most recent data.

3.1.2. Bioaccumulation Scale for Native Lichens

When bioaccumulation data in the dataset N were divided by the corresponding BECs (B ratio dataset; Data S1), inter-specific differences became negligible. Indeed, the non-parametric testing (Methods S1) did not highlight significant B ratio differences between the two species (Mann–Whitney U test, p > 0.05; Table S1; Figure S2). Therefore, the simple operation of dividing element concentration data by matched BECs had useful effects for interpretative purposes. As element concentration data and BECs are element- and species-specific, such specificity resulted flattened in the B ratio, allowing to develop a unique scale based on a high samples size (n = 3773).
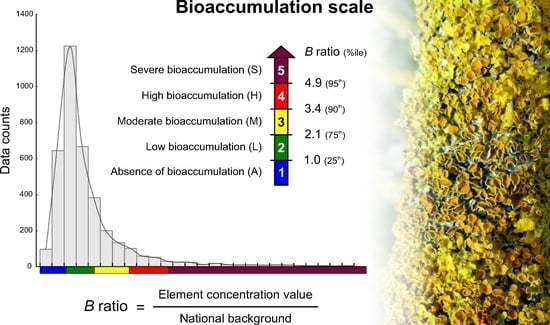
The distribution of B ratios (Figure 1) was unimodal, right-skewed, and strongly leptokurtic (skewness > 0, kurtosis > 3), as previously highlighted for the distribution of bioaccumulation data in epiphytic lichens, either pooled or not [17].
The percentile thresholds for the elaboration of the new interpretative scale were redefined with respect to those of Nimis and Bargagli [16] after the appraisal of B ratio distributional shape. The 50th percentile was discarded because the corresponding B ratio value (B = 1.4) was too close to the BEC threshold of 1.0. The selection of the 90th percentile as upper/lower threshold of Class 3/4 (Figure 1, Table 4) was based on toxicological considerations [33,48]. In particular, the 90th percentile of concentration data was recently proposed as “environmentally relevant” [48], thus well suited as cutoff between the occurrence of “Moderate” and “High” bioaccumulation. Finally, the 95th percentile was chosen, instead of 98th, as the upper/lower threshold of Class 4/5 based on a precautionary approach. On these grounds, the ranges of the B ratio classes were characterized by similar amplitudes (Table 4).
The interpretative bioaccumulation scale was definitely improved with respect to previous multi-specific naturality/alteration scales. Indeed, besides being based on the most recent and methodologically consistent data, the B ratio scale is also readily understandable and provides easy implementation. As with species-specific BECs, the B ratio-based interpretative scale will need to be updated with the most recent data. We estimate that this might occur approximately every ten years.
The terminological shift from the previous “naturality/alteration” (Table S3) to the more cautious “bioaccumulation level” (Table 4) may apparently pose some issues. Indeed, the latter form suggests a mere assessment of the magnitude of bioaccumulation levels in lichens, whereas the former stresses the link between lichen bioaccumulation and pollution, expressly indicating the use of scales to “assess environmental alteration in terms of a deviation from natural backgrounds” [10] (i.e., “naturality”). Yet, despite the inspiring terminology, previous scales did not rely on any operational definition of quantitative threshold for “naturality” (e.g., proper background reference), instead being based on a circular definition of “alteration” with respect to “naturality” (and vice versa) [28]. By contrast, a statistically-based element concentration benchmark (i.e., review-based BECs) is inherent to the B ratio, thus the new scale is actually able to assess whether or not deviations from a national unaltered reference occurred. In this light, the terminological shift was contextually driven by (i) the need to underline the novelty of the B ratio scale and (ii) a harmonization intent with the new scale provided for lichen transplants (see infra).

3.2. Lichen Transplants

3.2.1. Source Data

Before the data cleaning (Section 2.1), the overall EU ratio dataset included 820 bioaccumulation data from lichen transplant studies published over the last 25 years. Element concentration data referred to 15 elements (Al, As, Ca, Cd, Co, Cr, Cu, Fe, K, Mg, Mn, Ni, Pb, V, and Zn) analyzed in the context of 18 studies. Data referred to samples of two fruticose species, Evernia prunastri and Pseudevernia furfuracea, collected in 10 Italian administrative regions (Calabria, Campania, Emilia Romagna, Friuli Venezia Giulia, Lazio, Liguria, Lombardia, Piemonte, Toscana, Veneto). Fruticose species are usually preferred over foliose species for lichen transplants [4] because they ensure greater biomass per lichen thallus, as well as easier cleaning and installation, thus contextually reducing processing time and enhancing sample homogeneity [49]. Overall, E. prunastri and P. furfuracea accounted for 18.3% and 81.7%, respectively, of data. All elements, except for Mg, included data from both lichen species.
The transplant exposure time span varied across studies: 21%, 8%, 14%, 20%, 1%, and 36% of data relied on 4, 6, 8, 9, 11, and 12 week transplants, respectively. Data relying on comparable exposure periods (i.e., 6, 8, and 9 weeks, as well as 11 and 12 weeks) were labelled as 8-week transplant and 12-week transplant, respectively, in order to obtain three numerically balanced sub-datasets for equally spaced exposure periods. Outliers identification led to the removal of 5, 17, and 11 EU values from the three sub-datasets (4, 8, and 12 weeks, respectively). Eventually, the 4-week EU ratio sub-dataset accounted for 21% of data (n = 169 records), the 8-week sub-dataset for 42% (n = 330), and the 12-week sub-dataset for 37% (n = 288) (Data S2–S4).

3.2.2. Bioaccumulation Scale for Lichen Transplants

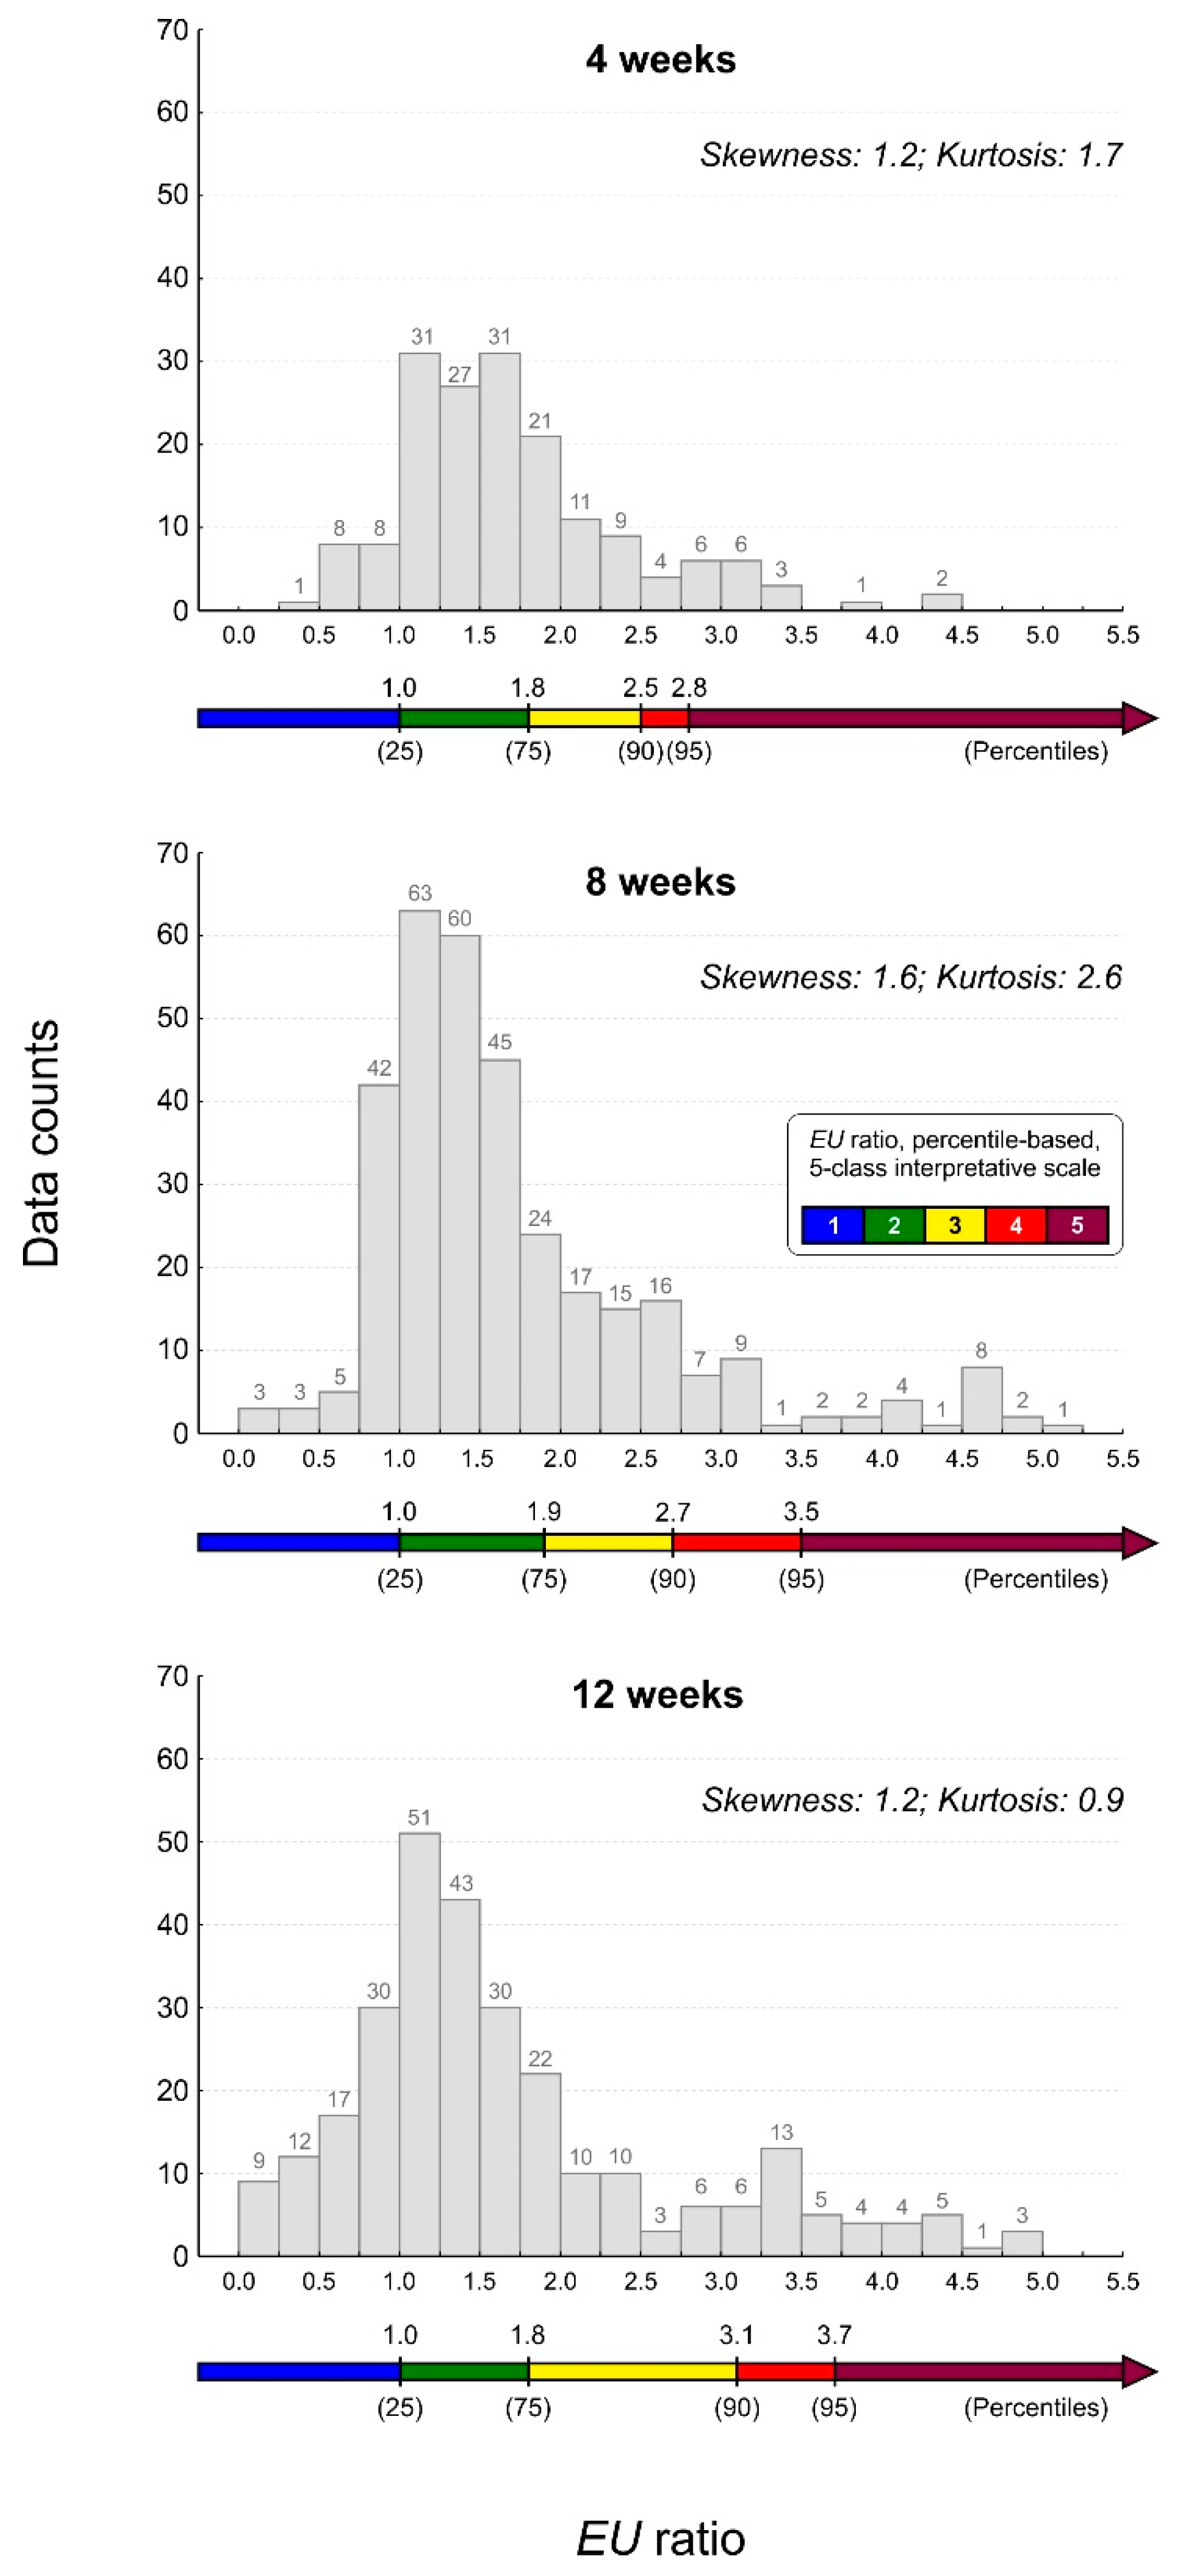
Even in the case of bioaccumulation data from lichen transplants, inter-specific differences were negligible when addressed by non-parametric testing on EU ratios. Indeed, the output of statistical testing (Methods S1) did not highlight significant EU ratio differences between the two species (Mann–Whitney U test, p > 0.05; Table S1; Figure S3), thus the same considerations spelt out for B ratios apply. EU ratio distributions were right-skewed and slightly platykurtic (skewness > 0, kurtosis < 3; Figure 2). The positive skewness was consistent (although lower) with that of the B ratio distribution.
Certainly, the marked differences between the distributions of B and EU ratios were because of different (i) sample sizes (Section 3.1.2 and Section 3.2.1), (ii) benchmark values in the ratio denominators (i.e., BECs vs. elemental concentration values of unexposed samples), and (iii) duration of lichen exposure to pollutants and bioaccumulation mechanisms. Concerning the latter point, transplanted lichens are exposed for few weeks to new, and often harsh, environmental conditions, thus rapidly accumulating mostly through passive mechanisms [50,51]. By contrast, the bioaccumulation in lifespan-exposed native lichens is the result of a long-term interplay of both passive phenomena and slower active intracellular uptakes characterized by element-specific kinetics [52]. Such interplay eventually results in the achievement of a dynamic equilibrium with the surrounding environment [53] and likely in higher elemental concentration levels in the case of important pollutant loads. Indeed, EU ratios corresponding to 90th and 95th percentiles of the distributions were lower than the corresponding B ratio values (cf. Table 4 and Table 5).
In transplants, the importance of the exposure time span [54,55] emerged in the EU ratio data in the case of high pollutant loads. Indeed, an increasing trend of EU ratio values corresponding to 90th and 95th percentiles was observed when moving from 4 to 12 week exposure (Figure 2, Table 5). Utmost differences were highlighted for the EU ratio corresponding to the 95th percentile between the 4 week exposure and 8 or 12 week exposures (2.8 vs. 3.5 and 3.7; Table 5). Interestingly, no trend of increasing values from 4 to 12 weeks was highlighted for EU ratio values corresponding to 25th and 75th percentiles, confirming that the exposure time span mostly affects bioaccumulation results in the case of high levels of airborne pollutant depositions (EU ratio above 90th percentile, i.e., environmentally relevant bioaccumulation [48]). On this basis, three different series of values have been reported, to be alternatively used according to the selected exposure time span. Nevertheless, it should also be pointed out that in most biomonitoring literature targeting mosses, short exposure times (i.e., 3–4 weeks) are discouraged because unclear “accumulation signals” would lead to the construction of derived datasets of limited reliability [9]. Such a methodological issue has been dealt more rarely for lichen transplants, but it is generally agreed that lichens should be exposed for at least 6–8 weeks, based on the following considerations: detectable accumulated concentrations, replicability, and exposure time spans within the limits of practical considerations [55].
In the bioaccumulation scale proposed for lichen transplants, the upper/lower EU ratio threshold of Class 1/2 was aprioristically established at EU = 1 (Section 2.3). However, it is worth noting that the corrected EU ratio values corresponding to the 25th percentile are actually very close to such a value (ranging from 0.9 to 1.1, see footnote in Table 5; Data S2–S4).
Even in this case, we decided to abandon the old class description based on the concept of “loss”, because an element concentration decrease may either reflect actual “pristine” ambient air conditions at the transplant sites or a “washing effect” caused by rainfall in the presence of non-negligible pollutant emissions [56]. Finally, it must be pointed out that, given the relatively limited amount of source data, this new bioaccumulation scale for lichen transplants has to be regarded as preliminary and should be used with caution, pending the inclusion of new available bioaccumulation data.

3.3. Comparison between Previous and New Interpretative Scales

The naturality/alteration scales applied in the last twenty years in Italy [16] and the brand-new bioaccumulation scale for native lichens (Table 4) were both applied to the same case study. In this case, a direct comparison between classes attributed to sampling sites resulting from different interpretative scales would be pointless because of the substantial differences in scale conceptualization; however, a comparative analysis of outcomes permitted some interesting considerations.
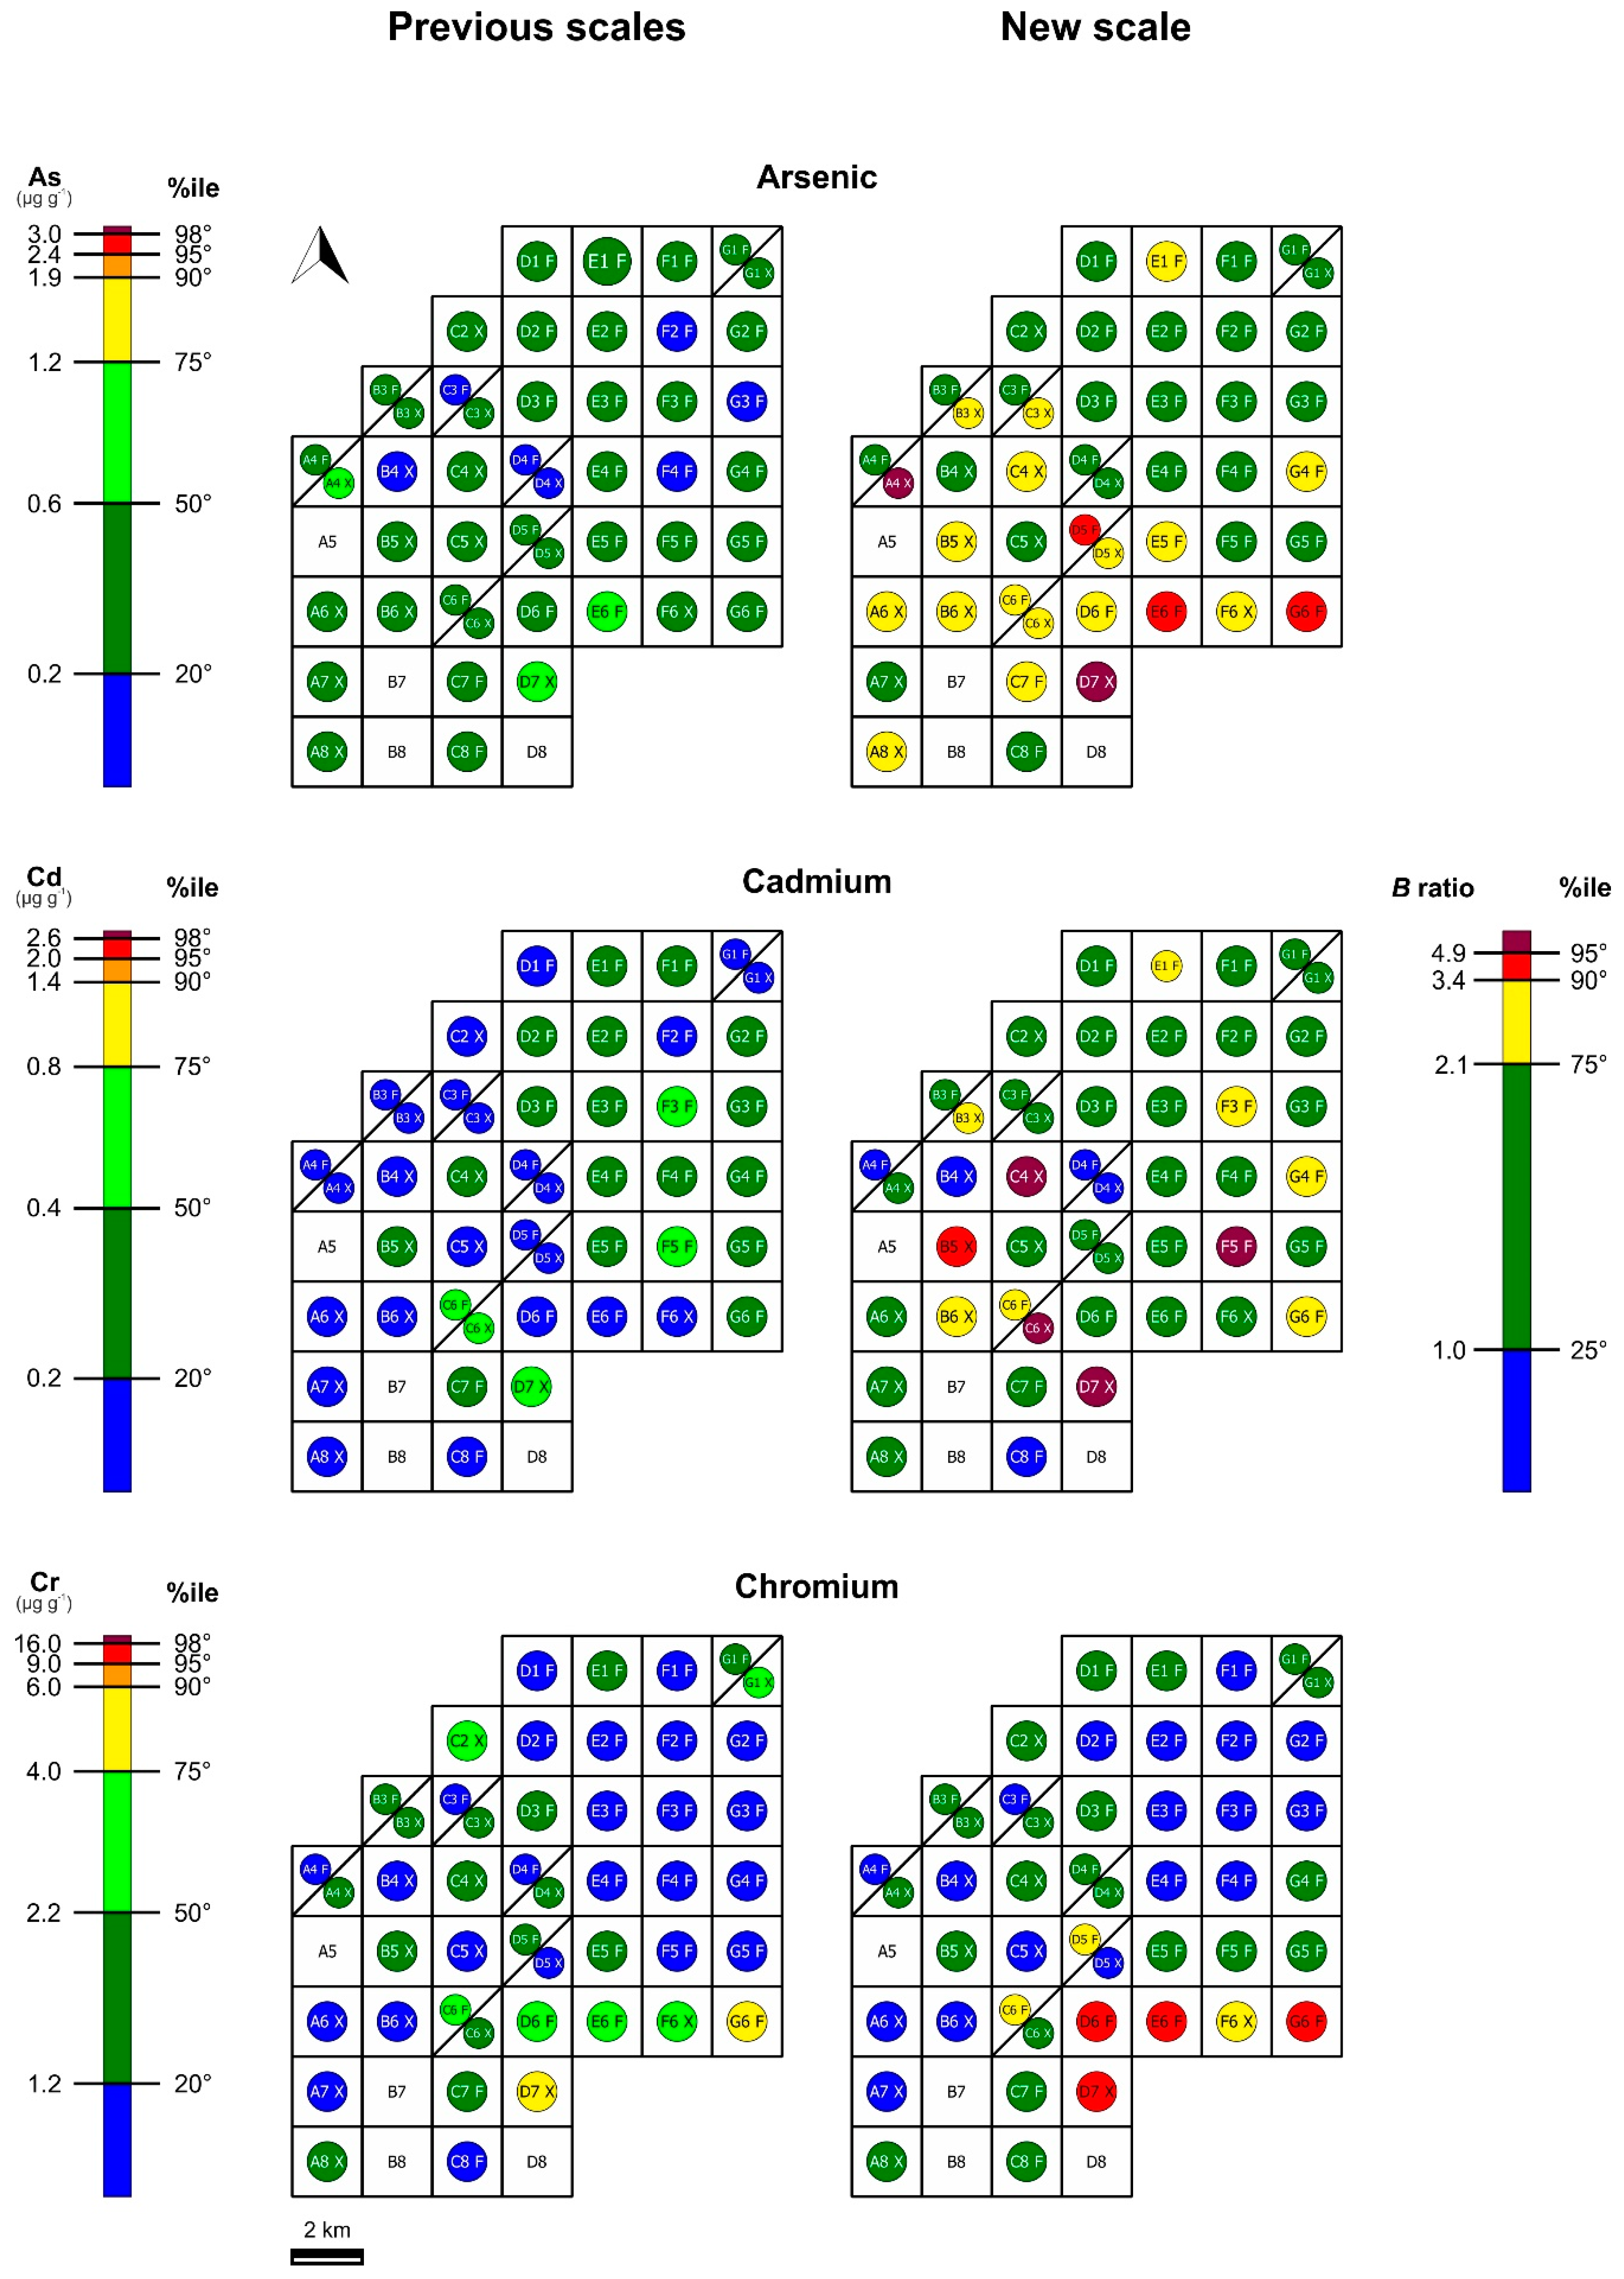
Overall, the application of previous scales provided a rather optimistic description of the study area. According to the seven-class scale, the vast majority of sampling sites were characterized by “very high” and “high naturality”. In particular, 96.5%, 89.6%, and 86.2% of sites belonged to such classes for As, Cd, and Cr concentration in Flavoparmelia caperata, as well as 88.9% (As and Cd) and 77.7% (Cr) for Xanthoria parietina (Figure 3, Table S5). “Low alteration” characterized only two sites for Cr (G6 and D7 for F. caperata and X. parietina, respectively; Figure 3).
When the new bioaccumulation scale was applied, the majority of sampling sites were consistently characterized by “Low bioaccumulation”, with the exception of As in X. parietina, instead characterized by a majority of sites belonging to Class 3 (“Moderate bioaccumulation”). In particular, 69.0%, 79.3%, and 82.8% belonged to Classes 1 and 2 for As, Cd, and Cr concentration, respectively, in F. caperata, as well as 33.3% (As), 66.7% (Cd), and 88.9% (Cr) for X. parietina. However, by applying this scale, some cases of “High” and “Severe bioaccumulation” were also highlighted (Figure 3, Table S5), thus determining a more conservative interpretation.
The study area is characterized by high anthropogenic pressure and the presence of a coal-fired thermoelectric power plant, shipbuilding industries, and other small industrial activities [41]. Previous investigations demonstrated that, overall, the elemental concentrations in lichens grown in the study area were not impressively high; however, a certain contamination of As and Cr occurred. These elements are acknowledged tracers of coal combustion [57,58]; therefore, the enrichment observed in thalli collected at specific sites was ascribed to the power plant emissions [41], although these were compliant with threshold limits [59]. In particular, the evidence that Cr concentration in lichen samples was related to the plant emissions was confirmed by the results of an air particulate matter sampling carried out during both operational and non-operational state of the plant [42].
The pattern revealed by the new scale correlates well with the deposition plume highlighted by traditional modelling approaches, particularly for As. Indeed, the deposition plume starts from the power plant (E6) and develops over the east–west axis following the prevailing wind direction blowing from the east (as modulated by the local orography) [41,42]. By contrast, the application of previous scales failed to represent the actual variations in element depositions affecting the whole area, especially for As. Regarding Cd, it should be preliminary stated that the rather low recovery (70%, Section 2.3) could introduce a certain bias in element content results and cartographic output. Having said that, previous and new scales identified a consistent pattern for sites located in the proximity of shipbuilding activities (i.e., C6-7, D6-7, E6, F6, G6), but again, previous scales provided a certainly more optimistic scenario (cf. sites D7 and G6; Figure 3).
The reasons for the general worse performance of the naturality/alteration scales have to be sought in the source dataset. Indeed, this included rather old studies often reporting high element concentration values, which consequently affected data distributions and resulted in a general underestimation of pollutant depositions (cf. median values of Table 2 with values corresponding to 50th percentiles in Table S3), thus explaining the misleading outcome obtained for As. This is further evidence that interpretative scales obtained through a meta-analytical approach may quickly become obsolete as a result of rapidly changing scenarios, for example, variations in pollutant emissions determined by a plethora of anthropogenic and non-anthropogenic causes (i.e., abatement or increasing traffic-related pollution, introduction of environmental protection measures, long-range atmospheric transport, and so on [60,61,62]).
The accumulation/loss scale [27] and the brand-new bioaccumulation scale for lichen transplants (Table 5) were both applied to the same case study. The concentration of As, Cd, and Cr significantly increased in the samples of Pseudevernia furfuracea after 12-week exposure, although enrichment levels were not indicative of strong contamination [45].
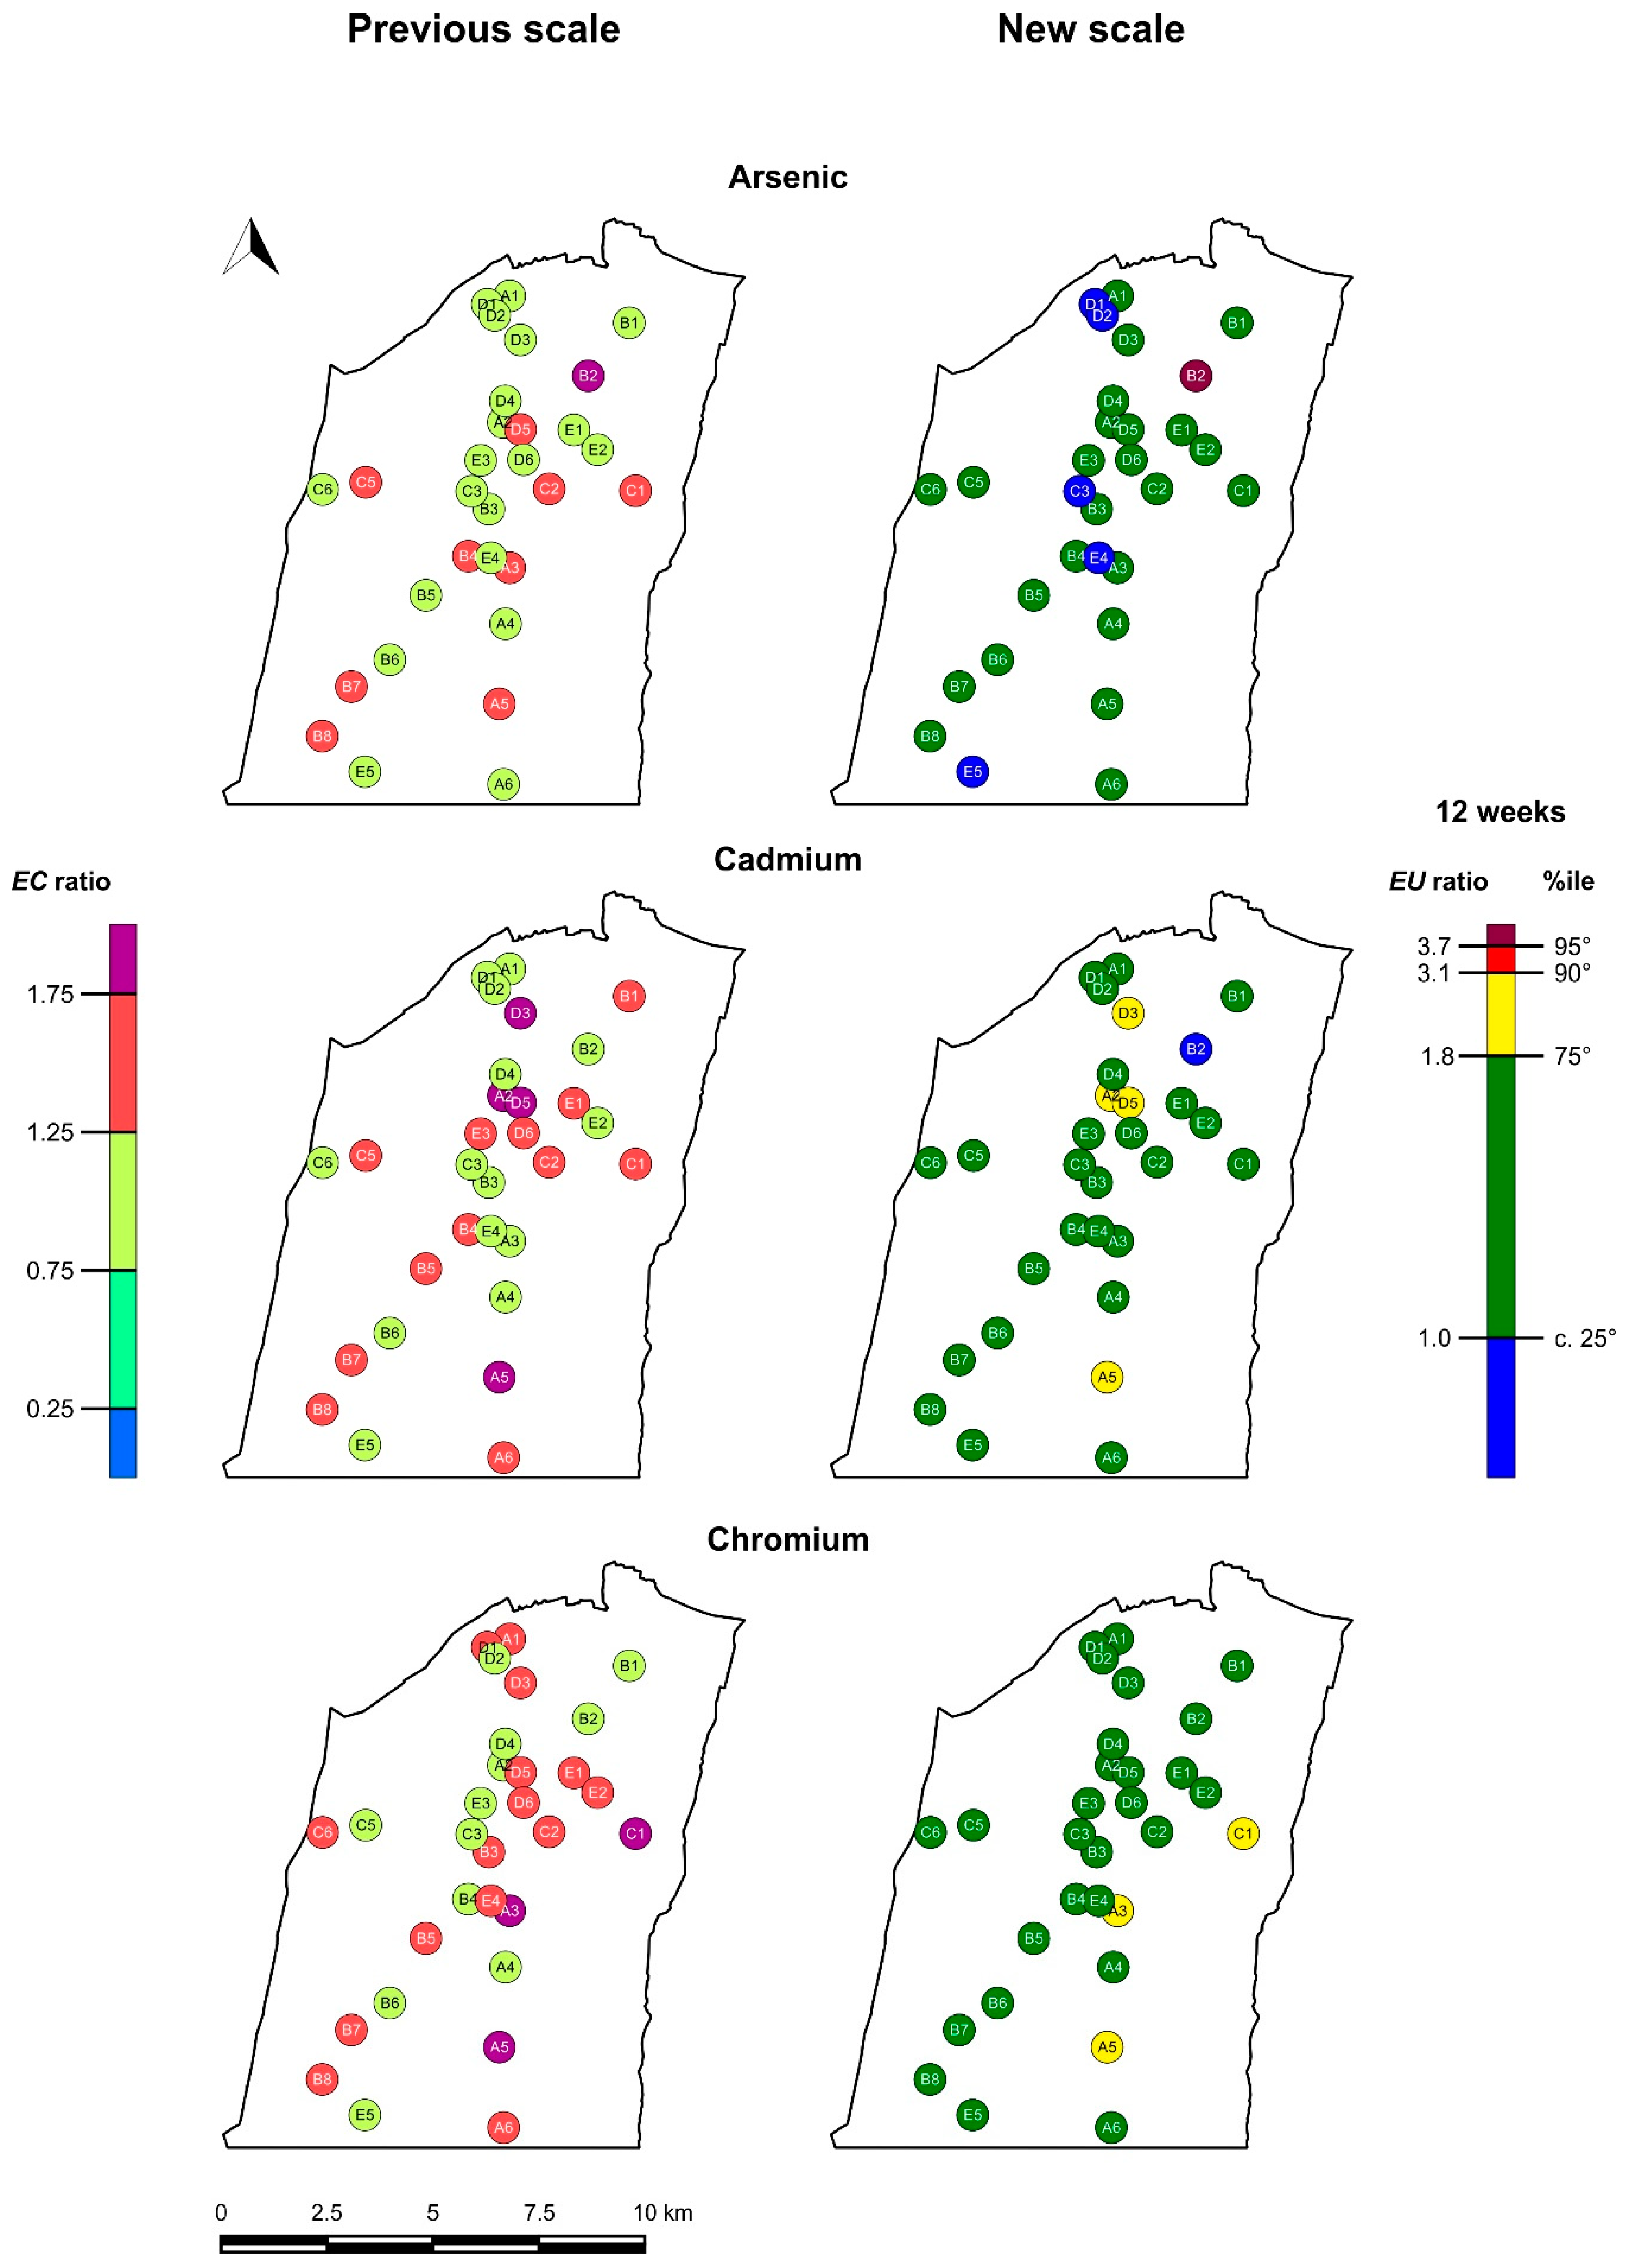
According to the previous scale [27], transplant sites were characterized by “normal” accumulation (Table S6) in 66.7%, 46.7%, and 40% of cases for As, Cd, and Cr, respectively. Instead, “accumulation” or “severe accumulation” occurred in 33.3% (As), 53.3% (Cd), and 60.0% (Cr) of cases. When the new scale was applied, the great majority of sites were characterized by “Absence of bioaccumulation” or “Low bioaccumulation”; in particular, 96.7% (As), 86.7% (Cd), and 90.0% (Cr). “Severe bioaccumulation” was highlighted in samples exposed in a single site (3.3%) limited to As, whereas “Moderate bioaccumulation” characterized 13.3% (Cd) and 10.0% (Cr) of sites.
The main limitations of the accumulation/loss scale are evident. Indeed, its use determines (i) a heavy flattening of element concentration variations concerning enrichments exceeding 75% (which are uncompromisingly identified as “severe accumulation”), and (ii) an exacerbation of slighter variations (i.e., enrichments between 24% and 76%, which are considered to range between “normal” and “severe” accumulation”). A case in point is represented by the highest values revealed for As in the study area: indeed, the two highest exposed values were 0.37 µg g−1 (EU = 1.50) and 2.34 µg g−1 (EU = 9.35), measured in samples exposed in D5 and B2, respectively (Figure 4; Table S6). Using the accumulation/loss scale, the difference between an increase of 50% (D5) and an increase of 835% (B2) with respect to the unexposed levels is poorly reflected by a single class step (from “accumulation” to “severe accumulation”; Table S4). By contrast, such a large difference is far better reflected by the three class steps of the bioaccumulation scale (from “Low” to “Severe” bioaccumulation; Table 5).
Another issue inherent to the use of the previous scale concerns the precision achieved in determining mean element concentration values of unexposed samples (i.e., the closeness of agreement among the set of element concentration results [63]). A proper assessment of such a reference value may indeed be a non-trivial task. Operators usually average element concentration values measured in a certain number of samples taken from thalli randomly selected from bulked lichen material. Obviously, this should be based on adequate sample size, which in turn should be established on the basis of a preliminary characterization of the elemental concentration variability of the target lichen matrix in the background site. However, the mean value of unexposed samples is often assessed by analyzing too few samples (frequently n = 3), and this could have potential interpretative consequences when using a scale based on classes of limited width such as the accumulation/loss scale [27]. As a matter of fact, when element concentration values are few and highly dispersed (e.g., coefficient of variation > 1), and especially in case of rather low enrichments, the ascription of the EU value to a bioaccumulation class may result in a pointless procedure, as these conditions would not guarantee repeatability.

4. Conclusions

In biomonitoring, interpretative scales are fundamental to the assessment of the magnitude of pollution phenomena. Until now, scales based on very different assumptions have been developed: the so-called “naturality/alteration scales”, for biomonitoring with native lichens; and the “accumulation/loss scale”, for transplant-based applications. Despite their popular use in Italy and abroad, both scales were never critically reappraised, notwithstanding some evident methodological flaws.
By recovering some core ideas from previous scales, we developed new interpretative scales based on the meta-analysis of methodologically consistent bioaccumulation data from the most recent Italian literature. The distributions of the ratios between element concentration data and species-specific background (B ratio, native lichens) or element concentration of unexposed samples (EU ratio, transplants) were analyzed. On this basis, two easily enforceable, percentile-based, five-class “Bioaccumulation scales” were set up. A critical revision of scale-associated terminology was also proposed. For both native lichens and transplants, the five classes refer to (1) “Absence of bioaccumulation” (A), (2) “Low bioaccumulation” (L), (3) “Moderate bioaccumulation” (M), (4) “High bioaccumulation” (H), and (5) “Severe bioaccumulation” (S), with B and EU ratio thresholds corresponding to the 25th, 75th, 90th, and 95th percentiles of their distributions.
The comparative application of previous and new scales to two case studies suggested a better and more consistent performance of the latter. Moreover, it also demonstrated that scales developed on the basis of real biomonitoring data may become obsolete owing to changing scenarios, thereby leading to the need for periodical updating with the inclusion of new available data to the source datasets.

Supplementary Materials

The following are available online at https://www.mdpi.com/2073-4433/10/3/136/s1: Supplementary material (including Methods S1, Tables S1–S6, and Figures S1–S3) and Supplementary Data (Data S1–S4).

Author Contributions

Conceptualization, M.T., E.C., L.F. (Lorenzo Fortuna), S.L., P.G., G.B., and L.F. (Luisa Frati); methodology, E.C., L.F. (Lorenzo Fortuna), M.T., and S.L.; software, E.C. and L.F. (Lorenzo Fortuna); formal analysis, E.C. and L.F. (Lorenzo Fortuna); investigation, E.C., L.F. (Lorenzo Fortuna), M.T., R.B., E.B., G.B., T.C., L.F. (Luisa Frati), L.D.N., P.G., S.L., F.M., S.M., J.N., L.P., S.R., and A.V.; resources, M.T., P.G., S.L., L.P., S.R., L.F. (Lorenzo Fortuna), G.B., L.F. (Luisa Frati), F.M., and A.V.; data curation, E.C. and L.F. (Lorenzo Fortuna); writing—original draft preparation, E.C. and M.T.; writing—review and editing, E.C., M.T., P.G., S.L., G.B., L.F. (Luisa Frati), R.B., S.M., F.M., L.P., J.N., L.F. (Lorenzo Fortuna), E.B., S.R., and A.V.; visualization, E.C. and M.T.; supervision, M.T. and P.G.

Funding

This research received no external funding.

Acknowledgments

Thanks are due to Elena Pittao (University of Trieste) for useful suggestions and critical remarks provided during data collection and conceptualization, and to Lucy Sheppard for language revision. This work was conceived and developed by the Working Group on Biomonitoring of the Italian Lichenological Society (SLI).

Conflicts of Interest

The authors declare no conflict of interest.

References

  1. Bargagli, R.; Nimis, P.L.; Monaci, F. Lichen biomonitoring of trace element deposition in urban, industrial and reference areas of Italy. J. Trace Elem. Med. Biol. 1997, 11, 173–175. [Google Scholar] [CrossRef]
  2. Bargagli, R. Plants as biomonitors of atmospheric pollutants. In Trace Elements in Terrestrial Plants. An Ecophysiological Approach to Biomonitoring and Biorecovering; Springer: Berlin, Germany, 1998; pp. 79–103. [Google Scholar]
  3. Ferretti, M.; Erhardt, W. Key issues in designing biomonitoring programmes. In Monitoring with Lichens—Monitoring Lichens; Nimis, P.L., Scheidegger, C., Wolseley, P.A., Eds.; Springer: Dordrecht, The Netherlands, 2002; pp. 111–139. [Google Scholar]
  4. Brunialti, G.; Frati, L. Bioaccumulation with lichens: The Italian experience. Int. J. Environ. Stud. 2014, 71, 15–26. [Google Scholar] [CrossRef]
  5. Brunialti, G.; Giordani, P.; Ferretti, M. Discriminating between the good and the bad: Quality assurance is central in biomonitoring studies. In Environmental Monitoring; Wiersma, B., Ed.; CRC Press LLC: Boca Raton, FL, USA, 2004; pp. 443–464. [Google Scholar]
  6. Hays, S.M.; Becker, R.A.; Leung, H.W.; Aylward, L.L.; Pyatt, D.W. Biomonitoring equivalents: A screening approach for interpreting biomonitoring results from a public health risk perspective. Regul. Toxicol. Pharmacol. 2007, 47, 96–109. [Google Scholar] [CrossRef] [Green Version]
  7. Clewell, H.J.; Tan, Y.M.; Campbell, J.L.; Andersen, M.E. Quantitative interpretation of human biomonitoring data. Toxicol. Appl. Pharmacol. 2008, 231, 122–133. [Google Scholar] [CrossRef] [PubMed]
  8. Giordano, S.; Adamo, P.; Spagnuolo, V.; Tretiach, M.; Bargagli, R. Accumulation of airborne trace elements in mosses, lichens and synthetic materials exposed at urban monitoring stations: Towards a harmonisation of the moss-bag technique. Chemosphere 2013, 90, 292–299. [Google Scholar] [CrossRef] [PubMed]
  9. Capozzi, F.; Giordano, S.; Aboal, J.R.; Adamo, P.; Bargagli, R.; Boquete, T.; Di Palma, A.; Real, C.; Reski, R.; Spagnuolo, V.; et al. Best options for the exposure of traditional and innovative moss bags: A systematic evaluation in three European countries. Environ. Pollut. 2016, 214, 362–373. [Google Scholar] [CrossRef] [PubMed]
  10. Bargagli, R.; Nimis, P.L. Guidelines for the use of epiphytic lichens as biomonitors of atmospheric deposition of trace elements. In Monitoring with Lichens—Monitoring Lichens; Nimis, P.L., Scheidegger, C., Wolseley, P.A., Eds.; Springer: Dordrecht, The Netherlands, 2002; pp. 295–299. [Google Scholar]
  11. Bennett, J.P. Statistical baseline values for chemical elements in the lichen Hypogymnia physodes. In Environmental Pollution and Plant Responses; Agrawal, S.B., Agrawal, M., Eds.; CRC Press: Boca Raton, FL, USA, 1999; pp. 343–353. [Google Scholar]
  12. Bargagli, R.; Sanchez-Hernandez, J.C.; Monaci, F. Baseline concentrations of elements in the Antarctic macrolichen Umbilicaria decussata. Chemosphere 1999, 38, 475–487. [Google Scholar] [CrossRef]
  13. Monaci, F.; Fantozzi, F.; Figueroa, R.; Parra, O.; Bargagli, R. Baseline element composition of foliose and fruticose lichens along the steep climatic gradient of SW Patagonia (Aisén Region, Chile). J. Environ. Monit. 2012, 14, 2309–2316. [Google Scholar] [CrossRef]
  14. Cecconi, E.; Incerti, G.; Capozzi, F.; Adamo, P.; Bargagli, R.; Benesperi, R.; Candotto Carniel, F.; Favero-Longo, S.E.; Giordano, S.; Puntillo, D.; et al. Background element content of the lichen Pseudevernia furfuracea: A supra-national state of art implemented by novel field data from Italy. Sci. Total Environ. 2018, 622, 282–292. [Google Scholar] [CrossRef] [PubMed]
  15. Cecconi, E.; Incerti, G.; Capozzi, F.; Adamo, P.; Bargagli, R.; Benesperi, R.; Candotto Carniel, F.; Favero-Longo, S.E.; Giordano, S.; Puntillo, D.; et al. Background element content in the lichen Pseudevernia furfuracea: A comparative analysis of digestion methods. Environ. Monit. Assess. 2019. under review. [Google Scholar]
  16. Nimis, P.L.; Bargagli, R. Linee-guida per l’utilizzo di licheni epifiti come bioaccumulatori di metalli in traccia. In Atti del Workshop “Biomonitoraggio della Qualità Dell’aria sul Territorio Nazionale”; ANPA Serie Atti; Piccini, C., Salvati, S., Eds.; Roma: Amsterdam, The Netherlands, 1999; pp. 279–289. [Google Scholar]
  17. Nimis, P.L.; Andreussi, S.; Pittao, E. The performance of two lichen species as bioaccumulators of trace metals. Sci. Total Environ. 2001, 275, 43–51. [Google Scholar] [CrossRef]
  18. Brunialti, G.; Frati, L. Biomonitoring of nine elements by the lichen Xanthoria parietina in Adriatic Italy: A retrospective study over a 7-year time span. Sci. Total Environ. 2007, 387, 289–300. [Google Scholar] [CrossRef] [PubMed]
  19. Demiray, A.D.; Yolcubal, I.; Akyol, N.H.; Çobanoğlu, G. Biomonitoring of airborne metals using the Lichen Xanthoria parietina in Kocaeli Province, Turkey. Ecol. Ind. 2012, 18, 632–643. [Google Scholar] [CrossRef]
  20. Pirintsos, S.; Bariotakis, M.; Kalogrias, V.; Katsogianni, S.; Brüggemann, R. Hasse diagram technique can further improve the interpretation of results in multielemental large-scale biomonitoring studies of atmospheric metal pollution. In Multi-Indicator Systems and Modelling in Partial Order; Brüggemann, R., Carlsen, L., Wittmann, J., Eds.; Springer: New York, NY, USA, 2014; pp. 237–251. [Google Scholar]
  21. Cocozza, C.; Ravera, S.; Cherubini, P.; Lombardi, F.; Marchetti, M.; Tognetti, R. Integrated biomonitoring of airborne pollutants over space and time using tree rings, bark, leaves and epiphytic lichens. Urban For. Urban Green. 2016, 17, 177–191. [Google Scholar] [CrossRef]
  22. Paoli, L.; Winkler, A.; Guttová, A.; Sagnotti, L.; Grassi, A.; Lackovičová, A.; Senko, D.; Loppi, S. Magnetic properties and element concentrations in lichens exposed to airborne pollutants released during cement production. Environ. Sci. Pollut. Res. 2017, 24, 12063–12080. [Google Scholar] [CrossRef] [PubMed]
  23. Lucadamo, L.; Corapi, A.; Gallo, L. Evaluation of glyphosate drift and anthropogenic atmospheric trace elements contamination by means of lichen transplants in a southern Italian agricultural district. Air Qual. Atmos. Health 2018, 11, 325–339. [Google Scholar] [CrossRef]
  24. Tretiach, M.; Baruffo, L. Contenuto di elementi in traccia in talli di Parmelia borreri e Xanthoria parietina raccolti sullo stesso forofita. Not. Soc. Lich. Ital. 2001, 14, 70. [Google Scholar]
  25. Minganti, V.; Capelli, R.; Drava, G.; De Pellegrini, R.; Brunialti, G.; Giordani, P.; Modenesi, P. Biomonitoring of trace metals by different species of lichens (Parmelia) in north-west Italy. J. Atmos. Chem. 2003, 45, 219–229. [Google Scholar] [CrossRef]
  26. Bergamaschi, L.; Rizzio, E.; Giaveri, G.; Loppi, S.; Gallorini, M. Comparison between the accumulation capacity of four lichen species transplanted to a urban site. Environ. Pollut. 2007, 148, 468–476. [Google Scholar] [CrossRef]
  27. Frati, L.; Brunialti, G.; Loppi, S. Problems related to lichen transplants to monitor trace element deposition in repeated surveys: A case study from central Italy. J. Atmos. Chem. 2005, 52, 221–230. [Google Scholar] [CrossRef]
  28. Loppi, S.; Giordani, P.; Brunialti, G.; Isocrono, D.; Piervittori, R. A new scale for the interpretation of lichen biodiversity values in the Thyrrenian side of Italy. Bibl. Lichenol. 2002, 82, 235–242. [Google Scholar]
  29. Baffi, C.; Bettinelli, M.; Beone, G.M.; Spezia, S. Comparison of different analytical procedures in the determination of trace elements in lichens. Chemosphere 2002, 48, 299–306. [Google Scholar] [CrossRef]
  30. Yafa, C.; Farmer, J.G. A comparative study of acid-extractable and total digestion methods for the determination of inorganic elements in peat material by inductively coupled plasma-optical emission spectrometry. Anal. Chim. Acta 2006, 557, 296–303. [Google Scholar] [CrossRef]
  31. Tam, N.F.Y.; Yao, M.W.Y. Three digestion methods to determine concentrations of Cu, Zn, Cd, Ni, Pb, Cr, Mn, and Fe in mangrove sediments from Sai Keng, Chek Keng, and Sha Tau Kok, Hong Kong. Bull. Environ. Contam. Toxicol. 1999, 62, 708–716. [Google Scholar] [CrossRef]
  32. Fortuna, L.; Tretiach, M. Effects of site-specific climatic conditions on the radial growth of the lichen biomonitor Xanthoria parietina. Environ. Sci. Pollut. Res. 2018, 25, 34017–34026. [Google Scholar] [CrossRef] [PubMed]
  33. Gaudet, C.L.; Bright, D.; Adare, K.; Potter, K. A rank-based approach to deriving Canadian soil and sediment: Quality guidelines. In Species Sensitivity Distributions in Ecotoxicology, 1st ed.; Posthuma, L., Suter, G.W., II, Traas, T.P., Eds.; CRC Press: Boca Raton, FL, USA, 2001; pp. 255–273. [Google Scholar]
  34. Reimann, C.; Garrett, R.G. Geochemical background—Concept and reality. Sci. Total Environ. 2005, 350, 12–27. [Google Scholar] [CrossRef] [PubMed]
  35. Facchinelli, A.; Sacchi, E.; Mallen, L. Multivariate statistical and GIS-based approach to identify heavy metal sources in soils. Environ. Pollut. 2001, 114, 313–324. [Google Scholar] [CrossRef]
  36. Massas, I.; Ehliotis, C.; Gerontidis, S.; Sarris, E. Elevated heavy metal concentrations in top soils of an Aegean island town (Greece): Total and available forms, origin and distribution. Environ. Monit. Assess. 2009, 151, 105–116. [Google Scholar] [CrossRef]
  37. Yang, C.L.; Wu, Z.F.; Zhang, H.H.; Guo, R.P.; Wu, Y.Q. Risk assessment and distribution of soil Pb in Guandong, China. Environ. Monit. Assess. 2009, 159, 381–391. [Google Scholar] [CrossRef]
  38. Reimann, C.; de Caritat, P. Establishing geochemical background variation and threshold values for 59 elements in Australian surface soil. Sci. Total Environ. 2017, 578, 633–648. [Google Scholar] [CrossRef] [Green Version]
  39. Hoaglin, D.C.; Iglewicz, B.; Tukey, J.W. Performance of some resistant rules for outlier labeling. J. Am. Stat. Assoc. 1986, 81, 991–999. [Google Scholar] [CrossRef]
  40. Cicchitelli, G.; Herzel, A.; Montanari, G.E. Il Campionamento Statistico, 2nd ed.; Il Mulino: Bologna, Italy, 1992. [Google Scholar]
  41. ARPA FVG. Available online: http://www.arpa.fvg.it/cms/hp/news/Studio-licheni-centrale-a2a.html (accessed on 19 February 2019).
  42. Fortuna, L. Development of Biomonitoring Techniques of Persistent Airborne Pollutants Using Native Lichens. Ph.D. Thesis, University of Trieste, Trieste, Italy, 27 March 2018. [Google Scholar]
  43. EU Directive 2008/50/EC. Available online: https://eur-lex.europa.eu/legal-content/EN/TXT/PDF/?uri=CELEX: 32008L0050&from=en (accessed on 19 February 2019).
  44. IARC. 2018. Available online: https://monographs.iarc.fr/wp-content/uploads/2018/06/mono100C-9.pdf (accessed on 19 February 2019).
  45. Tretiach, M.; Candotto Carniel, F.C.; Loppi, S.; Carniel, A.; Bortolussi, A.; Mazzilis, D.; Del Bianco, C. Lichen transplants as a suitable tool to identify mercury pollution from waste incinerators: A case study from NE Italy. Environ. Monit. Assess. 2011, 175, 589–600. [Google Scholar] [CrossRef] [PubMed]
  46. Nimis, P.L. The Lichens of Italy. A Second Annotated Catalogue; EUT: Trieste, Italy, 2016. [Google Scholar]
  47. Incerti, G.; Cecconi, E.; Capozzi, F.; Adamo, P.; Bargagli, R.; Benesperi, R.; Candotto Carniel, F.; Cristofolini, F.; Giordano, S.; Puntillo, D.; et al. Infraspecific variability in baseline element composition of the epiphytic lichen Pseudevernia furfuracea in remote areas: Implications for biomonitoring of air pollution. Environ. Sci. Pollut. Res. 2017, 24, 8004–8016. [Google Scholar] [CrossRef] [PubMed]
  48. Weltje, L.; Sumpter, J.P. What makes a concentration environmentally relevant? Critique and a proposal. Environ. Sci. Technol. 2017, 51, 11520–11521. [Google Scholar] [CrossRef] [PubMed]
  49. Wolterbeek, H.T.; Bode, P. Strategies in sampling and sample handling in the context of large-scale plant biomonitoring surveys of trace element air pollution. Sci. Total Environ. 1995, 176, 33–43. [Google Scholar] [CrossRef]
  50. Nieboer, E.; Richardson, D.H.S.; Tomassini, F.D. Mineral uptake and release by lichens: An overview. Bryologist 1978, 81, 226–246. [Google Scholar] [CrossRef]
  51. Nash, T.H., III. Nutrients, elemental accumulation, mineral cycling. In Lichen Biology, 2nd ed.; Nash, T.H., III, Ed.; Cambridge University Press: Cambridge, UK, 2008; pp. 236–253. [Google Scholar]
  52. Brown, D.H.; Beckett, R.P. Uptake and effect of cations on lichen metabolism. Lichenologist 1984, 16, 173–188. [Google Scholar] [CrossRef]
  53. Paoli, L.; Vannini, A.; Fačkovcová, Z.; Guarnieri, M.; Bačkor, M.; Loppi, S. One year of transplant: Is it enough for lichens to reflect the new atmospheric conditions? Ecol. Ind. 2018, 88, 495–502. [Google Scholar] [CrossRef]
  54. Mikhailova, I. Transplanted lichens for bioaccumulation studies. In Monitoring with Lichens—Monitoring Lichens; Nimis, P.L., Scheidegger, C., Wolseley, P.A., Eds.; Springer: Dordrecht, The Netherlands, 2002; pp. 301–304. [Google Scholar]
  55. Gailey, F.A.Y.; Lloyd, O.L. Methodological investigations into low technology monitoring of atmospheric metal pollution: Part 2—The effects of length of exposure on metal concentrations. Environ. Pollut. B 1986, 12, 61–74. [Google Scholar] [CrossRef]
  56. Bargagli, R.; Mikhailova, I. Accumulation of inorganic contaminants. In Monitoring with Lichens—Monitoring Lichens; Nimis, P.L., Scheidegger, C., Wolseley, P.A., Eds.; Springer: Dordrecht, The Netherlands, 2002; pp. 65–84. [Google Scholar]
  57. Zhang, J.; Zhao, Y.; Ding, F.; Zeng, H.; Zheng, C. Preliminary study of trace element emissions and control during coal combustion. Front. Energ. Power Eng. China 2007, 1, 273–279. [Google Scholar] [CrossRef]
  58. Wang, C.; Liu, H.; Zhang, Y.; Zou, C.; Anthony, E.J. Review of arsenic behavior during coal combustion: Volatilization, transformation, emission and removal technologies. Prog. Energy Comb. Sci. 2018, 68, 1–28. [Google Scholar] [CrossRef]
  59. ARIANET. Available online: http://www.a2aenergiefuture.eu/gruppo/export/sites/default/ene/impianti/documenti_impianti/ARIANET-R2014.23-MONFALCONE.pdf (accessed on 19 February 2019).
  60. Wilson, N.; Horrocks, J. Lessons from the removal of lead from gasoline for controlling other environmental pollutants: A case study from New Zealand. Environ. Health 2008, 7, 1. [Google Scholar] [CrossRef] [PubMed] [Green Version]
  61. Madsen, C.; Gehring, U.; Håberg, S.E.; Nafstad, P.; Meliefste, K.; Nystad, W.; Lødrup Carlsen, K.C.; Brunekreef, B. Comparison of land-use regression models for predicting spatial NOx contrasts over a three year period in Oslo, Norway. Atmos. Environ. 2011, 45, 3576–3583. [Google Scholar] [CrossRef]
  62. Kollanus, V.; Tiittanen, P.; Niemi, J.V.; Lanki, T. Effects of long-range transported air pollution from vegetation fires on daily mortality and hospital admissions in the Helsinki metropolitan area, Finland. Environ. Res. 2016, 151, 351–358. [Google Scholar] [CrossRef] [PubMed] [Green Version]
  63. Gotelli, N.J.; Ellison, A.M. A Primer of Ecological Statistics, 2nd ed.; Sinauer Associates: Sunderland, MA, USA, 2012. [Google Scholar]
Figure 1. B ratio data distribution with indication of data counts per interval, skewness and kurtosis, and percentile values corresponding to the thresholds defining five bioaccumulation classes (the B ratio axis ends at the first ‘zero’ count).
Atmosphere 10 00136 g001
Figure 2. EU ratio data distribution with indication of data counts per interval, skewness and kurtosis, and percentile values corresponding to the thresholds defining five bioaccumulation classes. Data are separately reported for different transplant exposure time spans (from the top to the bottom: 4, 8, and 12 weeks).
Atmosphere 10 00136 g002
Figure 3. Cartographic representation of sampling sites and corresponding classes of the naturality/alteration scale [16] (here, “previous scales”) and bioaccumulation scale (Table 4; here, “new scale”), with indication of percentile thresholds (%ile), corresponding element concentration values (left), and B ratios (right). Sampling sites are identified by alphanumeric codes (as also reported in Table S5) followed by the letter F or X for Flavoparmelia caperata and Xanthoria parietina, respectively.
Atmosphere 10 00136 g003
Figure 4. Cartographic representation of Pseudevernia furfuracea transplant sites, corresponding classes of the accumulation/loss scale [27] (here, “previous scale”) and the bioaccumulation scale (Table 5; here, “new scale”), with indication of EC ratios (Table 1) for the former, percentile thresholds (%ile), and EU ratios for the latter. Transplant sites are identified by alphanumeric codes (as also reported in Table S6).
Atmosphere 10 00136 g004
Table 1. Glossary of main terms and concepts.
Glossary
Native lichensLichens grown in a target study area.
Background element concentration values (BECs)Species-specific element concentration values measured in lichen samples reflecting proximate-natural, unaltered conditions.
Bioaccumulation ratio (B ratio)The dimensionless ratio between species-specific element concentration values measured in native samples and the corresponding background values.
Lichen transplantsLichens collected in a proximate-natural site and afterwards transplanted for a certain exposure time span to a target study area.
Exposed samplesIn the context of lichen transplants, samples transplanted to a target study area, exposed to pollutant depositions for a certain exposure time span, and then subjected to the determination of elemental concentration.
Unexposed samplesIn the context of lichen transplants, samples collected in a proximate-natural site and subjected to the determination of elemental concentration. These samples are used as a benchmark to assess the magnitude of lichen bioaccumulation after transplantation.
Exposed-to-unexposed ratio (EU ratio)The dimensionless ratio between species-specific element concentration values measured in exposed samples and the corresponding element concentration values measured in unexposed samples.
Exposed-to-control ratio (EC ratio)Previous name of the EU ratio [27], here terminologically revised.
Table 2. Descriptive statistics of element concentration values included in dataset N for the lichen species Flavoparmelia caperata and Xanthoria parietina. Statistics refer to the data counts (n), mean and median values (Mean, Med), minima and maxima (Range), interquartile range (IQR), skewness (S), and kurtosis (K). Mean and median values, minima and maxima, as well as interquartile ranges are expressed in µg g−1 dry weight (DW) (n.a., data not available).
ElementFlavoparmelia caperataXanthoria parietina
nMeanMedRangeIQRSKnMeanMedRangeIQRSK
Al244551348110–4224252–5263.2411.6368656605150–3408371–7223.5816.28
As3670.340.250.06–1.900.18–0.402.639.08790.350.280.06–2.310.15–0.403.4114.59
Cd2980.300.250.06–1.690.18–0.372.6213.68800.150.090.04–1.460.07–0.154.7327.97
Cr3212.441.840.35–24.941.17–2.664.8033.16772.391.910.69–10.521.61–2.732.8210.87
Cu3218.587.382.50–78.296.23–9.346.9967.44985.835.483.20–19.274.45–6.313.1713.29
Hg1820.090.080.01–0.430.06–0.111.918.97770.060.050.01–0.630.04–0.075.5537.18
Ni2963.142.670.32–19.011.27–4.032.619.42513.392.660.82–11.21.55–4.681.452.68
Pb3216.04.00.8–114.22.40–6.307.2469.56982.371.640.36–15.401.00–2.673.0311.78
Ti18441.826.40.3–309.019.4–40.72.809.214259.848.915.2–262.037.2–60.03.0010.57
V1501.710.940.34–13.220.75–1.602.8710.67 n.a.n.a.n.a.n.a.n.a.n.a.
Zn32147.344.017.7–330.835.3–53.06.1765.089830.025.613.0–168.021.2–34.44.8833.51
Table 3. Review-based BECs (μg g−1 DW) for the epiphytic lichen species Flavoparmelia caperata and Xanthoria parietina in Italy. Descriptive statistics refer to the data counts (n), mean and associated standard deviation (Mean ± SD), and median and median absolute deviation (Med ± MAD) for 11 (F. caperata) and 10 elements (X. parietina) included in the BEC dataset (Section 2.2). Results of statistical testing (Mann–Whitney U test for independent samples) for differences between median element concentration in the two species are also reported. Significant p-values are highlighted in italic (n.a., data not available).
ElementFlavoparmelia caperataXanthoria parietinaMann–Whitney
U Test
BECBEC DatasetBECBEC Dataset
nMean ± SDMed ± MADnMean ± SDMed ± MADUZp-Value
Al25361201 ± 37209 ± 2637217295 ± 59300 ± 3487.5−5.2151.8 × 10−7
As0.18910.14 ± 0.030.15 ± 0.020.15190.11 ± 0.020.11 ± 0.01 329.04.2382.3 × 10−5
Cd0.18680.14 ± 0.030.13 ± 0.020.07190.05 ± 0.010.05 ± 0.01 13.06.5057.8 × 10−11
Cr1.17800.85 ± 0.240.90 ± 0.201.61191.20 ± 0.281.10 ± 0.20 293.0−4.1493.3 × 10−5
Cu6.2805.2 ± 0.95.5 ± 0.54.5254.1 ± 0.34.1 ± 0.2 221.05.8594.7 × 10−9
Hg0.057450.031 ± 0.0210.038 ± 0.0190.035180.019 ± 0.0090.021 ± 0.008 328.01.3080.191
Ni1.27730.91 ± 0.200.93 ± 0.171.64131.28 ± 0.221.33 ± 0.16 108.5−4.4081.0 × 10−5
Pb2.37801.71 ± 0.451.82 ± 0.481.00240.67 ± 0.210.70 ± 0.21 21.07.2434.4 × 10−13
Ti19.54612.8 ± 5.814.8 ± 4.337.31129.3 ± 7.331.6 ± 4.2 22.5−4.6523.3 × 10−6
V0.75370.61 ± 0.110.62 ± 0.07n.a.n.a.n.a.n.a.n.a.n.a.n.a.
Zn35.38029.6 ± 4.330.1 ± 3.221.32517.9 ± 2.619.0 ± 1.9 30.07.2963.0 × 10−13
Table 4. B ratio, percentile-based, five-class interpretative scale for bioaccumulation data from native lichens. Class codes, description and abbreviations, percentile thresholds, corresponding B ratio values, RGB and HTML color codes associated to bioaccumulation classes are reported.
Bioaccumulation ClassPercentile ThresholdsB RatioColor Code
IDDescription (Abbreviation)RGBHTML
1Absence of bioaccumulation(A)≤25th≤1.0 00255#0000FF
2Low bioaccumulation(L)(25th, 75th](1.0, 2.1]01280#008000
3Moderate bioaccumulation(M)(75th, 90th](2.1, 3.4]25524315#FFF30F
4High bioaccumulation(H)(90th, 95th](3.4, 4.9]25500#FF0000
5Severe bioaccumulation(S)>95th>4.9128064#800040
Table 5. EU ratio, percentile-based, five-class interpretative scale for bioaccumulation data from lichen transplants. Class codes, description and abbreviations, percentile thresholds, corresponding EU ratio values for different exposure time spans, and color codes (RGB and HTML) associated with bioaccumulation classes are reported.
Bioaccumulation ClassPercentile ThresholdsEU RatioColor Code
IDDescription (Abbreviation)4 Weeks8 Weeks12 WeeksRGBHTML
1Absence of bioaccumulation(A)≤25th *≤1.0≤1.0≤1.000255#0000FF
2Low bioaccumulation(L)(25th, 75th](1.0, 1.8](1.0, 1.9](1.0, 1.8]01280#008000
3Moderate bioaccumulation (M)(75th, 90th](1.8, 2.5](1.9, 2.7](1.8, 3.1]25524315#FFF30F
4High bioaccumulation(H)(90th, 95th](2.5, 2.8](2.7, 3.5](3.1, 3.7]25500#FF0000
5Severe bioaccumulation(S)>95th>2.8>3.5>3.7128064#800040
* The EU ratio values corresponding to 25th percentile threshold (upper/lower threshold of Class 1/2) are actually equal to 1.1, 1.0 and 0.9 for exposure time spans of 4, 8 and 12 weeks, respectively (see text for explanation).