Article

A Short Note on the Potential of Utilization of Spectral AERONET-Derived Depolarization Ratios for Aerosol Classification

1
Research Institute for Radiation-Satellite, Gangneung-Wonju National University, Gangneung 25457, Korea
2
School of Physics, Astronomy and Mathematics, University of Hertfordshire, Hatfield AL10 9AB, UK
*
Author to whom correspondence should be addressed.
Atmosphere 2019, 10(3), 143; https://doi.org/10.3390/atmos10030143
Submission received: 8 February 2019 / Revised: 9 March 2019 / Accepted: 12 March 2019 / Published: 16 March 2019
(This article belongs to the Special Issue Remote Sensing of Aerosols)

Abstract

:
We herein present the spectral linear particle depolarization ratios (δp) from an Aerosol Robotics NETwork (AERONET) sun/sky radiometer with respect to the aerosol type. AERONET observation sites, which are representative of each aerosol type, were selected for our study. The observation data were filtered using the Ångström exponent (Å), fine-mode fraction (FMF) and single scattering albedo (ω) to ensure that the obtained values of δp were representative of each aerosol condition. We report the spectral δp values provided in the recently released AERONET version 3 inversion product for observation of the following aerosol types: dust, polluted dust, smoke, non-absorbing, moderately-absorbing and high-absorbing pollution. The AERONET-derived δp values were generally within the range of the δp values measured from lidar observations for each aerosol type. In addition, it was found that the spectral variation of δp differed according to the aerosol type. From the obtained results, we concluded that our findings provide potential insight into the identification and classification of aerosol types using remote sensing techniques.

1. Introduction

Atmospheric aerosols influence Earth’s energy budget by scattering and absorbing radiation (direct effects) and altering cloud processes (indirect effects) [1]. The impact of atmospheric aerosols on climate is quantified in terms of the aerosol radiative forcing. Different atmospheric aerosols or atmospheric aerosol mixtures lead to different aerosol radiative forcing [1]. To accurately quantify the impact of aerosol radiative forcing on regional and global climate, atmospheric aerosols need to be properly classified [1,2,3]. Accurate classification of atmospheric aerosol types would markedly improve the accuracy of aerosol radiative forcing in numerical models and is thus of high importance to climate modelling [4,5].
Atmospheric aerosols are difficult to characterize or classify both spatially and temporally due to their life cycle and geographically diverse sources. Moreover, variations in aerosol properties, including composition, shape and size, further compound the problem [5,6]. Remote sensing techniques are useful for quantifying the characteristics of atmospheric aerosols. To date, observations from integrated remote sensing techniques, including sun/sky radiometer, light detection and ranging (LIDAR) and satellite techniques have been used to classify aerosol types worldwide [5,7,8,9,10,11,12,13,14].
Various aerosol parameters, including optical and microphysical properties, have been used to distinguish aerosol types. For instance, the spectral dependence of aerosol optical depth (AOD) with respect to wavelength (i.e., Ångström exponent, Å) is commonly used in aerosol remote sensing to infer particle size. Higher values of Å (>1) typically represent the accumulation mode of particles from sources such as fresh biomass burning, while low values of Å (close to or less than 0) generally represent coarse particles such as dust [5,10,15,16]. When using the absorption properties of atmospheric aerosols, single scattering albedo (ω) can be used to infer the aerosol types. For example, aerosols with high values of ω (>0.95) absorb little light, whereas those with low values of ω (<0.88) absorb more light [17]. Furthermore, the derivative of the ω or the spectral difference of ω may provide information about the particle type with respect to size and growth. For example, dust particles exhibit strong light absorption at short wavelengths (e.g., 440 nm) and lower light absorption as the wavelength increases [18]. Fine-mode or hygroscopic particles have neutral ω spectral dependence and lower light absorption properties. Black carbon (BC) particles have the strongest light absorption properties at near-infrared wavelengths [19,20]. Spectral lidar ratios have also been implemented to determine the aerosol types in various applications [15].
The linear particle depolarization ratio (δp) can be used to identify the shape of particles. High δp values (0.3~0.35) indicate non-spherical particles such as dust particles, while low δp values indicate the presence of spherical particles such as biomass smoke or anthropogenic particles [21,22,23]. Recent studies have suggested a relationship utilizing the wavelength dependence of δp to determine the dominant aerosol type from lidar measurements at triple wavelengths (355, 532 and 1020 nm) [21,24,25]. The spectral dependence of δp for dust particles differs according to the dust origin and age. Values of δp increase with wavelength for dust particles, whereas δp values peak (0.30) at 532 nm and lower values of δp were found at other wavelengths (0.25 at 355 nm and 0.23 at 1064 nm) [21,24,25]. However, δp measurements with lidar observations at triple wavelengths are rare, limiting the availability of long-term data to accurately describe the spectral dependence of δp. Moreover, the spectral dependence of δp with respect to the aerosol types (e.g., urban/industrial, smoke aerosols) has not been ascertained to date.
The Aerosol Robotics NETwork (AERONET) is an automatic sun-tracking sun/sky radiometer observation network which could be a good alternative method to obtain spectral δp. AERONET collects and stores data obtained by sun/sky radiometers at more than 800 observation sites worldwide. Data obtained by individual radiometers were sent to the NASA Goddard Space Flight Centre (GSFC) to retrieve aerosol optical/microphysical properties using the AERONET algorithm [26,27]. Globally, distributed observations of spectrally resolved optical/microphysical properties of atmospheric aerosols such as Å, complex refractive index (n ± ik), ω and size distribution are downloadable from the AERONET database (http://aeronet.gsfc.nasa.gov/). Currently, AERONET version 3 includes spectral lidar ratios and δp (440, 675, 870 and 1020 nm) as standard inversion output.
In this study, we report on values of δp obtained from AERONET observation sites selected as representative of an aerosol type (dust, mixed dust, smoke and urban) based on previous literature. We discuss the spectral dependency of δp with respect to the dominant aerosol type and evaluate the spectral δp and size relationship according to aerosol type. Section 2 describes the methods used in this study, Section 3 includes results and discussion and a summary of findings is presented in Section 4.

2. Methodology

2.1. Theoretical Background

Polarization lidars can measure the δp value from the particle backscatter coefficient ( β λ p ) at depolarization channels as indicated in Equation (1):
δ λ = β λ p , β λ p ,
In this case, measurement of the return signal in the plane of polarization perpendicular to that of the emitted polarized laser light and careful calibration of the measurement of the lidar receiver are required [28].
As mentioned above, the AERONET sun/sky radiometer measures direct solar radiation and sky radiation. The measured data are automatically analyzed using the AERONET inversion algorithm [29]. The retrieved aerosol products are available from the AERONET data base (http://aeronet.gsfc.gov/). The kernel look-up tables introduced by [29] allow us to infer δp from the AERONET inversion products. In addition, [30] reported that AERONET retrieved δp value shows high correlation with δp measured by lidar measurement. The currently released version 3 of the AERONET retrieval added spectral δp to the list of standard inversion products, along with the complex refractive index, particle size distribution and single scattering albedo (ω). For each observation, the element F11(λ) and F22(λ) of the Müller scattering matrix [31] are computed from the particle size distribution and the refractive index that have been inferred from the AERONET inversion product. The element F11(λ) is proportional to the flux of scattered light in case of unpolarized incident light, while F22(λ) strongly depends on the angular and spectral distribution of the radiative intensity [31] as measured with AERONET sun/sky radiometer [29]. From the element F11(λ) and F22(λ) at the scattering angle of 180°, δ p can be computed as:
δ λ p = 1 F 22 ( λ , 180 ° ) / F 11 ( λ , 180 ° ) 1 + F 22 ( λ , 180 ° ) / F 11 ( λ , 180 ° ) .

2.2. AERONET Data Collection

AERONET Version 3 Level 2.0 aerosol inversion products were used in this study. The AERONET is a global network of ground-based CIMEL sun/sky radiometers (CIMEL, Paris, France) that directly measure solar and sky radiation. Observations are sent to the GSFC (Goddard Space Flight Center, Greenbelt, MD, U.S.A) for aerosol retrieval using the AERONET inversion algorithm [29]. AERONET inversion products include columnar comprehensive aerosol optical/microphysical properties (AOD, volume size distribution, complex index of refraction and single scattering albedo at 440, 675, 870 and 1020 nm) [26]. The recently released Version 3 of AERONET inversion products include spectral lidar ratios and particle linear depolarization ratios at 440, 675, 870 and 1020 nm.
In this study, fourteen AERONET sites were selected for analysis based on the availability of an extensive data record and their geographic distribution among representative aerosol source regions (Figure 1). The observation sites were selected as representative source regions for dust, smoke and urban/industrial mixed aerosol particles: (1) Dust, (2) Smoke and (3) Urban/industrial mixed on the basis of previous studies (Table 1). Other aerosol types, such as maritime aerosols, are not considered in this study due to their low aerosol loading conditions that are insufficient to meet the threshold for AERONET inversion retrieval [29,32]. The AERONET provides level 2.0 inversion product only for observations with an AOD > 0.4 at 440 nm [29].

2.3. Data Filtering

Filtering of the available AERONET version 3 level 2.0 inversion products for the selected sites was necessary to ensure that the obtained values of δp were representative of each aerosol type. Figure 2 shows scatter plots of Å versus the fine-mode fraction (FMF) for the AERONET sites that reflect the source regions dominated by dust, smoke and urban/industrial mixed particles. Å were a widely used parameter to describe the wavelength dependence of AOD to obtain basic information on aerosol size distribution [8]. High values of Å (>2) are typically considered to be fine particles related to the combustion of fresh biomass, whereas lower values (close to or less than zero) indicate the presence of coarse particles such as dust [10,33]. We employed the values of Å obtained from the wavelength dependence of AOD at 440 nm and 870 nm (Å440-870) for data filtering. Dust and anthropogenic particles can also be distinguished by their particle size distribution [8]. For example, dust particles predominantly have a radius >1 μm (i.e., a lower FMF). Conversely, particles from combustion have a high FMF [29]. Figure 2 therefore shows the requirement to filter for each aerosol type even at sites considered to be representative AERONET sites for each aerosol source. The majority of observations at dust sites shows lower Å and lower FMF (e.g., FMF < 0.4 and Å < 0.4). These values are directly related to the contribution of dust particle. The particles which exhibit features of anthropogenic/biomass pollution or dusty mixture (higher Å and higher FMF) are also found in the distribution at the dust sites. This suggests that desert sites are remarkably affected by a considerable contribution from anthropogenic pollution or smoke particles [34]. Likewise, the observations at urban/industrial/mixed sites also show a broad distribution across all possible values (FMF: 0.15~0.99, Å: 0~1.97). The urban/industrial/mixed sites are also dominated by dust particles as well as dust mixed with pollution or pollution particles [10]. In addition, higher values of Å and FMF reflect the fact that smoke particles are frequently emitted at smoke sites. Although higher values of Å and FMF dominated at the smoke sites, filtering is still required.
To filter data that were not representative of the source aerosol, the FMF and Å values were employed. For dust sites, we only consider observations with an Å440-870 value <0.4 and an FMF of the total AOD <0.4 [8,35]. At smoke sites, two sets of filters are applied to eliminate non-smoke cases from the data (other types of aerosol were likely transported periodically to sites). This required Å to be >1.4 to remove potential cases dominated by other aerosol types such as mineral dust or mixed conditions with the exception of the boreal sites (i.e., Bonanza Creek, Moscow, Tomsk and Yakutsk, Å > 1.0) [9]. The data are also restricted to the main burning season for smoke sites where this is well defined by a previous study [9]. For urban/industrial/mixed sites, we used FMF to distinguish the dusty mixed particles and pollution particles (mixed: 0.4 < FMF < 0.6, pollution: FMF > 0.6) [35]. In addition, we defined the pollution particles into non-absorbing (NA), moderately-absorbing (MA) and high-absorbing (HA) particles according to their ω values. [35] suggested an aerosol classification algorithm based on the FMF and ω. (NA: ω > 0.95, MA: 0.95 > ω > 0.85), HA: 0.85 > ω).
The number of cases for which the availability of AERONET Level 2.0 inversion products allows for a retrieval of optical/microphysical properties for each aerosol type was initially 7899, 1873 and 5753 for dust, smoke and urban/industrial mixed sties, respectively. In consideration of representative aerosol cases, the number of cases decreased to 5894, 1646 and 5627 for dust, smoke and urban/industrial mixed aerosol sites, respectively. The corresponding values and the range of year for each site are summarized in Table 1.

3. Results and Discussion

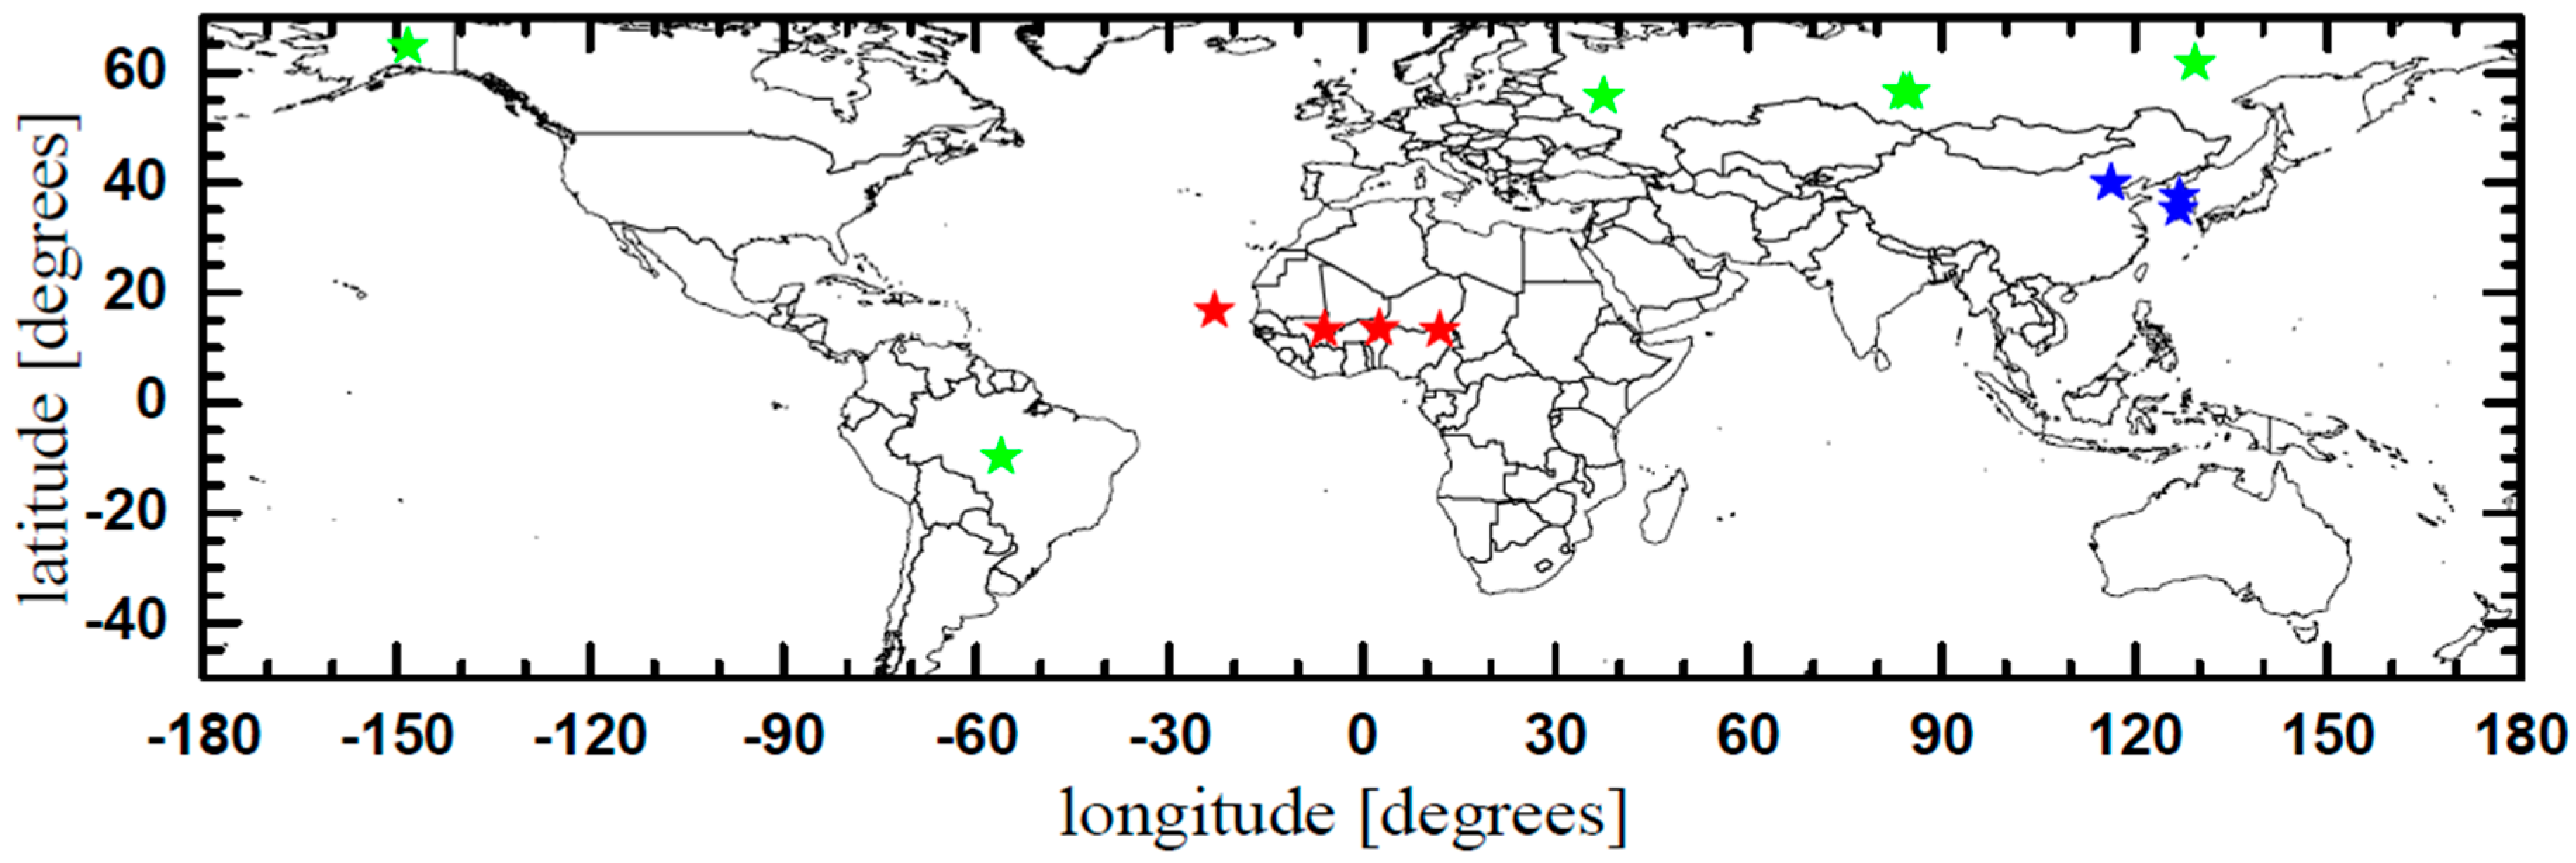
3.1. Characteristics of Aerosol Types at Selected Sites

To confirm whether each aerosol site reflected that well-known characteristics of each aerosol type, we investigated the optical and microphysical properties of each aerosol type. In addition, investigation on the characteristics of aerosol types at the urban/industrial sites, which were classified as mixed, NA, MA and HA, should provide a more detailed insight for classification of the δp value according to aerosol type. Figure 3 shows the spectral ω values at 440, 675, 870 and 1020 nm along with the particle size distributions obtained from the AERONET database for the sites of each aerosol type. The corresponding values are listed in Table 2.
As can be seen from Figure 3, the values of ω at each representative aerosol source region differ significantly. The values of ω for dust sites were similar to those of dust (0.96 at 550 nm and 0.94–0.98 at 440, 675, 870 and 1020 nm) as reported in previous studies [42,43]. The ω values for smoke have been previously reported as 0.90–0.95, 0.90–0.96, 0.90–0.97 and 0.89–0.97 at 440, 675, 870 and 1020 nm, respectively [9], which are similar to the measured ω values from the smoke sites investigated herein. In addition, the ω at 1020 nm of water soluble aerosols (e.g., sulfate) is close to unity [44], while that of black carbon (BC) was previously reported close to 0 (0.07 at 1020 nm) [45]. The values of ω for aerosol mixture (e.g., BC mixed with sulfate) vary depending on the mixing ratio (e.g., 0.91 at 1020 nm with 0.5 BC/sulfate mixing ratio for internal mixing) [46]. Furthermore, the obtained values of ω for NA, MA and HA particles could be considered to result from mixing of these aerosol particles. We note that NA particles would be defined as light scattering aerosols such as sulfate-dominant particles, whereas the HA particles are defined as BC-dominant particles that originated from urban/industrial regions. The value of ω for HA is significantly lower than that of smoke particles. BC that is coated with non-absorbing particle absorbs more strongly than the same amount of uncoated BC particle [47]. We therefore believed that BC particles in urban/industrial regions are more likely to exist in the mixed state with other aerosol than BC measured at the smoke sites. We initially considered that smoke particles and HA particles have similar values of ω values, as both consist mainly of light absorbing particles such as BC. However, the values of ω for smoke particles are significantly higher than the corresponding values of ω for HA particles and so this was considered to be the result of mixing with other aerosol. It should also be noted that spherical BC particles exhibit a similar absorption to BC aggregates, in addition to having double the scattering capacity [48]. Based on our results, smoke particle were considered to be BC or organic carbon (OC) particle, which could originate from biomass burning, whereas the HA particles were likely to be BC particles mixed with other aerosols.
The aerosol types at each aerosol site are more clearly distinguished according to the spectral ω behavior. In this context, dust particles that aggregated with varying combinations of clay, iron oxide and quartz exhibit strong light absorption in short wavelength regions, with lower absorption in the visible a near infrared wavelength regions [17]. In addition, fine mode particles and hygroscopic aerosol particles such as sulfate display an almost neutral ω spectral dependence and high light-scattering properties [19]. BC exhibits the strongest light-absorption properties in near-infrared wavelength regions, while brown carbon and OC exhibit stronger light-absorption characteristics in the ultraviolet and visible wavelength [20]. Furthermore, the variation in the spectral ω values for dust and mixed particles in this study behavior is similar to the wavelength dependence behavior of the dust particles. However, the values of ω for mixed particles are lower than corresponding value for dust particles at visible and near-infrared wavelength. It is considered that the ω of dust particles are altered by mixing with the pollutant particles. As dust and anthropogenic particles tend to be transported in difference source and typically exist as a mixture over East Asia [10,40], the particles classified as mixed aerosol at the urban/industrial/mixed sites should be defined as polluted dust following filtration of the dust and pollutant particle. Moreover, the values of ω for smoke particles tend to decrease as wavelength increases. Although it is thought that aerosol types classified as smoke may also include BC, it is important to note that variations in the BC concentration and other aerosols such as brown carbon or OC could produce an ambiguous ω wavelength dependence. We also note that the spectral ω for NA tends to be nearly neutral but with a higher value of ω. It is thought that the aerosol classified as NA mostly consists of fine-mode and hygroscopic aerosol particles (e.g., sulfate). The ω values for HA particles decrease upon increasing the wavelength, which is similar to the wavelength dependence of BC, however, in this case, the strongest light absorption was found at 440 nm.
The particle size distribution obtained from each aerosol source region also varies according to the aerosol type. Dust and mixed particles mostly consist of coarse-mode particle, while fine-mode particles predominate at smoke sites. These results lead to lower values of Å440–870 and FMF for the dust (0.18 ± 0.09 and 0.29 ± 0.06, respectively) and mixed particles (defined as polluted dust, 0.57 ± 0.10 and 0.52 ± 0.05, respectively). The higher values of Å and FMF at the smoke sites were found to be 0.17 ± 0.22 and 0.96 ± 0.04, respectively, as shown in Table 2. Lower values of Å (>0.4) reflect the characteristics of dust particles, while higher values of Å (smoke: 1.2–1.95; urban pollution: 0.75–1.2) were reported for smoke or urban pollutants in previous studies [9,38,39]. In addition, it should be noted that the NA particles consist mainly of fine-mode particles with a high FMF value (0.94 ± 0.04), with the HA particles having a significant contribution to the coarse-mode particles in terms of the total particle size distribution compared to the smoke particles. The Å440–870 and FMF values were found to be 1.25 ± 0.17 and 0.84 ± 0.07 for HA particles at the urban/industrial/mixed sites, respectively.

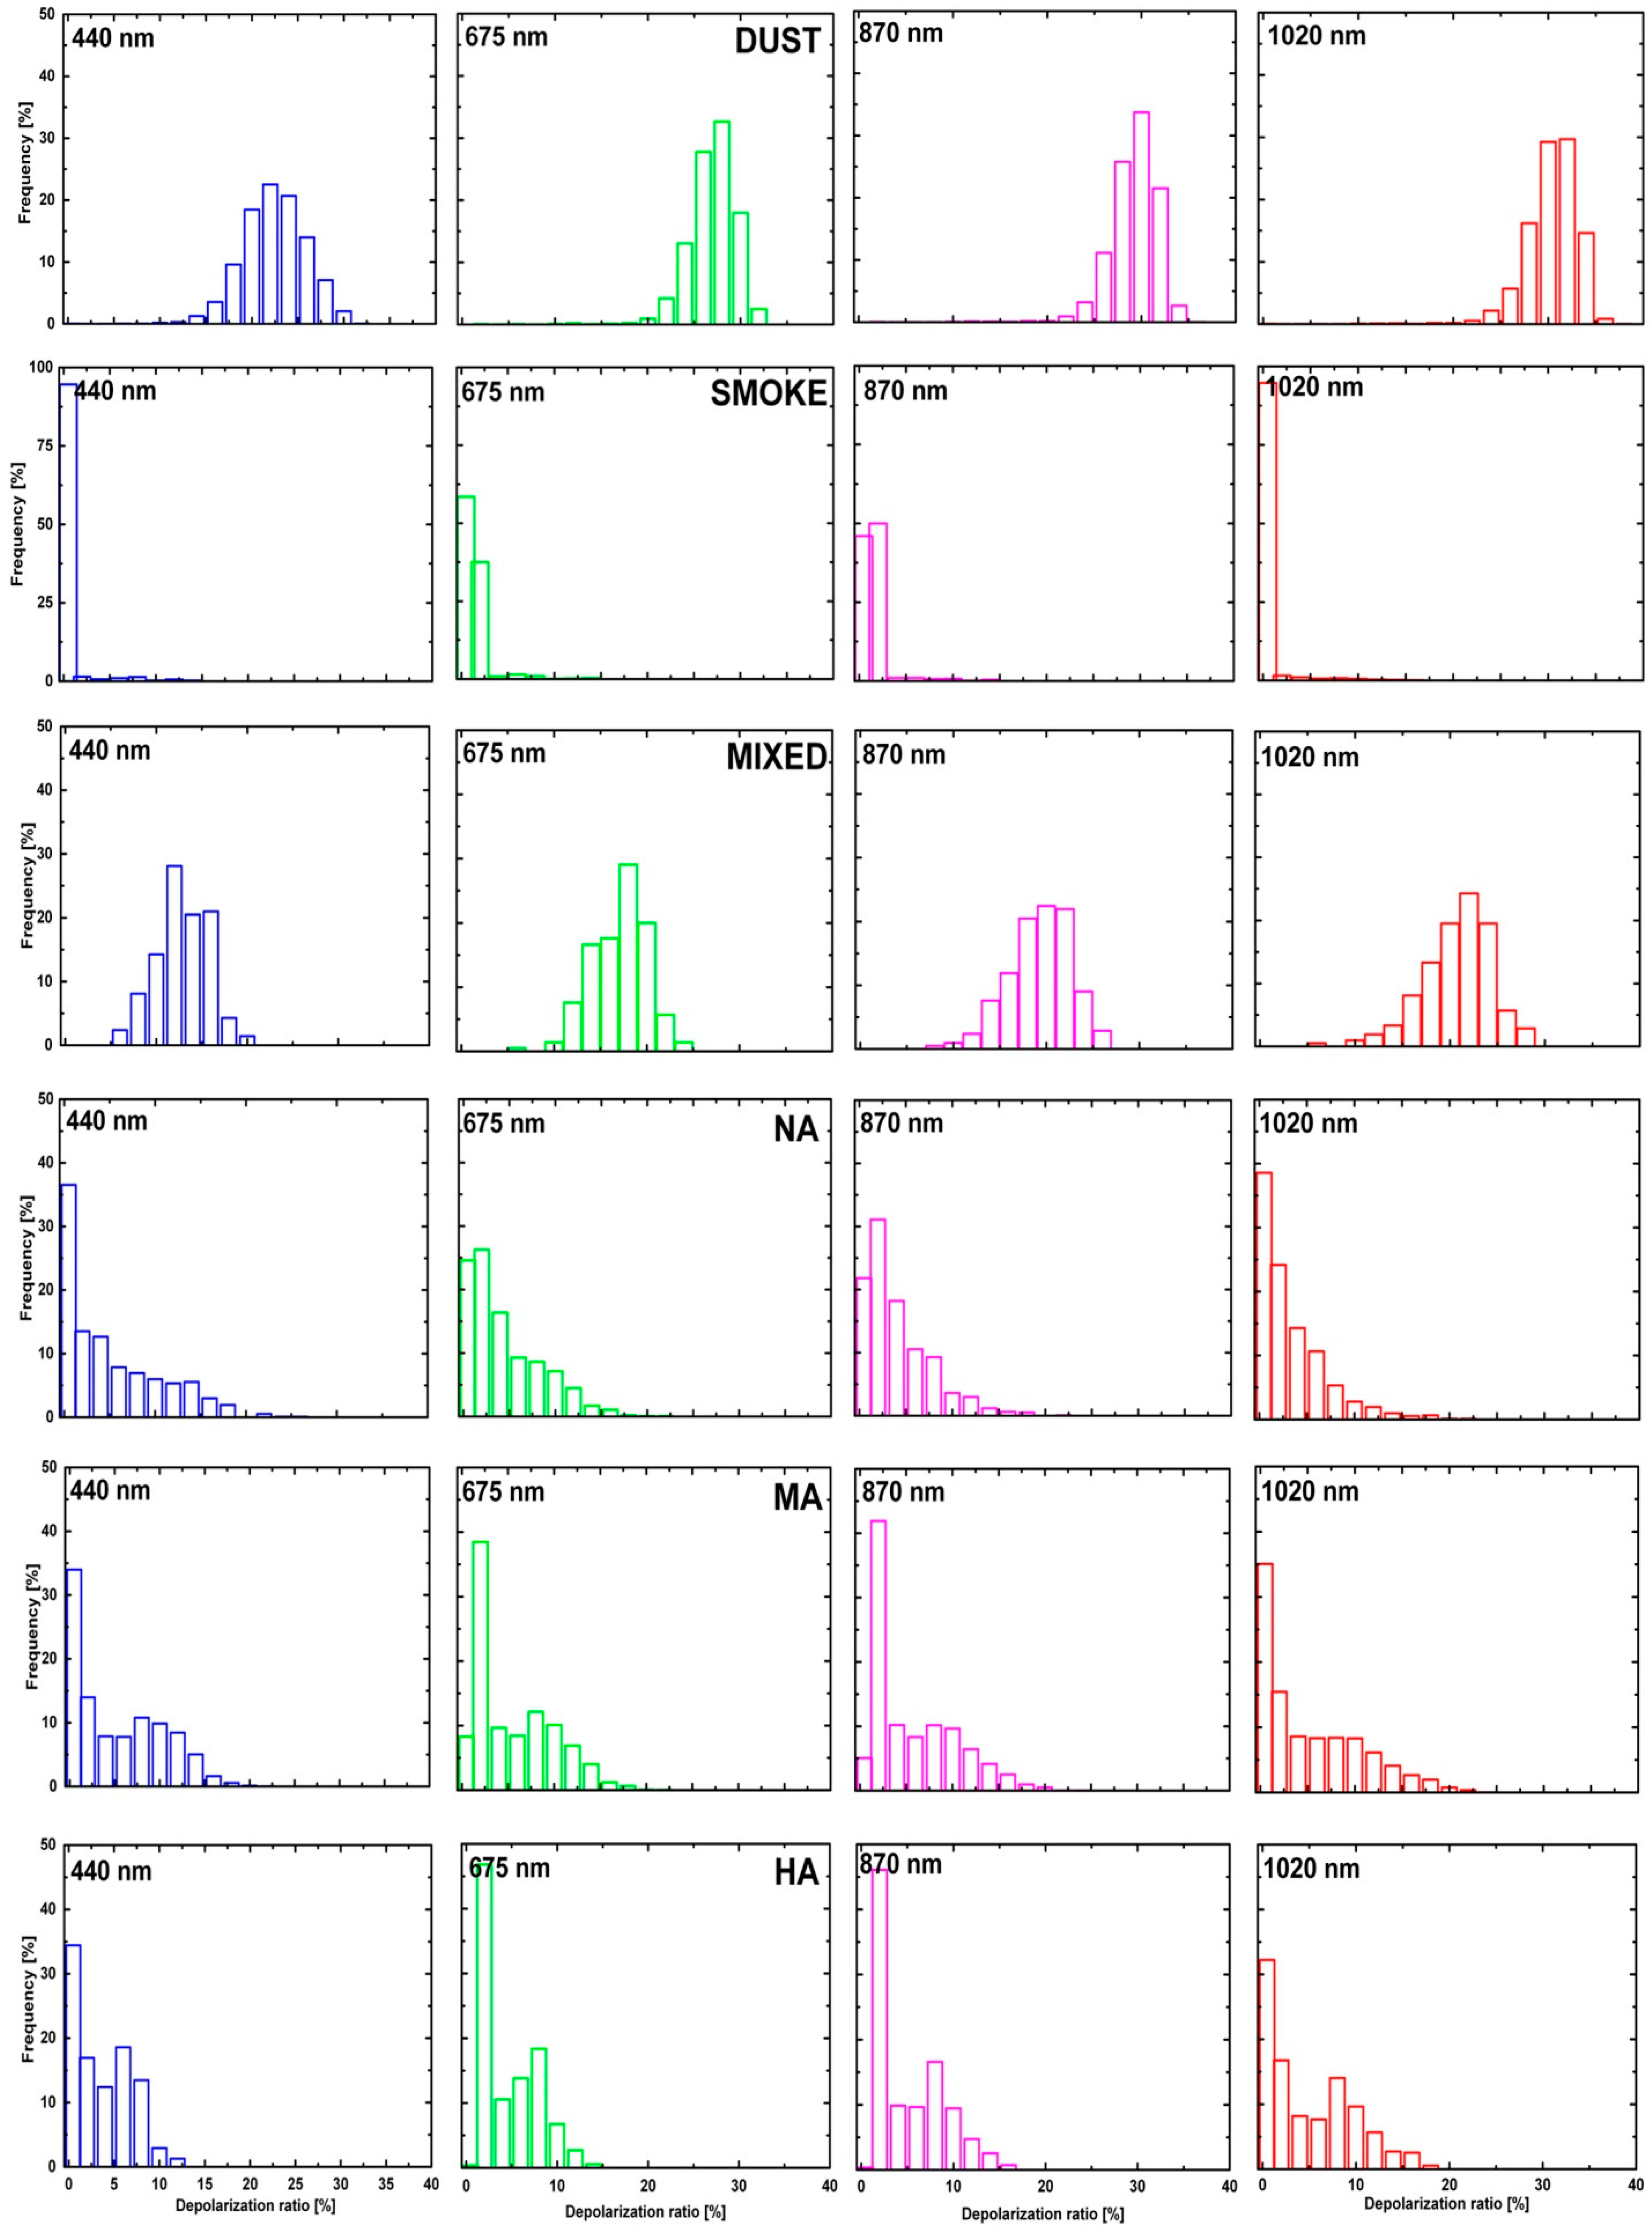
3.2. Statistics of the Depolarization Ratio

Figure 4 shows the frequency distribution of the AERONET-derived δp values with respect to the aerosol type and the corresponding values are summarized in Table 3. As indicated, the mean values of δp differ markedly with respect to the selected observation sites. More specifically, for the dust sites, the average δp values were 0.22 ± 0.04, 0.27 ± 0.03, 0.29 ± 0.03 and 0.30 ± 0.03 at 440, 675 and 870 and 1020 nm, respectively. A maximum value of 0.37 was obtained at 1020 nm in the desert sites. In addition, the mean value of δp for polluted dust particles was slightly lower than for pure dust particles, with mean values of 0.13 ± 0.03, 0.17 ± 0.03, 0.19 ± 0.03, 0.21 ± 0.04 at 440, 675, 870 and 1020 nm being obtained, respectively, for polluted dust particles in the urban/industrial/mixed sites. These δp values are similar to those of several field campaigns. For example, the Saharan Mineral Dust experiment 2006 (SAMUM 2006) reported a maximum δp value of ~0.33 at 532 nm for Saharan dust particles, while dust particles observed during SAMUM 2008 gave values of 0.27–0.35 at 532 nm. These were transported from Arabia (mainly Syria) across Cyprus [49,50]. Smaller values of δp indicate a mixture of dust with weakly depolarizing particles such as biomass burning smoke or particles of anthropogenic origin [10]. Furthermore, a previous report [13] found δp values of 0.13–0.20 at 532 nm for polluted dust particles using the High Spectral Resolution Lidar (HSRL) technique, while the δp values for polluted dust particles were found to be 0.10–0.20, that is, less than the corresponding values for pure dust particles due to mixing with particles of anthropogenic origin [51]. Likewise, the values of δp for polluted dust in this contribution are distinguishable from the δp values of pure dust.
In contrast, smoke particles and urban/industrial pollutant particles typically consist of spherical particles with lower δp values. More specifically, the mean values of δp were found to be 0.006 ± 0.015, 0.012 ± 0.012, 0.01 ± 0.01 and 0.005 ± 0.014 at 440, 675, 870 and 1020 nm, respectively for smoke sites. In terms of the literature values, it was reported [52] that compact spherical tropospheric smoke particles lead to almost no depolarization at 355, 532 and 1020 nm (<0.03) and so the obtained values of δp at the smoke sites appear to indicate the presence of spherical smoke particles. In addition, a value of 0.05 at 532 nm was previously used to separate smoke particles from a dust-smoke mixed plume [34]. Furthermore, the values of δp for coated soot aggregates were found to be 0.24, 0.09 and 0.02 at 355, 532 and 1064 nm, respectively [24], while values of 0.22, 0.18 and 0.04 at 355, 532 and 1064 nm, were reported for the dry irregularly shaped soot particles in the stratosphere [52]. Again, these considerations suggest that the smoke particles discussed herein are likely to be spherical in nature. Moreover, the mean values obtained for the pollution particles ranged from 0.03 to 0.06 regardless of the classification type, while a previous study [23] found that the δp value of urban aerosol particles was 0.03–0.07 at 532 nm. The values for individual aerosol types considered as urban pollution were also reported [53], that is, 0.04 ± 0.003 at 532 nm for ammonium sulfate crystals and 0.01 ± 0.001 for liquid droplets in the submicrometer range.

3.3. Spectral Dependency of Depolarization Ratio

The determination of aerosol particle types and in particular pollutant particles, appears to be limited by the absolute values of δp because the threshold of δp is broadened to distinguish between certain types of aerosol particles. Thus, to investigate whether the spectral dependence of δp could provide additional information regarding the aerosol type, we analyzed the wavelength dependence of δp according to the representative aerosol source, as shown Figure 5. We found that the wavelength dependence of δp differed significantly with respect to the selected observation sites and aerosol types. For dust and polluted dust particles, the maximum of the δp distribution decreased as the wavelength decreased. We also note that the spectral δp behavior of dust and polluted particles has been investigated previously with lidar observations [24,25]. The AERONET-derived δp values for the dust and polluted particles in our study were found to peak at 0.30 and 0.21 at 1020 nm and then decrease steadily to 0.22 and 0.13 at 440 nm, respectively. Similarly, for local North American dust, it was previously reported [24] that δp reached a peak value of 0.38 at 1064 nm and gave lower values of 0.37 and 0.24 at 532 and 355 nm, respectively. In addition, a similar pattern was reported [54] in the spectral variation of δp in the desert region, with a peak at 1064 nm and the lowest value at 440 nm (Saharan dust: 0.24 at 440 nm, 0.31 at 1020 nm). Furthermore, the first peak in the spectral depolarization ratio was found to shift to larger wavelengths as the particle size increases [54]. These spectral dependences of δp are considered as a feature of dust particles and so the obtained values of δp indicate that dust is composed of very large particles and as a result, peak values were obtained at 1064 nm, prior to decreasing with the wavelength.
In contrast, several lidar observations show that the spectral dependence of δp differs according to the origin and age of the observed dust plume. For example, a peak of 0.28 at 532 nm and lower values of 0.25 at 355 nm and 0.23 at 1064 nm were reported for aged Saharan dust [25], while a similar pattern was observed in the spectral variation of δp for aged and transported dust with a clear maximum of 0.30 at 532 nm and smaller δp values of 0.27 and 0.25 at 1064 and 355 nm, respectively [24]. It is possible that the large dust particles settled during transport for the aged and transported dust cases. However, the polluted dust particles in this contribution still contain significant amounts of large dust particles (i.e., coarse-mode particles, as shown in Figure 3). Accordingly, the wavelength dependency of δp for the polluted particles is similar to the dependency of δp for the dust particles.
The δp values for the smoke particles examined herein peaked as 0.012 at 675 nm with lower values of 0.006 at 440 nm and 0.005 at 1020 nm being observed. In a previous report [24], a peak value of 0.24 was obtained at 355 nm and this decreased to 0.09 and 0.02 at 532 and 1064 nm, respectively, for smoke particles considered to be coated soot aggregates. It was therefore concluded that the larger δp value at 355 nm compared to those observed at longer wavelengths may indicate a smaller size for the non-spherical particles than for dust particles. We note that the smoke particles examined herein are likely influenced by spherical BC or organic matter that should be distinguished as BC/other aerosol mixtures.
The values of δp for the NA particles peaked as 0.05 at 440 nm and decreased steadily to 0.03 at 1020 nm, whereas the MA particles exhibited a nearly neutral δp spectral dependence. In terms of the HA particles, the wavelength dependency appeared rather complex. More specifically, the values of δp for the HA particles peaked at 675 nm with lower values at 870 and 1020 nm in the majority of cases, thereby suggesting that the wavelength dependency of δp may provide more detailed information regarding the aerosol classification. In addition, the value of δp for the NA particles, which is considered to be a sulfate, decreased upon increasing the wavelength, with the maximum value at 440 nm being attributed to the fact that the NA particles mostly consist of fine-mode particles. Furthermore, the neutral wavelength dependency of δp for the MA particles could be explained by the broad particle size distribution, as various types of aerosols and aerosol mixtures could be determined as MA particles. Although HA particles could be considered to be BC aggregates, an explanation of the wavelength dependency of δp for the HA pollution particles is challenging. Indeed, we have insufficient information on whether BC aggregates consisted of internal and/or external mixtures. Moreover, the comparison of the wavelength dependency of δp for BC aggregates is limited and we expect that BC aggregates originating from difference sources (i.e., biomass burning, anthropogenic pollution) may influence the wavelength dependency of δp for BC/other aerosol mixtures.

4. Summary and Conclusions

We herein presented the spectral linear particle depolarization ratios (δp) obtained from Aerosol Robotics NETwork (AERONET) sun/sky radiometer observations with respect to the aerosol type. The recently released AERONET version 3 level 2.0 inversion product was employed to investigate the optical and microphysical properties of aerosols, including the spectral δp values. AERONET observation sites, considered to be representative of aerosol source regions for dust, smoke, urban/industrial mixed aerosols, were selected to investigate δp according to the aerosol type. To obtain data representative of each aerosol condition, observation data were filtered using the Ångström exponent (Å), fine-mode fraction (FMF) and single scattering albedo (ω). Moreover, polluted dust and the non-absorbing (NA), moderately-absorbing (MA) and high-absorbing (HA) pollution particles were classified according to their light-absorbing properties.
The AERONET-derived δp values were generally within the range of independent lidar observations for each aerosol type although they are provided at different wavelengths. We found that the spectral variation of the δp value differed markedly according to the aerosol type. More specifically, dust and polluted dust particles gave peak δp values at 1020 nm, which decreased upon decreasing the wavelength. We believe that the larger dust particles and the growth of particles due to the mixing of dust with other aerosols were responsible for this observed wavelength dependency for dust and polluted dust, respectively. Furthermore, the wavelength dependency of δp for smoke particles was attributed to the fact that the smoke particles were considered to be coated soot aggregates. The smoke sites selected in this study appeared to be mainly influenced by spherical black carbon and organic carbon. Moreover, the spectral δp values for NA particles decreased upon increasing the wavelength, whereas a neutral wavelength dependency was found in the case of the MA particles.
We also found that the depolarization ratio is a useful aerosol parameter for aerosol classification. More specifically, the δp values presented in this study could be used as reliable reference values to identify the contribution of each aerosol type in aerosol particle mixtures in future studies. Interest regarding the utilization of δp obtained at triple wavelengths to infer the size of particles and the aerosol types has recently increased in the lidar community. Consequently, the spectral wavelength dependency of the δp value requires a detailed discussion. Unfortunately, lidar observations with δp values obtained at triple wavelengths and investigations into the spectral δp values based on the aerosol type are rare due to limitations in the available lidar observations (i.e., a limited number of lidar stations and a limited specification of lidar systems). The AERONET sun/sky radiometer may therefore be a suitable alternative to obtaining details regarding the spectral wavelength dependency of δp. We therefore expect that our findings could provide additional insight into the aerosol classification/separation in remote sensing research. Ongoing research is focusing on collecting sufficient observations of depolarization ratios at multiple wavelengths. Eventually, we hope to establish a reasonable interpretation of the wavelength dependency of δp for aerosol classification.

Author Contributions

I.-S.Z. and S.-K.S. had the idea for this study. I.-S.Z. and S.-K.S. performed the data analysis and prepared the figures and tables. I.-S.Z. and S.-K.S. contributed to the discussion of the findings and the preparation of the manuscript.

Funding

This research was supported by the Basic Science Research Program through the National Research Foundation of Korea (NRF) funded by the Ministry of Education (grant number NRF-2017R1D1A3B03034467) and the International Research & Development Program of the National Research Foundation of Korea (NRF) funded by the Ministry of Science and ICT (grant number 2018K1A3A7A08089712).

Acknowledgments

We thank the principal investigators and their staff for establishing and maintaining the AERONET sites used in this investigation.

Conflicts of Interest

The authors declare no conflict of interest.

References

  1. Stocker, T.; Qin, D.; Plattner, G.; Tignor, M.; Allen, S.; Boschung, J.; Nauels, A.; Xia, Y.; Bex, V.; Midgley, P. IPCC, 2013: Climate Change 2013: The Physical Science Basis. Contribution of Working Group I to the Fifth Assessment Report of the Intergovernmental Panel on Climate Change; Cambridge University Press: Cambridge, UK, 2013. [Google Scholar]
  2. Kaskaoutis, D.; Kambezidis, H.D. The choice of the most appropriate aerosol model in a radiative transfer code. Sol. Energy 2008, 82, 1198–1208. [Google Scholar] [CrossRef]
  3. Kaskaoutis, D.; Kosmopoulos, P.; Kambezidis, H.D.; Nastos, P.T. Aerosol climatology and discrimination of different types over Athens, Greece, based on MODIST data. Atmos. Environ. 2007, 41, 7315–7329. [Google Scholar] [CrossRef]
  4. Satheesh, S.; Srinivasan, J. A method to estimate aerosol radiative forcing from spectral optical depths. J. Atmos. Sci. 2006, 63, 1082–1092. [Google Scholar] [CrossRef]
  5. Giles, D.M.; Holben, B.N.; Eck, T.F.; Sinyuk, A.; Smirnov, A.; Slutsker, I.; Dickerson, R.; Thompson, A.; Schafer, J. An analysis of AERONET aerosol absorption properties and classifications representative of aerosol source regions. J. Geohys. Res. Atmos. 2012, 117, D17203. [Google Scholar] [CrossRef]
  6. Kahn, R.A.; Gaitley, B.J.; Garay, M.J.; Diner, D.J.; Eck, T.F.; Smirnov, A.; Holben, B.N. Multiangle Imaging SpectroRadiometer global aerosol product assessment by comparison with the Aerosol Robotic Network. J. Geohys. Res. Atmos. 2010, 115, D23209. [Google Scholar] [CrossRef]
  7. Eck, T.; Holben, B.; Dubovik, O.; Smirnov, A.; Goloub, P.; Chen, H.; Chatenet, B.; Gomes, L.; Zhang, X.Y.; Tsay, S.C. Columnar aerosol optical properties at AERONET sites in central eastern Asia and aerosol transport to the tropical mid-Pacific. J. Geophys. Res. Atmos. 2005, 110, D06202. [Google Scholar] [CrossRef]
  8. Schuster, G.L.; Dubovik, O.; Holben, B.N. Angstrom exponent and bimodal aerosol size distributions. J. Geophys. Res. Atmos. 2006, 111, D07207. [Google Scholar] [CrossRef]
  9. Sayer, A.; Hsu, N.; Eck, T.; Smirnov, A.; Holben, B. AERONET-based models of smoke-dominated aerosol near source regions and transported over oceans, and implications for satellite retrievals of aerosol optical depth. Atmos. Chem. Phys. 2014, 14, 11493–11523. [Google Scholar] [CrossRef] [Green Version]
  10. Shin, S.K.; Müller, D.; Lee, C.; Lee, K.H.; Shin, D.; Kim, Y.J.; Noh, Y.M. Vertical variation of optical properties of mixed Asian dust/pollution plumes according to pathway of air mass transport over East Asia. Atmos. Chem. Phys. 2015, 15, 6707–6720. [Google Scholar] [CrossRef] [Green Version]
  11. Kim, M.; Kim, J.; Jeong, U.; Kim, W.; Hong, H.; Holben, B.; Eck, T.F.; Lim, J.H.; Song, C.K.; Lee, S. Aerosol optical properties derived from the DRAGON-NE Asia campaign, and implications for a single-channel algorithm to retrieve aerosol optical depth in spring from Meteorological Imager (MI) on-board the Communication, Ocean, and Meteorological Satellite (COMS). Atmos. Chem. Phys. 2016, 16, 1789–1808. [Google Scholar] [CrossRef] [Green Version]
  12. Kaskaoutis, D.G.; Sifakis, N.; Retalis, A.; Kambezidis, H.D. Aerosol monitoring over Athens using satellite and ground-based measurements. Adv. Meteorol. 2010, 2010, 147910. [Google Scholar] [CrossRef]
  13. Burton, S.; Ferrare, R.; Hostetler, C.; Hair, J.; Rogers, R.; Obland, M.; Butler, C.; Cook, A.; Harper, D.; Froyd, K. Aerosol classification using airborne High Spectral Resolution Lidar measurements-methodology and examples. Atmos. Meas. Technol. 2012, 5, 73–98. [Google Scholar] [CrossRef]
  14. Groß, S.; Essselborn, M.; Weinzierl, B.; Wirth, M.; Fix, A.; Petzold, A. Aerosol classification by airborne high spectral resolution lidar observations. Atmos. Chem. Phys. 2013, 13, 2487–2505. [Google Scholar] [CrossRef] [Green Version]
  15. Omar, A.H.; Won, J.G.; Winker, D.M.; Yoon, S.C.; Dubovik, O.; McCormick, M.P. Development of global aerosol models using cluster analysis of Aerosol Robotic Network (AERONET) measurements. J. Geophys. Res. Atmos. 2005, 110, D10S14. [Google Scholar] [CrossRef]
  16. Chen, W.-N.; Chen, Y.-W.; Chou, C.C.; Chang, S.-Y.; Lin, P.-H.; Chen, J.-P. Columnar optical properties of tropospheric aerosol by combined lidar and sunphotometer measurements at Taipei, Taiwan. Atmos. Environ. 2009, 43, 2700–2708. [Google Scholar] [CrossRef]
  17. Abel, S.J.; Haywood, J.M.; Highwood, E.J.; Li, J.; Buseck, P.R. Evolution of biomass burning aerosol properties from an agricultural fire in southern Africa. Geophys. Res. Lett. 2003, 30, 1785. [Google Scholar] [CrossRef]
  18. Sokolik, I.N.; Toon, O.B. Incorporation of mineralogical composition into models of the radiative properties of mineral aerosol from UV to IR wavelengths. J. Geophys. Res. Atmos. 1999, 104, 9423–9444. [Google Scholar] [CrossRef] [Green Version]
  19. Dubovik, O.; Holben, B.; Eck, T.F.; Smirnov, A.; Kaufman, Y.J.; King, M.D.; Tanré, D.; Slutsker, I. Variability of absorption and optical properties of key aerosol types observed in worldwide locations. J. Atmos. Sci. 2002, 59, 590–608. [Google Scholar] [CrossRef]
  20. Eck, T.; Holben, B.; Reid, J.; Sinyuk, A.; Hyer, E.; O’Neill, N.; Shaw, G.; Vande Castle, J.; Chapin, F.; Dubovik, O. Optical properties of boreal region biomass burning aerosols in central Alaska and seasonal variation of aerosol optical depth at an Arctic coastal site. J. Geophys. Res. Atmos. 2009, 114, D11201. [Google Scholar] [CrossRef]
  21. Freudenthaler, V.; Esselborn, M.; Wiegner, M.; Heese, B.; Tesche, M.; Ansmann, A.; Müller, D.; Althausen, D.; Wirth, M.; Fix, A. Depolarization ratio profiling at several wavelengths in pure Saharan dust during SAMUM 2006. Tellus B 2009, 61, 165–179. [Google Scholar] [CrossRef] [Green Version]
  22. Tesche, M.; Ansmann, A.; Mueller, D.; Althausen, D.; Mattis, I.; Heese, B.; Freudenthaler, V.; Wiegner, M.; Esselborn, M.; Pisani, G. Vertical profiling of Saharan dust with Raman lidars and airborne HSRL in southern Morocco during SAMUM. Tellus B 2009, 61, 144–164. [Google Scholar] [CrossRef] [Green Version]
  23. Burton, S.; Ferrare, R.; Vaughan, M.; Omar, A.; Rogers, R.; Hostetler, C.; Hair, J. Aerosol classification fromairborne HSRL and comparisons with the CALIPSO vertical feature mask. Atmos. Meas. Technol. 2013, 6, 1397–1412. [Google Scholar] [CrossRef]
  24. Burton, S.; Hair, J.; Kahnert, M.; Ferrare, R.; Hostetler, C.; Cook, A.; Harper, D.; Berkoff, T.; Seaman, S.; Collins, J. Observations of the spectral dependence of linear particle depolarization ratio of aerosols using NASA Langley airborne High Spectral Resolution Lidar. Atmos. Chem. Phys. 2015, 15, 13453–13473. [Google Scholar] [CrossRef] [Green Version]
  25. Haarig, M.; Ansmann, A.; Althausen, D.; Klepel, A.; Groß, S.; Freudenthaler, V.; Toledano, C.; Mamouri, R.-E.; Farrell, D.A.; Prescod, D.A. Triple-wavelength depolarization-ratio profiling of Saharan dust over Barbados during SALTRACE in 2013 and 2014. Atmos. Chem. Phys. 2017, 17, 10767. [Google Scholar] [CrossRef]
  26. Holben, B.N.; Eck, T.F.; Slutsker, I.; Tanre, D.; Buis, J.; Setzer, A.; Vermote, E.; Reagan, J.; Kaufman, Y.; Nakajima, T. AERONET—A federated instrument network and data archive for aerosol characterization. Remote Sens. Environ. 1998, 66, 1–16. [Google Scholar] [CrossRef]
  27. Kambezidis, H.D.; Kaskaoutis, D. Aerosol climatology over four AERONET sites: An overview. Atmos. Environ. 2008, 42, 1892–1906. [Google Scholar] [CrossRef]
  28. Mattis, I.; Tesche, M.; Grein, M.; Freudenthaler, V.; Müller, D. Systematic error of lidar profiles caused by a polarization-dependent receiver transmission: Quantification and error correction scheme. Appl. Opt. 2009, 48, 2742–2751. [Google Scholar] [CrossRef]
  29. Dubovik, O.; Sinyuk, A.; Laypyonok, T.; Holben, B.N.; Mishchenko, M.; Yang, P.; Eck, T.F.; Voten, H.; Muñoz, O.; Veihelmann, B. Application of spheroid models to account for aerosol particle nonsphericity in remote sensing of desert dust. J. Geophys. Res. Atmos. 2006, 111, D11208. [Google Scholar] [CrossRef]
  30. Noh, Y.; Müller, D.; Lee, K.; Kim, K.; Shimizu, A.; Sano, I.; Park, C.B. Depolarization ratios retrieved by AERONET sun–sky radiometer data and comparison to depolarization ratios measured with lidar. Atmos. Chem. Phys. 2017, 17, 6271–6290. [Google Scholar] [CrossRef] [Green Version]
  31. Bohren, C.; Huffman, D. Absorbing and Scattering of Light by Small Particles; Wiley: Weinheim, Germany, 1983. [Google Scholar] [CrossRef]
  32. Sayer, A.M.; Smirnov, A.; Hsu, N.C.; Holben, B.N. A pure marine aerosol model, for use in remote sensing application. J. Geophys. Res. Atmos. 2012, 117, D05213. [Google Scholar] [CrossRef]
  33. Russell, P.B.; Bergstrom, R.W.; Shinozuka, Y.; Clarke, A.D.; DeCarlo, P.F.; Jimenez, J.L.; Livingston, J.M.; Redemann, J.; Dubovik, O.; Strawa, A. Absorption angstrom exponent in AERONET and related data as an indicator of aerosol composition. Atmos. Chem. Phys. 2010, 11, 1155–1169. [Google Scholar] [CrossRef]
  34. Tesche, M.; Müller, D.; Groß, S.; Ansmann, A.; Althausen, D.; Freudenthaler, V.; Weinzierl, B.; Veira, A.; Petzold, A. Optical and microphysical properties of smoke over Cape Verde inferred from multiwavelength lidar measurement. Tellus B 2011, 63, 677–694. [Google Scholar] [CrossRef]
  35. Lee, J.; Kim, J.; Song, C.H.; Kim, S.B.; Chun, Y.; Sohn, B.J.; Holben, B.N. Characteristics of aerosol types from AERONET sunphotometer measurements. Atmos. Environ. 2010, 44, 3110–3117. [Google Scholar] [CrossRef]
  36. Tanré, D.; Kaufman, Y.; Holben, B.; Chatenet, B.; Karnieli, A.; Lavenu, F.; Blarel, L.; Dubovik, O.; Remer, L.; Smirnov, A. Climatology of dust aerosol size distribution and optical properties derived from remotely sensed data in the solar spectrum. J. Geophys. Res. Atmos. 2001, 106, 18205–18217. [Google Scholar] [CrossRef] [Green Version]
  37. Reid, J.S.; Kinney, J.E.; Westphal, D.L.; Holben, B.N.; Welton, E.J.; Tsay, S.C.; Eleuterio, D.P.; Campbell, J.R.; Christopher, S.A.; Colarco, P. Analysis of measurements of Saharan dust by airborne and ground-based remote sensing methods during the Puerto Rico Dust Experiment (PRIDE). J. Geophys. Res. Atmos. 2003, 108, D19. [Google Scholar] [CrossRef]
  38. Schuster, G.L.; Vaughan, M.; MacDonnell, D.; Su, W.; Winker, D.; Dubovik, O.; Lapyonok, T.; Trepte, C. Comparison of CALIPSO aerosol optical depth retrievals to AERONET measurements, and a climatology for the lidar ratio of dust. Atmos. Chem. Phys. 2012, 12, 7431. [Google Scholar] [CrossRef]
  39. Verma, S.; Prakash, D.; Ricaud, P.; Payra, S.; Attié, J.-L.; Soni, M. A new classification of aerosol sources and types as measured over Jaipur, India. Aerosol Air Qual. Res. 2015, 15, 985–993. [Google Scholar] [CrossRef]
  40. Khatri, P.; Takamura, T.; Shimizu, A.; Sugimoto, N. Observation of low single scattering albedo of aerosols in the downwind of the East Asian desert and urban areas during the inflow of dust aerosols. J. Geohys. Res. Atmos. 2014, 119, 787–802. [Google Scholar] [CrossRef] [Green Version]
  41. Ou, Y.; Zhao, W.; Wang, J.; Zhao, W.; Zhang, B. Characteristics of Aerosol Types in Beijing and the Associations with Air Pollution from 2004 to 2015. Remote Sens. 2017, 9, 898. [Google Scholar] [CrossRef]
  42. Mikami, M.; Shi, G.; Uno, I.; Yabuki, S.; Iwasaka, Y.; Yasui, M.; Aoki, T.; Tanaka, T.; Kurosaki, Y.; Masuda, K. Aeolian dust experiment on climate impact: An overview of Japan–China joint project ADEC. Glob. Planet. Chang. 2006, 52, 142–172. [Google Scholar] [CrossRef]
  43. Yu, X.; Cheng, T.; Chen, J.; Liu, Y. A comparison of dust properties between China continent and Korea, Japan in East Asia. Atmos. Environ. 2006, 40, 5787–5797. [Google Scholar] [CrossRef]
  44. Hess, M.; Koepke, P.; Schult, I. Optical properties of aerosols and clouds: The software package OPAC. Bull. Am. Meteorol. Soc. 1998, 79, t831–t844. [Google Scholar] [CrossRef]
  45. Haywood, J.M.; Ramaswamy, V. Global sensitivity studies of the direct radiative forcing due to anthropogenic sulfate and black carbon aerosols. J. Geophys. Res. 1998, 103, 6043–6058. [Google Scholar] [CrossRef] [Green Version]
  46. Wang, J.; Martin, S.T. Satellite characterization of urban aerosols: Importance of including hygroscopicity and mixing state in the retrieval algorithms. J. Geophys. Res. 1998, 112, D17203. [Google Scholar] [CrossRef]
  47. Fierce, L.; Bond, T.C.; Bauer, S.E.; Mena, F.; Riemer, N. Black carbon absorption at the global scale is affected by particle-scale diversity in composition. Nat. Commun. 2016, 7, 12361. [Google Scholar] [CrossRef] [PubMed] [Green Version]
  48. Chung, C.E.; Lee, K.; Müller, D. Effect of internal mixture on black carbon radiative forcing. Tellus B 2012, 64, 10925. [Google Scholar] [CrossRef]
  49. Ansmann, A.; Petzold, A.; Kandler, K.; Tegen, I.; Wendisch, M.; Mueller, D.; Weinzierl, B.; Mueller, T.; Heintzenberg, J. Saharan Mineral Dust Experiments SAMUM–1 and SAMUM–2: What have we learned? Tellus B 2011, 63, 403–429. [Google Scholar] [CrossRef]
  50. Mamouri, R.-E.; Ansmann, A. Fine and coarse dust separation with polarization lidar. Atmos. Meas. Technol. 2014, 7, 3717–3735. [Google Scholar] [CrossRef] [Green Version]
  51. Shimizu, A.; Sugimoto, N.; Matsui, I.; Arao, K.; Uno, I.; Murayama, T.; Kagawa, N.; Aoki, K.; Uchiyama, A.; Yamazaki, A. Continuous observations of Asian dust and other aerosols by polarization lidars in China and Japan during ACE-Asia. J. Geophys. Res. Atmos. 2004, 109, D19S17. [Google Scholar] [CrossRef]
  52. Haarig, M.; Ansmann, A.; Baars, H.; Jimenez, C.; Veselovskii, I.; Engelmann, R.; Althausen, D. Depolarization and lidar ratios at 355, 532, and 1064 nm and microphysical properties of aged tropospheric and stratospheric Candian wildfire smoke. Atmos. Chem. Phys. 2018, 18, 11847–11861. [Google Scholar] [CrossRef]
  53. Sakai, T.; Nagai, T.; Zaizen, Y.; Mano, Y. Backscattering linear depolarization ratio measurements of mineral, sea-salt, and ammonium sulfate particles simulated in a laboratory chamber. Appl. Opt. 2010, 49, 4441–4449. [Google Scholar] [CrossRef] [PubMed]
  54. Shin, S.-K.; Teshce, M.; Kim, K.; Kezoudi, M.; Tatarov, B.; Müller, D.; Noh, Y. On the spectral depolarisation and lidar ratio of mineral dust provided in the AERONET version 3 inversion product. Atmos. Chem. Phys. 2018, 18, 12735–12746. [Google Scholar] [CrossRef]
Figure 1. Map of AERONET observation sites based on the dominant particle type. (red: dust, green: smoke, blue: urban/industrial mixed).
Atmosphere 10 00143 g001
Figure 2. Scatter plot of fine-mode fraction (FMF) versus Ångstöm exponent for the pair of wavelength 440 and 870 nm (Å440-870) for (a) dust sites, (b) smoke sites and (c) urban/industrial/mixed sites. Thresholds of Å440-870 <0.4 and FMF <0.4 are used to determine the dust particles, Å440-870 >1.0 is used to distinguish the smoke particles, 0.4 <FMF <0.6 is used to distinguish the mixed particles and FMF > 0.6 is used to distinguish the pollution particles at the respective sites of each aerosol type.
Atmosphere 10 00143 g002
Figure 3. Mean values of spectral (a) single scattering albedo and (b) particle size distribution for dust (black), smoke (red), mixed (green), non-absorbing pollution (blue), moderately-absorbing (cyan) and high-absorbing (magenta).
Atmosphere 10 00143 g003
Figure 4. Frequency distribution of the spectral depolarization ratio for dust, smoke, mixed, non-absorbing (NA), moderate-absorbing (MA) and high-absorbing (HA) pollution particles at 440 (blue), 675 (green), 870 (magenta) and 1020 (red) nm wavelengths, respectively. Statistics for the histograms are provided in Table 3.
Atmosphere 10 00143 g004
Figure 5. Spectral variation of the particle linear depolarization ratios for dust, smoke, mixed, non-absorbing (NA), moderate-absorbing (MA) and high-absorbing (HA) pollution particles, respectively.
Atmosphere 10 00143 g005
Table 1. Geographical/retrieval information for each aerosol type of the AERONET sites, along with corresponding literature citations. The number of cases of urban/industrial mixed aerosol is considered to equal number of cases that exclude the number of cases for dust particles.
SiteLatitude [°]Longitude [°]Elevation [m]Range of YearNumber of Retrieval (Filtered)References
Dust [5,36,37,38]
Banizoumbou13.552.672741995–1997, 1999–20113120 (2331)
Capo Verde16.73−22.94601994–1995, 1999–2004597 (510)
DMN_Maine_Soroa13.2212.023502005–2009498 (365)
IER_Cinzana13.28−5.932852004–20163684 (2688)
Smoke [5,20,27,39]
Moscow55.7137.521922001–2015360 (206)
Tomks56.4885.051742003–2004, 2006–201098 (91)
Alta Floresta−9.87−56.102771993–1995, 1999–2015817 (779)
Bonaza_Creek64.74−148.323531997–2000, 2002, 2004, 2005, 2008190 (181)
Tomsk_2256.4284.07802011–2016159 (145)
Yakutsk61.66129.37118.52004, 2006, 2008–2009, 2011–2017249 (244)
Urban/Industrial/Mixed [7,11,40,41]
Gwangju_GIST35.23126.84522004–2005, 2007–20171061 (1054)
Beijing39.98116.38922001–20112541 (2450)
Beijing_CAMS39.93116.321062012–20171364 (1346)
Seoul_SNU37.46126.951162002–2003, 2012–2013, 2015–2017787 (777)
Table 2. Mean value of Ånström exponent at 440–870 nm pair (Å440-870), single scattering albedo (ω) and fine-mode fraction (FMF) from the AERONET Version 3 Level 2 inversion product at each representative aerosol source region.
Aerosol Type
PropertiesDustSmokeMixedPollution (NA)Pollution (MA)Pollution (HA)
Å440/870 0.18 ± 0.091.75 ± 0.220.57 ± 0.101.31 ± 0.221.25 ± 0.211.25 ± 0.17
ω4400.90 ± 0.030.94 ± 0.030.90 ± 0.030.97 ± 0.010.92 ± 0.030.83 ± 0.02
ω6750.97 ± 0.020.93 ± 0.040.95 ± 0.020.97 ± 0.010.93 ± 0.030.87 ± 0.03
ω8700.98 ± 0.020.92 ± 0.050.95 ± 0.020.97 ± 0.020.92 ± 0.030.86 ± 0.03
ω10200.98 ± 0.020.91 ± 0.050.95 ± 0.020.96 ± 0.020.92 ± 0.030.85 ± 0.04
FMF0.29 ± 0.060.96 ± 0.040.52 ± 0.050.94 ± 0.040.87 ± 0.080.84 ± 0.07
Table 3. Spectral mean particle linear depolarization ratio (δp) from the AERONET Version 3 Level 2 inversion product at each representative aerosol source region.
Particle Linear Depolarization Ratio
440 nm675 nm870 nm1020 nm
Dust0.224 ± 0.0350.269 ± 0.0270.291 ± 0.0280.303 ± 0.030
Banizoumbou0.225 ± 0.0360.268 ± 0.0280.29 ± 0.0290.302 ± 0.031
Capo Verde0.249 ± 0.0300.283 ± 0.0240.300 ± 0.0250.309 ± 0.026
DMN_Maine_Soroa0.225 ± 0.0300.265 ± 0.0230.283 ± 0.0240.294 ± 0.026
IER_Cinzana0.218 ± 0.0330.268 ± 0.0260.292 ± 0.0270.305 ± 0.029
Smoke0.006 ± 0.0150.012 ± 0.0120.01 ± 0.010.005 ± 0.014
Moscow0.011 ± 0.0250.018 ± 0.0230.018 ± 0.0250.012 ± 0.027
Tomks0.017 ± 0.0330.022 ± 0.0290.024 ± 0.0310.018 ± 0.035
Alta Floresta0.003 ± 0.0070.010 ± 0.0050.011 ± 0.0050.004 ± 0.005
Bonaza_Creek0.006 ± 0.0130.012 ± 0.0100.012 ± 0.0090.005 ± 0.008
Tomsk_220.004 ± 0.0050.010 ± 0.0040.010 ± 0.0030.003 ± 0.003
Yakutsk0.004 ± 0.0130.010 ± 0.0080.010 ± 0.0070.003 ± 0.006
Urban/Industrial/Mixed
Mixed (Polluted dust)0.129 ± 0.0290.171 ± 0.0300.193 ± 0.0340.208 ± 0.037
Gwangju_GIST0.132 ± 0.0280.178 ± 0.0310.202 ± 0.0360.217 ± 0.039
Beijing0.129 ± 0.0310.167 ± 0.0300.188 ± 0.0330.203 ± 0.037
Beijing_CAMS0.127 ± 0.0300.165 ± 0.0320.184 ± 0.0340.198 ± 0.034
Seoul_SNU0.122 ± 0.0230.179 ± 0.0210.207 ± 0.0190.225 ± 0.018
Non Absorbing0.049 ± 0.0530.43 ± 0.0390.039 ± 0.0350.031 ± 0.035
Gwangju_GIST0.050 ± 0.0560.044 ± 0.0400.040 ± 0.0370.032 ± 0.038
Beijing0.057 ± 0.0560.048 ± 0.0410.042 ± 0.0350.033 ± 0.035
Beijing_CAMS0.048 ± 0.0480.042 ± 0.0350.038 ± 0.0310.030 ± 0.031
Seoul_SNU0.040 ± 0.0510.038 ± 0.0390.036 ± 0.0370.028 ± 0.038
Moderate Absorbing0.051 ± 0.0490.052 ± 0.0440.054 ± 0.0470.051 ± 0.052
Gwangju_GIST0.057 ± 0.0500.060 ± 0.0470.062 ± 0.0510.060 ± 0.058
Beijing0.052 ± 0.0480.053 ± 0.0420.053 ± 0.0450.050 ± 0.050
Beijing_CAMS0.048 ± 0.0470.049 ± 0.0430.051 ± 0.0450.048 ± 0.051
Seoul_SNU0.046 ± 0.0500.049 ± 0.0460.050 ± 0.0490.046 ± 0.054
High Absorbing0.036 ± 0.0310.045 ± 0.0330.050 ± 0.0380.049 ± 0.046
Gwangju_GIST0.051 ± 0.0680.046 ± 0.0480.044 ± 0.0450.038 ± 0.048
Beijing0.037 ± 0.0300.047 ± 0.0330.052 ± 0.0380.052 ± 0.046
Beijing_CAMS0.029 ± 0.0310.036 ± 0.0330.039 ± 0.0380.036 ± 0.043
Seoul_SNU0.033 ± 0.0360.039 ± 0.0300.041 ± 0.0320.037 ± 0.036

