Urban Trees and Their Impact on Local Ozone Concentration—A Microclimate Modeling Study


1
Department of Geography, Johannes Gutenberg University Mainz, 55099 Mainz, Germany
2
Institute of Atmospheric Physics, Johannes Gutenberg University Mainz, 55099 Mainz, Germany
*
Author to whom correspondence should be addressed.
Atmosphere 2019, 10(3), 154; https://doi.org/10.3390/atmos10030154
Submission received: 14 February 2019
/
Revised: 15 March 2019
/
Accepted: 20 March 2019
/
Published: 22 March 2019
(This article belongs to the Special Issue Air Quality Prediction)
Abstract
:Climate sensitive urban planning involves the implementation of green infrastructure as one measure to mitigate excessive heat in urban areas. Depending on thermal conditions, certain trees tend to emit more biogenic volatile organic compounds, which act as precursors for ozone formation, thus hampering air quality. Combining a theoretical approach from a box model analysis and microscale modeling from the microclimate model ENVI-met, we analyze this relationship for a selected region in Germany and provide the link to air quality prediction and climate sensitive urban planning. A box model study was conducted, indicating higher ozone levels with higher isoprene concentration, especially in NO-saturated atmospheres. ENVI-met sensitivity studies showed that different urban layouts strongly determine local isoprene emissions of vegetation, with leaf temperature, rather than photosynthetic active radiation, being the dominant factor. The impact of isoprene emission on the ozone in complex urban environments was simulated for an urban area for a hot summer day with and without isoprene. A large isoprene-induced relative ozone increase was found over the whole model area. On selected hot spots we find a clear relationship between urban layout, proximity to NOx emitters, tree-species-dependent isoprene emission capacity, and increases in ozone concentration, rising up to 500% locally.
Keywords:
ENVI-met; BVOC; box-model; isoprene; urban planning; air quality; NOx; green infrastructure1. Introduction
Vegetation plays a vital role in urban environments. Aside from the aesthetic benefits, trees and other vegetation help mitigate the effects of an urban heat island (UHI) by increasing the latent heat flux through evapotranspiration, preventing the near surface air from heating up during the day and providing evaporative cooling during the night. Shadowing street canyons and buildings, trees prevent them from accumulating more heat, thus reducing the total energy surplus of an urban environment [1,2]. Vegetated roofs and facades can help to reduce the cooling demand in summer and also contribute to insulation in winter, leading to less heat loss into the atmosphere and savings in energy consumption for the immediate environment. A modulation of the temperature amplitude can also increase the resistance of the building materials themselves. In an optimal setup, vegetation additionally absorbs CO2 through the processes of photosynthesis, releases O2 into the air, and consequently helps to mitigate urban air pollution [3,4,5]. On the contrary, however, studies like Abhijith et al. (2017) [6] showed that tall vegetation may hamper the air exchange, and thus lead to local increases in air pollution.
As such, vegetation in all its different forms (parks, trees, façade greening, etc.) is the most advised strategy to mitigate the UHI effect and to help improve the urban microclimate [2,7,8,9]. In order to gain the highest benefit of urban vegetation for the local microclimate, however, a number of pre-conditions have to be met. Amongst others, important requirements need to involve the right mix of sun and shade, adequate ventilation, humidity, air temperature, and appropriate soil and water supply [10,11,12].
A large number of studies exist analyzing the effects of vegetation on microclimates [13,14,15,16,17,18,19]. Having a known impact on urban air temperature, and as such urban heat island mitigation and climate adaption potential, many authors advise increasing the amount of vegetation in urban environments [2,20,21] and recommend trees to provide ecosystem services to urban areas [22]. Planting trees, therefore, should be extended in general guidelines for sustainable urban planning [23].
In addition to thermal properties, the urban microclimate is also characterized by elevated levels of air pollutants [24] and particularly during heat wave conditions, many cities record heightened levels of tropospheric ozone due to a combination of higher insulation and release of nitrogen monoxide and nitrogen dioxide through most combustion processes [25]. A multitude of studies have shown that extensive exposure to tropospheric ozone can lead to eye and throat irritation, coughing, asthma attacks, other respiratory symptoms, and even an increased mortality [26,27,28,29,30].
Contrary to nitrogen monoxide and nitrogen dioxide, ozone is a secondary pollutant which is formed by photochemical reactions in the troposphere. About 50% of the tropospheric ozone concentration is originated from the stratosphere and transported to lower layers by vertical and horizontal mixing and advection. The second half, however, results from chemical reactions, mainly from photolysis of nitrogen dioxide, which mainly has anthropogenic sources. In highly polluted urban areas, the second pathway is supposed to be more relevant [31].
In the absence of free radicals (e.g., originated from volatile organic compounds (VOCs)), the ozone concentration forms a photochemical equilibrium with the concentrations of nitrogen monoxide and nitrogen dioxide, where the ozone concentration depends on the ratio of NO2 and NO [32,33,34,35,36]. In the presence of VOCs, however, the oxidation of nitrogen monoxide is drastically increased, leading to a surplus of NO2, which destroys the equilibrium, and via photolysis, leads to higher ozone concentrations. This makes VOCs an important factor in the formation of tropospheric ozone. Among the biogenic volatile organic compounds (BVOCs), isoprene and the isoprene-induced reactions play a key role in the formation of tropospheric ozone [37,38,39].
Urban areas are facing elevated ambient temperatures, thus, encouraging an increased emission of isoprene—positively correlated to leaf temperature [40,41,42]—into the atmosphere. Together with increased nitrogen oxides levels emanating mainly from traffic exhaust, the formation of tropospheric ozone can be drastically increased compared to rural sites. Additionally, the heterogeneous urban layouts generate versatile microclimates, controlling not only the chemical reaction and transport processes but also the emission of isoprene itself (e.g., with regard to shading, local heat stress, or microscale flow).
The relation between BVOC emission and tropospheric ozone concentration has been discussed in recent literature in a broad context, including modelling studies on a global [43] and large scale [44], as well as on a more regional level for the metropolitan area of Beijing [45] or for the urban area of Berlin [25,46]. Looking at observations, Fantozzi et al. (2015) [47] showed that surface levels of ozone tend to increase below and in the near-field of certain tree species (e.g., Quercus) within the urban area of Siena, Italy, whereas Wagner et al. (2014) [48] could detect elevated isoprene and ozone levels in close proximity to a road tunnel.
Entangling complex interactions between the dominant precursors (NO, NO2, isoprene) and tropospheric ozone, recent studies have used various tools from earth systems [43] to chemical transport models [25,46,49], down to Computational Fluid Dynamic (CFD) systems treating idealized urban canyons [50]. To understand fundamental relationships, box models are facilitated inheriting similar code structures as in the models mentioned above [51,52].
The main goal of this study, also setting out the novelty for this field of research, is to combine these different approaches in the framework of both theoretical and applied urban planning perspectives. Doing this, we specifically try to cover these interactions using a three-step methodology. In the first step, the basic chemical interdependencies of the different reactants are examined in a box model to gain theoretical understanding of the principle chemical reaction chains. This box model is based on the Regional Atmospheric Chemistry Mechanism (RACM) and Regional Acid Deposition Module Version 2 (RADM2) [53], which are most commonly used in chemical transport models, such as Weather Research and Forecasting Model-Chem (WRF-Chem) [25,46,49]. To account for the effects of different microclimates on the raw isoprene emissions, a sensitivity study is conducted for characteristic urban layouts using idealized configurations in the microclimate model ENVI-met [54,55]. The basic equations of the box model are essentially solved on a 3-dimensional grid with underlying urban morphology. In the last step, the findings of the box model and the parametric study are combined in a realistic scenario using detailed configuration of ENVI-met, including actual traffic emissions (NO and NO2) and physical isoprene emitters within a large model domain that incorporates realistic local microclimates. To quantify the contribution of urban trees to local ozone concentration a model run, with and without isoprene, is conducted. Sensitivities are then assessed on the basis of the absolute and relative differences in ozone concentration. This conceptual model approach enables us to transfer theoretical understanding of the existing interactions between microclimates, BVOC, and traffic emissions into planning processes. Findings from literature can be proven by the box model. Idealized microclimate studies give advice for urban planners with regard to general urban setups, and finally results from a dedicated case study can help local authorities in particular. To our knowledge, this attempt has not been done in previous studies, either with regard to the methodology used or for the specific urban area.
2. Data and Methods
Starting from the theoretical basis of isoprene/ozone interrelations using a box model, we continue with a hypothetical microclimate study, applying the findings from the box model to theoretical urban layouts. In the last step, ENVI-met is set up for a real urban environment, including realistic traffic and BVOC emissions.
2.1. Box Model RACM
The RACM box model is configured for laboratory-like conditions comparable to the current setup, and is used for the more complex approaches in Section 2.2. The basic chemical reactions included in the box model are congruent with the chemical schemes in ENVI-met and are presented in the following.
The most important aspect of the photochemical reaction in Equation (1) is the production of single oxygen O (1D), since it has the potential to react with water vapor to form the highly reactive hydroxyl radical OH (Equation (2)). This reaction happens very fast and OH itself triggers a large number of chemical reactions [56].
O3 + hv (λ < 310 nm) → O2 + O(1D)
O(1D) + H2O → 2OH
The formation and removal of ozone in the troposphere, however, mainly results from the combination of atomic oxygen and molecular oxygen in the presence of a third energy absorbing agent (M). Oxygen atoms are mainly provided through photo dissociation of NO2 (3), whereas the threshold wavelength for production of ground-state NO and O atoms is 397.8 nm [56]. Due to titration reactions with the freshly emitted NO in the evening, ozone is depleted and transferred back to NO2, which then closes the nitrogen cycle; the reaction is in a state of equilibrium. For the net production of ozone, the presence of nitrogen oxides alone is not enough and a reactive species is needed [57], which is represented by isoprene (C5H8) emitted from trees in our study.
NO2 + hv (λ < 400 nm) → NO + O
O + O2 + M → O3 + M
O3 + NO → NO2 + O2
The slower photolysis reaction (Equation (3)) is the rate limiting factor for the nitrogen cycle and the main reason why ozone is formed only during the day and concentrations are high in the summer months with intense radiation. That is why we also focus on a clear summer day for the follow up simulations with ENVI-met. Being dependent on the amount of free oxygen atoms, the formation of ozone via Equation (4) is mostly driven by the intensity of solar radiation. At equilibrium in ambient air and constant pollution concentrations, a NO2/NO ratio of 10:1 would be needed to generate 0.01 ppm of ozone. However, in reality this ratio is 1:10, which leads to the assumption that the nitrogen cycle itself cannot be responsible for the high ozone concentrations in urban areas and their vicinity [31]. In order to accumulate according to the photo stationary state, an additional agent has to be present to convert NO to NO2 without the destruction of ozone. As mentioned above, this additional pathway is provided by the photochemical oxidation of VOCs, such as aldehydes or hydrocarbons, which can be of anthropogenic or biogenic origin (BVOC).
Most of the BVOCs emitted by plants belong to the chemical class of isoprenoids or terpenes. The simplest and most volatile, but also the most common isoprenoid, is isoprene (2-methyl-1,3-butadiene (C5H8)). Certain tree species tend to emit more isoprene than others, and therefore would have a larger impact on air quality modifications in urban areas [39]. In addition to the reactions above, the following (simplified) NO2 forming, and therefore ozone-increasing, isoprene-related reactions by Paulot et al. (2009) and Sander et al. (2011) [58,59] can be summarized as:
C5H8 + OH → RO2 + O2
RO2 + NO → NO2 + HO2 + x
According to Equations (6) and (7), isoprene reacts with free hydrogen radicals (generated, for instance, by Equation (2)). The oxidation product RO2 again recombines with NO to form NO2 (see Table 2). The latter is available to start Equation (3).
The box model that is used in this study relies on the “Regional Atmospheric Chemistry Mechanism—RACM” [53], which is based upon the earlier “Regional Acid Deposition Module Version 2—RADM2” [60]. The latter is used for various chemical transport models (e.g. [46,49]) and in its fundamentals (represented by Equations (1)—(7)) it is similar to the isoprene chemistry model in ENVI-met presented further below. The RACM mechanism includes laboratory-proven rate constants and product yields and has been tested against environmental chamber data [53]. We simulate diurnal variation (24 h, time step 5 min) of ozone concentrations for various initial isoprene concentrations and NO2/NO-ratios (see Table 1 and Table 5).
Isoprene concentrations are in the range of commonly observed values for urban areas in Germany [48]. The values of NO2 and NO, however, do not represent real observations but idealized ratios. Initial CO and CH4 are set to commonly found atmospheric background concentrations of 0.1 and 1.5 ppm, respectively. Initial O3-concentrations are set to zero and VOCs other than isoprene are not accounted for in order to allow a “clean” setup. According to Seinfeld et al. (2016) [31], these conditions represent a VOC-limited regime, which is characteristic for urban atmospheres.
2.2. ENVI-Met
In order to analyze the effects of different microclimates on the emission of isoprene and the formation of tropospheric ozone concentration, the microclimate model ENVI-met is used. First, the sensitivity of isoprene emissions to microclimates, i.e., differences in local climate due to variations in the urban layout, is assessed by simulating identical emitters in four idealized urban setups. Subsequently, the effects of isoprene onto the formation of the tropospheric ozone is examined for a realistic case in a larger model domain.
Isoprene Representation in ENVI-Met
In order to simulate the isoprene emission of plants and its effects on the formation of tropospheric ozone, ENVI-met’s recently developed model to estimate the emissions of isoprene was used. The isoprene emission model is based on the works of Guenther et al. (1993) [40] and the advancements in Guenther et al. (1999) [42] and Guenther et al. (2006) [37]. Additionally, the dispersion of isoprene into the atmosphere and its chemical reactions with other gases leading to tropospheric ozone are also simulated in ENVI-met’s dispersion and chemistry model [55].
The diurnal isoprene emissions are, in accordance with other studies [37,40,42], calculated by:
with as the ecosystem and plant-dependent mass-based emission capacity [µg C g−1 h−1] at a photosynthetically active photon flux density (PPFD) of 1000 µmol m−2 s−1 and at a leaf temperature of 303.15 K; , , , and represent dimensionless adjustment factors accounting for the influence of PPFD, leaf temperature, the leaf age, and situations of severe drought on the emission activity, while accounts for the amount of isoprene that is released into the above-canopy atmosphere [37,42].
Since the original isoprene emission model of Guenther et al. (1993) [40] is mainly used in the field of remote sensing (see [37,61]), its input parameters incorporate parametrizations for the dimensionless adjustment factors. However, as ENVI-met operates on the microscale level, some of these parametrizations in the original model can instead be simulated directly.
This is especially the case for the calculation of dissipation of the incoming photosynthetic active radiation (PAR). Contrary to geographic information system (GIS) and remote sensing approaches, ENVI-met is able to model the radiation fluxes in the canopy, producing more sophisticated results than the parametrizations of PPFD dissipation caused by shade casting () (Equation (9)).
with α and as empirical coefficients, altered by the cumulative Leaf Area Index (LAI) above the observed leaves and as the current photosynthetic photon flux density. Since the effects of shade casting leaves, i.e., a reduction of the current photosynthetic photon flux density , are directly simulated with ENVI-met’s radiation attenuation, the coefficients α and can be set constant to the values suggested by Guenther et al., which are: α = 0.0027 and . The resulting effect of different levels of PPFD onto the coefficient can be seen in Figure 1a.
The coefficients for leaf temperature, situations of severe drought, , and are implemented in ENVI-met without adjustments. The dependence of leaf temperature onto the isoprene emission is calculated by:
and
with as the maximum normalized emission capacity and as leaf temperature at which is reached. In the default setting, the effects of leaf temperatures of the past days and weeks are neglected and are thus set to K and [37,62]; and are empirical coefficients representing the energy of activation and deactivation, as the actual leaf temperature, and as the universal gas constant (=0.00831 [kJ mol−1 K−1]) [42,55].
The resulting function of the leaf temperature dependent coefficient resembles a bell curve with steep inclinations right around the values of K (see Figure 1b).
The severe drought factor influences the isoprene emission depending on the available soil water. Depending on the actual volumetric water content , an empirical derived constant , and the wilting point , three cases are distinguished in the model [55]:
- In case : ;
- In case : ;
- In case : ;
- While is defined as: .
The effects of leaf age and the release of isoprene into the atmosphere above the canopy do not need to be implemented in the microclimate adaptation of the isoprene model in ENVI-met. Due to the comparatively short period of simulated time, the effects of changing leaf age can be set constant for the model run. The release of isoprene into the atmosphere above the canopy can directly be modeled by introducing isoprene into the dispersion and chemistry model.
Dispersion and Chemistry Model
Apart from the isoprene emission of plants, the dispersion of isoprene in the atmosphere and its chemical reactions with other gases are also implemented in ENVI-met [55]. The dispersion of isoprene is directly simulated by extending ENVI-met’s gas and particle dispersion and deposition model [63]. This makes the original factor , accounting for the release of isoprene into the atmosphere above the canopy, obsolete. The dispersion of isoprene is calculated using the advection-diffusion equation of the gas and particle model, including both changes in time and location with the respective wind vector components :
with as the local concentration of the compound in [µg kg−1 Air], as the local exchange coefficient, and and both in [µg Compound s−1] as source and sink terms leading to local increases or decreases in concentration [55,63]. then represents the release of isoprene of each individual leaf cell of a tree into the atmosphere, while represents the decrease of the isoprene concentration. This decrease includes both deposition on solid surfaces, plant leaves, and water bodies due to aerodynamic resistance, molecular diffusivity and absorption, and chemical transformation, which leads to a reduction of the concentration of the reactants and consequently an increase of the resulting compounds (see Table 2) [55]. To simulate the influence of isoprene onto the formation of tropospheric ozone, isoprene-related reactions based on the works of Paulot et al. (2009) [58] and Sander et al. (2011) [59] are implemented using the rate equation scheme of the OSPM model [55,64], which represents sedimentation or chemical conversion processes by locally increasing or decreasing the gas or particle concentration.
2.2.1. Microclimate Study Setup
In order to analyze the effects of local microclimates onto the emission of isoprene, a small hypothetical model area featuring different microclimates has been created (Figure 2a) in accordance with a real morphological setting existing in the urban area of Mainz.
The dimensions of the model area are 56 × 58 × 30 grids in 2.5 m horizontal and 2 m vertical resolution. All trees in the model area feature the same base isoprene emission capacity of 10.5 µgisoprene g−1leaf h−1 and a leaf weight of 100 gleaf m−2. Their geometry is identical with a height of 15 m and a crown width of 7 m. All buildings share the same height (20 m) and identical reflective properties with a predefined albedo of 0.5. Roads in north-south directions are 12.5 m wide and roads oriented from West to East measure a width of 10 m. All trees share a Leaf Area Density (Leaf Area Index divided by mean tree height) of 0.7 and natural surfaces are covered with 25-cm-high grass. The remaining surface area is defined as concrete. Figure 2b shows typical sky view factors at ground level.
The model run was started at July 6 at 12 am, which represents a typical mid-European summer day (see Table 3). Based on the meteorological data from Energy Plus Weather Files (EPW-Files) from Frankfurt, Germany, boundary conditions for 24 h were generated to run the ENVI-met 4 Expert simulation. Since high photosynthetically active radiation (PAR) and leaf surface temperatures are expected to have the biggest impact on plant isoprene emission, a warm summer period with low cloud cover was chosen to evaluate the effects of isoprene on the formation of tropospheric ozone. Using the EPW-Files, diurnal cycles of radiation, air temperature, and humidity were created as boundary conditions for the model.
Initial wind speed at a height of 10 m is set to 2 ms−1 and wind direction is set constant to 225°, representing typical conditions during summer for this area. The diurnal cycle of temperature, specific humidity, and longwave and shortwave radiation are simulated as specified in Figure 3. With maximum temperature exceeding 30 °C, the simulated day can be described as a “hot day” according to WMO. The specific humidity is almost constant at 8 g/kg, which accounts for a relative humidity between 35% and 70%. The total radiation reaching the top of the urban canopy predominately consists of direct shortwave radiation, with minor compounds being longwave and diffuse shortwave.
Four typical, idealized locations have been defined to analyze the relation between leaf area temperature, photosynthetic active radiation, and isoprene emission capacity of a single tree, located within this simplified urban configuration. The “Park (1)” scenario refers to the tree standing in the middle of a mid-sized park (500 m2) in the north-eastern corner of the domain, its sky view factor (SVF) is calculated at 0.1. The second scenario, the “Courtyard (2)” scenario, accounts for a 374 m2 area which is covered by 5 trees with equal distances to each other. For the scenario, a tree is selected, which is facing a wall surface in northern direction and the internal courtyard to the South. The sky view factor below the tree for this specific tree is calculated at 0.01. The “Urban Canyon (3)” scenario describes a tree standing in line with other trees inside an urban canopy with a width of about 10 m. It is surrounded by building walls in two cardinal directions (North, South), and therefore shares a SVF of 0.2 (see Figure 2b). The fourth scenario classifies a suburban tree (classified as “Suburban (4)” in the following), which is not directly facing a building but is in close proximity to two street corners in the northern direction; as it is facing open space in three cardinal directions, a SVF of about 0.71 is assumed. In the following, these four scenarios are compared for their site-specific isoprene emission capacity.
2.2.2. Case Study Mainz Setup
Relating to findings from both box model and idealized sensitivity studies, the microclimatic model ENVI-met is configured for an urban area of interest and the impact of isoprene emission on ambient ozone concentration is discussed for typical urban layouts featuring sources of NO and NO2 found within the model domain. To assess absolute and relative effects on near surface ozone levels, two model simulations, with and without isoprene, are compared.
The study was performed in the city of Mainz in western Germany (50.0° N, 8.3° E, population 200,000). Mainz is located in a landscape of gently rolling hills on the western shore of the Rhine River. The climate is temperate with an annual air temperature of 10.7 °C and precipitation of 550 mm. The summers are warm, reaching 19.2 °C from June to August, with an average precipitation of 175 mm (from 1981 to 2010, www.dwd.de). Due to its location in a valley where westerly wind flow (most common) is limited, the core urban area counts as one of the driest urban areas in Germany.
The whole area of the inner city was digitized, with 267 × 160 × 30 grids in a horizontal resolution of 7.5 m and a vertical resolution of 3 m, resulting in ENVI-met model area of 2000 m × 1200 m × 90 m. The simulation took about 8 days on a i7-6700 CPU. The simulation uses the same meteorology as in the sensitivity study above (see Figure 3 and Table 3). To simulate the chemical processes leading to the formation and dissipation of tropospheric ozone, nitrogen monoxide and nitrogen dioxide sources had to be defined. Since internal combustion engines are the main producers of these reactants, the sources were placed onto the streets of the model area at a height of 0.3 m above the surface. All lanes were digitized using line sources. Figure 5a displays the model area, including the line sources for nitrogen monoxide and nitrogen dioxide.
In this quasi-realistic scenario, NO and NO2 emissions are subject to diurnal variations, which should represent typical commuting traffic profiles with two peaks at 7 am and 4 pm, respectively (Figure 4b). The absolute numbers of vehicles driving on these roads, the daily traffic value (DTV), are based on hypothetical amounts depending on the size and importance of the street. The ratio between passenger cars, coaches, urban busses, motorcycles, heavy duty vehicles, and light duty vehicles have been kept constant for all streets with initial values presented in Figure 4a. Following results from a previous study [66], the ratio between NO and NO2 emissions accounts for 10/90. The tree types that have been used for the model simulations are presented in Table 4. Different species have been classified into 6 classes according to their base isoprene emission capacity [µgisoprene g−1leaf h−1].
The trees in the model area feature different base isoprene emission capacities depending on their biological species. Thirty different isoprene emitters have been aggregated to 6 classes (see Table 4). The height and width of the crowns range from 6 m to 32 m in height (indicated by the size of the markers in Figure 5b) and from 3 m to 19 m in width. Overall, about 4000 trees are reported inside the urban center pictured in Figure 5. To isolate the ozone-forming potential of isoprene, no additional background concentrations of O3, NO, and NO2 were used.
Figure 5a shows areas with different traffic intensity for the model domain with color-coding indicating the number of vehicles per 24 h per lane. Different areas can be identified accordingly. We basically find 4 main traffic lines in the urban area along the Rhine river in the eastern part of the domain, indicated by dark red colors, on the opposite western side along the train line, and a further two parallel through-roads can be found in the urban center. The white and unstructured shape in the south-east of the domain represents the old town with almost no traffic and few trees (Figure 5b). In the western part of the town enclosed by three main roads, well-structured urban morphology can be found dating back to an urban planning phase during Wilhelminian times. In total, less than 15% of the urban area can be classified as “green”. Allowing for an easier interpretation and discussion of the results, the orientation within the model domain is simplified to top, bottom, left, and right, keeping in mind that geographical North is directed to the left, tilted about 58° to the West.
3. Results and Discussion
In the following section, we present results for the different approaches in a similar order as in Section 2. Starting with results of the theoretical isoprene/ozone interrelations using the box model, we continue with the discussion of the effects of urban layout onto BVOC emission. In the last step, the results of the real urban environment setup are presented and discussed.
3.1. Box Model
In general, Figure 6 indicates that more NO2 leads to higher production rates of ozone. With the ratio between NO2 and NO getting larger, we find the impact of initial isoprene on ozone concentration less pronounced. For high ratios of 1:1 or 2:1, we find ozone levels significantly depend on the level of initial isoprene concentration, with higher C5H8 leading to more ozone, particularly when increasing the value from 2 to 4 ppb. With a ratio of 10:10, we can yield up to ~18 ppb O3 for the “high isoprene scenario”, keeping in mind that initial ozone concentration is held at zero. With less BVOC (only C5H8 here) available for the conversion of NO2 to Ozone, the O3 yield quickly goes down. Comparing 1a with Figure 6b–f, we find a slower increase in ozone concentration in Figure 6a with sunrise, with only 10 ppb NO2 available for ozone production. Ambient NO can react with RO2 to form additional NO2 (Equation (7)). With more isoprene, more NO2 is being made available as a precursor for ozone formation when NO2 is split into NO and O, according to Equation (3). The free oxygen then quickly combines with atmospheric O2 to form ozone (Equation (4)). At sunset, ozone is depleted quickly for the 2 and the 0.2 ppb scenarios, whereas it remains at about 12 ppb for 4 ppb initial isoprene. With increasing NO2/NO ratio, meaning increasing NO2, the isoprene effect gets less pronounced and the three curves converge from Figure 6b–f. NO2 dominates the formation process. If the ratio increases to (approximately) more than 5:1, the ozone production does not depend on the amount of isoprene anymore, i.e., in a heavily NO2 polluted atmosphere, the selection of tree species with a certain rate of isoprene emission has a minor impact on ozone concentrations and potentially other factors have to be discussed for mitigating potential O3 exceedances. With regard to Figure 6f, however, an increase of NO level does not change the isoprene dependency, but results in a decrease of the overall ozone concentration via Equation (5).
This aspect is also confirmed by mean ozone concentrations (Table 5) for different initial NO2/NO ratios and isoprene concentrations. In order to show that ozone formation in the existing configuration of the box model is only dependent on ambient NO and NO2 concentration, the zero case is included in Table 5. The highest gain in ozone can be expected at a ratio of 0/1, as all NO2 is available for ozone formation. Therefore, NO acts as limiting factor, as it can be seen by the ratio of 2/1 as well. For a more “realistic” scenario with both NO and NO2 existing in ambient air, the highest gain of mean daily O3 is simulated for a ratio of 4:1. As already indicated by Figure 6, the impact of isoprene, however, is most pronounced when both NO and NO2 are available in equal concentrations (10 ppb). Increasing this value to 20 ppb would not increase ozone concentrations any further due to NO limiting the reaction. For a 1:1 ratio, we find twice the ozone concentration when doubling isoprene from 2 to 4 (common values according to observation studies [48]).
Output from the box model shows that an increase of ozone happens under the condition of NOx depletion, which is also directly linked to a loss of isoprene concentration (Figure 7a). At sunrise, NO2 quickly reacts to both NO and O3 until a saturation point is reached at about noon (Figure 7b). From that point, NO2 concentration recovers as it is formed with generated ozone and NO until sunset. In the analogy, NO is reduced from 10 am onwards as it reacts with ozone to form NO2, as explained above. Higher concentrations of isoprene lead to a faster depletion of Nitrate Oxide (Figure 7c). This aspect is reversed for NO2, showing higher values with higher isoprene. As no NOx is recycled in the course of the model period, we find a constant reduction from the pre-defined initial concentration of 30 ppb. With regard to the high isoprene scenario (black curve), the initial value is reduced by about 30% over 24 h, whereas this value in only 15% or 2 ppb and below 10% for the 0.2 ppb scenario. Whereas the two low scenarios remain constant from about 5 pm, we find a significant drop at about sunset in the high isoprene scenario. With the temperature set to a constant of 300 K, the photolysis rate of NO2 itself does not change in the box model. The ozone production is, therefore, only dependent on the NO2/NO ratio and the available amount of BVOC.
The relation between isoprene and ozone concentration and the ozone production rate Ox are presented in Figure 7. Figure 7a,b shows the box model results for a pre-defined isoprene concentration of 4 ppb, with initial O3 being set to zero. At sunrise, ambient isoprene concentration is the precursor for ozone production, as it acts as a “third body substance” for pushing the NOx-cycle out of equilibrium, resulting in a net gain in O3. At about 3 pm, all isoprene is depleted and ozone concentration peaks at about 16 ppb and decreases from there to reside at about 5 ppb in the end of the simulation. The initial NO2/NO ratio is defined as 2:1 in Figure 7a. Figure 7b shows similar trends but with a ratio of 1:1; less NO2 is available for reaction ozone production, leading to a delayed increase in morning concentration. Less NO2 production leads to less free NO in the evening according to Equation (3), which would remove ozone via Equation (5), as seen in Figure 7a. In summary, higher initial NO2 concentration leads to higher ozone production during sunrise, but also higher loss at sunset at a fixed isoprene level of 4 ppb.
Figure 8c presents ozone production rates for varying initial isoprene levels for a NO2/NO ratio of 2:1. Ozone production rates are calculated from the sum of NO2 and ozone. OX represents the total amount of photochemical oxidants, thus providing an indicator of the oxidizing capacity of the atmosphere. The latter is more pronounced when higher amounts of isoprene are available. With half of the isoprene available (2 ppb), the rate of ozone production remains almost constant at about 21 ppb, whereas we find a decreasing diurnal trend when initial isoprene has been set to 0.1 ppb. The results from the box model simulations are consistent with observational studies found in the literature. Bonn et al. (2017) [51] showed similar relative increases of ambient O3 concentrations due to changing BVOC emissions for July, whereas high summer-time ozone concentrations are also reported for urban environments in summer. Mavroidis and Ilia [33] prove the dependency of ozone level on NO2 and NO concentrations with observations and Kesselmeier et al. (1995) [67] highlights tree-type-dependent emission of isoprene. Ozone production rates significantly increase with increased isoprene emissions, which are modified mostly by photosynthetically active radiation and temperature [68]. Observations from Starn et al. (1998) [69] show some evidence that elevated NOx concentration in the vicinity of trees can accelerate isoprene oxidation and concomitant O3 production. The following Section transfers these theoretical considerations into a simplified case study for hypothetical microclimates.
3.2. Microclimate Study
The emission of isoprene as calculated by ENVI-met is dependent on leaf temperature and photosynthetic active radiation (PAR). The latter describes the spectral range of solar radiation from 400 to 700 nm, which is used by photosynthetic organisms in the process of photosynthesis. In a theoretical microclimate, as presented in Section 3.1, we chose single trees with identical properties in four specific locations which are characteristic for a typical morphological setup in a mid-size European urban center. Figure 9a shows the mean leaf surface temperature, whereas Figure 9b considers the average PAR [W/m2] for the entire tree. Compared to the other scenarios, the highest leaf surface temperatures over 30 °C are calculated for an exposed suburban tree facing the southern direction, which also receives the highest amount of PAR compared to the other locations, as it is exposed to direct insolation over the entire model period. Next to direct insolation, an additional percentage of heat is also released from the impervious materials of the surrounded wall area at one side. After slight temperature reduction in the early morning due to evaporative cooling before sunrise, a clear diurnal cycle is to be observed with a maximum amplitude of about 15 °C (Figure 9a). For a park tree in the north eastern part of the model domain, we find significantly lower leaf surface temperature due to a general cooling of the ambient temperature resulting from mutual shadowing, evaporative cooling, and natural ventilation. PAR is about 30% lower for the park tree compared to the exposed street tree in the simulation, which again can be explained with mutual shading as well. Maximum leaf temperature is decreased by 2.1 °C accordingly. Regarding trees located in a semi-enclosed east-west oriented street canyon with roof heights well extending above tree heights, we find relatively high leaf temperatures as well, which comes mostly from heat accumulation and weak mixing in the urban canyon caused by the high percentage of low-reflecting surfaces. The shape of the PAR curve clearly follows the diurnal path of the sun, obtaining fairly high amounts of radiation in the morning and evening hours due to the east-west orientation of the canyon.
During the day, we find maximum shading from the surrounding building structures and the PAR is significantly reduced, resulting in a bimodal curve. Due to limited width of the street canyon (10 m) and the constant building height (25 m) causing relevant shading effects, however, maximum morning and evening PAR reach about 60% less solar energy than the exposed southward facing reference street on the town border. The maximum leaf surface temperature is reduced by 1.5 °C compared to the suburban tree. The photosynthetic active radiation reaching the courtyard tree shows the lowest value compared to the other locations, as we find shading from all cardinal directions. We find a well pronounced diurnal cycle, however, absolute values are significantly reduced compared to the urban canyon and park tree. The leaf temperature reduction is in the order of the park tree, at around 2 °C.
The parameters shown in Figure 9 have significant implications on the isoprene flux intensity for the individual trees. With all trees being the same type, the difference in isoprene emission can be purely related to the prevailing morphological setting. Figure 10 shows the diurnal profile of isoprene flux accumulated over the entire tree [mg tree−1 h−1] for the four scenarios presented in Section 3.3. Both Figure 9a,b imply that it is the interplay between PAR and leaf temperature that controls isoprene emission from the leaf surface, whereas the temperature plays a dominant role, especially in a range of 25 to 35 °C. The isoprene flux for the exposed street reaches about double the amount of the other scenario, whereas the urban canyon tree shows a less pronounced diurnal cycle. The latter can be explained with reduced PAR during the daytime. The lowest isoprene emission is simulated for the park tree, which is mostly attributed to the leaf surface temperature. Comparing temperature and PAR for both courtyard and park tree, it becomes clear that leaf surface temperature is the dominating factor for isoprene emission. The maximum averaged leaf temperature of a courtyard tree is only about 0.5 °C higher than of a tree standing in a park. This small amount, however, seems to be enough, overpowering the effects of PAR.
From Figure 1a,b it can be inferred that we reach threshold values for both variables where their increase no longer results in an increase of isoprene. Since actual isoprene emissions are directly affected by the amount of received PAR and the leaf temperature, several distinct patterns should emerge when examining the simulation results for local isoprene emissions inside the tree canopy. First of all, as grid cells receive different amounts of PAR and are subject to different leaf temperatures, local differences in actual isoprene emissions should be observable between these grid cells. Furthermore, actual isoprene emissions should generally increase with increasing exposure to PAR due to the monotonically increasing effect of photosynthetic active radiation on isoprene emission (Figure 1). However, because of the bell-shaped relationship between leaf temperature and isoprene emission depicted in Figure 1 and described above, expectations are different for the effect of leaf temperature. Here, an increase of actual isoprene emissions is also expected but only until T opt = 312.5 K is reached; for leaf temperatures above this optimum temperature, a decrease of actual isoprene emissions should be visible in the simulation results. With regard to PAR, the threshold value is at about 380 W/m2.
3.3. Case Study Mainz
The urban morphology, presence of NOx emitters, isoprene emission category, and local meteorological conditions are important drivers for the formation and distribution of ozone inside the urban canopy and its city-wide transport. Figure 11 shows the relation between the Euclidean distance to the next isoprene emitter and relative change in ozone concentration for every grid cell between the two model runs over the whole model area in screening height (1.5 m) at 4 pm. The results are generated based on an algorithm developed in the course of the study. It identifies the upwind distance of every grid cell to the next emitter. After finding the closest emitter, the relative difference between the model run, with and without isoprene, is stored. The relation between minimal upwind distance and relative increase of ozone concentration shows a far-reaching effect, even at a distance of 90 m to the isoprene emitter, and the ozone concentration is still increased by more than 200%. Averaged over the model domain, the relative increase of ozone concentration accounts for about 250% between the isoprene and non-isoprene scenario. A clear shortcoming of this approach is that it neither accounts for different emitter classes nor for the real heterogeneity of the urban vegetation cover.
A more detailed spatial analysis of the urban area is needed, accounting for the heterogeneous structure of the urban layout. Three dedicated Special Areas of Interest (SAIs) are selected accordingly (Figure 12b) in order to compare different characteristic urban setups within the area of interest. Vertical cross-sections are also generated for each SAI for two selected time steps (Figure 13).
In the following we present the absolute (Figure 12a) and relative (Figure 12b) effect of isoprene emission on ozone concentration at screen height (1.5 m) for a snapshot at 4 pm for the whole model domain. Wind and cardinal direction are added in the top right corner. As indicated above, bottom to top refers to south-west to north-east. In both parts of Figure 12 we show the difference between a model run with zero isoprene emissions and with the different emission classes, as shown in Table 4. Bright (yellow to red) areas with high absolute effects of isoprene on ozone (Figure 12a) can be found predominantly in the large through-road with a large number and high density of moderate emitters and constant high traffic intensity. Weak winds blow along the main road direction, leading to effects slightly propagating away from the source (e.g., Box B, Figure 12b). Although low in number, the highest emitters, which are found in the lower left corner, have large absolute effects. Especially here, two roads with high intensity traffic and high emitters converge with absolute differences reaching a maximum. This area is characterized by narrow canyons and in addition to constant low wind speed the natural ventilation is weak, meaning isoprene and ozone are trapped. With air and pollutants being trapped and temperature being accumulated inside the canyon, PAR is increased and ozone production is accelerated accordingly (compare Figure 9 and Equations (1) and (3)).
With respect to the relative differences (Figure 12b), a much more diverse result is obtained. New hotspots emerge and the existing ones have been slightly shifted or amplified. The relative effect of single strong emitters per grid cell is much more pronounced than for the absolute values (Figure 12a). Dedicated areas display a relative increase of ozone concentration by 500% compared to a base scenario with zero isoprene emissions (e.g., Box A). These high values are strongly correlated to the presence of class 6 emitters (Table 4) with a maximum isoprene emission capacity above 70 µg g−1 h−1. In this area, we find relatively low traffic intensities and the area that encounters the highest relative increase is defined as open green space, with about 5 trees in the highest emission class. With a constant weak wind of 2 m/s (225°) advecting into the bottom of Box A, emitters are equally distributed in the park, turbulent mixing is low, and highest differences can be found in close proximity to the emitters. In addition, the park is attached to roads with moderate traffic on two sides, leading to weak but constant advection of NOx into the area of interest (about 0.5 m/s mean wind speed), further triggering ozone formation (equations to be found Table 2).
The through-road in the center of Box B appears similar in both Figure 12a,b. Being the widest road in the model domain (17.5 m) and oriented to the main wind direction and covered with a 5 m grass strip in the middle, it is well mixed, and therefore the large number of moderately emitting road trees (class 3 according to Table 4) and constant traffic emission do not have a large impact on relative O3 concentration difference. For both absolute and relative calculation, a hotspot is simulated leeward of the building (height of 27 m) due to generated turbulent wakes and downward draft, mostly in the morning when traffic intensity is high. The impact of the obstacle on turbulent flow can be seen in the vertical structure of relative difference (Figure 13a), with effects propagating along the main direction of the road in the order of double the height of the building. Mean wind speed is about 0.7 m/s, with an almost constant direction. Finally, the green corridor, running through the entire length of the road and separating the traffic lines from each other, provides an additional source of natural ventilation and cooling.
In a third SAI (Box C), large differences between absolute and relative effects are visible. Although characterized by a low density of trees attributed to a low category emitter and almost no direct emissions of road traffic (advection from neighboring streets upwind of the area), the relative increase of ozone concentration amounts to about 400% in this area. Absolute concentrations are low in this area due to the above-mentioned facts. The characteristic morphological features of a Mid-European medieval town with narrow and unstructured roads, however, causes even small absolute concentration changes to trigger large relative effects due to particularly weak ventilation inside the urban canopy. Mean wind speed here is simulated at about 0.25 m/s, with highly varying direction.
To substantiate the goal of providing further advice to applied urban planning, we highlight the interdependency between tree type, location, and traffic intensity, discussing six additional example areas (EAs, Figure 12b), with two roads orientated in upwind and two in cross-wind directions, as well as two parks with different tree types. Doing this, we have to follow a combined analysis of Figure 5a,b.
In a mid-sized park area, with weak traffic intensity in upwind direction, category 4 emitters (Platanus) do not have a large impact on relative ozone concentration (EA1). Only a small number of category 6 emitters (Quercus/Populus Alba) lead to a significant relative increase (EA2), although the general park geometry is similar and the traffic intensity is even less than in EA1. Road EA3 encounters high traffic intensity, but a low number of isoprene emitters actually leads to a low relative increase. The opposite is seen in EA4, where we find low category emitters and low traffic, leading to both low ozone levels in general and low differences, respectively. Interestingly, the cross-wind-oriented road, which orthogonally intersects the main traffic route from Box B, can be divided in two sub-sections (EA5 and EA6) with similar traffic intensity (Figure 5a), however having different numbers of relative ozone increase, with about 300% for EA5 and below 150% for EA6. The reason for this discrepancy can easily be explained by Figure 5b, with a high number of Cat 4 emitters planted to the left and only small Cat 2 emitters to the right, effecting ozone production (Table 4). The road on the bottom of Box C shows that densely planted medium emitters (Figure 5b), combined with moderately polluted environments (Figure 5a), can have long range effects on areas downwind, which themselves are classified by a low number of trees and no significant traffic. Although absolute concentrations are low (see Figure 12a), the relative ozone increases are caused by advection of the NOx and Cat 4 emitters upwind. Due to the high building density, ventilation in this area is weak and ozone gets trapped in the narrow street canyons.
Vertical cross-sections for relative ozone increase are illustrated for the three selected SAIs, as indicated in Figure 12b. This analysis contributes to a holistic understanding of the interrelation between building geometry, air flow, and presence of anthropogenic and biogenic emitters. Accounting for diurnal variation, snapshots of 7 am and 4 pm are presented. These times not only represent the situations with highest emissions (Figure 4b) but also consider typical features of the morning and afternoon circulation in the lower urban boundary layer. All cross-sections are drawn in the direction of the mean wind (Figure 12b). Buildings are displayed in white and color-coding represents an increase of relative ozone concentration between isoprene and non-isoprene case study. In the vertical, cross-sections extend up to a height of 90 m. The horizontal distance varies between 518 m (A), 1275 m (B), and 586 m (C). As indicated above, mean wind speed accounts for 0.5, 0.7, and 0.25 m/s for A, B, and C, respectively.
Cross-section A represents the lower left part of the domain, where we find the highest relative increase of ozone concentration of almost 580%. The urban setup is characterized by a semi-enclosed park connected to roads with moderate traffic. Although low in number, we find the highest isoprene emitters in this area, which explains the overall high levels of ozone increase here. In the morning, when mixing is weak, the highest concentrations accumulate in the lee side, close to the building structure where the air is trapped in downwards directed air flow. Highest values are simulated in the close vicinity to the emitters. In the course of the day (4 pm) the area with highest increase moves to the north-west side of the park, where four category 6 emitters are located. Increased PAR, higher leaf temperatures, and advected pollutants from neighboring roads lead to accelerated isoprene emission, and thus ozone concentration, in this area. Due to weak turbulent convection over the vegetated park area, the highest increases do not extend above building height.
Other than reported for transect A, transect B reveals a more intense vertical exchange of air masses with impacts on relative ozone concentrations extending up to about double the building height. Slight ventilation during the day shifts the high impact area from bottom to top, with absolute values decreasing over the length of the simulation (from 7 am to 4 pm). Even with increased isoprene and traffic-related emission during the day, natural ventilation, which is also enforced by the green strip in the middle of the road, is able to mitigate the negative effects simulated in the morning hours. It can further be observed that the impact is more or less limited by the presence of buildings on both sides of the cross-section.
Other than transect A and B, Section C shows highest relative increase later in the day. The morphological setup of the urban area differs from the other hotspots and only a small number of low category emitters exist, and direct anthropogenic emission is minor due to limited traffic allowance in the old town. Therefore, NOx and isoprene have to be advected in the course of the day before positive impact on ozone concentration settle in. Dominated by its characteristic architectural design, only one area is wide enough to allow accumulation of enough precursors to actually lead to high relative increase of ozone there. Effects propagate well above the building height, tilted along the main wind direction. We find the results from Section 3 to be consistent with recent air pollution modeling studies in this context [25,46].
4. Conclusions
Rather than analyzing thermal effects of urban greening on the urban microclimate [70] or the impact of anthropogenic emissions on urban air quality individually [71], this study presents a combined investigation of both aspects together. Differing from previous mesoscale [25] and idealized modeling studies [44], as well as stand-alone box models [51], we undertake a combined analysis of different approaches. The originality of this work is reflected by linking theoretical understanding of fundamental processes and practical application for real urban environments in one study.
Our study shows that certain tree types can indeed be harmful for local air quality during periods of extensive heat and weak winds. Whenever there are enough pollutants available, emitted isoprene can act as an agent for ozone production. This process is highly dependent on the location inside an urban area and that biological parameters, such as leaf temperature and received photosynthetically active radiation, control isoprene emission capacity as well.
Combining the isoprene-ozone effects with urban heat island research regarding sustainability of vegetation in urban environments (especially climate change) is an important task. On the applied side. both Cat 6 emitters (Quercus and Populus Alba) are recommended for urban planning regarding their drought resistance hardiness, but proved to be very similar to a very popular urban tree in central and south European cities—Platanus × acerifolia, a main contributor to tropospheric ozone [72].
We do need heat resilient trees (such as Platanus), however, it does not help if these species (like Platanus) feature a relatively high isoprene emission capacity. We are looking for low isoprene emitters that still have a low isoprene capacity—especially close to the NOx sources. According to our tree inventory and from looking at the literature (CiTree Database [73]), Tilia and Robinus, for instance, seem to be much more viable options in the urban context when considering not only heat and soil water resistances but also isoprene emissions.
Potential shortcomings are the use of standardized meteorological conditions and constant wind speed and direction, however, we do not aim for detailed evaluation of our model setup against observations, but want to show the general dependencies and interactions that exist in a real urban environment on a typical summer day. Findings of Simon et al. (2018) [74] indeed indicate that ENVI-met in this configuration is capable of simulating transpiration rates and leaf temperatures of trees in complex urban environments when compared to local measurements.
Finally, we conclude that urban planning needs to consider an appropriate selection of tree types in order to prevent negative effects that might arise during hot summer days. It is important to account for the isoprene emission potential of the specific tree alone, but one also needs to include the general urban setup that a tree is embedded in. As this study shows, this has to include building geometry, architectural design, traffic profiles, and microclimatic conditions.
We point out that urban greening should remain one of the core strategies to mitigate heat stress in urban areas, but tree types and location should be planned carefully to have the most sustainable effect on air quality as well. Most importantly, sustainable urban planning needs to coincide with emission regulations, which also need to involve intelligent public transport solutions in order to guarantee the well-being of urban dwellers in a changing climate.
Future modelling systems should serve several tasks. On the one hand, they should account for detailed representation of fundamental processes and the manifold heterogeneity of urban areas. On the other hand, one should aim to keep the system simple enough to be applied by local stakeholders.
Author Contributions
H.S., J.F., and T.K., conceptualization. H.S. and J.F., methodology. T.K., J.F., H.S., and M.B., software. H.S., J.F., and T.K., validation. J.F., H.T., H.S., T.K., and M.B., formal analysis. J.F., T.K., H.S., H.T., and M.B., investigation. J.F., H.S., and T.K., writing. M.B. and H.T., review and editing.
Funding
This research received no external funding.
Acknowledgments
The Authors thank the Municipality of Mainz “Grün und Umweltamt” for providing the GIS data for the microclimate simulations.
Conflicts of Interest
The authors declare no conflict of interest.
References
- Bowler, D.E.; Buyung-Ali, L.; Knight, T.M.; Pullin, A.S. Urban greening to cool towns and cities: A systematic review of the empirical evidence. Landsc. Urban Plan. 2011, 97, 147–155. [Google Scholar] [CrossRef]
- Norton, B.A.; Coutts, A.M.; Livesley, S.J.; Harris, R.J.; Hunter, A.M.; Williams, N.S.G. Planning for cooler cities: A framework to prioritise green infrastructure to mitigate high temperatures in urban landscapes. Landsc. Urban Plan. 2015, 134, 127–138. [Google Scholar] [CrossRef]
- Janhäll, S. Review on urban vegetation and particle air pollution—Deposition and dispersion. Atmos. Environ. 2015, 105, 130–137. [Google Scholar] [CrossRef]
- Sgrigna, G.; Saebo, A.; Gawronski, S.; R, P.; Calfapiet, C. Particulate Matter deposition on Quercus ilex leaves in an industrial city of central Italy. Environ. Pollut. 2015, 197, 187–194. [Google Scholar] [CrossRef] [PubMed]
- Song, Y.; Maher, B.A.; Li, F.; Wang, X.; Sun, X.; Zhang, H. Particulate matter deposited on leaf of five evergreen species in Beijing, China: Source identification and size distribution. Atmos. Environ. 2015, 105, 53–60. [Google Scholar] [CrossRef] [Green Version]
- Abhijith, K.V.; Kumar, P.; Gallagher, J.; McNabola, A.; Baldauf, R.; Pilla, F.; Broderick, B.; Di Sabatino, S.; Pulvirenti, B. Air pollution abatement performances of green infrastructure in open road and built-up street canyon environments—A review. Atmos. Environ. 2017, 162, 71–86. [Google Scholar] [CrossRef]
- Andersson-Sköld, Y.; Thorsson, S.; Rayner, D.; Lindberg, F.; Janhäll, S.; Jonsson, A.; Mobacke, U.; Bergman, R.; Granberg, M. An integrated method for assessing climate-related risks and adaptation alternatives in urban areas. Clim. Risk Manag. 2015, 7, 31–50. [Google Scholar] [CrossRef] [Green Version]
- Phelan, P.E.; Kaloush, K.; Miner, M.; Golden, J.; Phelan, B.; Silva III, H.; Taylor, R.A. Urban Heat Island: Mechanisms, Implications, and Possible Remedies. Annu. Rev. Environ. Resour. 2015, 40, 285–307. [Google Scholar] [CrossRef]
- Salata, F.; Golasi, I.; de Lieto Vollaro, A.; de Lieto Vollaro, R. How high albedo and traditional buildings’ materials and vegetation affect the quality of urban microclimate. A case study. Energy Build. 2015, 99, 32–49. [Google Scholar] [CrossRef]
- Eppel, J.; Sander, G.; Schönfeld, P.; Körber, K.; Böll, S. Projekt Stadtgrün 2021—Selektion, Anzucht und Verwendung von Gehölzen unter sich ändernden klimatischen Bedingungen; Bayerische Landesanstalt für Weinbau und Gartenbau: Veitshöchheim, Germany, 2012. [Google Scholar]
- Larcher, W. Physiological Plant Ecology, 4th ed.; Springer: Berlin/Heidelberg, Germany, 2004. [Google Scholar]
- Savi, T.S.; Bertuzzi, S.; Branca, M.; Tretiach, M.; Nardini, A. Drought-induced xylem cavitation and hydraulic deterioration: Risk factors for urban trees under climate change? New Phytol. 2015, 205, 1106–1116. [Google Scholar] [CrossRef]
- Dimoudi, A.; Nikolopoulou, M. Vegetation in the urban environment: Microclimatic analysis and benefits. Energy Build. 2003, 35, 69–76. [Google Scholar] [CrossRef]
- Honjo, T.; Takakura, T. Simulation of thermal effects of urban green areas on their surrounding areas. Energy Build. 1990, 15, 443–446. [Google Scholar] [CrossRef]
- Robitu, M.; Musy, M.; Inard, C.; Groleau, D. Modeling the influence of vegetation and water pond on urban microclimate. Sol. Energy 2006, 80, 435–447. [Google Scholar] [CrossRef]
- Susca, T.; Gaffin, S.R.; Dell’Osso, G.R. Positive effects of vegetation: Urban heat island and green roofs. Environ. Pollut. 2011, 159, 2119–2126. [Google Scholar] [CrossRef] [PubMed]
- Vinet, J.; Raymond, F.; Inard, C. A simulation tool to assess the impact of vegetation on the urban microclimate. In Proceedings of the IBPC 2000 International Building Physics Conference, Eindhoven, The Netherlands, 18–21 September 2000; pp. 637–644. [Google Scholar]
- Wilmers, F. Effects of vegetation on urban climate and buildings. Energy Build. 1990, 15, 507–514. [Google Scholar] [CrossRef]
- Ali-Toudert, F.; Mayer, H. Effects of asymmetry, galleries, overhanging façades and vegetation on thermal comfort in urban street canyons. Sol. Energy 2007, 81, 742–754. [Google Scholar] [CrossRef]
- Lee, H.; Mayer, H.; Chen, L. Contribution of trees and grasslands to the mitigation of human heat stress in a residential district of Freiburg, Southwest Germany. Landsc. Urban Plan. 2016, 148, 37–50. [Google Scholar] [CrossRef]
- Oliveira, S.; Andrade, H.; Vaz, T. The cooling effect of green spaces as a contribution to the mitigation of urban heat: A case study in Lisbon. Build. Environ. 2011, 46, 2186–2194. [Google Scholar] [CrossRef]
- Salmond, J.A.; Tadaki, M.; Vardoulakis, S.; Arbuthnott, K.; Coutts, A.; Demuzere, M.; Dirks, K.N.; Heaviside, C.; Lim, S.; Macintyre, H.; et al. Health and climate related ecosystem services provided by street trees in the urban environment. Environ. Health 2016, 15, S36. [Google Scholar] [CrossRef]
- Ferrini, F.; van den Bosch, C.C.K.; Fini, A. Routledge Handbook of Urban Forestry; Taylor & Francis: Abingdon, UK, 2017; ISBN 978-1-317-23703-7. [Google Scholar]
- Cohen, A.J.; Anderson, H.R.; Ostro, B.; Pandey, K.D.; Krzyzanowski, M.; Künzli, N.; Gutschmidt, K.; Pope, C.A.; Romieu, I.; Samet, J.M.; et al. Urban Air Pollution. In Global and Regional Burden of Diseases Attributable to Selected Major Risk Factors; Ezzati, M., Lopez, A.D., Rodgers, A., Murray, C.J.L., Eds.; World Health Organisation: Geneva, Switzerland, 2004; pp. 1354–1434. [Google Scholar]
- Churkina, G.; Kuik, F.; Bonn, B.; Lauer, A.; Grote, R.; Tomiak, K.; Butler, T.M. Effect of VOC Emissions from Vegetation on Air Quality in Berlin during a Heatwave. Environ. Sci. Technol. 2017, 51, 6120–6130. [Google Scholar] [CrossRef] [PubMed]
- Bell, M.L.; McDermott, A.; Zeger, S.L.; Samet, J.M.; Dominici, F. Ozone and mortality in 95 US urban communities. J. Am. Med. Assoc. 2004, 292, 2372–2378. [Google Scholar] [CrossRef] [PubMed]
- Bell, M.L.; Goldberg, R.; Hogrefe, C.; Kinney, P.L.; Knowlton, K.; Lynn, B.; Rosenthal, J.; Rosenzweig, C.; Patz, J.A. Climate change, ambient ozone, and health in 50 US cities. Clim. Chang. 2007, 82, 61–76. [Google Scholar] [CrossRef]
- Gryparis, A.; Forsberg, B.; Katsouyanni, K.; Analitis, A.; Touloumi, G.; Schwartz, J.; Samoli, E.; Medina, S.; Anderson, H.R.; Niciu, E.M.; et al. Acute effects of ozone on mortality from the air pollution and health: A European approach project. Am. J. Respir. Crit. Care Med. 2004, 170, 1080–1087. [Google Scholar] [CrossRef] [PubMed]
- Ito, K.; De Leon, S.F.; Lippmann, M. Associations between Ozone and Daily Mortality: Analysis and Meta-Analysis. Epidemiology 2005, 16, 446–457. [Google Scholar] [CrossRef] [PubMed]
- Mudway, I.S.; Kelly, F.J. Ozone and the lung: A sensitive issue. Mol. Asp. Med. 2000, 21, 1–48. [Google Scholar] [CrossRef]
- Seinfeld, J.H.; Pandis, S.N. Atmospheric Chemistry and Physics: From Air Pollution to Climate Change; John Wiley & Sons: Hoboken, NJ, USA, 2016; ISBN 978-1-118-94740-1. [Google Scholar]
- Fischer, H.; Bozem, H.; Lelieveld, J. Die photochemische Produktion von Ozon in der Troposphäre. In Jahrbuch 2011; Max-Planck-Institut für Chemie: Mainz, Germany, 2011; Volume 1, pp. 1–6. [Google Scholar]
- Mavroidis, I.; Ilia, M. Trends of NOx, NO2 and O3 concentrations at three different types of air quality monitoring stations in Athens, Greece. Atmos. Environ. 2012, 63, 135–147. [Google Scholar] [CrossRef]
- Agudelo-Castaneda, D.M.; Calesso Teixeira, E.; Norte Pereira, F. Time–series analysis of surface ozone and nitrogen oxides concentrations in an urban area at Brazil. Atmos. Pollut. Res. 2014, 5, 411–420. [Google Scholar] [CrossRef] [Green Version]
- Lin, C.; Feng, X.; Heal, M.R. Temporal persistence of intra-urban spatial contrasts in ambient NO2, O3 and Ox in Edinburgh, UK. Atmos. Pollut. Res. 2016, 7, 734–741. [Google Scholar] [CrossRef] [Green Version]
- Pancholi, P.; Kumar, A.; Bikundia, D.S.; Chourasiya, S. An observation of seasonal and diurnal behavior of O3–NOx relationships and local/regional oxidant (OX = O3 + NO2) levels at a semi-arid urban site of western India. Sustain. Environ. Res. 2018, 28, 79–89. [Google Scholar] [CrossRef]
- Guenther, A.; Karl, T.; Harley, P.; Wiedinmeyer, C.; Palmer, P.I.; Geron, C. Estimates of global terrestrial isoprene emissions using MEGAN (Model of Emission of Gases and Aerosols from Nature). Atmos. Chem. Phys. 2006, 6, 3181–3210. [Google Scholar] [CrossRef]
- Sharkey, T.D.; Wiberly, A.E.; Donohue, A.R. Isoprene emission from plants: Why and how. Ann. Bot. 2008, 101, 5–18. [Google Scholar] [CrossRef] [PubMed]
- Calfapietra, C.; Fares, S.; Manes, F.; Morani, A.; Sgrigna, G.; Loreto, F. Role of Biogenic Volatile Organic Compounds (BVOC) emitted by urban trees on ozone concentration in cities: A review. Environ. Pollut. 2013, 183, 71–80. [Google Scholar] [CrossRef] [PubMed]
- Guenther, A.B.; Zimmermann, P.R.; Harley, P.C. Isoprene and Monoterpene Emission Rate Variability: Model Evaluations and Sensitivity Analyses. J. Geophys. Res. 1993, 98, 12609–12617. [Google Scholar] [CrossRef]
- Guenther, A.B.; Hewitt, N.C.; Erickson, D.; Fall, R.; Geron, C.; Graedel, T.; Harley, P.; Klinger, L.; Lerdau, M.; McKay, W.A.; et al. A global model of natural volatile organic compound emissions. J. Geophys. Res. 1995, 100, 8873–8892. [Google Scholar] [CrossRef]
- Guenther, A.; Baugh, B.; Brasseur, G.; Greenberg, J.; Harley, P.; Klinger, L.; Serca, D.; Vierling, L. Isoprene emission estimates and uncertainties for the central African EXPRESSO study domain. J. Geophys. Res. 1999, 104, 30625–30639. [Google Scholar] [CrossRef] [Green Version]
- Sadiq, M.; Tai, A.P.K.; Lombardozzi, D.; Val Martin, M. Effects of ozone–vegetation coupling on surface ozone air quality via biogeochemical and meteorological feedbacks. Atmos. Chem. Phys. 2017, 17, 3055–3066. [Google Scholar] [CrossRef] [Green Version]
- Chatani, S.; Okumura, M.; Shimadera, H.; Yamaji, K.; Kitayama, K.; Matsunaga, S. Effects of a Detailed Vegetation Database on Simulated Meteorological Fields, Biogenic VOC Emissions, and Ambient Pollutant Concentrations over Japan. Atmosphere 2018, 9, 179. [Google Scholar] [CrossRef]
- Ren, Y.; Qu, Z.; Du, Y.; Xu, R.; Ma, D.; Yang, G.; Shi, Y.; Fan, X.; Tani, A.; Guo, P.; et al. Air quality and health effects of biogenic volatile organic compounds emissions from urban green spaces and the mitigation strategies. Environ. Pollut. 2017, 230, 849–861. [Google Scholar] [CrossRef]
- Kuik, F.; Lauer, A.; Churkina, G.; Denier van der Gon, H.A.C.; Fenner, D.; Mar, K.A.; Butler, T.M. Air quality modelling in the Berlin–Brandenburg region using WRF-Chem v3.7.1: Sensitivity to resolution of model grid and input data. Geosci. Model Dev. 2016, 9, 4339–4363. [Google Scholar] [CrossRef]
- Fantozzi, F.; Monaci, F.; Blanusa, T.; Bargagli, R. Spatio-temporal variations of ozone and nitrogen dioxide concentrations under urban trees and in a nearby open area. Urban Clim. 2015, 12, 119–127. [Google Scholar] [CrossRef]
- Wagner, P.; Kuttler, W. Biogenic and anthropogenic isoprene in the near-surface urban atmosphere—A case study in Essen, Germany. Sci. Total Environ. 2014, 475, 104–115. [Google Scholar] [CrossRef]
- Fallmann, J.; Forkel, R.; Emeis, S. Secondary effects of urban heat island mitigation measures on air quality. Atmos. Environ. 2016, 125, 199–211. [Google Scholar] [CrossRef] [Green Version]
- Buccolieri, R.; Santiago, J.-L.; Rivas, E.; Sáanchez, B. Reprint of: Review on urban tree modelling in CFD simulations: Aerodynamic, deposition and thermal effects. Urban For. Urban Green. 2019, 37, 56–64. [Google Scholar] [CrossRef]
- Bonn, B.; Kreuzwieser, J.; Sander, F.; Yousefpour, R.; Baggio, T.; Adewale, O. The Uncertain Role of Biogenic VOC for Boundary-Layer Ozone Concentration: Example Investigation of Emissions from Two Forest Types with a Box Model. Climate 2017, 5, 78. [Google Scholar] [CrossRef]
- Bonn, B.; von Schneidemesser, E.; Butler, T.; Churkina, G.; Ehlers, C.; Grote, R.; Klemp, D.; Nothard, R.; Schäfer, K.; von Stülpnagel, A.; et al. Impact of vegetative emissions on urban ozone and biogenic secondary organic aerosol: Box model study for Berlin, Germany. J. Clean. Prod. 2018, 176, 827–841. [Google Scholar] [CrossRef]
- Stockwell, W.R.; Kirchner, F.; Kuhn, M.; Seefeld, S. A new mechanism for regional atmospheric chemistry modeling. J. Geophys. Res. Atmos. 1997, 102, 25847–25879. [Google Scholar] [CrossRef] [Green Version]
- Bruse, M.; Fleer, H. Simulating Surface Plant Air Interactions inside Urban Environments with a Three Dimensional Numerical Model. Environ. Model. Softw. 1998, 13, 373–384. [Google Scholar] [CrossRef]
- Simon, H. Modeling Urban Microclimate: Development, Implementation and Evaluation of New and Improved Calculation Methods for the Urban Microclimate Model ENVI-Met. Ph.D. Thesis, Universitätsbibliothek Mainz, Mainz, Germany, 2016. [Google Scholar]
- Finlayson-Pitts, B.J.; Pitts, J.N., Jr. Chemistry of the Upper and Lower Atmosphere: Theory, Experiments, and Applications; Elsevier: Amsterdam, The Netherlands, 1999; ISBN 978-0-08-052907-3. [Google Scholar]
- Guerreiro, C. Air Quality in Europe—2013 Report; European Environment Agency: Copenhagen, Denmark, 2013. [Google Scholar]
- Paulot, F.; Crounse, J.D.; Kjaergaard, H.G.; Kroll, J.H.; Seinfeld, J.H.; Wennberg, P.O. Isoprene photooxidation: New insights into the production of acids and organic nitrates. Atmos. Chem. Phys. 2009, 9, 1479–1501. [Google Scholar] [CrossRef]
- Sander, R.; Baumgaertner, A.; Gromov, S.; Harder, H.; Jöckel, P.; Kerkweg, A.; Kubistin, D.; Regelin, E.; Riede, H.; Sandu, A.; et al. The atmospheric chemistry box model CAABA/MECCA-3.0. Geosci. Model Dev. 2011, 4, 373–380. [Google Scholar] [CrossRef] [Green Version]
- Stockwell, W.R.; Middleton, P.; Chang, J.S.; Tang, X. The second generation regional acid deposition model chemical mechanism for regional air quality modeling. J. Geophys. Res. Atmos. 1990, 95, 16343–16367. [Google Scholar] [CrossRef]
- Wong, M.S.; Sarker, L.R.; Nichol, J.; Lee, S.-C.; Chen, H.; Wan, Y.; Chan, P.W. Modeling BVOC isoprene emissions on a GIS and remote sensing database. Int. J. Appl. Earth Obs. Geoinf. 2013, 21, 66–77. [Google Scholar] [CrossRef]
- Sharkey, T.; Singsaas, E.L.; Lerdau, M.T.; Geron, C.D. Weather effects on isoprene emission capacity and applications in emission algorithms. Ecol. Soc. Am. 1999, 9, 1132–1137. [Google Scholar] [CrossRef]
- Bruse, M. ENVI-Met Implementation of the Gas/Particle Dispersion and Deposition Model PDDM. Available online: http://envi-met.com/documents/sources.PDF (accessed on 13 April 2015).
- Berkowicz, R.; Ketzel, M.; Lofstrom, P.; Rordam-Olesen, H. NO2 Chemistry Scheme in OSPM and Other Danish Models. 2011. Available online: https://www2.dmu.dk/AtmosphericEnvironment/Docs/NO2scheme.pdf (accessed on 13 April 2015).
- Environmental Protection Agency of Germany. The Handbook of Emission Factors for Road Transport (HBEFA); Infras: Dessau-Roßlau, Germany, 2017; Available online: http://www.hbefa.net/d/index.html?hbefa/allgemeines.html~inhael (accessed on 13 April 2015).
- Carslaw, D. Evidence of an increasing NO/NO emissions ratio from road traffic emissions. Atmos. Environ. 2005, 39, 4793–4802. [Google Scholar] [CrossRef]
- Kesselmeier, J.; Schäfer, L.; Ciccioli, P.; Brancaleoni, E.; Cecinato, A.; Frattoni, M.; Foster, P.; Jacob, V.; Denis, J.; Fugit, J.L.; et al. Emission of monoterpenes and isoprene from a Mediterranean oak species Quercus ilex L. measured within the BEMA (Biogenic Emissions in the Mediterranean Area) project. Atmos. Environ. 1996, 30, 1841–1850. [Google Scholar] [CrossRef]
- Curtis, A.J.; Helmig, D.; Baroch, C.; Daly, R.; Davis, S. Biogenic volatile organic compound emissions from nine tree species used in an urban tree-planting program. Atmos. Environ. 2014, 95, 634–643. [Google Scholar] [CrossRef]
- Starn, T.K.; Shepson, P.B.; Bertman, S.B.; White, J.S.; Splawn, B.G.; Riemer, D.D.; Zika, R.G.; Olszyna, K. Observations of isoprene chemistry and its role in ozone production at a semirural site during the 1995 Southern Oxidants Study. J. Geophys. Res. Atmos. 1998, 103, 22425–22435. [Google Scholar] [CrossRef] [Green Version]
- Zhao, Q.; Sailor, D.J.; Wentz, E.A. Impact of tree locations and arrangements on outdoor microclimates and human thermal comfort in an urban residential environment. Urban For. Urban Green. 2018, 32, 81–91. [Google Scholar] [CrossRef]
- Gulia, S.; Shiva Nagendra, S.M.; Khare, M.; Khanna, I. Urban air quality management-A review. Atmos. Pollut. Res. 2015, 6, 286–304. [Google Scholar] [CrossRef] [Green Version]
- Roloff, A.; Korn, S.; Gillner, S. The Climate-Species-Matrix to select tree species for urban habitats considering climate change. Urban For. Urban Green. 2009, 8, 295–308. [Google Scholar] [CrossRef]
- Vogt, J.; Gillner, S.; Hofmann, M.; Tharang, A.; Dettmann, S.; Gerstenberg, T.; Schmidt, C.; Gebauer, H.; Van de Riet, K.; Berger, U.; et al. Citree: A database supporting tree selection for urban areas in temperate climate. Landsc. Urban Plan. 2017, 157, 14–25. [Google Scholar] [CrossRef]
- Simon, H.; Lindén, J.; Hoffmann, D.; Braun, P.; Bruse, M.; Esper, J. Modeling transpiration and leaf temperature of urban trees—A case study evaluating the microclimate model ENVI-met against measurement data. Landsc. Urban Plan. 2018, 174, 33–40. [Google Scholar] [CrossRef]
Figure 1.
(a) Isoprene emission dependence on photosynthetic active radiation; x-Axis = photosynthetic active radiation in µmol m−2 s−1, y-Axis = normalized isoprene emission for ; and (b) isoprene emission dependence on leaf temperature; x-Axis = leaf temperature in Kelvin, y-Axis = normalized isoprene emission for .

Figure 2.
(a) Model domain for the microclimatic scenarios: (1) Park, (2) Courtyard, (3) Urban Canyon, and (4) Suburban; and (b) calculated sky view factor for different grid cells.
Figure 2.
(a) Model domain for the microclimatic scenarios: (1) Park, (2) Courtyard, (3) Urban Canyon, and (4) Suburban; and (b) calculated sky view factor for different grid cells.

Figure 3.
Diurnal profile of (a) air temperature, specific humidity, and (b) shortwave and longwave radiation.
Figure 3.
Diurnal profile of (a) air temperature, specific humidity, and (b) shortwave and longwave radiation.

Figure 4.
(a) Standard classification of vehicle types for a mid-sized European town used for the simulations and (b) predefined diurnal profile of NO/NO2 emissions used for the simulations [65].
Figure 4.
(a) Standard classification of vehicle types for a mid-sized European town used for the simulations and (b) predefined diurnal profile of NO/NO2 emissions used for the simulations [65].

Figure 5.
(a) Model domain 7.5 km with road traffic and (b) tree inventory where data was available. Tree species classified in 6 categories according to their base isoprene emission capacity [µgisoprene g−1leaf h−1] (Table 4).
Figure 5.
(a) Model domain 7.5 km with road traffic and (b) tree inventory where data was available. Tree species classified in 6 categories according to their base isoprene emission capacity [µgisoprene g−1leaf h−1] (Table 4).

Figure 6.
Simulated ozone concentrations for three different initial isoprene concentrations and six different NO2/NO-ratios (a–f).
Figure 6.
Simulated ozone concentrations for three different initial isoprene concentrations and six different NO2/NO-ratios (a–f).

Figure 7.
The 24 h simulated concentration for (a) NOx, (b) NO2, and (c) NO for varying initial isoprene concentrations.
Figure 7.
The 24 h simulated concentration for (a) NOx, (b) NO2, and (c) NO for varying initial isoprene concentrations.

Figure 8.
Diurnal variation of ozone (grey) and isoprene (black) for (a) NO2/NO ratio of 2:1 and (b) ratio of 1:1, and (c) amount of photochemical oxidants OX (O2 + NO2).
Figure 8.
Diurnal variation of ozone (grey) and isoprene (black) for (a) NO2/NO ratio of 2:1 and (b) ratio of 1:1, and (c) amount of photochemical oxidants OX (O2 + NO2).

Figure 9.
Diurnal simulated profile of (a) leaf surface temperature and (b) PAR for four scenarios.

Figure 10.
Diurnal simulated profile of isoprene emission capacity for 4 scenarios.

Figure 11.
Relation between distance to emitter and relative change in ozone concentration with respect to the whole model domain at 4 pm.
Figure 11.
Relation between distance to emitter and relative change in ozone concentration with respect to the whole model domain at 4 pm.

Figure 12.
Model domain of 7.5 km with (a) absolute and (b) relative difference in ozone concentration at screen height. White boxes in (b) indicate three special areas of interest (SAI) and six example areas (EAs). Red dotted lines indicate cross-sections to be analyzed.
Figure 12.
Model domain of 7.5 km with (a) absolute and (b) relative difference in ozone concentration at screen height. White boxes in (b) indicate three special areas of interest (SAI) and six example areas (EAs). Red dotted lines indicate cross-sections to be analyzed.

Figure 13.
Cross-section, as indicated in Figure 12b, for relative change in ozone for (a) Box A, (b) Box B, and (c) Box C for (left) 7 am and (right) 4 pm, with white areas representing buildings and a horizontal distance of 1200 points and a vertical distance of 90 m.
Figure 13.
Cross-section, as indicated in Figure 12b, for relative change in ozone for (a) Box A, (b) Box B, and (c) Box C for (left) 7 am and (right) 4 pm, with white areas representing buildings and a horizontal distance of 1200 points and a vertical distance of 90 m.


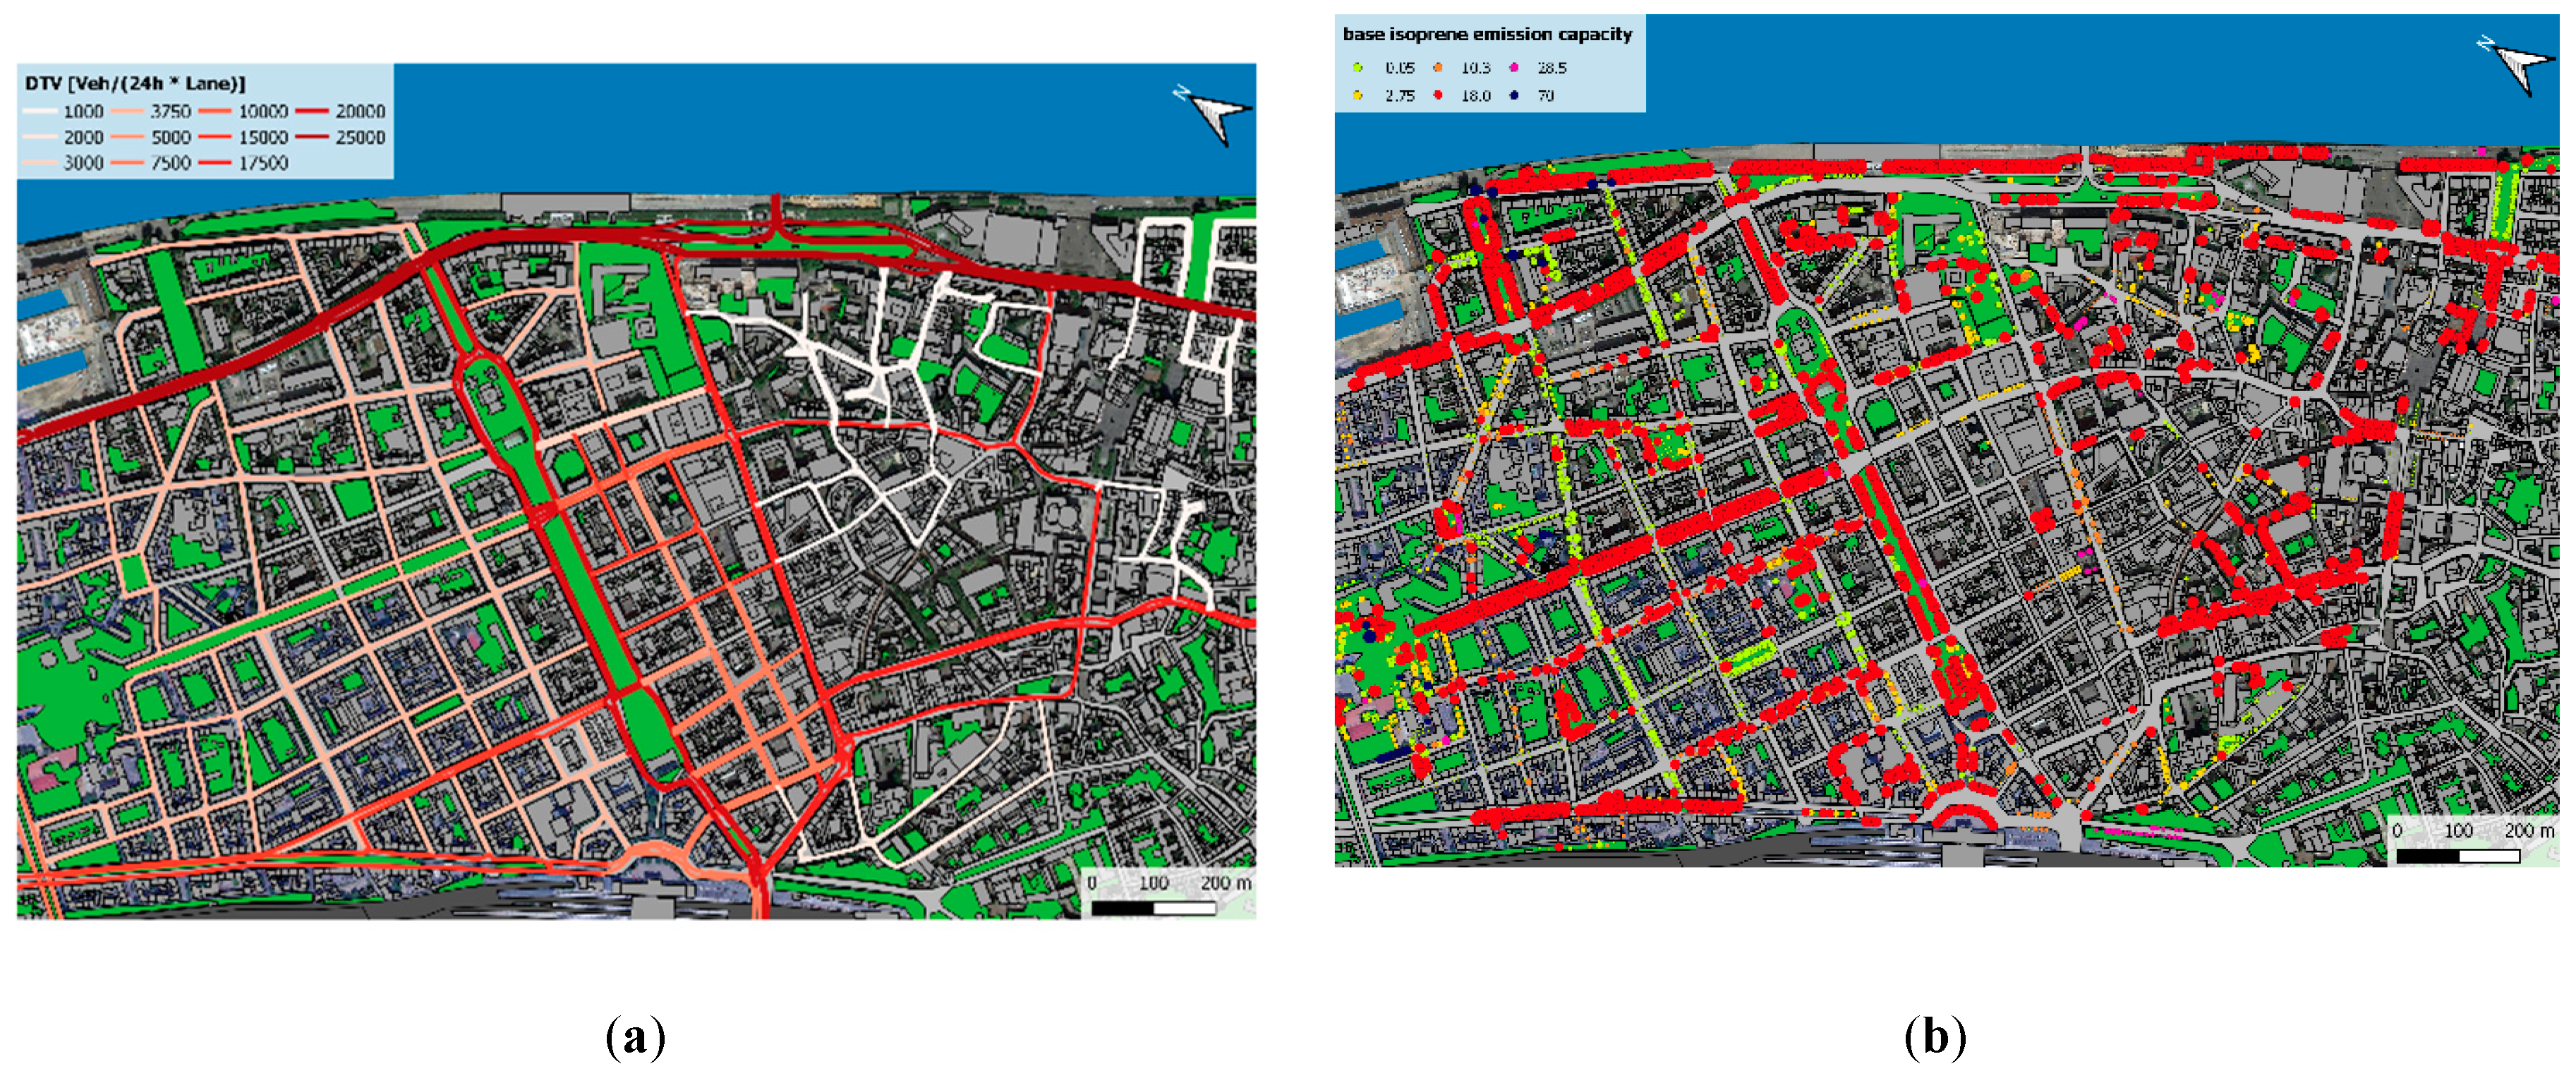
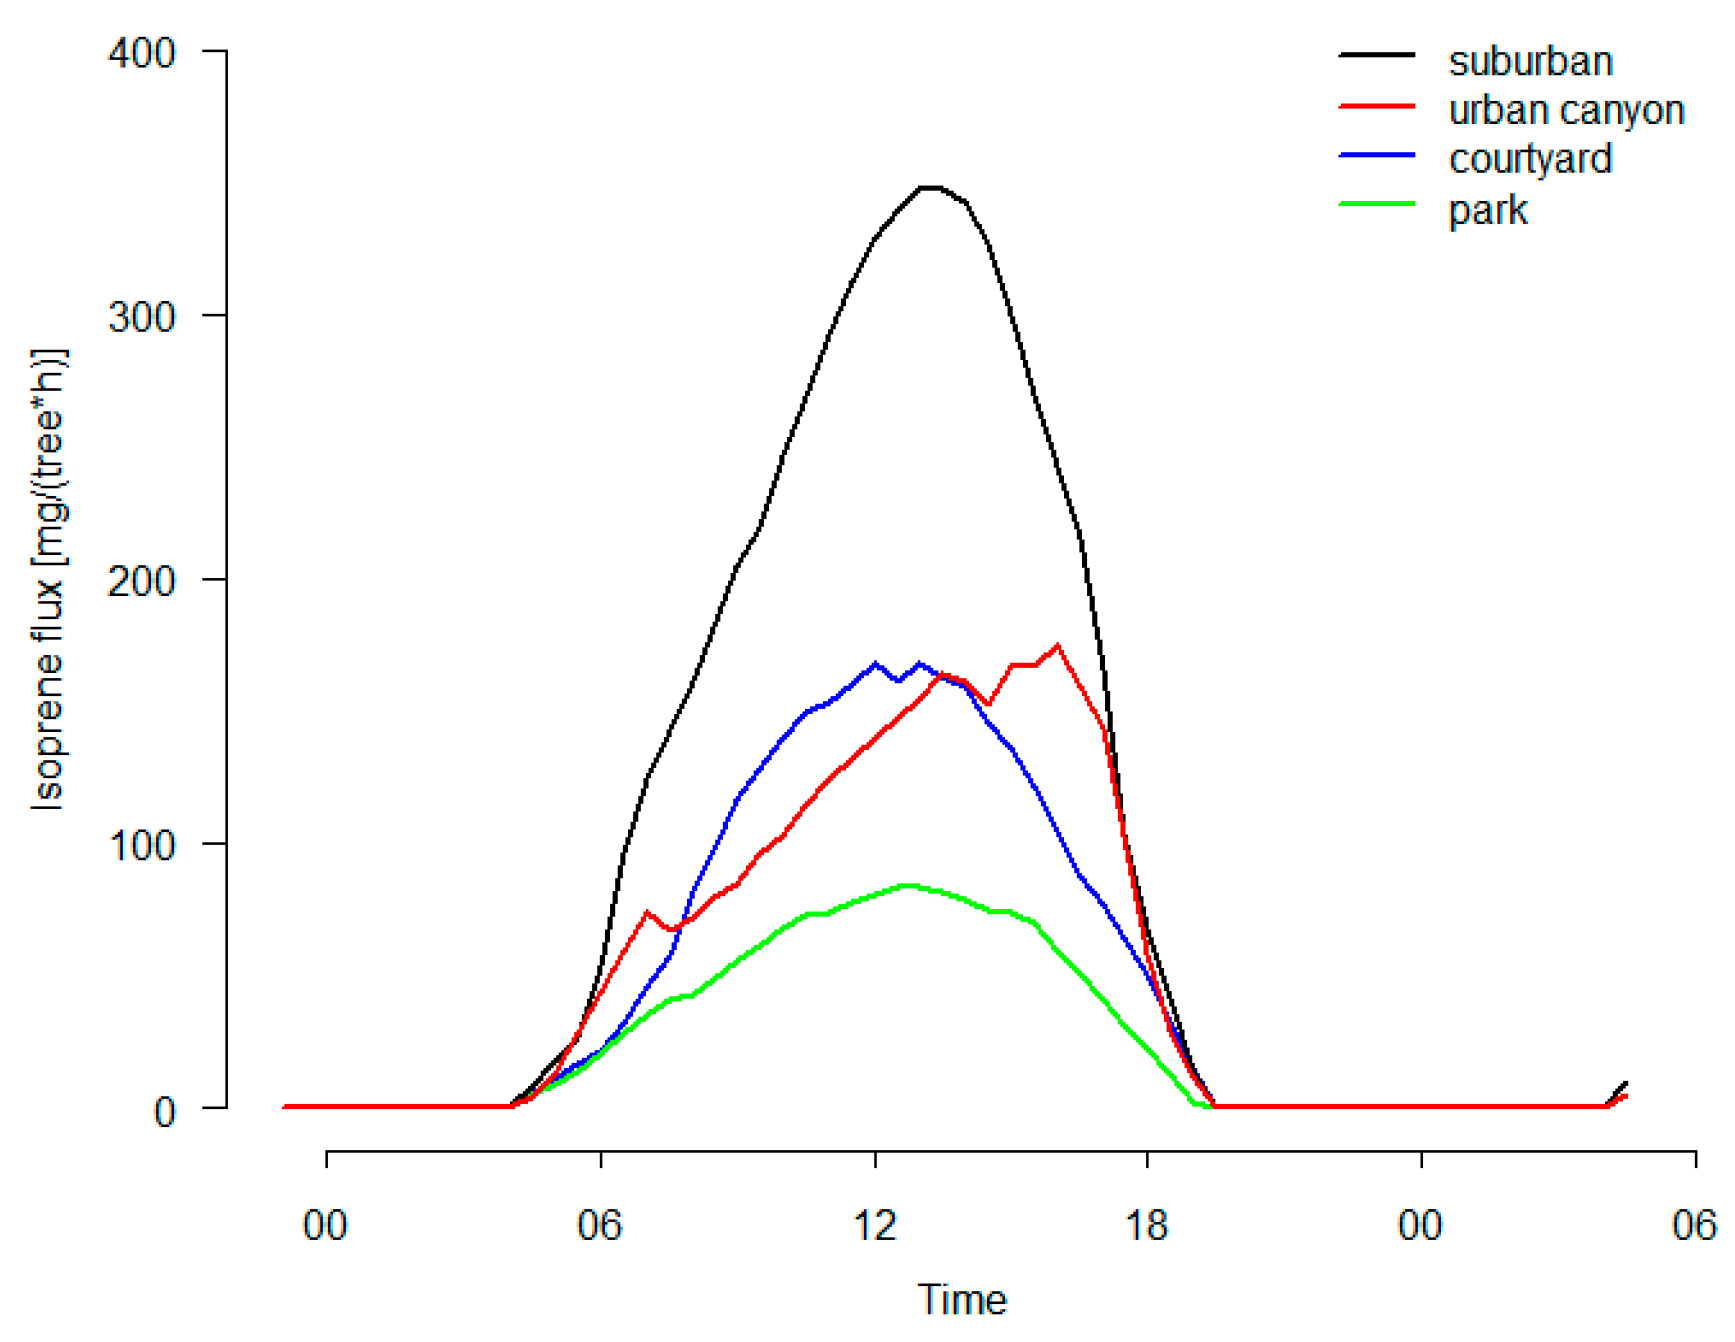
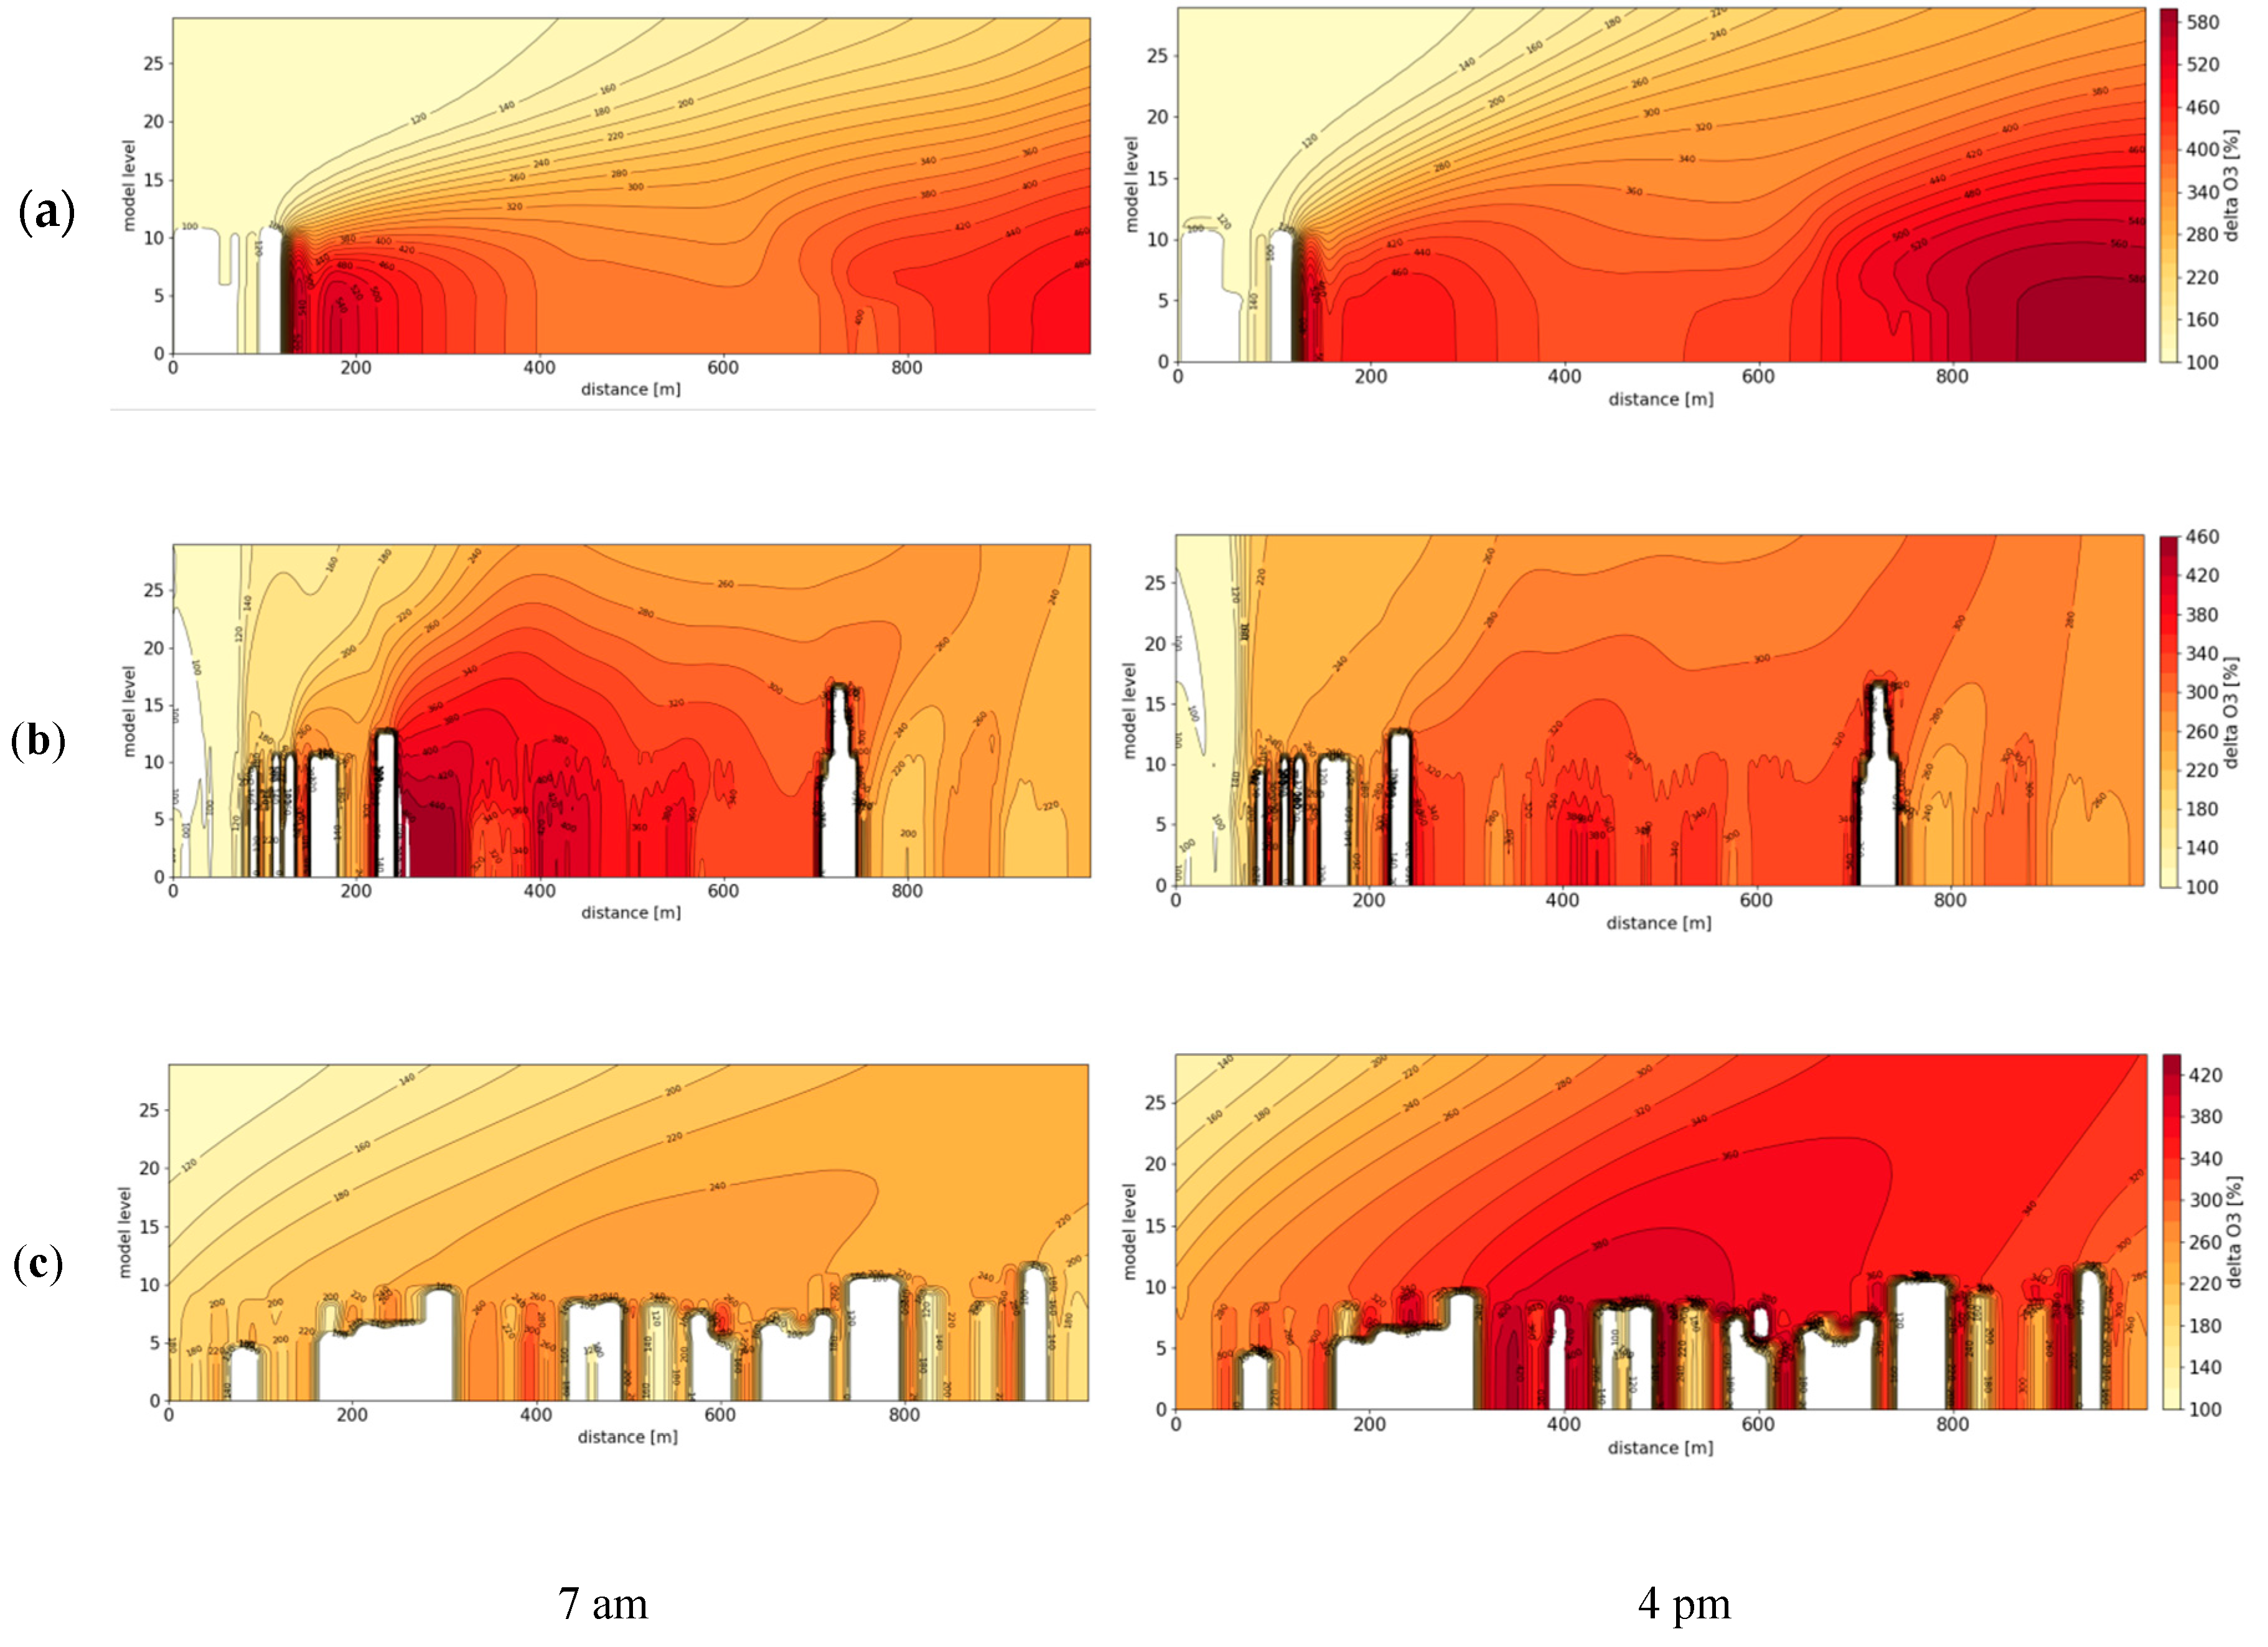
Table 1.
Initial conditions for the box model simulations.
| Parameter | Value | Parameter | Value |
|---|---|---|---|
| Start time | 5 am | Reference Latitude | 48° N |
| Air temperature | 27 °C | Inclination | 23° (summer time) |
| Pressure | 1013.25 hPa | NO2/NO | 1/1, 2/1, 3/1, 4/1, 5/2 |
| Relative humidity | 50% | Initial Isoprene [ppb] | 0.2, 2, 4 |
Table 2.
Dominant chemical reaction chain in the microclimate model ENVI-met.
Table 3.
Initial and boundary conditions for the ENVI-met model runs.
| Parameter | Value |
|---|---|
| Simulation start date | 6th July |
| Simulation start time | 0:00 (midnight) |
| Total simulation time | 30 h |
| Cloud cover | 0/8 |
| Wind speed in 10 m height | 2 m s−1 |
| Wind direction | 225° |
| Maximum air temperature in 2 m height | 32 °C |
| Minimum air temperature in 2 m height | 17 °C |
| Specific humidity in 2 m height (Daily average) | 8 g kg−1 |
Table 4.
Tree types taken from a current tree inventory (2018) from the city of Mainz classified in 6 different classes according to their base isoprene emission capacity.
Table 4.
Tree types taken from a current tree inventory (2018) from the city of Mainz classified in 6 different classes according to their base isoprene emission capacity.
| Base Isoprene Emission Capacity | Species |
|---|---|
| 0.05 | Betula, Carpinus, Fraxinus, Ginkgo, Gleditisia, Pinus, Prunus, Sorbus, Tilia, Ulmus |
| 2.75 | Acer |
| 10.3 | Robinia |
| 28.5 | Salix, Sophora |
| 18 | Aesculus, Ailanthus, Amelanchie, Celtis, Cercis, Cornus, Corylus, Crataegus, Fagus, Liriodendron, Malus, Ostrya, Platanus, Pyrus |
| 70 | Populus, Quercus |
Table 5.
Mean daily ozone yield for different NO2/NO ratios and varying initial isoprene concentrations.
Table 5.
Mean daily ozone yield for different NO2/NO ratios and varying initial isoprene concentrations.
| NO2/NO | ||||||||
|---|---|---|---|---|---|---|---|---|
| ISO [ppb] | 0/0 | 0/1 | 1/1 | 2/1 | 3/1 | 4/1 | 5/2 | 1/2 |
| 0.2 | 0.0 | 4.5 | 3.0 | 5.2 | 7.1 | 8.7 | 8.5 | 2.3 |
| 2 | 0.0 | 12.0 | 5.1 | 6.7 | 8.3 | 9.7 | 9.1 | 3.4 |
| 4 | 0.0 | 24.2 | 11.6 | 10.8 | 10.9 | 11.6 | 10.1 | 5.6 |
© 2019 by the authors. Licensee MDPI, Basel, Switzerland. This article is an open access article distributed under the terms and conditions of the Creative Commons Attribution (CC BY) license (http://creativecommons.org/licenses/by/4.0/).
Share and Cite
MDPI and ACS Style
Simon, H.; Fallmann, J.; Kropp, T.; Tost, H.; Bruse, M. Urban Trees and Their Impact on Local Ozone Concentration—A Microclimate Modeling Study. Atmosphere 2019, 10, 154. https://doi.org/10.3390/atmos10030154
AMA Style
Simon H, Fallmann J, Kropp T, Tost H, Bruse M. Urban Trees and Their Impact on Local Ozone Concentration—A Microclimate Modeling Study. Atmosphere. 2019; 10(3):154. https://doi.org/10.3390/atmos10030154
Chicago/Turabian StyleSimon, Helge, Joachim Fallmann, Tim Kropp, Holger Tost, and Michael Bruse. 2019. "Urban Trees and Their Impact on Local Ozone Concentration—A Microclimate Modeling Study" Atmosphere 10, no. 3: 154. https://doi.org/10.3390/atmos10030154
Note that from the first issue of 2016, this journal uses article numbers instead of page numbers. See further details here.