Article

Emission Factors Derived from 13 Euro 6b Light-Duty Vehicles Based on Laboratory and On-Road Measurements

by
Victor Valverde
*,
Bernat Adrià Mora
,
Michaël Clairotte
,
Jelica Pavlovic
,
Ricardo Suarez-Bertoa
,
Barouch Giechaskiel
,
Covadonga Astorga-LLorens
and
Georgios Fontaras
*
European Commission, Joint Research Centre (JRC), I-21027 Ispra, Italy
*
Authors to whom correspondence should be addressed.
Atmosphere 2019, 10(5), 243; https://doi.org/10.3390/atmos10050243
Submission received: 29 March 2019 / Revised: 29 April 2019 / Accepted: 30 April 2019 / Published: 2 May 2019
(This article belongs to the Special Issue Traffic-Related Emissions)

Abstract

:
Tailpipe emissions of a pool of 13 Euro 6b light-duty vehicles (eight diesel and five gasoline-powered) were measured over an extensive experimental campaign that included laboratory (chassis dynamometer), and on-road tests (using a portable emissions measurement system). The New European Driving Cycle (NEDC) and the Worldwide harmonised Light-duty vehicles Test Cycle (WLTC) were driven in the laboratory following standard and extended testing procedures (such as low temperatures, use of auxiliaries, modified speed trace). On-road tests were conducted in real traffic conditions, within and outside the boundary conditions of the regulated European Real-Driving Emissions (RDE) test. Nitrogen oxides (NOX), particle number (PN), carbon monoxide (CO), total hydrocarbons (HC), and carbon dioxide (CO2) emission factors were developed considering the whole cycles, their sub-cycles, and the first 300 s of each test to assess the cold start effect. Despite complying with the NEDC type approval NOX limit, diesel vehicles emitted, on average, over the WLTC and the RDE 2.1 and 6.7 times more than the standard limit, respectively. Diesel vehicles equipped with only a Lean NOX trap (LNT) averaged six and two times more emissions over the WLTC and the RDE, respectively, than diesel vehicles equipped with a selective catalytic reduction (SCR) catalyst. Gasoline vehicles with direct injection (GDI) emitted eight times more NOX than those with port fuel injection (PFI) on RDE tests. Large NOX emissions on the urban section were also recorded for GDIs (122 mg/km). Diesel particle filters were mounted on all diesel vehicles, resulting in low particle number emission (~1010 #/km) over all testing conditions including low temperature and high dynamicity. GDIs (~1012 #/km) and PFIs (~1011 #/km) had PN emissions that were, on average, two and one order of magnitude higher than for diesel vehicles, respectively, with significant contribution from the cold start. PFIs yielded high CO emission factors under high load operation reaching on average 2.2 g/km and 3.8 g/km on WLTC extra-high and RDE motorway, respectively. The average on-road CO2 emissions were ~33% and 41% higher than the declared CO2 emissions at type-approval for diesel and gasoline vehicles, respectively. The use of auxiliaries (AC and lights on) over the NEDC led to an increase of ~20% of CO2 emissions for both diesel and gasoline vehicles. Results for NOX, CO and CO2 were used to derive average on-road emission factors that are in good agreement with the emission factors proposed by the EMEP/EEA guidebook.

1. Introduction

Road transport is the second largest source of emissions of greenhouse gases (GHG) in the European Union (EU-28), accounting for 20% of total GHG emissions in 2016 [1]. Within road transport, passenger cars have the largest share of carbon dioxide (CO2) emissions with 60.7%, followed by heavy-duty and light-commercial vehicles (26.3% and 11.8%, respectively) [2]. In addition, the tailpipe emissions from the combustion of diesel and gasoline fuels in passenger cars are an important source of air pollutants: 39% of nitrogen oxides (NOX), 20% of carbon monoxide (CO), and 10% of particle matter emitted in the EU-28 in 2016 originated from road transport [3]. Gaseous and solid air pollutants have serious mortality and morbidity impacts on human health, in particular on the respiratory and circulatory systems [4] and there is evidence that exhaust emissions from vehicles can cause lung cancer [5]. In the EU-28 there are 76,000, and 391,000 yearly premature deaths attributable to NO2 and PM2.5 exposure, respectively [3] and exposure to those pollutants is particularly high in urban areas with dense traffic.
Considering both climate change mitigation and air quality challenges, emissions from road transport have become a relevant item in the agenda of policy-makers from a European to a local level, in particular after the diesel emission scandal [6,7]. A large number of air pollution abatement strategies and air quality plans (low emission zones, reduction of speed limits, etc.) have been put in place over the last years in European cities aiming at curbing emissions from road transport and meeting EU urban air quality standards. Proper selection and design of measures to improve air quality are usually based on modelling tools that facilitate comparing the benefits and costs of different scenarios [8,9]. The emission factors (EFs) used as input in air quality modelling systems have been identified among the primary sources of uncertainty [10,11]. Currently, in Europe, most emissions models use EFs based on the Tier 3 methodology of the EMEP/EEA emissions inventory guidebook (chapter 1.A.3.b.) [12], of which COPERT [13] is the most widely used software implementation. EFs for passenger cars within the inventory guidebook were experimentally obtained from laboratory tests in the context of large scientific programs in Europe (ARTEMIS, MEET projects). Despite the fact that the EFs in the guidebook were obtained using realistic test cycles, emission modellers in Europe claim that emission inventories need to take into account not only laboratory measurements but also real-world observations [14,15] since many studies have found differences in the emissions between real-world and laboratory conditions [16,17].
The European Commission has recently updated European Union’s type approval (TA) procedures for emissions including the new laboratory test procedure: the Worldwide harmonised Light-duty vehicles Test Procedure (WLTP, Regulation EU 2017/1151) which replaces the so-called New European Driving Cycle (NEDC); and the Real-Driving Emissions regulation (RDE, Regulation EU 2017/1151 and amendments) a new on-road test with portable emissions measuring systems (PEMS). Both test procedures seek to secure low emissions under a broad set of driving conditions as the old NEDC test procedure had been heavily criticised for being unrealistic and outdated [18]. Emissions measured during the WLTP and RDE tests constitute a novel and realistic source of data for EF development.
According to the automobile manufacturers association [19], in 2016, the EU-28 passenger car fleet was composed of 257 million vehicles with an average age of 10.5 years and a 95.9% share of conventional internal combustion engine vehicles. Euro 6d-TEMP vehicles, type approved under stringent WLTP and RDE procedures, are expected to change the emissions scenario in Europe due to a better environmental performance as compared to their predecessors [20]. However, since they were placed on the market only from September 2017 and new car registrations are roughly 15 million per year, they still represent a small share of the fleet.
The objective of this study is to develop EFs for Euro 6b light-duty vehicles representing the most widespread technologies of the circulating European fleet based on laboratory and on-road tests performed in the context of the European Commission’s Joint Research Centre (EC JRC) investigations on vehicle emissions compliance [21]. The study focuses on presenting the spread of EFs of key pollutants (NOX, PN, CO, hydrocarbons-HC) and CO2 considering different driving conditions and vehicle models.
The paper is organised as follows: Section 2 presents a description of the experimental campaign with an indication of vehicle characteristics, tests performed, and instrumentation used. The results of the emissions tests and the calculation of EFs are presented in Section 3, including an assessment of the emissions during the five minutes after the first ignition of the engine (to assess cold start emissions) and a comparison with the emissions retrieved from the EMEP/EEA inventory guidebook. Implications of the results are discussed in Section 4 and finally, Section 5 is devoted to the conclusions.

2. Experiments

The test campaign took place at the JRC Ispra site (Italy) between June 2016 and December 2017 (except for one vehicle tested in 2015). Thirteen Euro 6b light-duty vehicles, eight diesel and five gasoline, were selected in order to build a pool of vehicles as representative as possible of models that entered the European market between 2015 and 2017. The vehicles selected consisted of best seller models from various manufacturers, with the most diffused after treatment systems, and from different vehicle segments (as defined in [22]). Vehicles differed in size, engine capacity, engine power, and emissions control characteristics (Table 1). All tested diesel vehicles had diesel particulate filters (DPF) for reducing particulate matter emissions, a diesel oxidation catalyst (DOC) to control CO and HC, and exhaust gas recirculation systems (EGR), and selective catalytic reduction (SCR) and/or lean NOX trap (LNT) for controlling the NOX emissions. All gasoline vehicles had a manual transmission, were equipped with three-way catalysts (TWC), and none had gasoline particle filter. Three of the gasoline vehicles had direct injection engines (GDI), and two had port fuel injection (PFI). All diesel vehicles had direct injection engines. The tested diesel sample matched well the 2016 EU-28 engine size distribution, with the majority of vehicles having an engine size ranging from 1400 to 1999 cc (Supplementary Materials, Figure S1). All gasoline vehicles had an engine displacement lower than 1400 cc as 55% of the gasoline vehicles in EU-28 in 2016 [23]. Large displacement gasoline vehicles and vehicles equipped with automatic transmission were lacking in the sample. This is not expected to affect much pollutant emissions but can highly influence fuel consumption and thus CO2 emissions. It is also worth noticing that all gasoline vehicles and vehicle D6 had low mileage at the beginning of the test campaign (<3000 km).
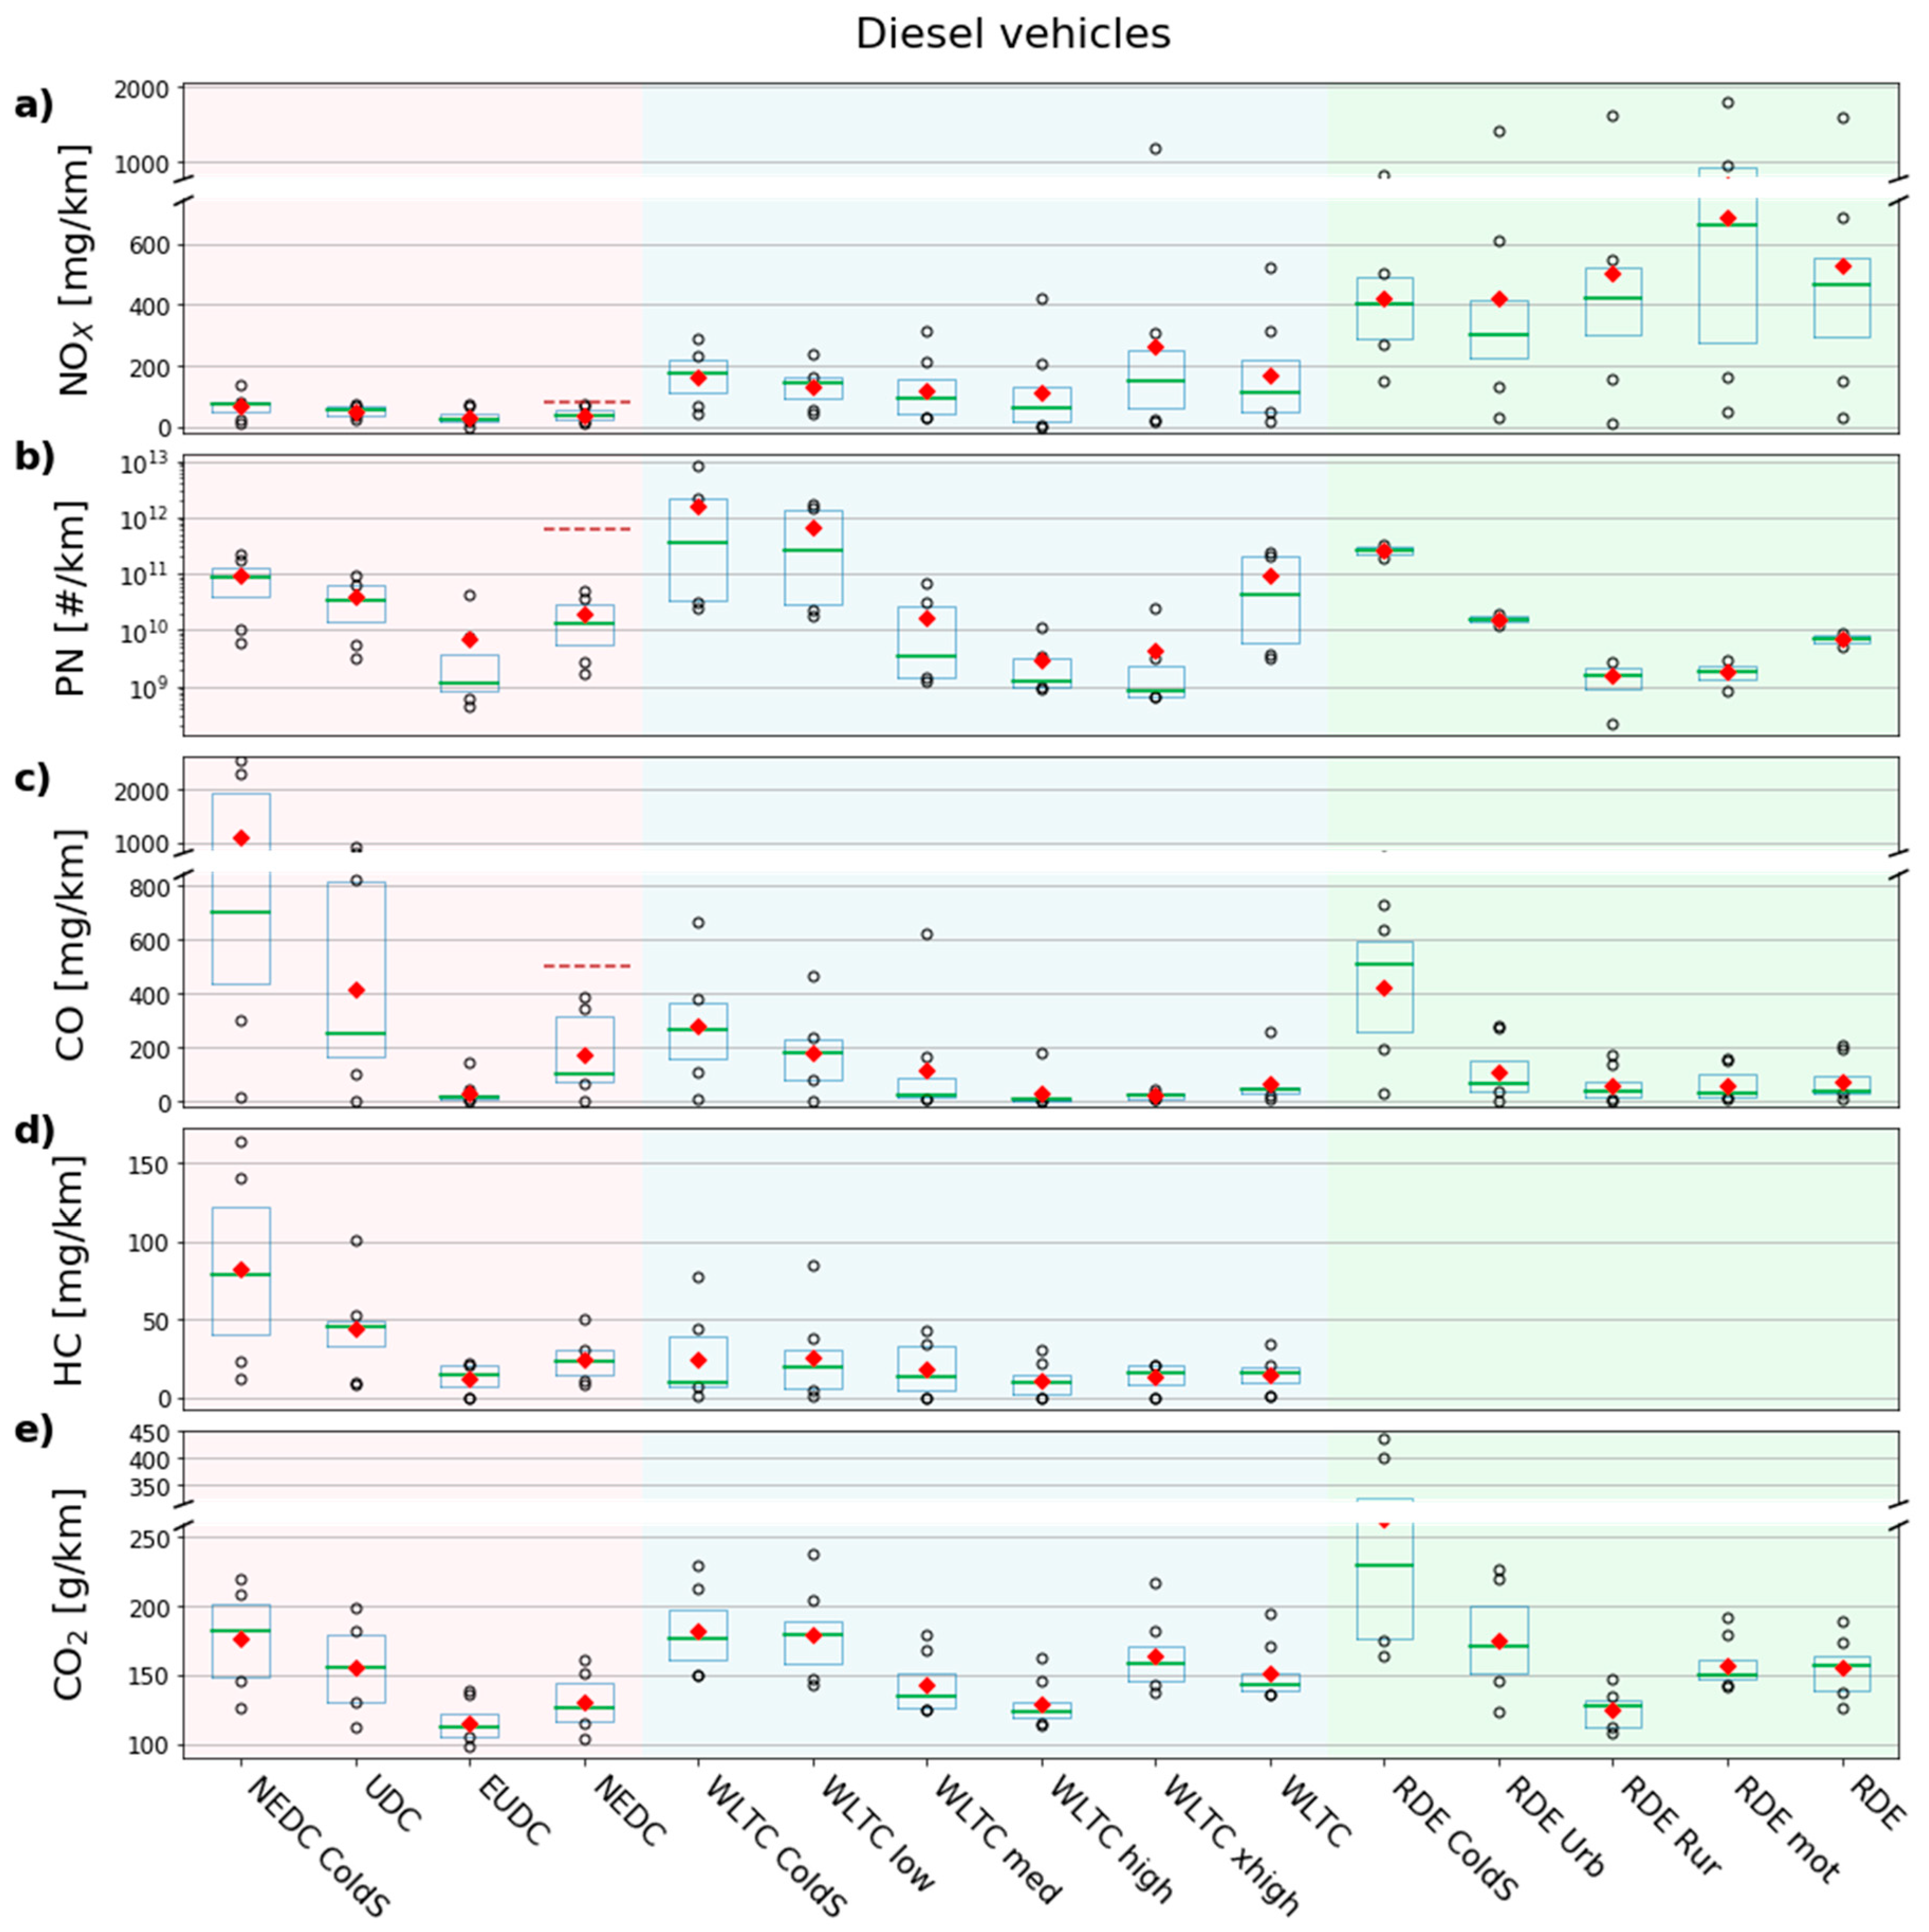
The testing cycles applied in the laboratory corresponded to the Type I TA cycle, the NEDC and the WLTC. NEDC is divided into two phases: the Urban Driving Cycle (UDC, average speed: 18.4 km/h, max speed: 50 km/h) and the Extra-Urban Driving Cycle (EUDC, average speed: 62.6 km/h, max speed: 120 km/h). WLTC is composed of four phases representing increasing average speed conditions: low (average speed 18.9 km/h), medium (39.5 km/h), high (56.7 km/h), and extra-high (92.0 km/h). On the road, tests were performed within and outside the boundary conditions of the RDE regulation. For all the on-road tests, instantaneous vehicle speed is split in three bins representing Urban (≤60 km/h), Rural (>60 km/h and ≤90 km/h), and Motorway (>90 km/h) driving conditions. Although it is the vehicle manufacturer’s obligation to ensure that the tailpipe emissions are effectively limited throughout the normal life of the vehicles under normal conditions of use (Regulation EC 715/2007) since all vehicles of the sample are Euro 6b, the pollutant emissions were checked against the regulated limits only under the NEDC. Hence, WLTC and RDE emission results are useful for assessing the emissions performance under more realistic driving conditions.
Before any testing, vehicles were checked for anomalies and malfunctions that could compromise their performance. No vehicle was rejected for this reason
Laboratory emission tests were performed at the JRC Vehicle Emission Laboratory #2 (VELA2) for all vehicles except D7 and G3, that were tested in VELA8. The characteristics of both test cells are fully described elsewhere [21,24]. In brief, both VELA are chassis dynamometer test cells with controlled temperature and relative humidity, a conventional constant volume sampling system with a critical flow venture, and 2-axle roller benches. PN is measured with a solid particle number measurement system with particle diameter cut-off of 23 nm [25], CO and CO2 with a non-dispersive infrared analyser, HC with a heated flame ionization detector, and NOX with a chemiluminescence analyser using an NO2 to NO converter. Laboratory-based EFs discussed in Section 3 for whole cycle and individual phases correspond to emissions as measured in gas-sampling bags. EFs obtained during the first five minutes of the test are used to assess cold start contribution, and are calculated from continuous measurements done in the dilution tunnel (calculated as the pollutant mass emitted in the first 300 s of the NEDC or WLTC Cold cycles divided by the distance driven during those 300 s). The 300 s choice is based on the cold start definition used in Regulation 2017/1151 for RDE tests). On NEDC tests, 300 s correspond to a distance of ~1.35 km. This is significantly higher for the WLTC (~2.03 km). The distance difference together with different acceleration patterns between the two test cycles needs to be considered when comparing the calculated cold start EFs. In addition to the EFs from the first 300 s of the cold cycles, the cold start effect is assessed by comparing emissions of Cold-Hot pairs of tests over NEDC and WLTC cycles.
Laboratory tests conducted on each vehicle (Table 2) included a minimum of two repetitions of each test although not every type of test was performed in every car. EFs were calculated using the average of valid tests. Some tests were discarded due to instrumentation failure, issues with the vehicle during the test, or the presence of DPF regeneration. Tests were performed with market fuel. NEDC and WLTP (class 3b) were performed following their respective test protocols (Regulation 83 and EU regulation 2017/1151, respectively) at 23 °C ambient temperature. The NEDC road loads (RLs) were calculated based on vehicle characteristics (masses, height, body shape) following the approach of Tsiakmakis [26] except for D1, D3, and G2, where tabulated NEDC RLs (as defined in Regulation 83) were used. The WLTP RLs were calculated starting from NEDC RLs, and modifying them in order to consider the procedural differences between NEDC and WLTP that impact RL determination [26]. No corrections of measured CO2 results from the vehicle’s battery state of charge were performed on any test. No ambient temperature correction was applied to CO2 results from the WLTC tests. NEDC and WLTC tests were performed after the prescribed soaking times, and starting with a cold engine (NEDC Cold and WLTC Cold in Table 2). Additional NEDC and WLTC tests were conducted with the engine already hot (i.e., oil and/or coolant temperature of at least 70 °C) after the cold engine tests in order to assess the cold start effect (NEDC Hot and WLTC Hot in Table 2). In order to investigate auxiliary emission strategies, additional cold and hot tests were also performed using the NEDC as driving cycle and varying parameters such as the ambient temperature (10 °C and 30 °C), speed profile (+10%), or use of auxiliary systems (AC and lights on). For the scope of developing EFs, those NEDC-based tests have been considered as NEDC extended tests, and they have been grouped in modalities starting with cold and hot engine (NEDC extd Cold and NEDC extd Hot, respectively in Table 2). Finally, WLTC tests starting with a cold engine were performed on two diesel vehicles (D1, D8) and two gasoline vehicles (G1, G4) at −7 °C ambient temperature (WLTC Cold −7 °C) in order to assess emissions in winter conditions at the same temperature as the Type 6 test (coast down times for these tests were decreased by 10% as described in [24]).
Either before or after the laboratory tests, the vehicles were instrumented with a portable emissions measurement system (PEMS) to measure emissions on the road under real traffic conditions in the surroundings of the JRC site. All tests were performed with market fuel. Each vehicle was driven on the same two routes designed to meet all the criteria from the RDE regulation (trip duration, composition, temperature range, altitude range, positive altitude cumulative gain, etc.) Details on the routes can be found in [21]. Additionally, on nine vehicles (all but D1, D3, D7, G5), both routes were driven again with a sporty driving style, resulting in more dynamic trip indicators (closer to or above RDE v*a_pos_95 limits). Additionally, another two non-RDE compliant routes that represent prolonged motorway drive and hilly driving were used on 11 (all but D4, D7), and 12 vehicles (all but D7), respectively (Table 3). PEMS testing was performed on public paved roads, with little to no congestion, with instruments mounted either in the cabin or placed on a tow-bar, covering most part of the year with an ambient temperature range of 4 °C to 31 °C. One driver and one co-pilot were present on-board on all tests. No artificial payload (ballast) was used and the RDE limit for payload (90% of maximum payload) was never exceeded. Tests with PEMS failure or presence of DPF regeneration were discarded.
Three different gas PEMS (AVL-MOVE, Sensors SEMTECH-DS, and Sensors SEMTECH-ECOSTAR) measuring NOX, CO, CO2, and two PN-PEMS units (Horiba Modified NPET and Testo NanoMet 3, described in [27]) were used during the test campaign (Table 3). Since all diesel vehicles were equipped with a DPF (low PN emissions from diesel vehicles were expected a priori), the focus of the on-road PN campaign was placed on gasoline vehicles. Hence, on-road PN EFs correspond to data gathered only on two of the eight diesel vehicles. Exhaust mass flow was systematically measured with an exhaust flow meter. HC emissions were not measured on the road. PEMS validation tests performed on the chassis dynamometer showed that the performance of the systems within the limits specified by RDE regulation.
RDE emission results presented in Section 3 correspond to the average emissions measured over the two RDE-compliant routes per vehicle (at least one valid test on each route on every car). Similarly, non-RDE EFs correspond to the average of non-RDE compliant tests performed on each vehicle over the non-RDE compliant routes and the dynamic driving tests (maximum, one repetition per route).
Emission values for all on-road tests are raw (i.e., not using the weighting functions or emissions corrections for extended conditions described in the RDE regulation). For each vehicle, cold start emissions from on-road tests were calculated from the values measured over the two RDE compliant routes (started with a cold engine). For each of the two routes, the cold start EF was computed as mass emissions over the first 300 s from test start (first ignition of the engine) divided by the distance driven over that time. Tests exhibiting idling time at test start and/or idling during the first 300 s exceeding RDE criteria were excluded (no valid tests for vehicle D4 were kept). The average distance driven during the first 300 s was 1.8 km (std. dev. 0.4 km) which is higher than the distance driven over NEDC but slightly lower or similar to the distance driven during 300 s over the WLTC.
EFs obtained during the experimental campaign were benchmarked against the Tier 3 method described in chapter 1.A.3.b.i of the EMEP/EEA inventory guidebook [12], considering its July 2018 update for road transport [28]. The inventory guidebook methodology provides EFs for gaseous pollutants and particle matter distinguishing vehicles by category, fuel type, engine capacity, and emissions control technology, and it is one of the most widespread EU reference methods to compile emission inventories from road transport. The focus of the benchmarking performed is on NOX, CO, and CO2. PN is not considered in the analysis because the guidebook provides EFs split in three size bins (<50 nm, 50–100 nm, 100–1000 nm) whereas the measured PN is the total particle number above 23 nm. Also, the guidebook provides particle mass EFs but no assumption for the number to mass correlation was intended to be used. The comparison performed between EFs retrieved from the experimental campaign with those of the guidebook regard only tailpipe emissions (neither evaporative or non-exhaust emissions). Finally, the comparison is done considering only hot emissions (when the engine and the exhaust after-treatment systems are at their normal operating temperatures). Tier 3 cold emissions, that occur during transient thermal warming-up operation, are calculated from a set of parameters (ambient temperature, trip length, mileage fraction driven with cold engine) for which providing an estimation for the lab and road tests would unduly increase the uncertainty of the approach. Therefore, for simplicity only hot emissions (which depend on average speed) were extracted from the inventory guidebook. All vehicles in the tested sample are Euro 6b and therefore lie in the guidebook vehicle category “up to 2016”.
The speed-dependent fuel consumption curves from the inventory guidebook have been transformed into CO2 emissions assuming that the carbon contained in the fuel is fully oxidised into CO2. For diesel vehicles, the fuel consumption speed-dependent curve used is that of the “medium” segment (with an engine displacement of 1400 to 2000 cm3) to which all diesel vehicles of the sample belong (except D2 which has been excluded from the CO2 comparison). For gasoline vehicles, the fuel consumption speed-dependent curve used is the one of the “small” segment (with an engine displacement of 800 to 1400 cm3). The net calorific value of the fuels used are 42.615 MJ/kg (diesel) and 42.722 MJ/kg (gasoline). No additional corrections for CO2 based on vehicle reference mass, engine capacity, registration year, or type approval CO2 have been implemented.
Instantaneous gas emissions and vehicle speed from WLTC Hot tests, and from the RDE compliant tests without the first 300 s, i.e., in warm engine and after treatment conditions, were integrated over 1 km distance bins and subsequently split in speed bins of 10 km/h to compare against average speed-dependent EFs from the inventory guidebook. Vehicle speeds below 10 km/h and above 130 km/h were filtered out for the whole experimental dataset and prior to speed binning since the guidebook does not provide EFs in those ranges. One repetition of the WLTC hot test and one RDE compliant test were used per vehicle to avoid biased results based on the different number of tests performed on each vehicle. NEDC measurements were not considered in the benchmark since the EFs from the inventory guidebook were obtained in transient cycles, which is not the case for the NEDC.

3. Results

Results will be always describing first the diesel vehicles and then the gasoline ones. Section 3.1 presents the EFs of the complete laboratory and road tests considering the whole diversity of tests described in Section 2 and focusing for brevity on the main pollutants of concern (NOX, PN, and CO2). Section 3.2 is devoted to the comparison of EFs from the different phases of the test cycles and the first five minutes of the tests, focusing only on the Type I tests (NEDC Cold, WLTC Cold), and RDE compliant routes, and including CO and HC in addition to NOX, PN, and CO2. Finally, Section 3.3 shows the results of the benchmark between experimental data and the EMEP/EEA inventory guidebook for NOX and CO2.

3.1. Emissions over Complete Cycles

3.1.1. NOX from Diesel Vehicles

All eight diesel vehicles tested at JRC over their TA test cycle (i.e., NEDC Cold) complied with the Euro 6 emission limit set at 80 mg/km with a mean (±standard deviation) and median emission of 39 ± 21 mg/km and 34 mg/km, respectively (Figure 1a). The maximum and minimum NOX values were measured on vehicle D7 (73 mg/km) and D6 (14 mg/km), respectively. The average NOX for the 5 diesel vehicles equipped with LNT only (49 ± 20 mg/km) was more than two times as high as the EF for the 3 diesel vehicles that mounted an SCR (23 ± 7 mg/km).
NOX emissions on the NEDC Hot averaged 68 ± 57 mg/km, and were under 80 mg/km for all vehicles but D1 and D7 (which slightly exceeded this value 87 mg/km and 94 mg/km, respectively), and also D4 which reached 198 mg/km. D6 was again the vehicle showing the lowest NOX emission (15 mg/km). NOX emissions over the Hot NEDC test were higher than on the Cold one except for vehicles D2 and D5. On the NEDC Hot test, without considering D4 whose NOX EF is an outlier (i.e., 1.5 times the interquartile range beyond the third quartile), the median NOX emissions of the fleet on the NEDC Hot test was 35 mg/km, roughly 18% higher than over the Cold test. Also, the average emission levels of the vehicles equipped with only LNT (61 ± 31 mg/km) was significantly higher than the one for diesel vehicles with an SCR (35 ± 27 mg/km).
The NEDC extended tests performed with a cold engine can be divided into two groups. The test with 10% increased speed trace and the one run at 30 °C ambient temperature resulted in little impact on NOX as compared to the standard NEDC Cold test. No exceedances of the Euro 6 limit were observed and fleet averages of 51 ± 43 mg/km and 35 ± 23 mg/km were recorded, respectively. On the other hand, the median value measured over the NEDC tests performed at 10 °C ambient temperature was 80 mg/km (average 95 ± 72 mg/km). This value is more than two times higher than the value on the tests performed at 25 °C; whereas NOX at 10 °C increased for all tested vehicles, the emissions were unusually high for vehicles D1 (138 mg/km), D3 (126 mg/km), and D5 (221 mg/km). Considering all three modalities of NEDC extd Cold, vehicles D2, D6, and D8 had the lowest emissions with maximum NOX EFs below 35 mg/km. On the NEDC extd Hot tests NOX emissions were similar to the NEDC Hot tests on three out of four vehicles (D7 had its emissions increased by a factor of 2.5 up to 235 mg/km).
The mean and median WLTC NOX EFs were 170 ± 162 mg/km and 109 mg/km for the Cold test, and 199 ± 208 mg/km and 114 mg/km for the Hot test, respectively. On average for the diesel fleet, the NOX EF increased 3.9 and 2.6 over the Cold and Hot tests, respectively when moving from NEDC to WLTC. Although NOX increased for all vehicles (except D2), four of them (D2, D3, D6, and D8) managed to keep their emissions lower than 55 mg/km on both tests. D2, D3, and D6, the vehicles equipped with an SCR, averaged a NOX EF of 41 ± 15 mg/km and 35 ± 15 mg/km on the WLTC Cold and WLTC Hot, respectively, which is one order of magnitude lower than the averages of vehicles with LNT only (248 ± 161 mg/km and 296 ± 209 mg/km). D1, D4, and D7 showed larger emissions over WLTC Hot than over WLTC Cold (1.25x) whereas for the other five vehicles WLTC Cold and Hot emissions were similar. Only two diesel vehicles (D1 and D8, both mounting only an LNT) were tested on the WLTC −7 °C. If compared to the 23 °C WLTC Cold test, NOX emissions increased 2.3x and 3.3x reaching 374 mg/km and 170 mg/km for D1 and D8, respectively.
On the road over RDE compliant routes, the average and median NOX EF were 531 ± 444 mg/km and 466 mg/km, respectively. Considering the median EFs of the whole diesel fleet, on-road NOX emissions were 14 times higher than the ones measured over the NEDC Cold test, and 6 times higher than the TA limit. All vehicles had an increase in their NOX levels on the road as compared to NEDC Cold test in the range of 1.16x (D2) to 22x (D7). The highest emissions on the road coincided with the PEMS tests performed in cold ambient conditions (10 °C and 4 °C on average, for D5 and D7, respectively). Vehicles with LNT only averaged a NOX EF of 657 ± 498 mg/km whereas diesel vehicles with SCR averaged 321 ± 206 mg/km), a difference which is above the PEMS uncertainty of NOX measurement. D2, which is the only diesel vehicle that mounted an LNT and an SCR, exhibited low NOX levels on the road, being only 5 mg/km higher (30 mg/km) than the EF measured in the laboratory under TA conditions (NEDC Cold test) even if the PEMS tests were carried out in October with an average ambient temperature of 17 °C. D2 also showed low NOX on the non-RDE compliant tests (31 mg/km on average for the four routes) with close to zero emissions on the long motorway test (7 mg/km). On the road, it is difficult to replicate testing conditions and, therefore, to assign a particular emissions behaviour to a single parameter. However, when considering tests done on the same RDE compliant route with the same vehicle, same driver, same driving style, and same instrumentation—and comparing trips with similar average speed, dynamicity and fuel consumption—it is possible to hypothesise that ambient temperature above 30 °C increases NOX emission by a modulating EGR strategy. For D6 for example, one test done in the afternoon at 35 °C had a NOX EF 30% higher than over a test performed in the early morning at an ambient temperature of 27 °C. This emission increase can be related to a reduction of the EGR rate (Figure S2). Non-RDE compliant tests had a median NOX EF for the whole fleet of 482 mg/km with larger emissions on the tests driven dynamically (700 mg/km) than on the hilly and long motorway test (433 mg/km and 289 mg/km, respectively).
From a vehicle perspective (Figure S3a), considering all tests performed, D2 (LNT+SCR) had the lowest NOX EF 23 ± 6 mg/km which is one order of magnitude lower than those of the rest of the fleet. D8 (LNT only), and the other two vehicles that mount an SCR (D3 and D6) were next with NOX EF of 105 ± 138 mg/km, 175 ± 203 mg/km, 166 ± 282 mg/km, respectively. The vehicle with the highest NOX emissions overall was D4 (437 ± 255 mg/km).

3.1.2. Particle Number (PN) from Diesel Vehicles

All diesel vehicles displayed on all tests PN emissions lower than the TA limit for Euro 6 diesel vehicles (6 × 10¹¹ #/km, Figure 1b). The mean and median PN EF on the NEDC Cold test were 1.9 × 10¹⁰ ± 1.6 × 10¹⁰ #/km and 1.3 × 10¹⁰ #/km, respectively which is more than an order of magnitude below the limit. Over the NEDC Hot test, the median PN EF was 1.8 × 10⁹ #/km. There were no apparent differences between extended and standard NEDC tests, with median PN EF of 1.6 × 10¹⁰ #/km and 2.1 × 10⁹ #/km, respectively for NEDC extd Cold and NEDC extd Hot. On the test at 10 °C ambient temperature, vehicle D1 emitted 2.5 × 10¹¹ #/km which is 5x more than over the standard NEDC 25 °C test (though the absolute value is still lower than the applicable limit).
PN emissions were higher over the WLTC Cold than over the NEDC Cold test for all vehicles except D3 and D6. The mean and median PN EFs were 9.3 × 10¹⁰ ± 9.7 × 10¹⁰ #/km and 4.4 × 10¹⁰ #/km, respectively. The maximum PN value registered during the experimental campaign was D1 on this test (2.4 × 10¹¹ #/km; still less than half of the emission limit). The median WLTC Hot PN EF (1.9 × 10⁹ #/km) was roughly equal to the NEDC Hot one, and individual vehicles displayed similar values. Median PN EF over WLTC Hot was less than one-fifth of the EF derived over the WLTC Cold test. The average PN emissions on WLTC −7 °C Cold was half the PN measured at WLTC Cold at 23 °C (2.2 × 10¹¹ #/km vs. 1.1 × 10¹¹ #/km for 23 °C and −7 °C, respectively).
On the road, both diesel vehicles for which PN was measured showed PN emissions well aligned with what was measured during the TA cycle. The average PN EF over the RDE compliant routes was 7 × 10⁹ ± 2 × 10⁹ #/km, whereas over the non-RDE compliant tests the mean EF was 2.8 × 10¹⁰ ± 2.6 × 10¹⁰ #/km.
From the individual vehicle perspective (Figure S3b), D3, D4, D5, and D6 had PN emissions lower than 5 × 10¹⁰ #/km on all tests performed, and those were the vehicles with the lowest average PN EF. Among them, D5, tested on all modalities except for the −7 °C test, always had a PN EF lower than 5 × 10¹⁰ #/km averaging 3.6 × 10⁹ ± 3 × 10⁹ #/km. D1 had the highest PN emissions of the fleet 8.8 × 10¹⁰ ± 9 × 10¹⁰ #/km reaching the range of 1011 #/km on two tests (NEDC 10 °C and WLTC Cold).

3.1.3. CO2 from Diesel Vehicles

The mean and median CO2 EF over the NEDC Cold test were 130 ± 18 g/km and 127 g/km, respectively which was on average 7% above the TA CO2 values (excluding D1, and D3 for which tabulated RLs were used). The use of tabulated RLs for these two vehicles caused an increase of the aerodynamic drag and rolling resistance which resulted in an overestimation of 26% and 20% of the TA CO2, respectively (Figure 1c). Over the NEDC Hot test the CO2 EF was on average 5% lower than over the NEDC Cold test with a maximum reduction of 13% (D4) and a minimum of 1% (D7). Over both NEDC Cold and Hot tests, CO2 tended to increase linearly with engine power except for D2 and D8, whose CO2 emission was approximately 30% lower than what could be expected from the linear interpolation (Figure S4). Comparing the standard NEDC Cold against the NEDC extd Cold tests considering only the sub-fleets for which each test was performed, the NEDC with increased 10% speed profile, the 10 °C, and the 30 °C tests yielded CO2 EFs of 5 ± 2%, 8 ± 4%, and −2 ± 2%, respectively. The median and mean CO2 EF of the three NEDC extd Cold tests combined was similar to the NEDC Cold (130 ± 16 g/km and 126 g/km, respectively). The CO2 EF increased 20% when using auxiliaries in the NEDC extd Hot test as compared to the NEDC Hot test on D5, D7, and D8. On D6 (the only light commercial vehicle of the fleet) the use of auxiliaries led to an increase of 44% of CO2 emissions.
Over the WLTC Cold, the mean and median CO2 EF was 151 ± 20 g/km and 142 g/km, respectively. As compared to the NEDC Cold test, the CO2 EF increased systematically on all vehicles averaging 17 ± 10% on the whole diesel fleet with the maximum increase for D7 (35%) and minimum for D2 (2%). Fleet average CO2 EF from NEDC to WLTC increased in the Hot test in the same proportion as in the Cold one 18 ± 8% with maximum and minimum increases of 32% (D4) and 7% (D5). The lack of a uniform WLTC/NEDC CO2 ratio determines an absence of correlation among CO2 EF on the WLTC cycle and engine power (Figure S4). On the WLTC Hot test, CO2 EF was 4 ± 4% lower than over the WLTC Cold test. No significant difference in CO2 EF change was observed in the WLTC/NEDC comparison between sub-fleets of manual and automatic vehicles. However, automatic vehicles decreased their CO2 by 7% in the hot tests as compared to the cold ones (average of NEDC and WLTC), whereas in manual vehicles CO2 EF of hot tests was only 2% lower than on Cold tests. Both vehicles tested on WLTC at −7 °C (D1 and D8) registered 17% higher CO2 as compared to the 23 °C WLTC Cold test.
On the road, the CO2 emissions over the RDE compliant routes averaged 155 ± 18 g/km which was 33 ± 7 % higher than the TA values. The lowest difference between real-world CO2 and the TA value was 25% and corresponded to D6, D2, and D5 though the last two vehicles were tested in winter time. D1 featured the maximum CO2 gap: 44%. Regarding the non-RDE compliant routes, the average CO2 emissions were 167 ± 20 g/km. Comparing the different non-RDE tests, the highest CO2 was measured, as expected, on the hilly route (173 ± 26 g/km), whereas the long motorway route yielded the lowest average CO2 EF (145 ± 10 g/km). On the road, the linear correlation between CO2 EF and engine power can be observed (Figure S4), except D2 that emits lower CO2 than what can be expected from its engine size, and D5 that emits more CO2 than expected, particularly under non-RDE driving conditions.

3.1.4. NOX from Gasoline Vehicles

All five gasoline vehicles complied with the Euro 6 limit for NOx over the Type I test (60 mg/km) with an average NOX EF of 7.6 ± 2.9 mg/km (Figure 2a). G1 had the highest NOX emission levels (11.5 mg/km) whereas the minimum NOX values were measured on both PFIs (G4 4.1 mg/km and G5 4.6 mg/km), although the difference is close to the laboratory uncertainty measurement. In fact, over NEDC Cold the average NOX emissions of GDIs were 2.3 times higher than the average NOX of PFIs. NOX emission over the NEDC Hot test yielded similar results as the cold one, with average NOX EF 7.0 ± 4.2 mg/km with emission being slightly lower on G1, G3, G4, and slightly higher on G2 and G5. Again, the average NOX EF was two times higher for GDIs than for PFIs. On the gasoline fleet NEDC extd Cold included tests done with increased 10% speed trace and the test done at 10 °C ambient temperature where the average NOX EF were 9.2 ± 4.2 mg/km and 16.1 ± 9.2 mg/km, respectively. At 10 °C, NOX EF was two times higher than at 25 °C on average for the fleet with larger increase in emissions for GDIs (2.5x) as compared to PFIs (1.7x). The use of auxiliaries did not modify NOX EF on NEDC extd Hot as compared to the standard NEDC Hot test.
The mean and median NOX EF over WLTC Cold were 36.2 ± 25.9 mg/km and 32.3 mg/km, respectively (4.7x more than over NEDC), with GDIs emitting 6 times more NOX than PFIs. The average increase for the GDIs going from NEDC to WLTC was 5.4, whereas for PFIs the change of cycle resulted in 2x more emissions. G1 was the only vehicle exceeding the 60 mg/km limit on WLTC Cold test (72.4 mg/km). On the WLTC Hot test the average NOX EF was 46.4 ± 32.2 mg/km with GDIs averaging 8.3x higher emissions than PFIs (71.6 mg/km vs. 8.6 mg/km). NOX was higher on the WLTC Hot as compared to the WLTC Cold on all vehicles but G4, averaging 25% more emissions. For both vehicles tested over WLTC at −7 °C (G1-GDI and G4-PFI), NOX emissions increased 50% respect to the 23 °C WLTC test with the GDI largely exceeding the TA NOX limit at 23 °C over the NEDC with 109 mg/km whereas the PFI emitted 10.8 mg/km.
On the road over RDE compliant tests, the average gasoline NOX EF was 54 ± 37.9 mg/km with three out of five vehicles exceeding 60 mg/km (all GDIs). The median NOX emission of the gasoline fleet on-road was equal to the TA limit over NEDC Cold. All vehicles had an increase of their NOX EF on the road as compared to Type I test in the range of 1.5 (G4) to 12 times more emissons (G2). GDIs registered on average 9x more NOX on the road than over NEDC Cold. G5 (PFI) tested in winter at 8 °C ambient temperature averaged 15 mg/km on the road. GDIs averaged 83 ± 16 mg/km and PFIs eight times less (10 ± 4 mg/km). Regarding the non-RDE compliant tests, NOX levels from the dynamic tests and the highway one were similar to the ones of the RDE compliant routes for all vehicles whereas, in the hilly route G3 emitted 288 mg/km, three times more than over the RDE compliant routes.
From an individual vehicle perspective (Figure S5a), G4 had the lowest average NOX EF considering all testing modalities with 6.2 ± 2.6 mg/km, followed by the other PFI (G5).

3.1.5. PN from Gasoline Vehicles

No PN limit applies for Euro 6 PFI vehicles, whereas GDIs had a provisional PN limit of 6 × 10¹² #/km which was met by the three vehicles of the gasoline fleet (Figure 2b). The average PN EF over Type I was 1.4 × 10¹² ± 1.5 × 10¹² #/km. The large standard deviation is explained by the different performance of GDIs and PFIs regarding their PN emission. GDIs averaged 2.3 × 10¹² #/km and PFIs 11 times lower (2 × 10¹¹ #/km). The PN measured on the NEDC Hot test averaged 5.9 × 10¹¹ #/km (below the diesel limit) and it was 60% lower than over the NEDC Cold. PN emissions of PFIs on the NEDC Hot test were 18× lower than for GDIs. Considering the three vehicles in which the NEDC extd Cold tests were performed, PN was similar in the test with increased 10% speed profile and 2.7× higher on the test at 10 °C test reaching an average PN of 1.1 × 10¹² #/km. The NEDC extd Hot was performed only in the two PFIs and the PN EF did not differ from the standard NEDC Hot test.
The mean PN EF over WLTC Cold was 1.7 × 10¹² ± 1.3 × 10¹² #/km with GDIs averaging 2.6 × 10¹² ± 9.0 × 10¹¹ #/km 6 times higher than PFIs 4.2 × 10¹¹ ± 1.6 × 10¹¹ #/km. On average, PN over WLTC Cold was 1.6× higher than over the NEDC Cold. PN on the WLTC Hot was on average 40% lower than over WLTC Cold (1.0 × 10¹² #/km). During WLTP at −7 °C, the PN increase was more noticeable on the PFI vehicle (G4, 4× than at 23 °C) than over the GDI (G1, 2×).
In the RDE-compliant tests PN averaged 1.1 × 10¹² ± 7.8 × 10¹¹ #/km, with GDIs averaging 5.1 times higher PN EF than PFIs (1.7 × 10¹² #/km vs. 3.3 × 10¹¹ #/km), a difference which is above the PEMS uncertainty of PN measurement. All three GDIs of the fleet emitted more than 1 × 10¹² #/km on all tests done in the road. Among the non-RDE compliant tests, PN EF was particularly high under dynamic driving conditions reaching on average 1.9 × 10¹² #/km. The maximum PN was measured on G3 over one of the dynamic driving tests (3.7 × 10¹² #/km).
From a single vehicle perspective (Figure S5b), PFIs showed systematically lower emissions than GDIs with G5, tested in all conditions but the WLTC −7 °C test, having the lowest average PN and the lowest standard deviation among tests: 2.3 × 10¹¹ ± 2.1 × 10¹¹ #/km.

3.1.6. CO2 from Gasoline Vehicles

The mean and median CO2 EFs over the NEDC Cold test were 122 ± 7 g/km and 120 g/km, respectively, 14% above the TA CO2 values on average (Figure 2c). G2, for which tabulated RLs were used, had 10% extra CO2 on the NEDC Cold as compared to the declared value. The most significant deviation from the TA CO2 was found on G3 (27%). Over the NEDC Hot test the CO2 emissions were on average 6% lower than over the NEDC Cold test with a maximum reduction of 10% (G3). The vehicles with lowest engine power (G4 and G5 with 51 kW) had the highest TA CO2 (Table 1) whereas the highest measured CO2 emissions over both NEDC Cold and Hot tests corresponded to G3, the vehicle with highest engine power (followed by G4 and G3). GDIs averaged 4.5% lower CO2 EF than PFIs on NEDC Cold and Hot tests. Excluding G2 for which no NEDC extd Cold tests were performed, CO2 of the gasoline sample increased 5% on average over each test. GDIs increased more their CO2 as compared to PFIs over the NEDC with +10% speed trace test (GDIs 5%, PFIs 3%) whereas over the 10 °C test, PFIs were slightly more affected than GDIs (GDIs 4%, PFIs 5%). In the NEDC extd Hot test, the average CO2 EF was 142 ± 22 g/km which represented an increase in CO2 of 23% as compared to the NEDC Hot test. However, G1, G3, and G4 showed an average increase of 11% whereas in G5 the use of auxiliaries led to CO2 increases of 58%.
Over the WLTC Cold, the mean CO2 EF was 131 ± 4 g/km with GDIs averaging 2% lower CO2 than PFIs (130 g/km and 133 g/km, respectively). As compared to the NEDC Cold test, the CO2 emission increased systematically on all vehicles, averaging 7 ± 3%. CO2 emissions over the WLTC Hot test were 1% lower than on the Cold test on average (131 ± 7 g/km) and GDI and PFI mean CO2 were alike. On the WLTC −7 °C Cold test, G1 (GDI) and G4 (PFI) registered 12% and 8% higher CO2 EF as compared to the 23 °C WLTC Cold test.
On the road, the CO2 EF over the RDE compliant routes averaged 151 ± 8 g/km which was 41 ± 9 % higher than the TA values. PFIs had a CO2 difference between the road and the TA value of 34% (including G5 tested at an average ambient temperature of 8 °C) whereas GDIs averaged 46% (tests in April and September at ~18 °C ambient temperature). Regarding the non-RDE compliant routes, the average CO2 EF was 155 ± 5 g/km with no overall difference between GDIs and PFIs. However, on the highway route, GDIs averaged 140 g/km whereas PFIs 6% higher CO2 EF (149 g/km) and on the hilly route, PFIs produced 7% lower CO2 EF than GDIs on average (153 g/km vs. 163 g/km). As compared to the TA CO2, GDIs and PFIs averaged 52% and 34% more CO2 on the non-RDE routes, respectively.
Considering all the testing conditions in the laboratory and on the road, the three GDIs had lower mean and median CO2 EF than the two PFIs (Figure S5c). G1, which is the gasoline vehicle with lowest TA CO2 value (98 g/km), resulted to be the one with the lowest average CO2 as well (127 g/km).

3.2. Emissions over Cycle Phases and First Five Minutes of the Tests

3.2.1. Diesel Vehicles

The average NOX EF of the diesel fleet on UDC and EUDC was 51 ± 17 mg/km and 32 ± 24 mg/km, respectively (Figure 3a). Vehicles with LNT only averaged 3.8× higher NOX over EUDC than vehicles that mounted an SCR (45 mg/km and 12 mg/km, respectively), whereas over UDC the average NOX was alike for both technologies. The low phase of WLTC also registered similar NOX for LNTs and SCRs (fleet average 132 ± 59 mg/km). The extra-high phase of WLTC was the one registering highest average NOX values 266 ± 357 mg/km with a LNTs emitting 10.5 times higher NOX than SCRs (402 mg/km and 38 mg/km, respectively). The difference between LNTs and SCRs was even higher on the high phase (172 mg/km and 9 mg/km, respectively). On the road, the average NOX levels were higher on the motorway bin, followed by the rural and the urban (689 mg/km, 505 mg/km, and 423 mg/km, respectively). LNTs emitted on average two times as much NOX as SCRs on all bins. D2 kept its NOX emissions below 80 mg/km on all cycle phases and road bins. By contrast, D7 emitted ~1800 mg/km in the RDE motorway (at an ambient temperature of 4 °C), 22 times above the TA limit over NEDC test. Distance-specific emissions over the first five minutes of NEDC, WLTC, and RDE were 66 ± 35 mg/km, 164 ± 78 mg/km, and 418 ± 199 mg/km, respectively. The NOX emissions from LNTs ranged 15%–35% higher than the one of SCRs over the cold start phase.
The average PN EF of the diesel fleet on UDC was 3.9 × 10¹⁰ ± 2.9 × 10¹⁰ #/km almost 20 times higher than over the EUDC (Figure 3b). The difference can be explained by the large contribution of the emission on the first five minutes of the test which reached on average 9.2 × 10¹⁰ ± 6.9 × 10¹⁰ #/km. The low phase of WLTC was also the phase with the highest PN for all vehicles with an average emission of 6.5 × 10¹¹ #/km. Again, emissions released during the cold start explained the larger emissions of the low phase. PN emissions over the cold start of the WLTC averaged 1.6 × 10¹² ± 2.5 × 10¹² #/km which is three orders of magnitude higher than the average PN over the high and extra-high phases. The urban bin of the RDE tests exhibited emissions of 1010#/km whereas over the rural and motorway, PN values were in the order of 109 #/km. PN emissions associated with cold start averaged 2.6 × 10¹¹ #/km.
All diesel vehicles complied with the 500 mg/km CO emission limit over NEDC (Figure 3c). The CO averaged 173 ± 139 mg/km over NEDC, 64 ± 76 mg/km over WLTC, and 73 ± 75 mg/km on-road over RDE compliant routes. Among individual vehicles, there was a large difference in CO emission. Considering the whole cycles, D8 had very low CO over the three tests (NEDC: 3 mg/km, WLTC: 9 mg/km, and RDE 5 mg/km) whereas D5 emitted 118 times more than D8 on NEDC (388 mg/km), 28 times more on WLTC (261 mg/km) and 12 times more over RDE (60 mg/km). The large distance-specific emission on the cold start caused that the highest EF was found on the starting phase of each cycle (i.e., UDC, WLTC low, and RDE urban). It is significant that on average for the diesel sample, CO over the cold start phase of NEDC (1103 mg/km) was 4.0 and 2.6 times higher than the cold start EF over the WLTC (276 mg/km) and the RDE (423 mg/km), respectively. In addition, it is noteworthy that LNTs averaged a CO EF over the cold start of the NEDC that was 72% lower than the average for diesel vehicles equipped with SCR only (D3, D6) (681 mg/km and 2416 mg/km, respectively). However, SCRs averaged 11% higher cold start emission on the road than LNTs. On all phases of WLTC and RDE including cold start EF, CO is lower than the 500 mg/km limit over the complete Type I test.
HC emissions were not measured on the road and therefore only HC emission values from the laboratory tests are discussed (Figure 3d). Over Type I test, the HC limit for diesel vehicles is expressed in combination with NOX as HC+NOX 170 mg/km. All vehicles complied with this limit with maximum HC+NOX measured on D7 (100 mg/km) and an average for the fleet of 63 ± 26 mg/km. The average standalone HC EF for the fleet was 24 ± 13 mg/km with maximum emissions again for D7 (50 mg/km). The emission of HC is related to the cold start effect with HC EF averaging 82 mg/km on the first five minutes, 44 mg/km on UDC and 13 mg/km on the EUDC pointing to a good performance of DOC when the optimum operating temperature is reached (catalyst light-off). A similar pattern is found over WLTC with maximum HC EF found on the low phase (25 mg/km on average) and <20 mg/km on all other phases. D3 and D6 yielded 0 mg/km emission on the EUDC and WLTC medium, high, and extra-high phases suggesting an optimal operation of DOC and/or low engine-out emission.
CO2 emissions from diesel vehicles were largely affected by emissions during the cold start with distance-specific emissions over the first five minutes on NEDC, WLTC, and RDE being higher than any other phase (177 g/km, 181 g/km, and 264 g/km). Over WLTC, CO2 EF was highest in the low and extra-high phases (179 g/km and 164 g/km, respectively) while in the medium and high phases, the average CO2 EF was 142 g/km and 129 g/km, respectively (Figure 3e). A similar pattern is observed over RDE with the rural bin (the one with intermediate average speed) yielding the lowest average CO2 values.

3.2.2. Gasoline Vehicles

NOX emissions over the cold start phase of the NEDC contributed substantially to the total emissions over the complete test with an average value of 36 ± 18 mg/km, roughly five times higher than that of the complete NEDC (Figure 4a). The EUDC value was close to 0 mg/km emission on average for the fleet with the maximum value reached by G2 (4 mg/km). Cold start phase NOX emission were higher also compared to of all phases of WLTC and RDE tests (56 ± 36 mg/km and 83 ± 54 mg/km, respectively). The average NOX emission over WLTC phases never exceeded the 60 mg/km limit established for gasolines on Type I, but this limit was exceeded on the RDE urban bin with an average of 79 ± 54 mg/km. The large standard deviations on the NOX emissions were caused by the different behaviour of PFIs against GDIs. PFIs average NOX EF never exceeded 30 mg/km on any of the cycles phases with the cold start phase included. However, GDIs emitted on average up to 122 mg/km on the RDE urban, 81 mg/km in the RDE rural and >70 mg/km on the WLTC medium and high phases, all of them above the Type I limit of 60 mg/km.
PN on gasoline vehicles was also very much affected by the emission over the cold start (Figure 4b) with an overall cold start PN EF of 9 × 10¹² ± 4.8 × 10¹² #/km for GDIs and 2 × 10¹² ± 1.5 × 10¹² #/km for PFIs, respectively (maximum cold start PN EF for G3 with 2 × 10¹³#/km). For both PFIs and GDIs, the WLTC and RDE phases with intermediate engine load (WLTC medium and high, RDE rural), PN emission was lower than over the phases with high exhaust mass flow (WLTC extra-high and RDE motorway). For PFIs, the PN EF of motorway RDE section (4.5 × 10¹¹ #/km) was 25× higher than the EUDC and 5× higher than the WLTC extra-high phase. However, on GDIs, motorway PN EF (1.7 × 10¹² #/km) was 1.8× higher than EUDC and it was slightly lower than the WLTC extra-high phase (2.2 × 10¹² #/km).
All gasoline cars exhibited CO emissions below the limit on Type I (1000 mg/km) averaging 334 ± 54 mg/km over NEDC Cold, 705 ± 317 mg/km over WLTC Cold, and 799 ± 708 mg/km on the RDE compliant tests (Figure 4c). However, all gasolines had a CO EF over the cold start that exceeded the Type I limit (1000 mg/km) both in the laboratory tests (NEDC: 1567 ± 371 mg/km; WLTC: 2042 ± 606 mg/km) and on-road (1510 ± 642 mg/km). Average cold start CO emission from PFIs was 16% lower than those of GDIs (1526 mg/km and 1827 mg/km). It is noteworthy, that beyond the CO emissions associated with the cold start (thus affecting the first phase of each test), CO emissions over the WLTC extra-high and RDE motorway were higher than the EUDC, with at least 4 times more emissions on the road than on the EUDC (Figure S6). For instance, CO EF over the RDE motorway bin was up to 23 times higher than over EUDC on G5 (6640 mg/km vs. 286 mg/km).
Gasoline vehicles averaged 38 ± 9 mg/km of HC on NEDC Cold with a maximum emission of 47 mg/km (G2), half the limit for HC on Type I test (Figure 4d). Both over NEDC and WLTC (HC was not measured on-road), the HC emission associated to cold start had a significant contribution to the final emissions with an average cold start value of 292 ± 68 mg/km on both cycles. Although HC emissions are low as compared to the 100 mg/km limit, GDIs yielded 20%–25% higher HC than PFIs associated to their higher emission over the cold start. Emission levels over the EUDC and WLTC medium, high, and extra-high phases were lower than 12 mg/km on all vehicles with no particular difference between PFIs and GDIs.
The cold start emissions of CO2 had a significant weight also on total CO2 for all cycles tested. Emissions were higher over the urban parts due to the extra fuel consumed, and due to a more transient behaviour of the vehicles (Figure 4e). Over EUDC, WLTC medium, high, extra-high no apparent difference was observed on CO2 emissions of PFIs and GDIs. Although some differences on the on-road CO2 EFs by phase between GDIs and PFIs are observed, those could be caused by different driving conditions, ambient temperature, and payload rather than fuel economy and are, therefore, not further described.

3.3. Comparison to EMEP/EEA Guidebook Inventory

In general terms, there is a good agreement in the hot speed-based EFs between the average experimental data and the EFs calculated according to the EMEP/EEA guidebook (gbEFs) for both diesel (Figure 5) and gasoline (Figure 6) vehicle samples. It is important to notice that for NOX and CO, the distance-specific emission distributions are right skewed with few occurrences, corresponding to peak emissions, contributing largely to the averages. For this reason in some cases the average value (diamond) appears to be outside the “boxes” that present the median and 1st and 3rd quartile. It could be argued that very high values should be treated as outliers and excluded from the sample and the subsequent analysis. However it is the case that high-emission events occur under the operating conditions being studied. Such events are linked to various factors and should be taken into account when developing emissions factors for monitoring purposes. Since no particular reasons for excluding such events were identified, the values were included in the analysis. In practical terms the box-plots should be viewed as representative of the performance over the majority of conditions, whereas the average values should be viewed as being representative of the sum of pollutants eventually emitted.
Diesel NOX speed-based gbEFs lie in between the average WLTC EFs and RDE EFs for speed ranges above 50 km/h and below 120 km/h (Figure 5a) being in general closer to the average on-road rather than the laboratory data. At speeds lower than 50 km/h, and in particular for the slowest speed bins (10–20 and 20–30 km/h), NOX gbEFs are ~30% higher than those measured on the road. By contrast, average on-road EFs are ~20% and ~40% higher than the gbEFs on the 50–90 km/h and 90–100 km/h ranges, respectively. CO speed-based gbEFs lie in between the WLTC EFs and the RDE EFs for most of the speed bins (Figure 5b). Under 50 km/h, CO gbEFs are 45% lower than the EFs retrieved on-road, whereas between 50 and 120 km/h, RDE EFs are 15% higher than gbEFs. Finally, CO2 gbEFs Figure 5c) match well the average EFs obtained both on the road over bins above 30 km/h, and in the laboratory from speed bins above 90 km/h.
Gasoline NOX gbEFs tend to be more comparable to the WLTC EFs than to the RDE EFs (Figure 6a). In fact, RDE EFs are 66% higher than gbEFs on speed bins 20–70 km/h. On speed bins higher than 60 km/h the relative difference is higher than 50% although in absolute terms, EFs are lower than 20 mg/km. Regarding CO, speed dependence of the gbEFs depicts a similar pattern than the experimental data with higher emissions as the speed increases (Figure 6b). However, CO gbEFs are ~30% lower than the RDE EFs on bins 10–30 km/h and 50% lower on bins 60–90 km/h. At speeds compatible with motorway driving i.e., higher than 90 km/h. RDE EFs are ~85% higher than the gbEFs which clearly underestimate the CO emission from gasoline vehicles as compared to the experimental data gathered on the road. Finally, the CO2 gbEFs tend to be higher than the average WLTC and RDE EFs although the general pattern is well captured. CO2 corrections based on engine capacity, TA CO2 and vehicle mass were not applied and they could potentially help reducing the observed gap.

4. Discussion

The data collected on the JRC investigations on vehicle emissions compliance is very comprehensive in terms of the diversity of testing conditions in the laboratory and on the road and it is, therefore, appropriate to explore the emissions performance of the Euro 6b fleet. Most of the data presented are novel: laboratory results over cycle phases and cold start of different driving cycles; CO2 data from laboratory tests other than standard NEDC and WLTC cycles are discussed; all the on-road EFs are raw (no corrections applied for extended temperature conditions or use of weighting methods as in [21]); speed-dependent EFs over hot WLTC and RDE cycles.
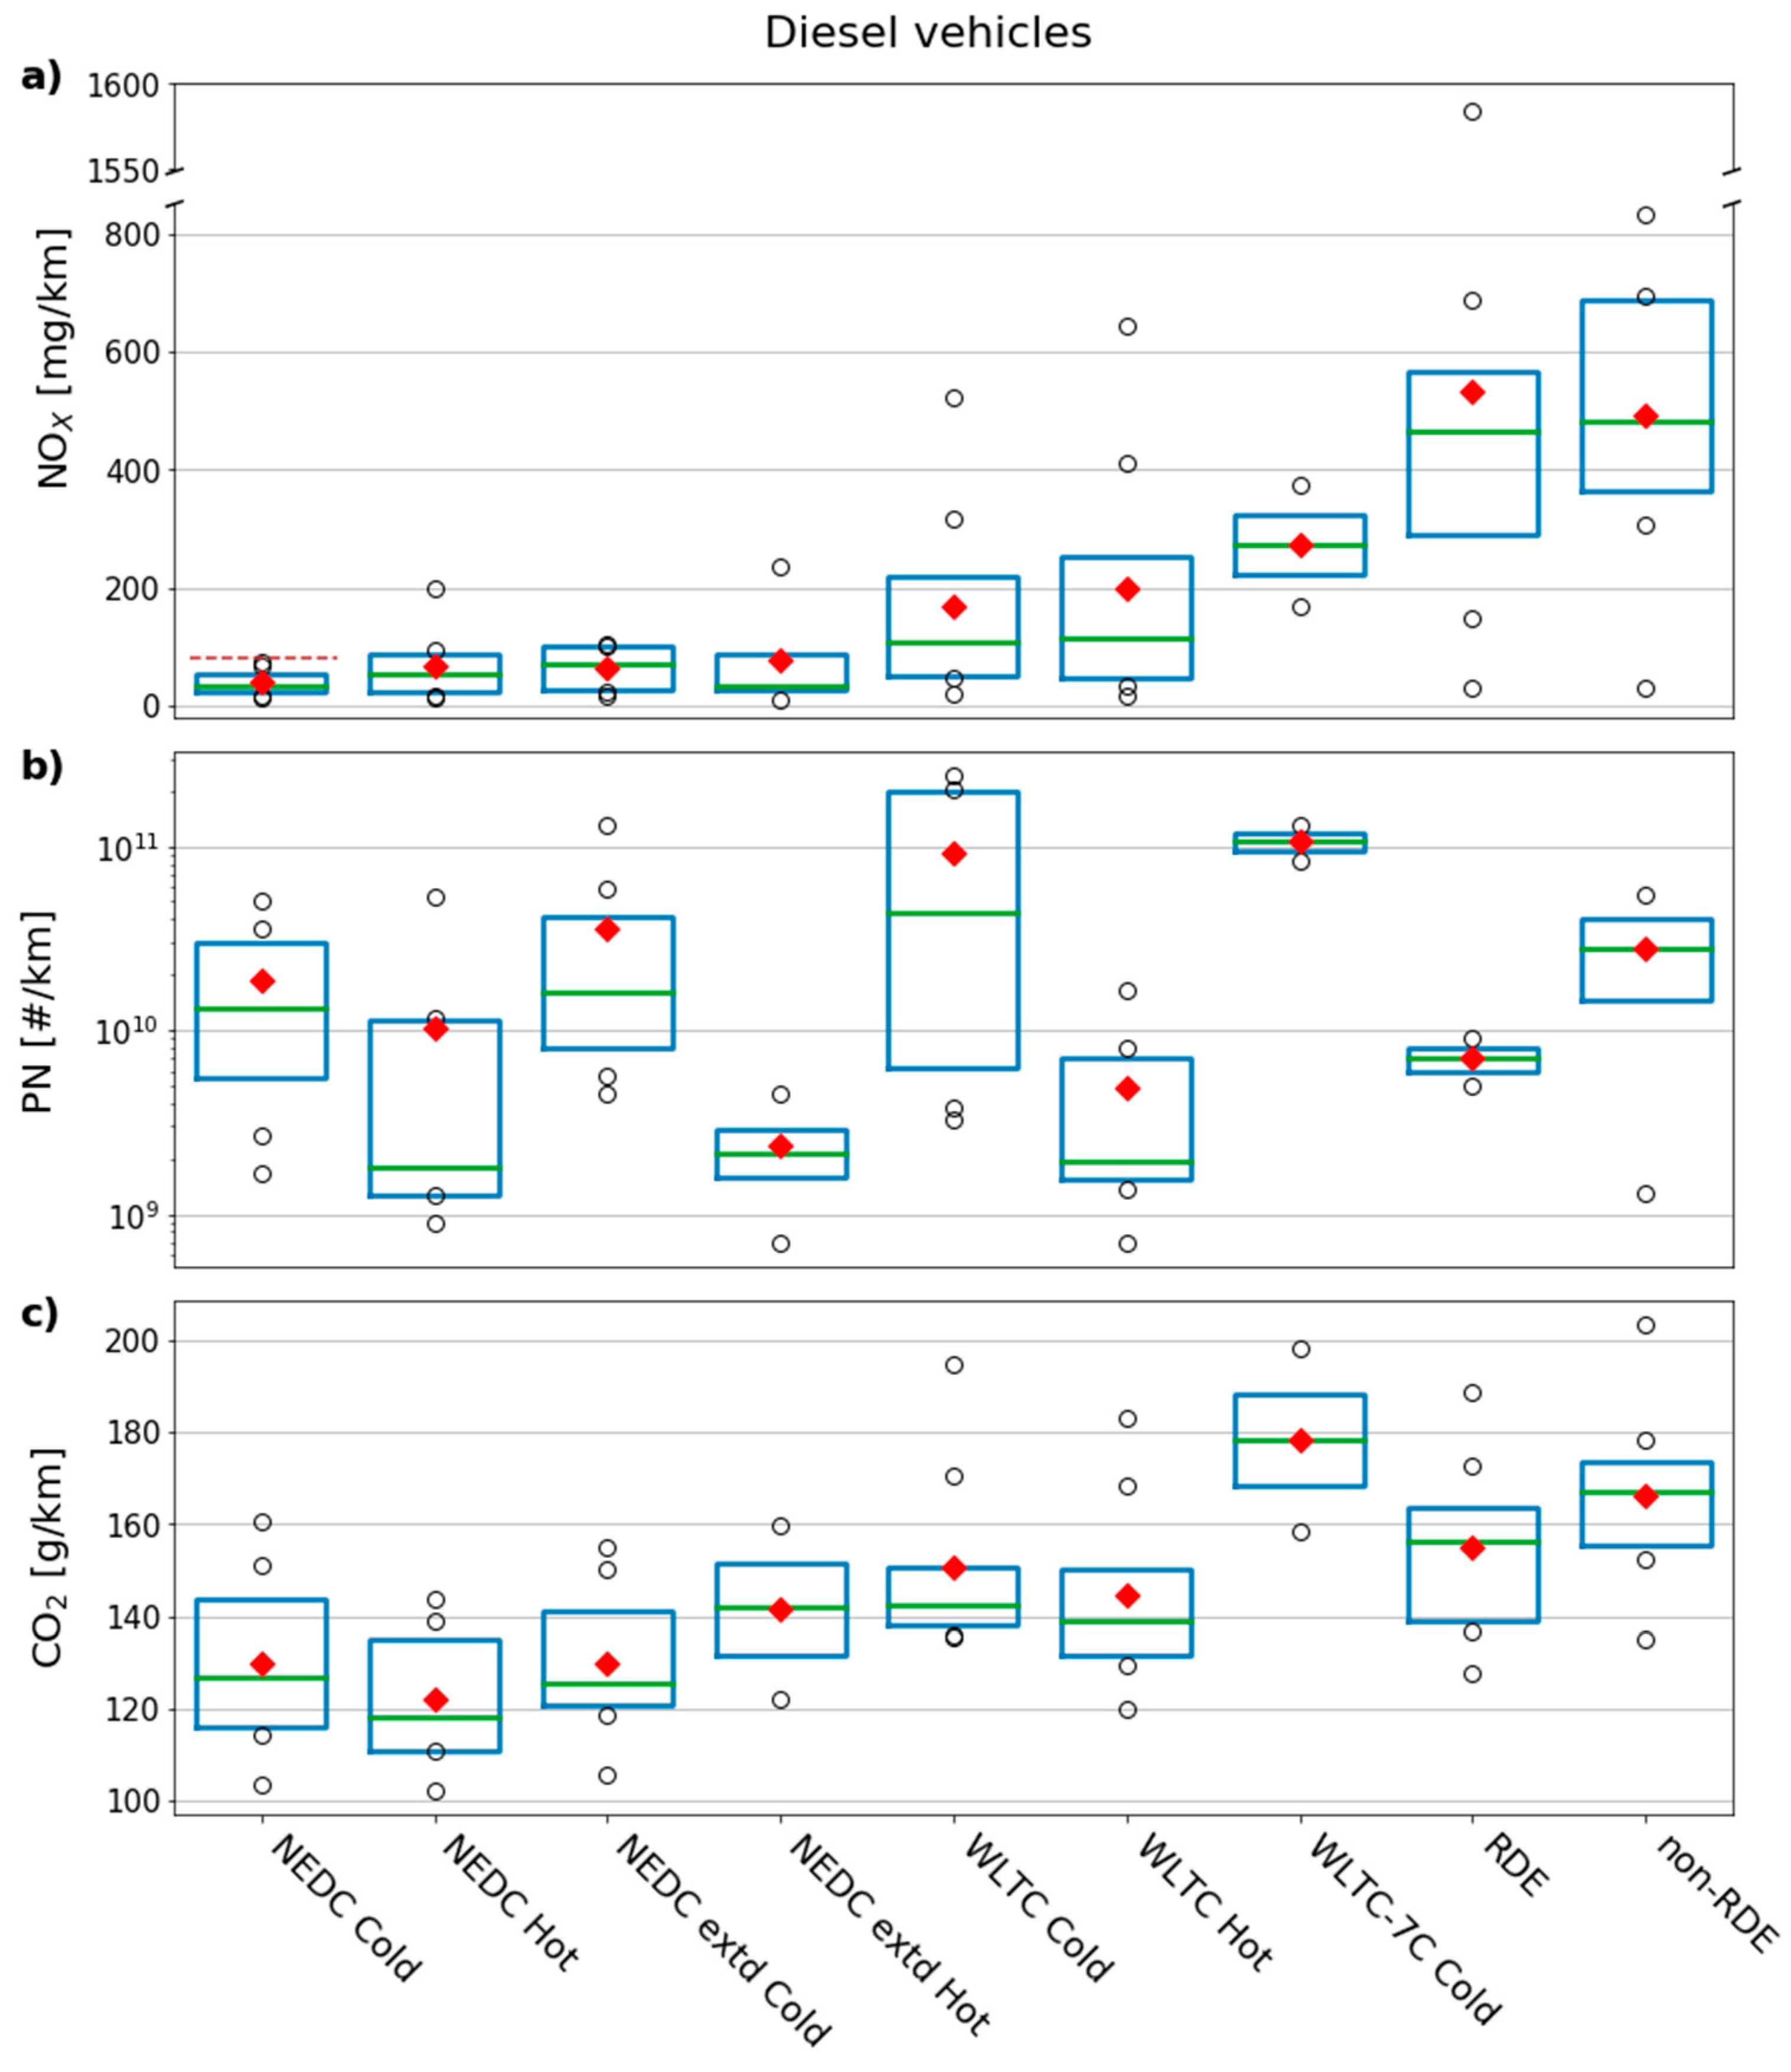
All vehicles complied with their emission limits for all the regulated pollutants on the NEDC Cold test under which they were type approved. The compliance on Type I test indirectly shows that all tested vehicles performed as they should, and that other emission results reported here are in principle not caused by malfunctioning of the tested cars. The following paragraphs discuss each pollutant individually considering the whole fleet of 13 vehicles.
For both diesel and gasoline fuelled vehicles, most of the tests performed using NEDC as driving cycle yielded emissions below or close to the Euro 6 NOX emission limits, although diesel vehicles averaged a NOX EF five times higher than the gasoline ones. However, diesel and gasoline vehicles emitted on average 3.9 and 4.7 times more NOX respectively, over WLTC than over NEDC supporting the fact that Euro 6b vehicles were optimized in terms of engine calibration and after-treatment operation, to comply with the requirements of the NEDC procedure as evidenced already by other authors [29,30]. In addition, in five out of the eight diesel vehicles, the NOx emission was higher on the NEDC hot-started test performed back-to-back with the cold-started one suggesting a change in the base emission strategy when tested slightly outside the standard TA conditions. Since there are not valid technical justifications for such behaviour on the hot-started tests, there is a suspicion about the observed change of strategy. The application of the protocol to detect illegal Auxiliary Emission Strategies (European Commission Notice of 26.1.2017) showed no exceedances of the recommended thresholds for NOx on the NEDC hot test [21], except for vehicle D4 which had already undergone a voluntary recall organized by the manufacturer. On the road, diesel and gasoline vehicles averaged a NOX EF 14 and 7 times higher than under TA conditions, respectively which is in agreement with existing literature [17,31,32,33]. The diesel vehicles emitted on average 10 times more NOX compared to the gasoline ones over the RDE compliant tests. This difference between NOX EF as measured over the NEDC and on the road confirms that the NEDC is far from being a realistic driving cycle and that EFs derived from it do not provide accurate information on the actual emissions performance of vehicles. NOX EFs obtained over WLTC, which is designed to be representative of real driving patterns are between two thirds (diesel vehicles) and one third (gasoline vehicles) lower than EFs on the road over RDE routes. PEMS-based tests seem like an important inflection point to obtain EFs that can subsequently be used in emission models that accurately represent real emissions of passenger cars.
The NOX Not-To-Exceed (NTE) limit applicable for Euro 6d-TEMP vehicles at TA on RDE tests is 168 mg/km and 126 mg/km for diesel and gasoline vehicles, respectively, and it is applicable to the complete test and the urban section separately considered (EU Regulation 2017/1151); 61% of the tested vehicles (6 diesel vehicles and 2 gasolines) had NOX emissions above the NTE limits, demonstrating that the entry into force of the RDE regulation is an important challenge for vehicle manufacturers that will be required to improve the environmental performance of a large percentage of their fleets. The NTE limit for NOX will be further reduced from 2020 based on annual reviews of the conformity factor to account for the reduction of the measurement uncertainty of PEMS as compared to laboratory equipment. According to the last available review (EU Regulation 2018/1832), the limits will be 114.4 mg/km and 85.8 mg/km for diesel and gasoline vehicles, respectively. This NTE limit would only be met by three vehicles of the tested fleet D2, G4, and G5. All GDIs would fail the RDE test for their NOX emissions on the complete and/or urban sections which will require a better de-NOx strategy for Euro 6d-TEMP GDIs which are being quickly introduced in the European market due to its improved fuel economy as compared to PFIs [34].
Tests performed with increased 10% speed trace from standard NEDC cycle had no effect on NOX emissions which suggests that extra NOx emitted over WLTC and RDE occurs as a result of transient situations with increased load and accelerations which is in line with literature [30,35,36]. This is supported by the increase in emissions in the RDE dynamic tests as compared to the standard RDE compliant tests where average speed by bin is similar but acceleration patterns are different.
In the laboratory, auxiliaries use did not affect NOx emissions in contrast with on-road results from [37] that reported an increase NOX EF of 68-85% associated to the use of air conditioning in diesel vehicles.
On the road, at ambient temperatures above 35 °C, certain tests on diesel vehicles led to an increase up to 30% in NOX emission (and NOX/CO2 ratio). This observation is in line with results from Ko et al. [38] that found an increase of 55% NOX emissions on a test on the road performed on a diesel vehicle at 33 °C as compared to 27 °C. The increase in NOX has been explained by Kwon et al. [37] as resulting reduction of EGR rates occurring to prevent damage to EGR systems. However, no particular effect on NOX emission was found when testing diesel vehicles at 30 °C in the laboratory (still within the permitted NEDC laboratory temperature range) as compared to the standard 25 °C test. On the other hand, tests performed at 10 °C led to two times as high emissions than tests at 25 °C for all vehicles. Also the few WLTC −7 °C Cold tests performed yielded increases of 2.8× (diesel vehicles) and 1.5× (gasoline vehicles) as compared to the 23 °C WLTC, well in line with previous research [24]. Regarding NOX relation to ambient temperature it is important to notice that the highest NOX EFs measured on the road were performed in cold ambient conditions. In view of future development of EFs based on on-road measurements the impact of temperature on PEMS emission results shall be assessed in detail.
Whereas NOX EFs over the cold start of the NEDC tests is higher than the EFs of UDC and EUDC for diesel and gasoline vehicles, the total mass emitted does not play a significant role in the final emissions. In fact, for diesel vehicles, NOX EF over NEDC hot (i.e., without cold start effect) is 18% higher on average than over NEDC Cold. Regarding NOX EF in RDE, the urban NOx is the lowest of the three sections, with NOX EF on the motorway being 70% higher than on the RDE cold start.
Over the NEDC (complete cycle), LNTs emit two times as much NOX as SCRs on Cold and Hot conditions. LNT vehicles performed similar to SCR ones at the beginning of the laboratory tests (UDC/WLTC low), but once the SCR is heated up, SCRs clearly outperform LNTs, especially in transient conditions (e.g., high and extra high phases of WLTC) when LNTs emit up to 10× more NOX than SCRs. On the road, SCR performs better than LNT but the ratio is much lower than over WLTC (Figure 7), therefore assessing LNT performance based only on WLTC can be misleading. Increase in NOX on diesel LNT from NEDC to WLTC (5x) is in agreement with results by other authors [39] that have explained the additional emission by increased higher engine-out NOX which result also in lower LNT de-NOX efficiency. The vehicle that mounted both an LNT and an SCR (D2) had low NOX on all tested conditions pointing to the fact that a combination of after treatments can curb pollutant emissions under real operation. It is noticeable that not all vehicles with an LNT operated in a similar way. In fact D8 which is a diesel with LNT-only showed NOX EFs below 80 mg/km on all laboratory tests (except over WLTC at −7 °C where it reached 170 mg/km) and below the Euro 6d-TEMP limit on the RDE compliant routes which is totally not the case for D1 or D4 for example (Figure S3).
GDIs emit more NOX than PFIs on all testing conditions, being at least 6 and 9 times higher than the average NEDC over WLTC and RDE, respectively. The NOX emissions of GDIs on cold start and during the urban section are particularly high (>100 mg/km, Figure 7).
In terms of fuel-specific NOX emissions over RDE complete tests, LNTs and SCRs emit 13.5 g/kg fuel and 7.5 g/kg fuel, respectively which is roughly an order of magnitude higher than the emission of gasoline vehicles (GDI: 1.7 g/kg fuel, PFI: 0.2 g/kg fuel, Figure 8).
Regarding PN, the Euro 6b diesel vehicles, all equipped with DPF, had low emissions on all operation conditions including −7 °C WLTC test and over RDE dynamic tests, confirming that DPFs perform well in widespread driving conditions. Gasoline vehicles without particle filters emit more PN than diesel vehicles with DPF on all testing conditions. PFIs, for which no PN limit applies in the laboratory and in the road, emit one order of magnitude more PN (~1011 #/km) than diesel vehicles. These results are in agreement with the literature [40]. A PN limit for PFIs should be considered in future regulations to foster a reduction in particle emission from this powertrain. On the other side, PFIs emit one order of magnitude less PN than GDIs that average 2 × 10¹² #/km in WLTC and RDE tests (Figure 7). The tested GDIs would not meet PN limits of WLTC and RDE tests applicable for Euro 6d-TEMP. WLTC and RDE represent a challenge for GDI vehicles and will require the widespread adoption of gasoline particle filters and/or modification of the engine calibration to meet regulatory targets. For all powertrains, PN emission at cold start largely contributes to the final PN EFs. Cold start effect affects more GDIs than PFIs since PN EF is 18 times lower on NEDC Hot in PFIs than in GDIs. The fuel-specific PN emission for diesels on RDE tests is ~1 × 10¹¹ #/kg fuel whereas for as for PFIs and GDIs it is 7 × 10¹² #/kg fuel and 3 × 10¹³ #/kg fuel, respectively (Figure 8).
For diesel vehicles, CO EFs are lower than current emission limit on complete and cycle phases, both in the laboratory and on the road, which proves a good performance of DOC under real-world operation. The fact that the CO EF is higher on the NEDC as compared to WLTC and RDE can be explained by the fact that on the NEDC (cycle less transient than WLTC and RDE, and with more idling time) the DOC takes more time to heat up and reach its light-off temperature than over WLTC and RDE. In addition, the total distance of the NEDC is shorter than the one of WLTC and RDE so that the CO emission over the cold start is diluted less over the NEDC than over the other two tests. The results show that on the WLTC and RDE, the cold start effect has much lower weight in the final EFs for CO than over NEDC as pointed out by other authors [29,30,35]. It is noteworthy that the CO cold start distance-specific emissions of diesel vehicles equipped only with an SCR are 72% higher than those of diesel vehicles equipped only with LNT over NEDC whereas, the difference is only 11% under the RDE tests, pointing to a better performance of after-treatment systems under more transient conditions. On average, gasoline vehicles emit two times more CO than diesel vehicles on the NEDC whereas over the WLTC and RDE the ratio gasoline/diesel is 10×. On the gasoline fleet, NEDC CO is half of the EF measured on the WLTC and RDE which can be explained by a poor operation of the TWC under higher load operation (accelerations, high speed) which is in line with observations reported by other authors [31,35]. Fuel-specific CO emissions for diesel vehicles are higher on the RDE urban section than over the complete test averaging ~1.8 and ~1.4 g/kg fuel, respectively. The opposite occurs for gasoline vehicles with particularly high fuel-specific CO emissions of PFIs on the complete RDE test 21.8 g/kg fuel which is four times higher than on the RDE urban section alone (Figure 8).
In general terms, HC emission both on diesel and gasoline vehicles is low under all testing conditions averaging 24 ± 13 mg/km and 39 ± 9 mg/km, respectively, over NEDC (and 15 ± 11 mg/km and 31 ± 9 mg/km over WLTC). HC emissions occur essentially during the cold start as shown by previous authors [29] averaging 82 ± 51 mg/km and 292 ± 64 mg/km, for diesel and gasoline vehicles, respectively over NEDC. HC EFs over NEDC and WLTC are 20%–30% higher for GDIs than for PFIs over complete cycles and during the cold start. However, it is important to notice that the change in the operation of the after-treatment systems under high load conditions could also affect HC emission as reported by Lujan et al. [41] who measured high HC emission on the road on diesel vehicles under strong accelerations and high speed.
The difference between the declared CO2 on Type I and what was measured in the laboratory (7% in diesel vehicles and 14% in small gasoline vehicles) is in line with previous findings [35,42,43]. CO2 emission increased at colder temperatures with average increases for the diesel and gasoline samples of +7.4% (NEDC 10 °C) and +17% (WLTC −7 °C) and +4% (NEDC 10 °C) and +10% (WLTC −7 °C), respectively. The use of auxiliaries (AC and lights on) on NEDC conditions led to an average increase of 20% CO2 for all vehicles despite the diversity of vehicle characteristics (engine power, battery capacity, AC system, type of lights, etc.). For both diesel and gasoline vehicles, the transition from NEDC to WLTC yielded a systematic increase in CO2 emission although not all vehicles are affected in the same way confirming previously reported findings [44]. The cold start effect increases the CO2 emission on all vehicles although the contribution for the total CO2 differs a lot between vehicles (e.g., the CO2 EF ratio of the cold start against the total NEDC EF is two times higher for D2 than for D7). In general, the cold start effect on CO2 is less evident on WLTC than over NEDC as reported by other authors [45] due to the cycle characteristics. RDE tests are, by their on-road, real-world nature, not entirely replicable and since CO2 is largely affected by ambient temperature, traffic conditions, road grade, use of auxiliaries, driving dynamics, among other, the CO2 gap between the TA CO2 EF and the values measured on the road should be taken with care [43]. With this in mind, GDIs obtain a benefit of 3% on the road as compared to PFIs (Figure 7). Diesel vehicles emitted slightly higher average CO2 on the road as compared to gasoline, although the gasoline fleet is composed only of small segment vehicles.
The average on-road CO2 emissions were ~33% and 41% higher than the type approved CO2 emissions for diesel and gasoline vehicles, respectively.

5. Conclusions

Emission factors derived from laboratory and road-testing conditions provide complementary information which is useful to fully characterize tailpipe emissions of given vehicles. In view of large testing activities foreseen in Europe to comply with the In-Service Conformity testing (EU regulation 2018/1832) and Market Surveillance activities (EU regulation 2018/858), the production of real-world emissions data pertaining to light-duty vehicles is expected to increase, which will certainly be an opportunity to derive more accurate EFs representative of important shares of the EU fleet.
Even if Euro6d-TEMP vehicles are already on the market, Euro 6b vehicles as those characterized in this work (sold in 2015, 2016) will keep circulating in the years to come and they may even dominate the fleet for several years. It is therefore capital to properly assess their emissions so that emission abatement strategies can be properly put in place.
There is a wide diversity of emissions performance within Euro 6b which makes it difficult for air quality managers to assess the benefits of air pollution abatement measures based on vehicle discrimination by Euro standards alone. For the tested fleet NOX EFs depend on fuel type, after-treatment systems, driving cycle, and environmental conditions. Regarding NOX, for example, D2 emits 30 mg/km on the road whereas D7 emits 1585, which is 53 times more. Even for vehicles with the same after treatment (LNT only), there are differences up to 10× (i.e., D7 vs. D8). Although the combination of LNT + SCR is present only in one of the diesel vehicles assessed (D2, executive segment), this architecture of after-treatment seems to perform well under very widespread and challenging driving conditions. In fact, D2 was retype-approved as Euro 6d-TEMP in early 2018 with the same after-treatment configuration. However, the LNT technology results in up to 70% less CO emission on cold start than SCR technology.
DPFs work well over the whole range of testing conditions, with low PN on all tests for all vehicles. It is yet to be seen if the adoption of gasoline particle filters will be also widespread and secure low PN from gasolines (that shall apply for PFIs and GDIs since PFIs emit one order of magnitude more PN than diesel vehicles in laboratory and on-road conditions).
Both in the laboratory and on the road, emission at cold start and emission at the low speed phases (urban) tend to be higher for all pollutants, which supports the rationales for urban emission limits applicable to RDE tests as does the fact that many trips in Europe are short trips in urban environments. Currently there are no specific limits for tailpipe emissions on short trips (where cold start emissions are large contributors). It might be an option to include such limits in future regulations to secure low emissions also on short city trips started with a cold engine. Over the cold start, the average on-road emissions of the diesel vehicles are 418 mgNOX/km, 2.6 × 10¹¹ #/km, and 423 mgCO/km (24 mgHC/km over the cold start of WLTC). For gasoline vehicles, instead, the average emissions on the cold start of the RDE tests are 83 mgNOX/km, 4.8 × 10¹² #/km, and 1510 mgCO/km (293 mgHC/km over the cold start of WLTC).
Although the tested sample at −7 °C in this campaign was limited (4 vehicles), the cold temperature largely affect the CO2 and pollutant emissions in laboratory conditions. Over the WLTC diesel and gasoline vehicles increased their CO2 emission by 17% and 10%, respectively as compared to 23 °C. The NOX emission of the two diesel vehicles tested (both LNT), was increased 2.8 times, in average, at −7 °C whereas PN remained constant. For the gasoline vehicles (1 GDI, 1 PFI) NOX emission at −7 °C increased 50% and PN was 2–4 times higher than at 23 °C.
EFs from the EEA inventory guidebook appear to provide accurate estimates, considering their purpose (i.e., the compilation of aggregate emission inventories), but they could benefit from on-road tests within and outside RDE boundaries particularly considering the potential developments stemming from post Euro 6b technology.
Follow up of the testing activity described in this paper includes testing additional vehicles of the same type, variant, and version to confirm the findings on individual vehicles, and testing vehicles with greater mileage to assess the effect of ageing of the after-treatment systems on emissions.

Supplementary Materials

The following are available online at https://www.mdpi.com/2073-4433/10/5/243/s1: Figure S1: EU-28 fleet distribution by fuel type and engine capacity [cc] in 2016. EU-28 data source: EUROSTAT, 2018, Figure S2: Top panel: cumulative NOX emission [g], ambient temperature [C], and cumulative EGR rate on two RDE-compliant tests done on the same route on D6 in the morning and in the afternoon. Central panel: GPS vehicle speed from both tests [km/h]. Bottom panel: overview of test characteristics per bin: average speed [km/h], dynamicity (expressed as the 95th percentile of speed*positive acceleration [m2/s3], CO2 EF [g/km], and NOX EF [mg/km], Figure S3: Boxplot of emission factors per diesel vehicle for complete tests a) NOX [mg/km], b) PN [#/km], and c) CO2 [g/km]. The box represents the 1st and 3rd quartile, the green line is the median, the red diamond is the mean, and the black circles are data points beyond the interquartile range. The number in the label is the vehicle code as in Table 1, and the number in brackets is the number of tests performed on that vehicle. Note that (a) the y-axis is broken in two sections, Figure S4. CO2 [g/km] emission as function of the engine power [kW] per diesel vehicle for complete tests, Figure S5: Boxplot of emission factors per gasoline vehicle for complete tests a) NOX [mg/km], (b) PN [#/km], and (c) CO2 [g/km]. The box represents the 1st and 3rd quartile, the green line is the median, the red diamond is the mean, and the black circles are data points beyond the interquartile range. The number in the label is the vehicle code as in Table 1, and the number in brackets is the number of tests performed on that vehicle, Figure S6: Ratio of the CO EF over WLTC extra-high over CO EF over EUDC, and ratio of the CO EF over RDE motorway over CO EF over EUDC for all gasoline vehicles.

Author Contributions

Conceptualization, V.V. and G.F.; methodology, V.V. and B.A.M.; software, V.V. and B.A.M.; validation, V.V., M.C., R.S.-B., and J.P.; formal analysis, V.V., B.A.M., M.C. and J.P.; investigation, V.V., M.C., J.P., B.G., and R.S.-B.; resources, B.G., M.C., and C.A.-L.; data curation, V.V., M.C., R.S.-B., B.G., and J.P.; writing—original draft preparation, V.V. and B.A.M.; writing—review and editing, V.V., B.A.M., B.G., M.C., J.P., R.S.-B., C.A.-L., and G.F.; visualization, V.V. and B.A.M.; supervision, G.F.; project administration, C.A.-L., M.C., and B.G.

Funding

This research received no external funding.

Acknowledgments

The authors gratefully acknowledge all the JRC VELA personnel for their contribution to the laboratory and on-road testing activities, in particular M. Cadario, P. Le Lijour, F. Montigny, A. Zappia, F. Forni, D. Lesueur, M. Carriero, M. Otura, F. Forloni, and M. Sculati. The authors also acknowledge the comments and suggestions of two anonymous reviewers.

Conflicts of Interest

The authors declare no conflict of interest.

Abbreviations

ACAir conditioning system
ARTEMISAssessment and Reliability of Transport Emission Models and Inventory Systems
ColdSCorrespond to calculated distance-specific emissions during cold start (i.e., first 300 s of the test)
COPERTEuropean Road Transport Emission Inventory Model
DiSCminiDiffusion Size Classifier Miniature
DOCDiesel Oxidation Catalyst
DPFDiesel Particulate Filter
EGRExhaust Gas Recirculation
EFsEmission factors
EMEP/EEAEuropean Monitoring Evaluation Programme / European Environment Agency
EUEuropean Union
EU-28The 28 Member States of the European Union at the time of writing
EUDCExtra Urban Driving Cycle
gbEFsEFs from the EMEP/EEA guidebook inventory
GDIGasoline Direct Injection
GHGGreenhouse gases
HCTotal Hydrocarbons
HOTHot engine at cycle start
JRCJoint Research Centre
LNTLean NOX Trap
LCVLight commercial vehicle
MEETMethodologies for estimating air pollutant emissions from transport
NEDCNew European Driving Cycle
NEDC extdNEDC extended: NEDC test with non-standard ambient temperature, speed trace, or use of auxiliaries
NPETNanoparticle Emission Tester
PEMSPortable Emissions Measurement System
PFIGasoline Port Fuel Injection
PM2.5Particulate matter with diameter lower than 2.5 microns
PNParticle Number
RDEReal-Driving Emissions
RLsRoad Loads
SCRSelective Catalytic Reduction
TAType approval
TWCThree-Way Catalyst
UDCUrban Driving Cycle
WLTCWorldwide harmonised Light-duty vehicles Test Cycle
WLTPWorldwide harmonized Light-duty vehicles Test Procedure

References

  1. European Environment Agency. Annual European Union Greenhouse Gas Inventory 1990–2016 and Inventory Report 2018, EEA Report |No 5/2018. 2018. Available online: https://www.eea.europa.eu/publications/european-union-greenhouse-gas-inventory-2018 (accessed on 29 March 2019).
  2. European Environment Agency. EEA Greenhouse Gas—Data Viewer. 2019. Available online: https://www.eea.europa.eu/data-and-maps/data/data-viewers/greenhouse-gases-viewer (accessed on 29 March 2019).
  3. European Environment Agency. Air Quality in Europe—2018 Report, EEA Report |No 12/2018. 2018. Available online: https://www.eea.europa.eu//publications/air-quality-in-europe-2018 (accessed on 20 March 2019).
  4. World Health Organization. Review of Evidence on Health Aspects of Air Pollution—REVIHAAP Project, Technical Report, Regional Office for Europe, Copenhagen. 2013. Available online: http://www.euro.who.int/__data/assets/pdf_file/0004/193108/REVIHAAP-Final-technical-report-final-version.pdf (accessed on 29 March 2019).
  5. International Agency for Research on Cancer. Diesel and Gasoline Engine Exhausts and Some Nitroarenes. IARC Monographs on the Evaluation of Carcinogenic Risks to Humans. Volume 105. 2014. Available online: https://monographs.iarc.fr/wp-content/uploads/2018/06/mono105.pdf (accessed on 29 March 2019).
  6. Oldenkamp, R.; van Zelm, R.; Huijbregts, M.A.J. Valuing the human health damage caused by the fraud of Volkswagen. Env. Poll. 2016, 212, 121–127. [Google Scholar] [CrossRef] [PubMed]
  7. Anenberg, S.C.; Miller, J.; Minjares, R.; Du, L.; Henze, D.K.; Lacey, F.; Malley, C.S.; Emberson, L.; Franco, V.; Klimont, Z.; et al. Impacts and mitigation of excess diesel-related NOX emissions in 11 major vehicle markets. Nature 2017, 545, 467–471. [Google Scholar] [CrossRef] [PubMed]
  8. Miranda, A.I.; Ferreira, J.; Silveira, C.; Relvas, H.; Duque, L.; Roebeling, P.; Lopes, M.; Costa, S.; Monteiro, A.; Gama, C.; et al. A cost-efficiency and health benefit approach to improve urban air quality. Sci. Total Environ. 2016, 569–570, 342–351. [Google Scholar] [CrossRef]
  9. Borge, R.; Santiago, J.L.; de la Paz, D.; Martín, F.; Domingo, J.; Valdés, C.; Sánchez, B.; Rivas, E.; Rozas, M.T.; Lázaro, S.; et al. Application of a short term air quality action plan in Madrid (Spain) under a high-pollution episode—Part II: Assessment from multi-scale modelling. Sci. Total Environ. 2018, 635, 1574–1584. [Google Scholar] [CrossRef] [PubMed]
  10. Borge, R.; Lumbreras, J.; Perez, J.; de la Paz, D.; Vedrenne, M.; de Andres, J.M.; Rodriguez, M.E. Emission inventories and modeling requirements for the development of air quality plans. Application to Madrid (Spain). Sci. Total Environ. 2014, 466–467, 809–819. [Google Scholar] [CrossRef] [PubMed]
  11. Pisoni, E.; Albrecht, D.; Mara, T.A.; Rosati, R.; Tarantola, S.; Thunis, P. Application of uncertainty and sensitivity analysis to the air quality SHERPA modelling tool. Atmos. Environ. 2018, 183, 84–93. [Google Scholar] [CrossRef]
  12. European Environment Agency. EMEP/EEA Air Pollutant Emission Inventory Guidebook 2016. EEA Report. No 21/2016. 2016. Available online: https://www.eea.europa.eu//publications/emep-eea-guidebook-2016 (accessed on 29 March 2019).
  13. Ntziachristos, L.; Gkatzoflias, D.; Kouridis, C.; Samaras, Z. COPERT: A European road transport emission inventory model. In Information Technologies in Environmental Engineering; Athanasiadis, P.A., Mitkas, A.E., Rizzoli, J., Gómez, M., Eds.; Springer: New York, NY, USA, 2009; pp. 491–504. [Google Scholar]
  14. Franco, V.; Kousoulidou, M.; Muntean, M.; Ntziachristos, L.; Hausberger, S.; Dilara, P. Road vehicle emission factors development: A review. Atmos. Environ. 2013, 70, 84–97. [Google Scholar] [CrossRef]
  15. Guevara, M.; Tarrasón, L. Which Are the Priority Sectors? Lessons Learned and New Emission Sources to be Considered. Proceedings of the Forum for Air Quality Modelling in Europe, 11th Plenary Meeting, Baveno, Italy, 27/02/2018. Available online: http://fairmode.jrc.ec.europa.eu/document/fairmode/event/presentation/Baveno2018/201802_16WG2Lessonslearned_NewChallenges.pdf (accessed on 29 March 2019).
  16. Franco, V.; Posada Sanchez, F.; German, J.; Mock, P. Real-World Exhaust Emissions from Modern Diesel Cars. ICCT. White Paper. 2014. Available online: https://www.theicct.org/sites/default/files/publications/ICCT_PEMS-study_diesel-cars_20141010.pdf (accessed on 29 March 2019).
  17. Ntziachristos, L.; Papadimitriou, G.; Ligterink, N.; Hausberger, S. Implications of diesel emissions control failures to emission factors and road transport NOX evolution. Atmos. Environ. 2016, 141, 542–551. [Google Scholar] [CrossRef]
  18. Mock, P.; German, J.; Bandivadekar, A.; Riemersma, I.; Ligterink, N.; Lambrecht, U. From Laboratory to Road: A Comparison of Official and ‘Real-World’ Fuel Consumption and CO2 Values for Cars in Europe and the United States, ICCT. White Paper. 2013. Available online: https://www.theicct.org/sites/default/files/publications/ICCT_LabToRoad_20130527.pdf (accessed on 29 March 2019).
  19. European Automobile Manufacturers Association. ACEA Report Vehicles in Use Europe 2018. 2018. Available online: https://www.acea.be/uploads/statistic_documents/ACEA_Report_Vehicles_in_use-Europe_2018.pdf (accessed on 29 March 2019).
  20. Favre, C. Modern, Real-Driving Emissions (RDE) Compliant Cars: Key to Improving Urban Air Quality. Proceedings of the Polis Conference, Manchester, UK, 22/11/2018. 2018. Available online: https://www.aecc.eu/wp-content/uploads/2018/11/181122-AECC-presentation-Polis-conference.pdf (accessed on 29 March 2019).
  21. Clairotte, M.; Valverde, V.; Bonnel, P.; Giechaskiel, B.; Carriero, M.; Otura, M.; Fontaras, G.; Pavlovic, J.; Martini, G.; Krasenbrink, A.; et al. Joint Research Centre, 2017 Light-Duty Vehicles Emissions Testing; Publications Office of the European Union: Luxembourg, 2018. [Google Scholar]
  22. European Commission. Merger Procedure Article 6(1)(b) of Council Regulation (EEC) No 4064/89—Decision on Case No IV/M.1406. HYUNDAI/KIA. 1999. Available online: http://ec.europa.eu/competition/mergers/cases/decisions/m1572_en.pdf (accessed on 29 March 2019).
  23. EUROSTAT. Passenger Cars, by Type of Motor Energy and Size of Engine (Code: Road_Eqs_Carmot). Update: 19-04-2018. Data from 2016 Except for The Netherlands (2012). No Data Available from Bulgaria, Romania, Iceland, Denmark, Greece, Lithuania, Luxembourg, and Slovakia. 2018. Available online: http://appsso.eurostat.ec.europa.eu/nui/show.do?dataset=road_eqs_carmot&lang=en (accessed on 29 March 2019).
  24. Suarez-Bertoa, R.; Astorga, C. Impact of cold temperature on Euro 6 passenger car emissions. Environ. Pollut. 2018, 234, 318–329. [Google Scholar] [CrossRef]
  25. Giechaskiel, B.; Cresnoverh, M.; Jörgl, H.; Bergmann, A. Calibration and accuracy of a particle number measurement system. Meas. Sci. Technol. 2010, 21, 4. [Google Scholar] [CrossRef]
  26. Tsiakmakis, S.; Fontaras, G.; Cubito, C.; Pavlovic, J.; Anagnostopoulos, K.; Ciuffo, B. From NEDC to WLTP: Effect on the Type-Approval CO2 Emissions of Light-Duty Vehicles; Publications Office of the European Union: Luxembourg, 2017. [Google Scholar]
  27. Giechaskiel, B.; Schwelberger, M.; Delacroix, C.; Marchetti, M.; Feijen, M.; Prieger, K.; Andersson, S.; Karlsson, H. Experimental assessment of solid particle number portable emissions measurement systems (PEMS) for heavy-duty vehicles applications. J. Aerosol Sci. 2018, 123, 161–170. [Google Scholar] [CrossRef]
  28. Ntziachristos, L.; Samaras, Z. Methodology for the Calculation of Exhaust Emissions e SNAPs 070100-070500, NFRs 1A3bi-iv (EMEP/EEA Air Pollutant Emission Inventory Guidebook 2016—Update July. 2018). Available online: https://www.eea.europa.eu/publications/emep-eea-guidebook-2016/part-b-sectoral-guidance-chapters/1-energy/1-a-combustion/1-a-3-b-i/view (accessed on 29 March 2019).
  29. Andersson, J.; May, J.; Favre, C.; Bosteels, D.; de Vries, S.; Heaney, M.; Keenan, M.; Mansell, J. On-Road and Chassis Dynamometer Evaluations of Emissions from Two Euro 6 Diesel Vehicles. SAE Int. J. Fuels Lubr. 2014, 7, 919–934. [Google Scholar] [CrossRef]
  30. Bielaczyc, P.; Woodburn, J.; Szczotka, A. Exhaust Emissions of Gaseous and Solid Pollutants Measured over the NEDC, FTP-75 and WLTC Chassis Dynamometer Driving Cycles. Available online: https://www.sae.org/publications/technical-papers/content/2016-01-1008/ (accessed on 29 March 2019).
  31. May, J.; Bosteels, D.; Favre, C. An Assessment of Emissions from Light-Duty Vehicles using PEMS and Chassis Dynamometer Testing. SAE Int. J. Engines. 2014, 7, 1326–1335. [Google Scholar] [CrossRef]
  32. Baldino, C.; Tietge, U.; Muncrief, R.; Bernard, Y.; Mock, P. Road Tested: Comparative Overview of Real-World Versus Type-Approval NOX and CO2 Emissions From Diesel Cars in Europe. ICCT. White Paper. 2017. Available online: https://www.theicct.org/sites/default/files/publications/ICCT_RoadTested_201709.pdf (accessed on 29 March 2019).
  33. O’Driscoll, R.; Stettler, M.E.J.; Molden, N.; Oxley, T.; ApSimon, H.M. Real world CO2 and NOX emissions from 149 Euro 5 and 6 diesel, gasoline and hybrid passenger cars. Sci. Total Environ. 2018, 621, 282–290. [Google Scholar] [CrossRef]
  34. Davis, S.C.; Williams, S.E.; Boundy, R.G.; Moore, S. 2016 Vehicle Technologies Market Report. Oak Ridge National Laboratory Report ORNL/TM-2017/238. 2017. Available online: http://info.ornl.gov/sites/publications/files/Pub74587.pdf (accessed on 29 March 2019).
  35. Marotta, A.; Pavlovic, J.; Ciuffo, B.; Serra, S.; Fontaras, G. Gaseous Emissions from Light-Duty Vehicles: Moving from NEDC to the New WLTP Test Procedure. Environ. Sci.Technol. 2015, 49, 8315–8322. [Google Scholar] [CrossRef]
  36. Triantafyllopoulos, G.; Katsaounis, D.; Karamitros, D.; Ntziachristos, L.; Samaras, Z. Experimental assessment of the potential to decrease diesel NOX emissions beyond minimum requirements for Euro 6 Real Drive Emissions (RDE) compliance. Sci. Total Environ. 2018, 618, 1400–1407. [Google Scholar] [CrossRef]
  37. Kwon, S.; Park, Y.; Park, J.; Kim, J.; Choi, K.H.; Cha, J.S. Characteristics of on-road NOX emissions from Euro 6 light-duty diesel vehicles using a portable emissions measurement system. Sci. Total Environ. 2017, 576, 70–77. [Google Scholar] [CrossRef]
  38. Ko, J.; Myung, C.L.; Park, S. Impacts of ambient temperature, DPF regeneration, and traffic congestion on NOX emissions from a Euro 6-compliant diesel vehicle equipped with an LNT under real-world driving conditions. Atmos. Environ. 2019, 200, 1–14. [Google Scholar] [CrossRef]
  39. Myung, C.L.; Jang, W.; Kwon, S.; Ko, J.; Jin, D.; Park, S. Evaluation of the real-time de-NOX performance characteristics of a LNT-equipped Euro-6 diesel passenger car with various vehicle emissions certification cycles. Energy 2017, 132, 356–369. [Google Scholar] [CrossRef]
  40. Giechaskiel, B.; Lahde, T.; Suarez-Bertoa, R.; Clairotte, M.; Grigoratos, T.; Zardini, A.; Perujo, A.; Martini, G. Particle Number Measurements in the European Legislation and Future JRC Activities. Combustion Engines 2018, 174, 3–16. [Google Scholar]
  41. Luján, J.M.; Bermúdez, V.; Dolz, V.; Monsalve-Serrano, J. An assessment of the real-world driving gaseous emissions from a Euro 6 light-duty diesel vehicle using a portable emissions measurement system (PEMS). Atmos. Environ. 2018, 174, 112–121. [Google Scholar] [CrossRef]
  42. Kadijk, G.; Mensch, P.; van Spreen, J.S. Detailed Investigations and Real-World Emission Performance of Euro 6 Diesel Passenger Cars. TNO Report R10702. 2015. Available online: https://ermes-group.eu/web/system/files/filedepot/10/TNO-2015-R10702.pdf (accessed on 29 March 2019).
  43. Fontaras, G.; Zacharof, N.; Ciuffo, B. Fuel consumption and CO2 emissions from passenger cars in Europe—Laboratory versus real-world emissions. Prog. Energy Combust. Sci. 2017, 60, 97–131. [Google Scholar] [CrossRef]
  44. Fontaras, G.; Valverde, V.; Arcidiacono, V.; Tsiakmakis, S.; Anagnostopoulos, K.; Komnos, D.; Pavlovic, J.; Ciuffo, B. The development and validation of a vehicle simulator for the introduction of Worldwide Harmonized test protocol in the European light duty vehicle CO2 certification process. Appl. Energy 2018, 226, 784–796. [Google Scholar] [CrossRef]
  45. Pavlovic, J.; Marotta, A.; Ciuffo, B. CO2 emissions and energy demands of vehicles tested under the NEDC and the new WLTP type approval test procedures. Appl. Energy 2016, 177, 661–670. [Google Scholar] [CrossRef]
Figure 1. Boxplot of emission factors of the diesel sample for complete tests (a) NOX [mg/km], (b) particle number (PN) [#/km], and (c) CO2 [g/km]. The box represents the 1st and 3rd quartile, the green line is the median, the red diamond is the mean, and the black circles are data points beyond the interquartile range. In (a) the brown dashed line represents the Euro 6 emission limit at type approval for diesel vehicles over the NEDC cold test [80 mg/km] (PN limit of 6 × 10¹¹ #/km not displayed for readability). Note that in (a) the y-axis is broken in two sections, and in (b) y-axis is logarithmic.
Atmosphere 10 00243 g001
Figure 2. Boxplot of emission factors of the gasoline sample for complete tests (a) NOX [mg/km], (b) PN [#/km], and (c) CO2 [g/km]. The box represents the 1st and 3rd quartile, the green line is the median, the red diamond is the mean, and the black circles are data points beyond the interquartile range. In the (a), the brown dashed line represents the Euro 6 emission limit at type approval for gasoline vehicles over the NEDC cold test [60 mg/km] (PN provisional limit of 6 × 10¹² #/km applicable for GDIs of this study not displayed for readability). Note that in (b) y-axis is logarithmic.
Atmosphere 10 00243 g002
Figure 3. Boxplot of emission factors of the diesel sample for NEDC, WLTC, and RDE phases and their respective cold start (a) NOX [mg/km], (b) PN [#/km], (c) CO [mg/km], (d) total hydrocarbons (HC) [mg/km], and (e) CO2 [g/km]. The box represents the 1st and 3rd quartile, the green line is the median, the red diamond is the mean, and the black circles are data points beyond the interquartile range. The brown dashed lines represent the Euro 6 emission limit at type approval for diesel vehicles over the NEDC cold test for NOX [80 mg/km], PN [6 × 10¹¹#/km], and CO [500 mg/km]. Note that in (a), (c), and (e) the y-axis is broken in two sections and in (b) y-axis it is logarithmic.
Atmosphere 10 00243 g003
Figure 4. Boxplot of emission factors of the gasoline sample for NEDC, WLTC, and RDE phases and their respective cold start (a) NOX [mg/km], (b) PN [#/km], (c) CO [mg/km], (d) HC [mg/km], and (e) CO2 [g/km]. The box represents the 1st and 3rd quartile, the green line is the median, the red diamond is the mean, and the black circles are data points beyond the interquartile range. The brown dashed lines represent the Euro 6 emission limit at type approval for gasoline vehicles over the NEDC cold test for NOX [60 mg/km], PN [6 × 10¹²#/km applicable for GDIs of this study], CO [1000 mg/km], and HC [100 mg/km]. Note that in (b) y-axis is logarithmic.
Atmosphere 10 00243 g004
Figure 5. Distribution of diesel sample emissions as a function of speed over WLTC Hot (red boxes), RDE without first five minutes (blue boxes), and EFs retrieved from EMEP/EEA inventory guidebook (green line) for (a) NOX (b) CO, and (c) CO2. The box represents the 1st and 3rd quartile, the line inside the box is the median, and the diamond is the mean.
Atmosphere 10 00243 g005
Figure 6. Distribution of gasoline sample emissions as a function of speed over WLTC Hot (red boxes), RDE without first five minutes (blue boxes), and EFs retrieved from EMEP/EEA inventory guidebook (green line) for (a) NOX (b) CO, and (c) CO2. The box represents the 1st and 3rd quartile, the line inside the box is the median, and the diamond is the mean.
Atmosphere 10 00243 g006
Figure 7. Average distance-specific emissions of NOX [mg/km], PN [#/km], CO [mg/km], and CO2 [g/km] per after treatment technology (diesel vehicles) and injection type (gasoline vehicles) on the RDE complete and RDE urban tests.
Atmosphere 10 00243 g007
Figure 8. Average fuel-specific emissions of NOX [g/kg fuel], PN [#/kg fuel], and CO [g/kg fuel] per after treatment technology (diesel vehicles) and injection type (gasoline vehicles) on the RDE complete and RDE urban tests.
Atmosphere 10 00243 g008
Table 1. Vehicle characteristics.
Vehicle IDMake and ModelSegmentEngine Capacity [cm3]Engine Power [kW]TA CO2 [g/km]Transmission TypeModel YearMileage [km]Fuel/Injection TypeAfter Treatment Systems
D1Audi A3Medium1968110120Automatic201524,473dieselLNT + DPF
D2BMW 530dExecutive2993195124Automatic20174810dieselLNT + SCR + DPF
D3Citroën C4 CactusMedium15607395Manual20164792dieselSCR + DPF
D4Fiat 500xSmall1956103144Automatic201610,454dieselLNT + DPF
D5Kia SportageLarge168585124Manual201714,771dieselLNT + DPF
D6Peugeot PartnerLCV156073112Manual201779dieselSCR + DPF
D7Renault CapturSmall14616699Automatic201721,590dieselLNT + DPF
D8VW GolfMedium1968110117Automatic201525,602dieselLNT + DPF
G1Audi A1Mini9997098Manual20162539GDITWC
G2Ford FiestaSmall99859105Manual201588GDITWC
G3Opel AstraMedium99977103Manual20172074GDITWC
G4Fiat PandaMini124251119Manual20162336PFITWC
G5Renault TwingoMini99951112Manual2017654PFITWC
Table 2. Laboratory tests conducted (× stands for “at least one valid test was considered”).
Vehicle IDNEDC ColdNEDC Hot# NEDC Extd Cold Modalities# NEDC Extd Hot ModalitiesWLTC ColdWLTC HotWLTC Cold −7 °C
Engine Cool. T [°C] at Test Start23>7023>7023>70−7
D1××2 ×××
D2××3 ××
D3××2 ××
D4×× ××
D5××31××
D6××31××
D7××21××
D8××31×××
G1××21×××
G2×× ××
G3××21××
G4××21×××
G5××21××
Table 3. On-road tests conducted with indication of number of routes per typology (Real-Driving Emissions regulation (RDE) and non-RDE), test campaign dates and average ambient temperature, and type of portable emissions measuring systems (PEMS) used.
Vehicle ID# RDE Compliant Routes# Non-RDE Compliant RoutesPEMS DateAverage Ambient T [°C]Gas PEMSPN-PEMS
D122Jul-1631SEMTECH-DS-
D224Oct-1717MOVENPET
D322Jun-1627SEMTECH-ECOSTAR-
D423Apr-1719SEMTECH-DS-
D524Nov-1710MOVENPET
D624Aug-1731MOVE-
D720Dec-174MOVE-
D824Jun-1730MOVE-
G124Apr-1716MOVENanoMet 3
G222Sep-1521SEMTECH-DSNPET
G324Sep-1718MOVENPET
G424May-1729SEMTECH-ECOSTARNanoMet 3
G524Dec-178MOVENPET

