Article

Emissions of a Euro 6b Diesel Passenger Car Retrofitted with a Solid Ammonia Reduction System

1
European Commission—Joint Research Centre, I-21027 Ispra (VA), Italy
2
European Commission—DG Research & Innovation, B-1049 Brussels, Belgium
*
Author to whom correspondence should be addressed.
Atmosphere 2019, 10(4), 180; https://doi.org/10.3390/atmos10040180
Submission received: 11 March 2019 / Revised: 29 March 2019 / Accepted: 31 March 2019 / Published: 3 April 2019
(This article belongs to the Special Issue Traffic-Related Emissions)

Abstract

:
Nitrogen oxides (NOx) emissions from diesel vehicles are a serious environmental concern. Prior to the introduction of on-road tests at type approval, vehicle on-road NOx emissions were found many times higher than the applicable limits. Retrofitting an existing vehicle is a short/mid-term solution. We evaluated a NOx reduction retrofit system installed on a Euro 6b diesel passenger car both in the laboratory and on the road. The retrofit consisted of an under-floor SCR (selective catalytic reduction) for NOx catalyst in combination with a solid ammonia-based dosing system as the NOx reductant. The retrofit reduced NOx emissions from 25% (50 mg/km) to 82% (725 mg/km) both in the laboratory and on the road. The minimum reduction was achieved at cold start cycles and the maximum at hot start cycles. The retrofit had small effect on CO2 (fuel consumption). No ammonia emissions were detected and the N2O increase was negligible at cold start cycles, but up to 18 mg/km at hot start cycles. The results showed that the retrofit technology could be beneficial even for high emitting Euro 6b diesel vehicles.

1. Introduction

The European Union’s (EU) clean air policy is based on three main pillars: (i) ambient air quality standards set out in the ambient air quality Directives [1]; (ii) national emission reduction targets established in the National Emission Ceilings (NEC) Directive [2]; (iii) emission and energy efficiency standards. The annual limit value for nitrogen dioxide (NO2) continues to be widely exceeded across Europe, even if concentration and exposure are decreasing. In 2016, 88% of concentrations exceeding this limit value were observed at traffic stations [3]. The transport sector was the largest contributor accounting for 39% of total NO2 emissions in the EU in 2016 [3].
In Europe the NOx emissions from vehicles are regulated through Euro standards: the Euro 5 limit for diesel light-duty vehicles, which was introduced in 2009, was 180 mg/km and the Euro 6, which was introduced in 2014, is 80 mg/km. The standards have to be fulfilled in the laboratory following a prescribed procedure [4]. However, it was found that the real driving emissions are much higher than the limits [5]. On average, Euro 5 vehicles were 4.1 times higher than the Euro 5 limit and Euro 6 vehicles were 4.5 times the Euro 6 limit [6]. Recently a Real-Driving Emissions (RDE) procedure was introduced in the regulation for both type approval of vehicles and their In-Service Conformity (ISC) [7]. However, a study estimated that there are still around 29 million high emitting (defined as >3 times higher than the type approval limit) Euro 5 and Euro 6 diesel passenger cars and vans on the European roads, which corresponds to about 76% of all diesel vehicles registered over the 5 years assessed (2011–2015) [8]. A study estimated that diesel Euro 6 vehicles may contribute 49–83% of NOx emissions from road transport in 2050 [9]. If diesel vehicles respected their type approval limit also on the road, the impact of excess NOx emissions could be at least halved [10]. Another study estimated that if the on-road emissions will respect the type approval with a conformity factor of 1.5, the fraction of traffic-influenced German stations exceeding the air quality limit for annual mean NO2 could be reduced to 8% in 2025 and 1% in 2030 from about 50% in 2015 [11].
The European Commission launched two prizes funded by the EU’s research program Horizon 2020 to identify breakthrough ideas that could drastically reduce air pollution caused by transport. The Horizon prize for the “Engine Retrofit for Clean Air” (2016–2018) [12] (award 1.5 million Euros) aimed at reducing the pollution produced by the existing passenger cars fleet by spurring the development of retrofit-able technology (i.e., additional devices and/or modification) applicable to diesel engines. The focus was on NOx emissions of Euro 5 light-duty vehicles under real driving conditions, but other pollutants, such as particles, N2O and ammonia (NH3) were also considered. Additionally, vehicle fuel efficiency, retrofitting costs, durability, maintenance, usability, safety, drivability, and noise were taken into account in the prize criteria. The retrofit technology had to be installable on a mass production Euro 5b C-class compact car in the top C-class sales, but limited to high-volume hatchback and three volumes family car bodies. The vehicle should retain most of its payload carrying capability, but the retrofit was allowed to reduce boot volume by 20 litres. The most demanding objectives were absolute NOx emissions below 180 mg/km, less than 10% fuel consumption increase, and maximum retrofit and consumables costs for 100,000 km of <2000 Euros.
On 16 April 2018 the European Commission awarded the Horizon Prize on “Engine Retrofit for Clean Air” at a ceremony during the Transport Research Arena (TRA) in Vienna, Austria. The 1.5 million Euro prize was awarded to the winning consortia consisting of lead company Amminex Emissions Technology, supported by the Technical University of Graz, Johnson Matthey, and International Council on Clean Transportation (ICCT) Europe. The retrofit consisted of an under-floor SCR (Selective Catalytic Reduction) for NOx catalyst in combination with a solid ammonia based dosing system as the NOx reductant. The technology demonstrated that effectively retrofitting diesel vehicles is feasible. The NOx emissions of a Euro 5b retrofitted vehicle were reduced by 350–1100 mg/km (60–85%) depending on the test cycle and engine conditions (cold or hot start), resulting in NOx emissions of the retrofitted Euro 5b vehicle around 150 mg/km [13]. Thus, the final NOx emissions of the retrofitted vehicle were lower than many Euro 6 vehicles on the market.
During the evaluation of the retrofit with the Euro 5b vehicle, a retrofitted Euro 6b vehicle was also provided. The objective of this paper is to present the NOx reductions of the retrofit technology on a relatively lower emitting vehicle equipped with a Lean NOx Trap (LNT) and to compare the reduction efficiency to the Euro 5b results.

2. Experiments

2.1. Vehicle

The vehicle was a Euro 6b certified Renault Megane 1.5 dCi 110, year 2015 Sport Tourer (station wagon) 1461 cm3, 81 kW, 40,000 km, 1331 kg (empty without the retrofit), with winter tires. The original exhaust configuration consisted of Exhaust Gas Recirculation (EGR), Diesel Oxidation Catalyst (DOC), Lean NOx Trap (LNT), and Diesel Particulate Filter (DPF).

2.2. Retrofit

The retrofit, BlueFitTM comprises an Ammonia Storage and Delivery System (ASDSTM), mounted in the spare wheel well, and a commercially available underfloor Cu-Zeolite SCR catalyst with Pt-containing ammonia slip coating, installed downstream of the DPF.
The ASDSTM prototype for passenger cars consisted of two 1.2 litres AdAmmineTM cartridges, where ammonia is absorbed in strontium chloride salt in a solid form [14] (the commercial unit will be 4.5 litres), a start-up unit, which also contains AdAmmineTM, but in a much smaller volume (0.5 litre) to enable fast dosing (for cold start), the dosing unit, which provides dynamic dosing of ammonia, and finally a controller with software. The dosing strategy is based on NOx measurements upstream and downstream of the SCR (with NOx sensors), the exhaust mass flow (via the On-Board Diagnostics (OBD) port), and the measured exhaust temperature upstream of the SCR.
In order to release ammonia, cartridges are equipped with electric heaters. During the engine cold start, most of the electrical power goes to the start-up unit to warm it up fast and enable ammonia dosing shortly after the engine start. The remaining power is then directed to one of the main cartridges. The system is ready to dose when the start-up unit has reached the target desorption pressure.
At engine start the exhaust gas temperature and therefore the SCR temperature in under-floor position is low and the light-off of the SCR catalyst becomes a limiting factor even though the start-up unit is already ready to dose. As the exhaust gas temperature increases, and the NOx sensor upstream of the SCR catalyst reaches the light-off temperature of the catalyst (140 °C), ammonia dosing commences and the NOx emissions decrease [15]. For DPF equipped vehicles as the exhaust gas temperature increases, the NO to NO2 conversion increases at the DOC in order to assist the passive DPF regeneration with NO2 at lower temperatures. At these exhaust gas temperatures the reduction efficiency of the SCR is optimal including the effect of the fast SCR reaction involving NO and NO2 resulting in very low NO2 emissions. The dosing strategy of the specific retrofit does not take into account the stored NH3 with storage model; it uses the NOx concentration measured by the NOx sensors upstream and downstream of the SCR to adjust the dosing. Overdosing (over-release) of NH3 that cannot be stored can result in excess NH3 emissions. At high speeds the catalyst reaches temperatures that can maximize the production of N2O from NO2 or NH3.
The net system’s weight (without AdAmmineTM cartridges) was 10 kg. Each cartridge (main unit) weighted 3.1 kg, whereas the start-up unit 1 kg. The retrofit had a default calibration (i.e., it was not optimized for the specific vehicle and the Prize rules, as the one retrofitted in the Euro 5b vehicle). The implications will be discussed when the NOx reductions on the two vehicles will be compared.

2.3. Chassis Dynamometer Tests

The vehicle was tested at the Vehicle Emission Laboratory (VELA 2) of the European Commission Joint Research Centre (JRC), in Ispra, Italy. The test cycles were the New European Driving Cycle (NEDC), the Worldwide Harmonized Light vehicles Test Cycle (WLTC) and the Common Artemis Driving Cycle (CADC) with engine cold or hot start. The climatic test cell temperature was kept at 23–25 °C or 7 °C with relative humidity of 50%. The chassis dynamometer parameters were selected according to the rules of the prize based on the UNECE (United Nations Economic Commission for Europe) Regulation 83 [16] roller dynamometer coefficients using the empty weight of the donor (unmodified) vehicle plus 100 kg (driver and fuel), plus the retrofit weight (for the post retrofit tests): 1470 kg, a = 7.4 N, b = 0.0502 N/(km/h)2. The temperature range 23–25 °C was selected because it is defined in the regulation, while the 7 °C was selected in order to challenge the retrofit, as at low ambient temperatures the engine out emissions are higher and it takes longer for the retrofit to reach its optimum temperature.
It was decided to cover as many test cycles and engine conditions as possible, rather than focusing on few cases and determining with higher accuracy the performance of the retrofit. For this reason one or two repetitions were conducted. The NEDC is smoother but challenging for the aftertreatment systems to heat up, the WLTC and the CADC are considered realistic driving. In order to avoid any influence of the precedent (or pre-conditioning) cycle on the results (especially for the Euro 6 which has a LNT), only repetitions that were following identical procedures were compared. Based on this and the previous campaign with the Euro 5b vehicle, the repeatability is around 3% for CO2 and 10% for NOx.
Measurements of CO2, CO (both with Non-Dispersive Infrared Detectors, NDIR), NOx (Chemi-Luminiscence Detector, CLD) and total HC (Flame Ionization Detector, FID) were taken from the tailpipe, and from the diluted gas in the full dilution tunnel in real time. Measurements from bags that were filled during the test, as described in the regulation, were also taken for every test. The sample collected in the bags was analysed after each test. Although the accuracy is better than the real time measurements (one single measurement), there is no possibility to analyse the second by second behaviour of the pollutants. The gas analysers were the MEXA 7000 series from Horiba (Kyoto, Japan). The solid particle number system connected at the full dilution tunnel was an AVL (Graz, Austria) Particle Counter APC 489 [17]. Non-regulated pollutants, including ammonia (NH3) and nitrous oxide (N2O) were measured with a Fourier-Transform Infrared Spectroscopy (FTIR) instrument (Sesam i60 from AVL) connected to the vehicle tailpipe, using a heated polytetrafluoroethylene sampling line (191 °C). The fuel consumption was calculated from the CO2, CO and HC measurements as described in the regulation (carbon balance method) [1]. The contribution of CO and HC is negligible due to their low concentration and consequently the fuel consumption can be assumed proportional to the CO2 emissions.
More details of the experimental campaign and the test cycles and the quality assurance can be found elsewhere [13].

2.4. On-Road Tests

The Portable Emissions Measurement System (PEMS) that was used to measure CO2, CO and NOx (with two separate chemical cells for NO and NO2) during the on-road tests was the Ecostar from Sensors (MI, USA). The first route, which complied with the trip requirements defined in the RDE [1] (Table 1), was carried out in the morning starting with cold engine. The second route, which was carried out after a 2 hours break, was not RDE compliant, but focused on urban conditions and high altitude (1100 m) (positive altitude gain 1800 m per 100 km) (Table 1). The vehicle’s battery was left to recharge before each test.
The car was parked indoors at a temperature of 16 °C due to convenience reasons (access to calibration cylinders, power supply). The ambient temperature during the tests was 0–10 °C and the relative humidity 65–95%. The tests were intentionally conducted in winter time in order to challenge the retrofit with low ambient temperatures under real driving. The weight of the car with the instruments, the driver and the co-driver was 1650 kg.

3. Results

The following paragraph will summarize the results for CO2, NOx, NH3 and N2O, where the retrofit would be expected to have an influence. The detailed results can be found in Appendix A. The results for particle number are presented in the Table A5. The results for CO and HC are not presented because the emissions were very low and the retrofit had no influence or slightly improved them.

3.1. Chassis Dynamometer Tests

Figure 1 presents the results of CO2 emissions with the retrofit activated or not activated for various test cycles (NEDC, WLTC or CADC), with engine cold or hot start, and at two ambient temperatures (7 °C or 23–25 °C). The results for the whole cycle (right panel) or only the urban part (left panel) are separately plotted. Higher emissions during the urban part with cold start and the retrofit activated can be attributed to its heating. There is no clear trend of the effect of retrofit on the CO2 emissions for the complete cycles. For the NEDC the emission levels were similar with or without retrofit, while for the WLTC the CO2 emissions are slightly higher with the retrofit activated. The differences can be attributed to experimental uncertainties (repeatability ±4 g/km as shown with error bars) and no conclusion can be drawn due to the limited number of repetitions. With the activation of the retrofit, the mean increase of CO2 for all urban cycles was 0.6 g/km and negligible for the full cycles.
Figure 2 presents the NOx emissions for the various cycles. The NOx emissions without the retrofit activated were high exceeding the 80 mg/km certification limit even for the type approval test (cold NEDC at 23 °C) and reaching 1000 mg/km in the hot WLTC or CADC.
For the urban part of the cycles the decrease of the NOx emissions with the activation of the retrofit is from negligible for the cold start tests (e.g., NEDC, WLTC) up to 120 mg/km for the hot start WLTC. For the complete cycles the reduction of NOx ranged from 50 mg/km (25%) (cold NEDC) to 725 mg/km (82%) (hot WLTC). The mean NOx emissions for all cycles were 571 mg/km and they were reduced to 198 mg/km when the retrofit was activated.
With active retrofit the NO2 decreased >40% at the complete cycles. For the urban parts the reduction was negligible (cold start) or small (hot start). The mean (ppm) ratio NO2/NOx for all cycles was 27% (12–39%) with the retrofit deactivated and only slightly dropped to 21% (7–31%) when the retrofit was activated.
Figure 3 shows the emissions of N2O. For the urban part, N2O emissions were visible without retrofit, and remained at the same levels with the retrofit. For the total cycle significant increase of N2O was seen for the hot start cycles with active retrofit (average of all 7 cycles +7 mg/km). The maximum increase was 18 mg/km at the hot WLTC.
The NH3 emissions were at the background levels and no figure is shown.

3.2. On-Road Tests

Figure 4 summarizes the CO2 on-road results over the two performed routes. The emissions ranged from <50 g/km (driving downhill) to around 300 g/km (driving uphill). The activation of the retrofit has slight influence on the CO2 emissions (+7 g/km) only in the urban part with cold engine start, probably due to heating of the cartridges for ammonia release or the lower ambient temperature of the specific test. The on-road test (both routes) with the retrofit activated was the only test with ambient temperature around 0 °C (instead of 6 °C, rest of the tests). In any case, the differences of CO2 were very close to the experimental repeatability (±4 g/km).
Figure 5 shows the results for NOx and NO2. The NOx emissions without the retrofit ranged from 230 mg/km to >3250 mg/km. The NO2/NOx ratio was 18–43%. With the retrofit activated the NOx emissions decreased to 100–430 mg/km and the NO2/NOx ratio to 7–39%. The absolute reduction of NOx was 465–2840 mg/km (or >60%). The only exception was the “Downhill” driving where the reduction was only 56 mg/km (or 24%); however, the absolute levels were already relatively low (approximately 200 mg/km). The NOx emissions with the retrofit for the complete routes were 220–240 mg/km (from >1100 mg/km) (around 80% reduction).

4. Discussion

4.1. NOx Emission of the Donor Vehicle

The emissions of the donor vehicle (retrofit installed but not activated) for the type approval tests (NEDC at 23 °C) were higher than the respective limits (180 mg/km instead of <80 mg/km for Euro 6). However, another study found that the specific Euro 6 model was compliant with the type approval cycle [18]. Our preliminary testing showed that the Euro 6 emissions were pre-conditioning dependent. Following the pre-conditioning required by the legislation (3 cycles of the EUDC) the NOx emissions were around 180 mg/km, while without pre-conditioning around 500 mg/km, indicating the importance of the LNT status. In our tests we used default road loads of UNECE Regulation 83 [15], as required by the prize rules, and not the ones used during the type approval by type approval authority; this could have resulted in the higher NOx emissions. In any case, the target of the investigation was to see relative changes with the retrofit aiming at a solution to solve the known challenge with high on-road NOx emissions. All results reported in this paper were based on repetitions for which an identical sequence of test was followed.
For other test cycles (WLTC and CADC) at 23 °C the NOx emissions of the donor vehicles increased 3 times (>600 mg/km). Additionally, the emissions of the tests performed at 7 °C were higher to those at 23 °C (another +250 to +450 mg/km). The very high NOx levels, around 1000 mg/km, are in agreement with the findings of a study for the same vehicle model for other than the type approval cycles [18], and other studies that tested other models from the same vehicle manufacturer [19,20]. The results indicate that the specific model was calibrated only in a narrow range of the engine map (NEDC is the type approval cycle), the LNT was not optimized for different driving conditions and/or not regenerating often, and possibly the engine out emissions were also higher outside of a narrow temperature window (e.g., lower exhaust gas recirculation EGR).
This Euro 6 vehicle is one of the highest NOx emitting vehicles in the market, as one review study found around 5% of Euro 6 vehicles emitting more than 1000 mg/km [6]. Reviews focusing on Euro 6 LNT-equipped vehicles found 1 out of 16 vehicles [19], 5 out 48 [20], 0 out of 6 [21], 0 out of 19 [22] emitting >1000 mg/km in real driving conditions (0–10%). Recent studies, not included in the previous reviews, found 1 out of 2 Euro 6 LNT-equipped vehicles exceeding 1000 mg/km [23], or 1 out of 6 [24]. Thus, the retrofit results of the Euro 6 vehicle should be interpreted with care and are not necessarily representative of the retrofit efficiency on other Euro 6 LNT-equipped vehicles.
The ratio NO2/NOx ratio was around 27%, within the range reported for other Euro 6 diesel vehicles 46 ± 23% [22] or specifically those with EGR and LNT 38 ± 21% [25].

4.2. NOx Reduction of the Retrofit

The NOx levels of the retrofitted Euro 6 were from 100 mg/km (hot NEDC) to 410 mg/km (CADC). The combustion and EGR strategy of the vehicle, and the different ambient temperatures resulted in high and variable emissions upstream of the retrofit, which challenged the retrofit devices in terms of achieving low absolute levels of NOx. The reductions were small for urban phases (<47% with higher percentages for the hot start cycles). They were high though for the complete cycles (up to 83%). The reductions were even higher for NO2 (>40% for the complete cycles). The reason is that the NO2 is formed at the DOC at high exhaust gas temperatures, where the retrofit works efficiently, combined with the effect of the fast SCR reaction at low temperature. The lower NOx reduction efficiency at the urban phase and cold start is in line with the dependency of the SCR efficiency with the temperature (e.g., [26,27,28]). The technical approach of the retrofit having SCR function added downstream of the DPF and avoiding any changes to the original engine and aftertreatment configuration puts some natural constraints to the cold-start performance. Even with ammonia dosing from 140 °C, the warm-up of the SCR takes a few minutes.
Figure 6 presents the cumulative NOx emissions with the retrofit activated and deactivated for the RDE test and the WLTC. The Euro 6 vehicle needed 600–850 s or 3.5–6.5 km of urban driving to see a significant deviation between the two activated and non-activated NOx curves. For a specific SCR, the exact timing or distance depends, among others, on the temperature of the aftertreatment device, which is determined by the ambient temperature and the driving pattern at the urban part. For the first seconds, in which the SCR is not working, engine re-calibration (e.g., with software upgrade during the installation of the retrofit) could further reduce the NOx emissions (1–5 g of NOx in the specific vehicles for the cold start period). The reduction of cold start NOx emissions with engine recalibration was recently demonstrated [29]. Consequently, the cold-start potential for a retrofit could be improved even further if it could be combined with a minor update of the engine control software by the manufacturer targeting the first few minutes of a trip.
In order to estimate what would be the mean NOx reduction in cities, one would have to calculate mean trip distances between cold starts. According to a summary report [30], the median distance between two consecutive cold starts is 30 ± 13 km or 27 ± 8 km if only urban trips are considered. Thus, the expected NOx reduction impact of the retrofit solution in cities is similar to the reduction measured at the urban part (which is around 33 km) of the RDE (59%, see Figure 5, Urban, first bars). The absolute reduction and environmental effect in terms of mass of NOx would be substantial.

4.3. NH3, N2O and Particle Emissions

The Euro 6 vehicle had NH3 emissions at the detection limit of the FTIR instrument (0.5 ppm). This means that there was no overdosing of NH3 and/or the NH3 slip coating was adequate. The N2O emissions were <35 mg/km with both activated and non-activated retrofit (Figure 3). The N2O emissions were higher with the retrofit activated in the motorway part of all cycles. At high speeds the catalyst reaches temperatures that maximize the production of N2O from NO2 or NH3, and NH3 dosing may also be higher [15,26]. The values, even without activated retrofit, are higher than the future limit of 20 mg/km in China (China 6b) from 2020 [31] and the 10 mg/mi in USA [32]. The values are in agreement with typical N2O levels of Euro 6 diesel vehicles reported in the literature: <25 mg/km [33,34], with some tests reaching 45 mg/km [33]. It should be noted though that 35 mg/km of N2O is almost equivalent to 9 g/km of CO2 considering the 265 times higher global warming potential of N2O compared to CO2 over 100 years [35]; thus, it corresponds to 7.5% of the CO2 contributions for the specific NEDC cycle. The maximum N2O increase with the retrofit activated was 18 mg/km at the hot WLTC, which is 4.5 g/km CO2 equivalent (3.5% additional contribution relative to the CO2). The average N2O increase was ten times lower (1.7 mg/km).
The particle number emissions were always lower than the Euro 5b/6 particle number limit (6 × 10¹¹ p/km) due to the DPF. Activation of the retrofit did not result in an increase of the emissions, which were more DPF fill state dependent. Recently concerns were raised for formation of particles from urea (or NH3) with sizes even lower than the current regulatory limit of 23 nm [36]. No such formation was noticed in our experiments (more details in Appendix B).

4.4. Comparison with the Euro 5b Retrofit

The retrofit installed on a Euro 5b vehicle in a previous study [13] achieved higher NOx reductions in both absolute and relative terms than the Euro 6b retrofitted vehicle of this study. The mean Euro 5b emissions of all cycles tested with the activated retrofit were around 150 mg/km (vehicle was emitting 780 mg/km), while for the Euro 6b they were around 200 mg/km (vehicle was emitting 570 mg/km). The results are summarized in Figure 7.
The lower NOx reduction of the Euro 6b compared to the Euro 5b is counter-intuitive as combinations of LNT with SCR have shown better NOx reduction efficiencies than SCR alone [15]. In order to gain a better insight of these results Figure 8 presents NOx, NO2, N2O and NH3 of a WLTC at 23 °C with cold start for the two vehicles (Euro 5b and Euro 6b) with the retrofit activated or not. The speed profile and the exhaust gas temperature at the tailpipe are given at the lowest panel. The NOx emissions with the retrofit activated are lower for the Euro 6b vehicle; this could be due to better engine calibration or EGR use (Figure 8, upper panel). With the retrofit activated the NOx reduction starts later for the Euro 6b vehicle and the absolute NOx emissions are also higher than the Euro 5b vehicle, which means that the performance of the retrofit was better with the Euro 5b vehicle for exactly the same test. The NO2 emissions increase after the middle of the cycle as the temperature at the DOC increases (middle panel), probably to support the DPF regeneration at lower temperatures. The NO2 and N2O emissions are higher at the Euro 6b vehicle, probably due to the LNT [37] that could also explain the N2O spikes of the Euro 6b vehicle. The NO2 concentration is reduced efficiently (middle panel) because the SCR has the appropriate temperature and the presence of NO2 enhances the SCR activity at lower temperatures [38]. However, some N2O is produced at high speed accelerations due to the higher production of N2O from NO2 or NH3 at high temperatures [15,26] and/or due to NH3 overdosing [39]. This is more evident at the end of the cycle for the Euro 5b vehicle where a significant increase of N2O and NH3 are seen.
One reason of the differences between Euro 5b and Euro 6b reductions is the different calibration strategies of the two retrofits: The Euro 5b retrofit had more aggressive strategy to comply with the prize rules. This was evident at CADC of the Euro 5b, where the NOx emissions were much lower, especially at the last high speed part of the cycle (see [13]), but it was also seen in a smaller degree at the WLTC (Figure 8). This strategy resulted also at higher NH3 (+2 mg/km vs +0 mg/km) and N2O (+16 mg/km vs +9 mg/km) emissions of the Euro 5b vehicle. Based on the high emissions of the Euro 6b vehicle, it seems that the LNT was not functioning at optimum conditions, and thus not supporting the SCR, particularly during cold start, when it is expected to contribute the most. The exhaust gas temperature of the Euro 6b was lower and this could have affected significantly the Euro 6b’s retrofit reduction efficiency. Probably insulating the tailpipe (as it was done with the Euro 5b) would help the cold start performance. These results might also indicate that a “one size fit all” calibration has good results but specific calibrations might be needed for better results, including for instance trade-offs between NOx and N2O at high loads, or to deal with the dynamics of the NOx entering the SCR when there is an LNT “between” the engine and SCR.
Regarding safety and durability the conclusions are the same as with the Euro 5b case, because it was the same prototype unit (as principle). The retrofit was judged to be safe for light duty applications with an expected durability of at least 160,000 km [13]. Similarly to the Euro 5 case, the (acquisition) cost of the retrofit system plus running costs (consumables and fuel penalty) were estimated to be <2000 Euros for 100,000 km.

5. Conclusions

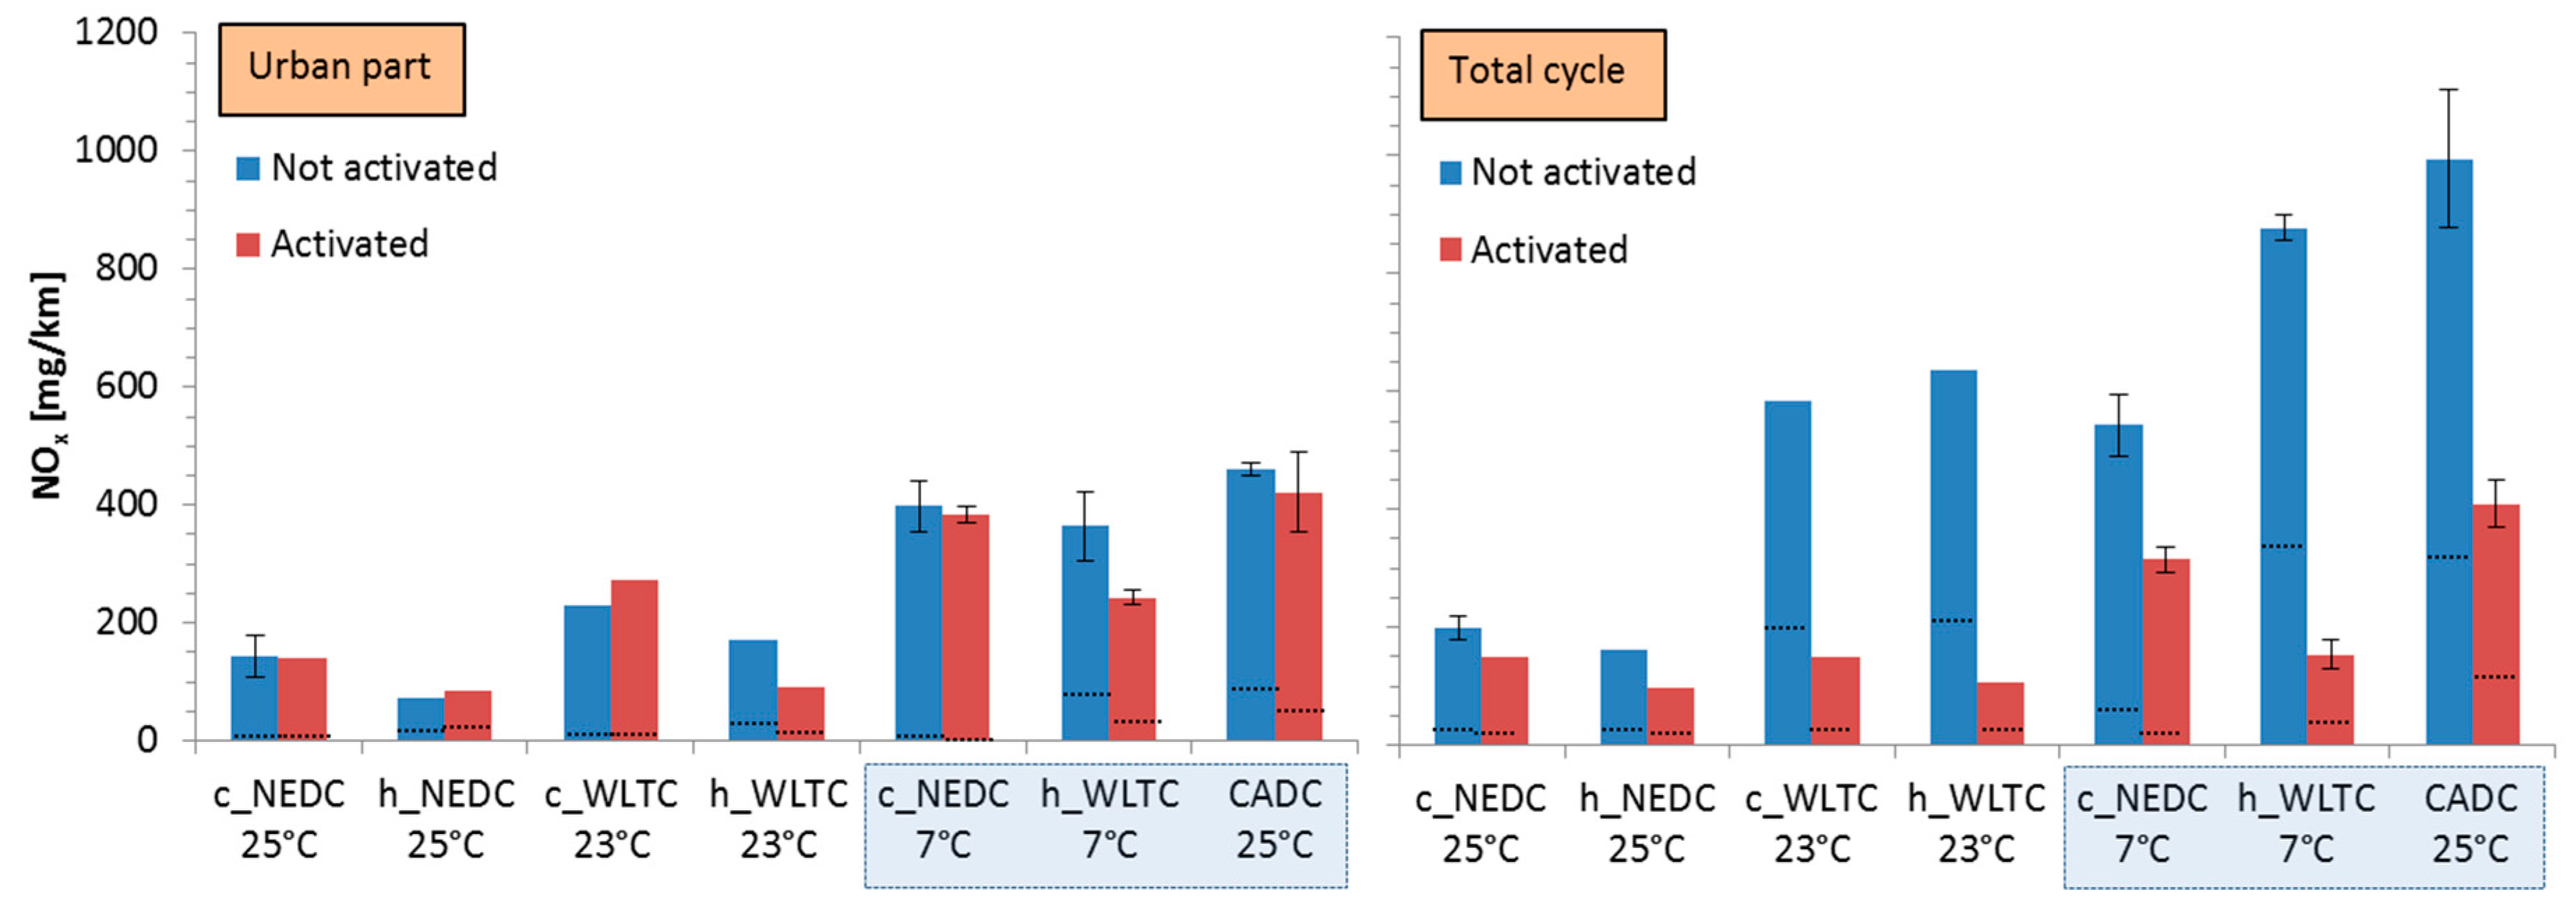
In this study we evaluated a retrofit technology installed on a Euro 6b diesel vehicle. The retrofit included a solid ammonia storage system that delivered gaseous ammonia to a SCR catalyst based on measurements of NOx upstream and downstream of the catalyst, exhaust gas temperature and exhaust mass flow. The tests included on-road tests and various cycles on a chassis dynamometer with cold and hot engine start and ambient temperatures of 7 °C or 23 °C.
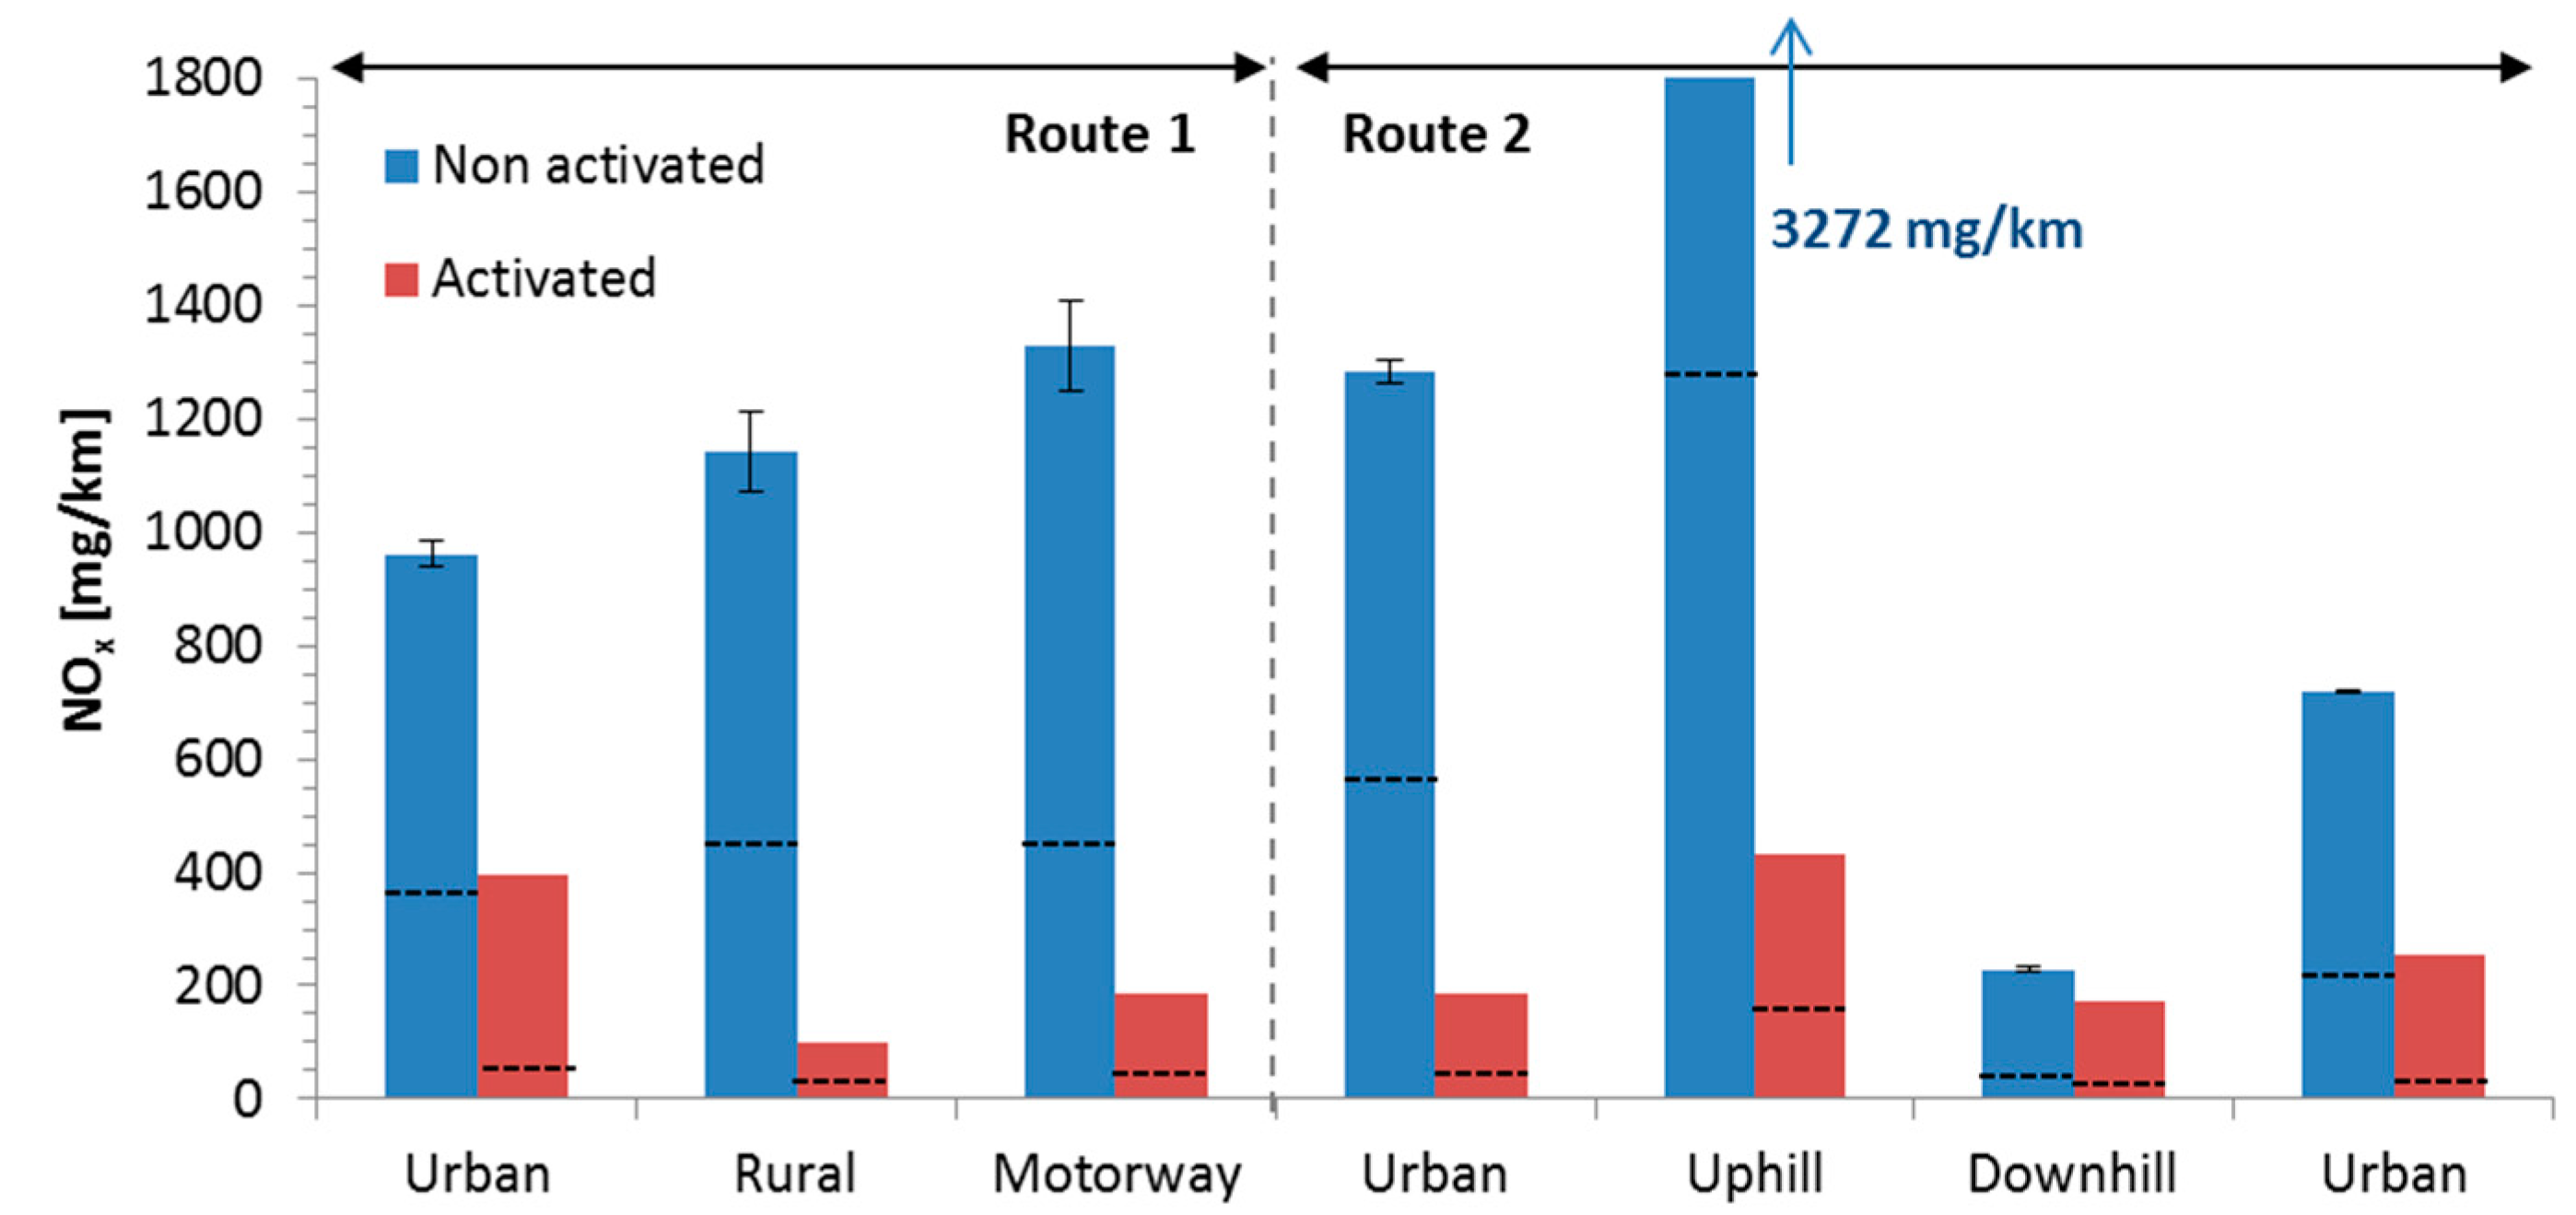
The retrofit reduced the NOx emissions of all cycles tested from, on average, from 570 mg/km to 200 mg/km. The on-road performance was even better: the reduction was from >1100 mg/km to 220–240 mg/km. The reductions at low ambient temperatures with cold start were negligible. For an on-road test it took approximately 10 min to reach appropriate exhaust gas temperature. There was no detection of ammonia slip or formation of particles. The N2O increased on average 7 mg/km, mainly at the hot cycles. The increase of the CO2 was negligible.
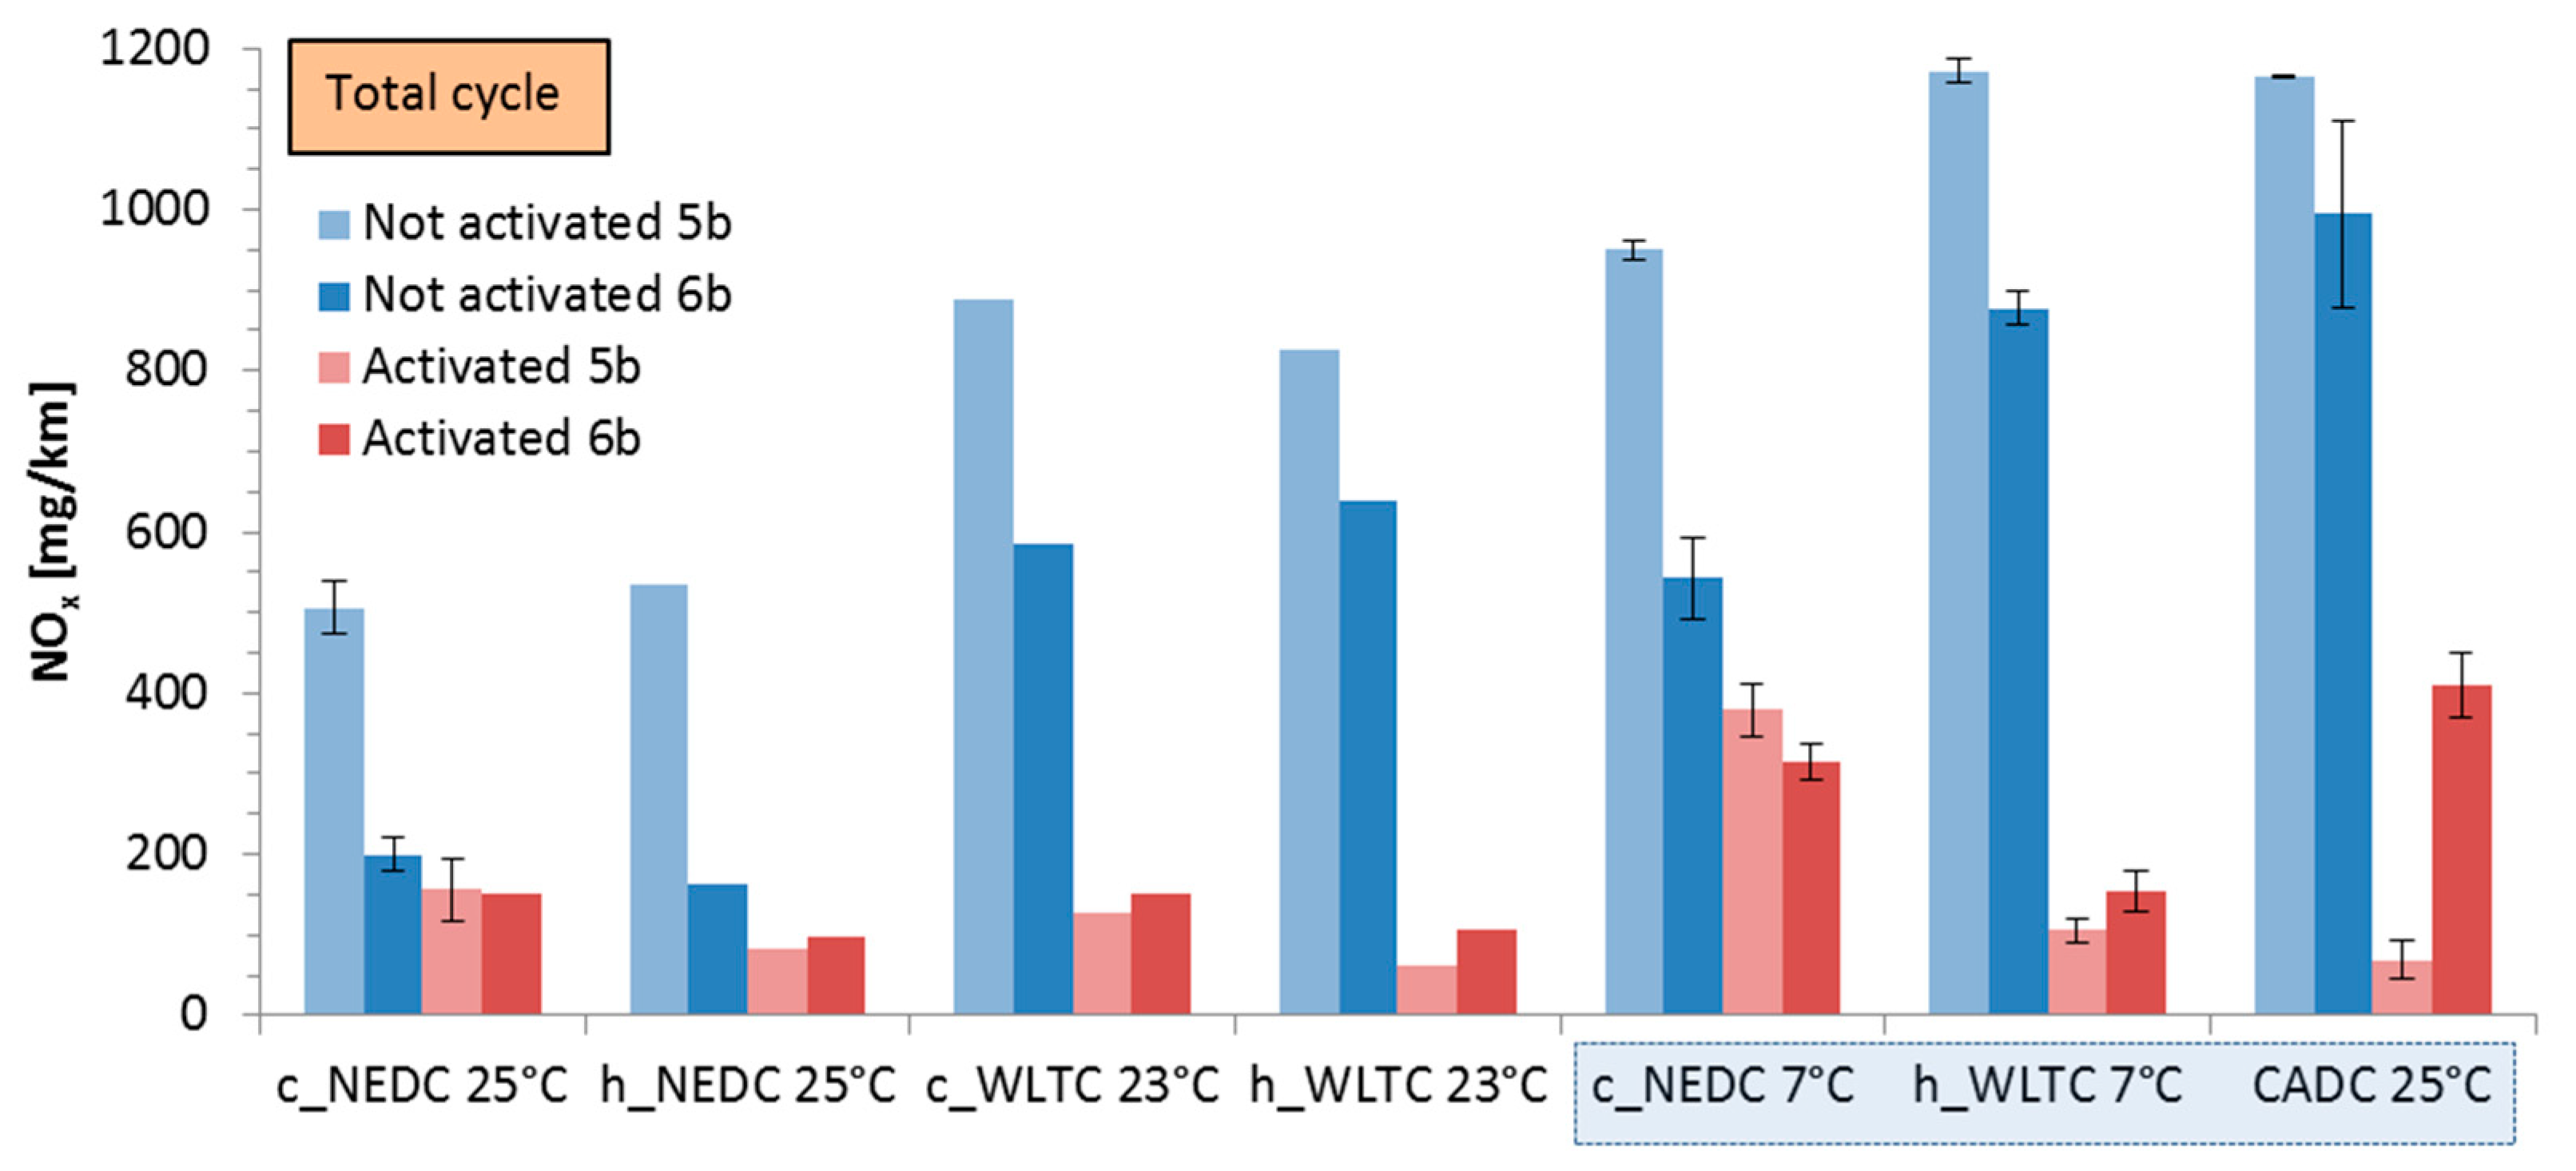
A similar prototype retrofit system installed on a Euro 5b vehicle achieved better NOx reduction, but higher N2O emissions. The differences were attributed to the more aggressive NH3 release strategy, and the higher exhaust gas temperature at the retrofit due to the insulation of the Euro 5b vehicle tailpipe. Dealing with the dynamics of the NOx entering the SCR when there is an already-existing LNT is also more challenging.
The results of this study confirm that retrofitting is an option to decrease NOx emissions of Euro 6 diesel vehicles to approximately 200 mg/km without vehicle specific calibration, and without significant increase of the fuel consumption and other pollutants such as particles, NH3 and N2O. Further improvements could be achieved by improving the cold start performance (e.g., active heating of the catalyst or engine out emissions re-calibration). It is necessary to confirm the performance, durability and cost of the commercial retrofit with more vehicles and technologies.

Author Contributions

Conceptualization, M.M.; methodology, B.G.; formal analysis, B.G.; writing—original draft preparation, B.G.; writing—review and editing, R.S.-B., T.L., M.C. (Michael Clairotte), M.C. (Massimo Carriero), P.B.; supervision, M.M.

Funding

This research received no external funding.

Acknowledgments

The authors would like to acknowledge the Prize Jury for the precious suggestions. The technical support of Mirco Sculati, Philippe Le Lijour, and Mauro Cadario is highly appreciated.

Conflicts of Interest

The authors declare no conflict of interest.

Disclaimer

The opinions expressed in this manuscript are those of the authors and should in no way be considered to represent an official opinion of the European Commission. Mention of trade names or commercial products does not constitute endorsement or recommendation by the authors or the European Commission.

Appendix A

The following tables summarise the results for CO2, NO2, NOx for the New European Driving Cycle (NEDC), the Worldwide Harmonized Light vehicles Test Cycle (WLTC) and the Common Artemis Driving Cycle (CADC) at different ambient temperatures (7 °C, 23 °C, 25 °C) and engine cold (=at ambient temperature) or hot (oil temperature >70 °C).
Table A1. Results for CO2. c = cold start; h = hot start; off = retrofit not activated; on = retrofit activated.
c_NEDC 25 °Ch_NEDC 25 °Cc_WLTC 23 °Ch_WLTC 23 °Cc_NEDC 7 °Ch_WLTC 7 °CCADC 25 °C
Urban_off127.3114.4129.8109.3141.0124.2168.4
Urban_on121.3108.2151.8119.6144.1124.7174.2
Difference−6.0−6.222.010.33.10.55.8
Rel. diff.−4.7%−5.4%16.9%9.4%2.2%0.4%3.4%
Total_off116.6111.1124.3128.4125.5132.5156.6
Total_on112.2108.5128.7123.2128.3126.8145.2
Difference−4.4−2.64.4−5.22.8−5.7−11.4
Rel. diff.−3.8%−2.3%3.5%−4.0%2.2%−4.3%−7.3%
Table A2. Results for NOx. c = cold start; h = hot start; off = retrofit not activated; on = retrofit activated.
c_NEDC 25 °Ch_NEDC 25 °Cc_WLTC 23 °Ch_WLTC 23 °Cc_NEDC 7 °Ch_WLTC 7 °CCADC 25 °C
Urban_off14473229171398365460
Urban_on1418627390384243421
Difference−31345−81−15−122-39
Rel. diff.2%−18%−20%47%4%33%9%
Total_off200163584638543878995
Total_on15199151108315154410
Difference4964433529228724585
Rel. diff.25%39%74%83%42%82%59%
Table A3. NO2/NOx ratios. c = cold start; h = hot start; off = retrofit not activated; on = retrofit activated.
c_NEDC 25 °Ch_NEDC 25 °Cc_WLTC 23 °Ch_WLTC 23 °Cc_NEDC 7 °Ch_WLTC 7 °CCADC 25 °C
Urban_off1%24%2%19%0%19%21%
Urban_on1%23%3%22%1%15%14%
Total_off17%19%36%35%12%39%32%
Total_on12%19%22%28%7%31%28%
Table A4. Results for N2O. c = cold start; h = hot start; off = retrofit not activated; on = retrofit activated.
c_NEDC 25 °Ch_NEDC 25 °Cc_WLTC 23 °Ch_WLTC 23 °Cc_NEDC 7 °Ch_WLTC 7 °CCADC 25 °C
Urban_off17141914221720
Urban_on17151612281517
Difference01−3−26−2−3
Total_off181211935115
Total_on18191918332911
Difference0789-2186

Appendix B

Solid particle number (SPN) emissions of particles larger than 23 nm were measured from the dilution tunnel according to the regulated method [1] with an AVL particle counter [17]. In addition a 10 nm 3772 CPC (Condensation Particle Counter) from TSI (MN, Shoreview, MS, USA) was connected to measure particles larger than 10 nm. The results include particle losses >23 nm as described in the regulation, but not for particles between 10 and 23 nm. The interested reader can find info about 10–23 nm particle corrections elsewhere [40].
Figure A1 plots the SPN emissions of particles >10 nm and Table A5 summarizes the results of the 23 nm regulated system. The emissions of the tests with cold start are high (1011 #/km), while the tests with hot engine start are low (109 #/km). This is in agreement with most vehicles equipped with DPF [41]. There is no significant difference between the test with the retrofit activated or not, and the small differences can be attributed to the DPF fill state between the two cases. The DPF fill state influence on SPN emissions has been discussed elsewhere [42]. The sub-23 nm fraction (Table A5) is variable but with no effect from the retrofit system. In any case, no effect was expected at cold start urban cycles, because the retrofit system is not activated during the first minutes. No increase of particles was also noticed at the high speed parts of the cycles.
Figure A1. SPN emissions >10 nm with the retrofit activated (red bars) or not activated (blue bars) for various test cycles. Left panel: Urban part emissions. Right panel: Emissions during the full cycle. Error bars show the difference between minimum or maximum value and mean value of 2 repetitions when available. “c” denotes test with engine cold start (at ambient temperature) and vehicle battery charged. “h” denotes test with engine hot start (oil temperature >70 °C). Cycles considered in prize criteria are shown in a light blue box.
Atmosphere 10 00180 g0a1
Table A5. Results for SPN emissions >23 nm [×1010 p/km] and excess particles below 23 nm [(SPN 10/SPN 23)–1]. c = cold start; h = hot start; off = retrofit not activated; on = retrofit activated.
c_NEDC 25 °Ch_NEDC 25 °Cc_WLTC 23 °Ch_WLTC 23 °Cc_NEDC 7 °Ch_WLTC 7 °CCADC 25 °C
Urban_off45.70.2725.20.2963.83.654.59
Sub-23+16%+25%+12%+21%+105%+3%+43%
Urban_on92.70.3348.50.3978.31.912.22
Sub-23+25%+13%+6%+17%+74%0%+37%
Total_off16.90.123.410.0823.60.641.27
Sub-23+16%+30%+12%+29%+105%+4%+33%
Total_on35.70.156.500.1029.10.410.46
Difference+24%+16%+6%+24%+73%0%+55%

References

  1. European Commission. Directive 2008/50/EC of the European Parliament and of the Council of 21 May 2008 on ambient air quality and cleaner air for Europe. Off. J. Eur. Un. 2008, L152, 1–44. [Google Scholar]
  2. European Commission. Directive 2016/2284/EC of the European Parliament and of the Council of 14 December 2016 on the reduction of national emissions of certain atmospheric pollutants, amending Directive 2003/35/EC and repealing Directive 2001/81/EC. Off. J. Eur. Un. 2016, L344, 1–31. [Google Scholar]
  3. European Environment Agency. Air quality in Europe 2018; Report No 12/2018; Publications Office of the European Union: Luxembourg, 2018.
  4. Commission Regulation (EU). Commission Regulation (EU) 2017/1151 of 1 June 2017 supplementing Regulation (EC) No 715/2007 of the European Parliament and of the Council on type approval of motor vehicles with respect to emissions from light passenger and commercial vehicles (Euro 5 and Euro 6) and on access to vehicle repair and maintenance information, amending Directive 2007/46/EC of the European Parliament and of the Council, Commission Regulation (EC) No 692/2008 and Commission Regulation (EU) No 1230/2012 and repealing Commission Regulation (EC) No 692/2008. Off. J. Eur. Union 2017, L175/1, 639. [Google Scholar]
  5. Weiss, M.; Bonnel, P.; Hummel, R.; Provenza, A.; Manfredi, U. On-road emissions of light-duty vehicles in Europe. Environ. Sci. Technol. 2011, 45, 8575–8581. [Google Scholar] [CrossRef]
  6. Baldino, C.; Tiegte, U.; Muncrief, R.; Bernard, Y.; Mock, P. Road Tested: Comparative Overview of Real-World Versus Type-Approval NOx and CO2 Emissions from Diesel Cars in Europe; White Paper; International Council on Clean Transportation Europe (ICCT): Berlin, Germany, September 2017. [Google Scholar]
  7. Commission Regulation (EU). Commission Regulation (EU) 2018/1832 of 5 November 2018 amending Directive 2007/46/EC of the European Parliament and of the Council, Commission Regulation (EC) No 692/2008 and Commission Regulation (EU) 2017/1151 for the purpose of improving the emission type approval tests and procedures for light passenger and commercial vehicles, including those for in-service conformity and real-driving emissions and introducing devices for monitoring the consumption of fuel and electric energy. Off. J. Eur. Union 2018, L301/1, 314. [Google Scholar]
  8. Transport and Environment. Dieselgate. Who? What? How? Transport and Environment: Brussels, Belgium, September 2016. [Google Scholar]
  9. Ntziachristos, L.; Papadimitriou, G.; Ligterink, N.; Hausberger, S. Implications of diesel emissions control failures to emission factors and road transport NOx evolution. Atmos. Environ. 2016, 141, 542–551. [Google Scholar] [CrossRef]
  10. Jonson, J.; Borken-Kleefeld, J.; Simpson, D.; Nyíri, A.; Posch, M.; Heyes, C. Impact of excess NOx emissions from diesel cars on air quality, public health and eutrophication in Europe. Environ. Res. Lett. 2017, 12, 094017. [Google Scholar] [CrossRef]
  11. Toenges-Schuller, N.; Schneider, C.; Niederau, A.; Vogt, R.; Hausberger, S. Modelling the effect on air quality of Euro 6 emission factor scenarios. J. Earth Sci. Geotech. Eng. 2016, 6, 227–244. [Google Scholar]
  12. European Commission. Research & Innovation. Horizon Prizes. Engine Retrofit for Clean Air. Available online: http://ec.europa.eu/research/horizonprize/index.cfm?prize=engine-retrofit (accessed on 11 March 2019).
  13. Giechaskiel, B.; Suarez-Bertoa, R.; Lahde, T.; Clairotte, M.; Carriero, M.; Bonnel, P.; Maggiore, M. Evaluation of NOx emissions of a retrofitted Euro 5 passenger car for the Horizon prize “Engine retrofit”. Environ. Res. 2018, 166, 298–309. [Google Scholar] [CrossRef]
  14. Bialy, A.; Jensen, P.; Blanchard, D.; Quaade, U.; Vegge, T. Solid solution barium–strontium chlorides with tunable ammonia desorption properties and superior storage capacity. J. Solid State Chem. 2015, 221, 32–36. [Google Scholar] [CrossRef]
  15. Guan, B.; Zhan, R.; Lin, H.; Huang, Z. Review of state of the art technologies of selective catalytic reduction of NOx from diesel engine exhaust. Appl. Therm. Eng. 2014, 66, 395–414. [Google Scholar] [CrossRef]
  16. United Nations. Economic Commissions for Europe, Regulation No. 83, Revision 5. Uniform Provisions Concerning the Approval of Vehicles with Regard to the Emission of Pollutants According to Engine Fuel Requirements; United Nations: Geneva, Switzerland, 2015. [Google Scholar]
  17. Giechaskiel, B.; Cresnoverh, M.; Jörgl, H.; Bergmann, A. Calibration and accuracy of a particle number measurement system. Meas. Sci. Technol. 2010, 21, 045102. [Google Scholar] [CrossRef]
  18. Heijne, V.; Kadijk, G.; Ligterink, N.; van der Mark, P.; Spreen, J.; Stelwagen, U. NOx Emissions of Fifteen Euro 6 Diesel Cars: Results of the Dutch LD Road Vehicle Emission Testing Programme 2016; TNO report 2016 R11177; TNO: Delft, The Netherlands, 2016. [Google Scholar]
  19. Yang, L.; Franco, V.; Campestrini, A.; German, J.; Mock, P. NOx Control Technologies for Euro 6 Diesel Passenger Cars; White Paper; International Council on Clean Transportation Europe (ICCT): Berlin, Germany, 2015. [Google Scholar]
  20. Deutsche Umwelthilfe. Emissionen im Verkehr. NOx and CO2 Messungen im Realen Fahrbetrieb. Available online: https://www.duh.de/fileadmin/user_upload/download/Projektinformation/Verkehr/dieselgate/EKI/2019-02-22_Tabelle_PEMS-Messungen_Ergebnisse_Maerz_2016-Feb_2019.pdf (accessed on 11 March 2019).
  21. Kadijk, G.; Ligterink, N.; van Mensch, P.; Smokers, R. NOx Emissions of Euro 5 and Euro 6 Diesel Passenger Cars—Test Results in the Lab and on the Road; TNO report 2016 R10083; TNO: Delft, The Netherlands, 2016. [Google Scholar]
  22. O’Driscoll, R.; Stettler, M.; Molden, N.; Oxley, T.; ApSimon, H. Real world CO2 and NOx emissions from 149 Euro 5 and 6 diesel, gasoline and hybrid passenger cars. Sci. Total Environ. 2018, 621, 282–290. [Google Scholar] [CrossRef] [PubMed]
  23. Triantafyllopoulos, G.; Dimaratos, A.; Ntziachristos, L.; Bernard, Y.; Dornoff, J.; Samaras, Z. A study on the CO2 and NOx emissions performance of Euro 6 diesel vehicles under various chassis dynamometer and on-road conditions including latest regulatory provisions. Sci. Total Environ. 2019, 666, 337–346. [Google Scholar] [CrossRef] [PubMed]
  24. Kwon, S.; Park, Y.; Park, J.; Kim, J.; Choi, K.-H.; Cha, J.-S. Characteristics of on-road NOx emissions from Euro 6 light-duty diesel vehicles using a portable emissions measurement system. Sci. Total Environ. 2017, 576, 70–77. [Google Scholar] [CrossRef] [PubMed]
  25. O’Driscoll, R.; ApSimon, H.; Oxley, T.; Molden, N.; Stettler, M.; Thiyagarajah, A. A portable emissions measurement system (PEMS) study of NOx and primary NO2 emissions from Euro 6 diesel passenger cars and comparison with COPERT emission factors. Atmos. Environ. 2016, 145, 81–91. [Google Scholar] [CrossRef]
  26. Jung, Y.; Shin, Y.; Pyo, Y.; Cho, C.; Jang, J.; Kim, G. NOx and N2O emissions over a urea-SCR system containing both V2O5-WO3/TiO2 and Cu-zeolite catalysts in a diesel engine. Chem. Eng. J. 2017, 326, 853–862. [Google Scholar] [CrossRef]
  27. Lüders, H.; Backes, R.; Hüthwoh, G.; Ketcher, D.; Horrocks, R.; Hurley, R.; Hammerle, R. An Urea Lean NOx Catalyst System for Light Duty Diesel Vehicles; SAE Technical Paper 952493; SAE: Warrendale, PA, USA, 1995. [Google Scholar] [CrossRef]
  28. Suarez-Bertoa, R.; Mendoza-Villafuerte, P.; Riccobono, F.; Vojtisek, M.; Pechout, M.; Perujo, A.; Astorga, C. On-road measurement of NH3 emissions from one gasoline and one diesel passenger cars during real world driving conditions. Atmos. Environ. 2017, 166, 488–497. [Google Scholar] [CrossRef]
  29. Triantafyllopoulos, G.; Katsaounis, D.; Karamitros, D.; Ntziachristos, L.; Samaras, Z. Experimental assessment of the potential to decrease diesel NOx emissions beyond minimum requirements for Euro 6 Real Drive Emissions (RDE) compliance. Sci. Total Environ. 2018, 618, 1400–1407. [Google Scholar] [CrossRef]
  30. Weiss, M.; Paffumi, E.; Clairotte, M.; Drossinos, Y.; Vlachos, T.; Bonnel, P.; Giechaskiel, B. Including Cold-Start Emissions in the Real-Driving Emissions (RDE) Test Procedure; Report EUR 28472 EN, Joint Research Centre; Publications Office of the European Union: Luxembourg, 2017. [Google Scholar]
  31. ICCT. China’s Stage 6 Emission Standard for New Light-Duty Vehicles (Final Rule); Policy update 2017; International Council on Clean Transportation Europe (ICCT): Berlin, Germany, 2017. [Google Scholar]
  32. Environmental Protection Agency. 40 CFR Parts 85, 86 and 600, Department of Transportation, National Highway Traffic Safety Administration, 49 CFR Parts 523, 531, 533-600. 2017 and later model year light-duty vehicle greenhouse gas emissions and corporate average fuel economy standards: Final rule. Fed. Regist. 2012, 77, 62623–63200. [Google Scholar]
  33. Vojtíšek-Lom, M.; Beránek, V.; Klír, V.; Jindra, P.; Pechout, M.; Voříšek, T. On-road and laboratory emissions of NO, NO2, NH3, N2O and CH4 from late-model EU light utility vehicles: Comparison of diesel and CNG. Sci. Total Environ. 2018, 616–617, 774–784. [Google Scholar] [CrossRef] [PubMed]
  34. Suarez-Bertoa, R.; Astorga, C. Impact of cold temperature on Euro 6 passenger car emissions. Environ. Pollut. 2018, 234, 318–329. [Google Scholar] [CrossRef] [PubMed]
  35. Pachauri, P.; Meyer, L. (Eds.) Climate Change 2014: Synthesis Report. Contribution of Working Groups I, II and III to the Fifth Assessment Report of the Intergovernmental Panel on Climate Change; IPCC: Geneva, Switzerland, 2014. [Google Scholar]
  36. Amanatidis, A.; Ntziachristos, L.; Giechaskiel, B.; Bergmann, A.; Samaras, Z. Impact of selective catalytic reduction on exhaust particle formation over excess ammonia events. Environ. Sci. Technol. 2014, 48, 11527–11534. [Google Scholar] [CrossRef]
  37. Kubiak, L.; Matarrese, R.; Castoldi, L.; Lietti, L.; Daturi, M.; Forzatti, P. Study of N2O formation over Rh- and Pt-based LNT catalysts. Catalysts 2016, 6, 36. [Google Scholar] [CrossRef]
  38. Goo, J.; Irfan, M.; Kim, S.; Hong, S. Effects of NO2 and SO2 on selective catalytic reduction of nitrogen oxides by ammonia. Chemosphere 2007, 67, 718–723. [Google Scholar] [CrossRef] [PubMed]
  39. Mendoza-Villafuerte, P.; Suarez-Bertoa, R.; Giechaskiel, B.; Riccobono, F.; Bulgheroni, C.; Astorga, C.; Perujo, A. NOx, NH3, N2O and PN real driving emissions from a Euro VI heavy-duty vehicle. Impact of regulatory on-road test conditions on emissions. Sci. Total Environ. 2017, 609, 546–555. [Google Scholar] [CrossRef]
  40. Giechaskiel, B.; Lahde, T.; Drossinos, Y. Regulating particle number measurements from the tailpipe of light-duty vehicles: The next step? Environ. Res. 2019, 172, 1–9. [Google Scholar] [CrossRef] [PubMed]
  41. Giechaskiel, B.; Mamakos, A.; Andersson, J.; Dilara, P.; Martini, G.; Schindler, W.; Bergmann, A. Measurement of automotive nonvolatile particle number emissions within the European legislative framework: A review. Aerosol Sci. Technol. 2012, 46, 719–749. [Google Scholar] [CrossRef]
  42. Giechaskiel, B.; Munoz-Bueno, R.; Rubino, L.; Manfredi, U.; Dilara, P.; De Santi, G.; Andersson, J. Particle Measurement Programme (PMP): Particle Size and Number Emissions Before, During and After Regeneration Events of a Euro 4 DPF Equipped Light Duty Diesel Vehicle; SAE Technical Paper 2007-01-1944; SAE: Warrendale, PA, USA, 2007. [Google Scholar]
Figure 1. CO2 emissions with the retrofit activated (red bars) or not activated (blue bars) for various test cycles. Left panel: Urban part emissions. Right panel: Emissions during the full cycle. Error bars show the difference between minimum or maximum value and mean value of 2 repetitions when available. “c” denotes test with engine cold start (oil at ambient temperature) and vehicle battery charged. “h” denotes test with engine hot start (i.e., oil temperature >70 °C). Cycles considered in prize criteria are shown in a light blue box.
Atmosphere 10 00180 g001
Figure 2. NOx emissions with the retrofit activated (red bars) or not activated (blue bars) for various test cycles. Left panel: Urban part emissions. Right panel: Emissions during the full cycle. Error bars show the difference between minimum or maximum value and mean value of 2 repetitions when available. “c” denotes test with engine cold start (at ambient temperature) and vehicle battery charged. “h” denotes test with engine hot start (oil temperature >70 °C). Dashed lines show NO2 emissions. The rest is NO. Cycles considered in prize criteria are shown in a light blue box.
Atmosphere 10 00180 g002
Figure 3. N2O emissions with the retrofit activated (red bars) or not activated (blue bars) for various test cycles. Left panel: Urban part emissions. Right panel: Emissions during the full cycle. Error bars show the difference between minimum or maximum value and mean value of 2 repetitions when available. “c” denotes test with engine cold start (at ambient temperature) and vehicle battery charged. “h” denotes test with engine hot start (oil temperature >70 °C). Cycles considered in prize criteria are shown in a light blue box.
Atmosphere 10 00180 g003
Figure 4. CO2 emissions during the real driving emissions testing. Error bars show the maximum and minimum value of the 2 repetitions when available.
Atmosphere 10 00180 g004
Figure 5. NOx emissions during the real driving emissions testing. Error bars show the maximum and minimum value of the 2 repetitions when available. Dashed lines show the NO2 emissions. Note that the y axis is cut at 1800 mg/km and the “Uphill” emissions exceeded 3250 mg/km.
Atmosphere 10 00180 g005
Figure 6. Cumulative NOx emissions for the 1800 seconds of the cold start WLTC tests at 23 °C (green lines) and the first 3000 seconds of real-driving emissions (RDE) tests at approximately 6 °C (urban part) (blue lines). The WLTC phases are also indicated. Dashed lines: retrofit activated. Solid lines: retrofit not activated.
Atmosphere 10 00180 g006
Figure 7. NOx emissions of the Euro 5b and 5b vehicles with the retrofit activated or not activated for various test cycles. Error bars show the difference between minimum or maximum value and mean value of 2 repetitions when available. “c” denotes test with engine cold start (at ambient temperature) and vehicle battery charged. “h” denotes test with engine hot start (oil temperature >70°C). Cycles considered in prize criteria are shown in a light blue box.
Atmosphere 10 00180 g007
Figure 8. Real time concentrations of NOx (first upper panel), NO2 (second upper panel), N2O (middle panel), NH3 (second lower panel) and exhaust gas temperature at the tailpipe (lower panel) for the cold start WLTC at 23 °C for the Euro 5b (left column) and the Euro 6b (right column) vehicles.
Atmosphere 10 00180 g008
Table 1. Basic characteristics of the test cycles. NEDC = New European Driving Cycle; WLTC = Worldwide Harmonized Light vehicles Test Cycle; CADC = Common Artemis Driving Cycle.
RoutePartDistance [km]Mean Speed [km/h]Duration [min]Max Altitude [m]
NEDCUrban4.018.313.0(220)
NEDCTotal10.933.319.7(220)
WLTCUrban3.118.99.8(220)
WLTCTotal23.246.430.0(220)
CADCUrban4.917.716.7(220)
CADCTotal50.958.352.4(220)
Road 1(Cold) Urban33.033.060.0280
Road 1Rural28.047.036.0280
Road 1Motorway27.085.019.0300
Road 2Urban20.536.034.0450
Road 2Uphill9.032.017.01100
Road 2Downhill9.032.017.01100
Road 2Urban21.534.038.0450

