A Comparative Study on Cooling Period Thermal Comfort Assessment in Modern Open Office Landscape in Estonia


Abstract
1. Introduction
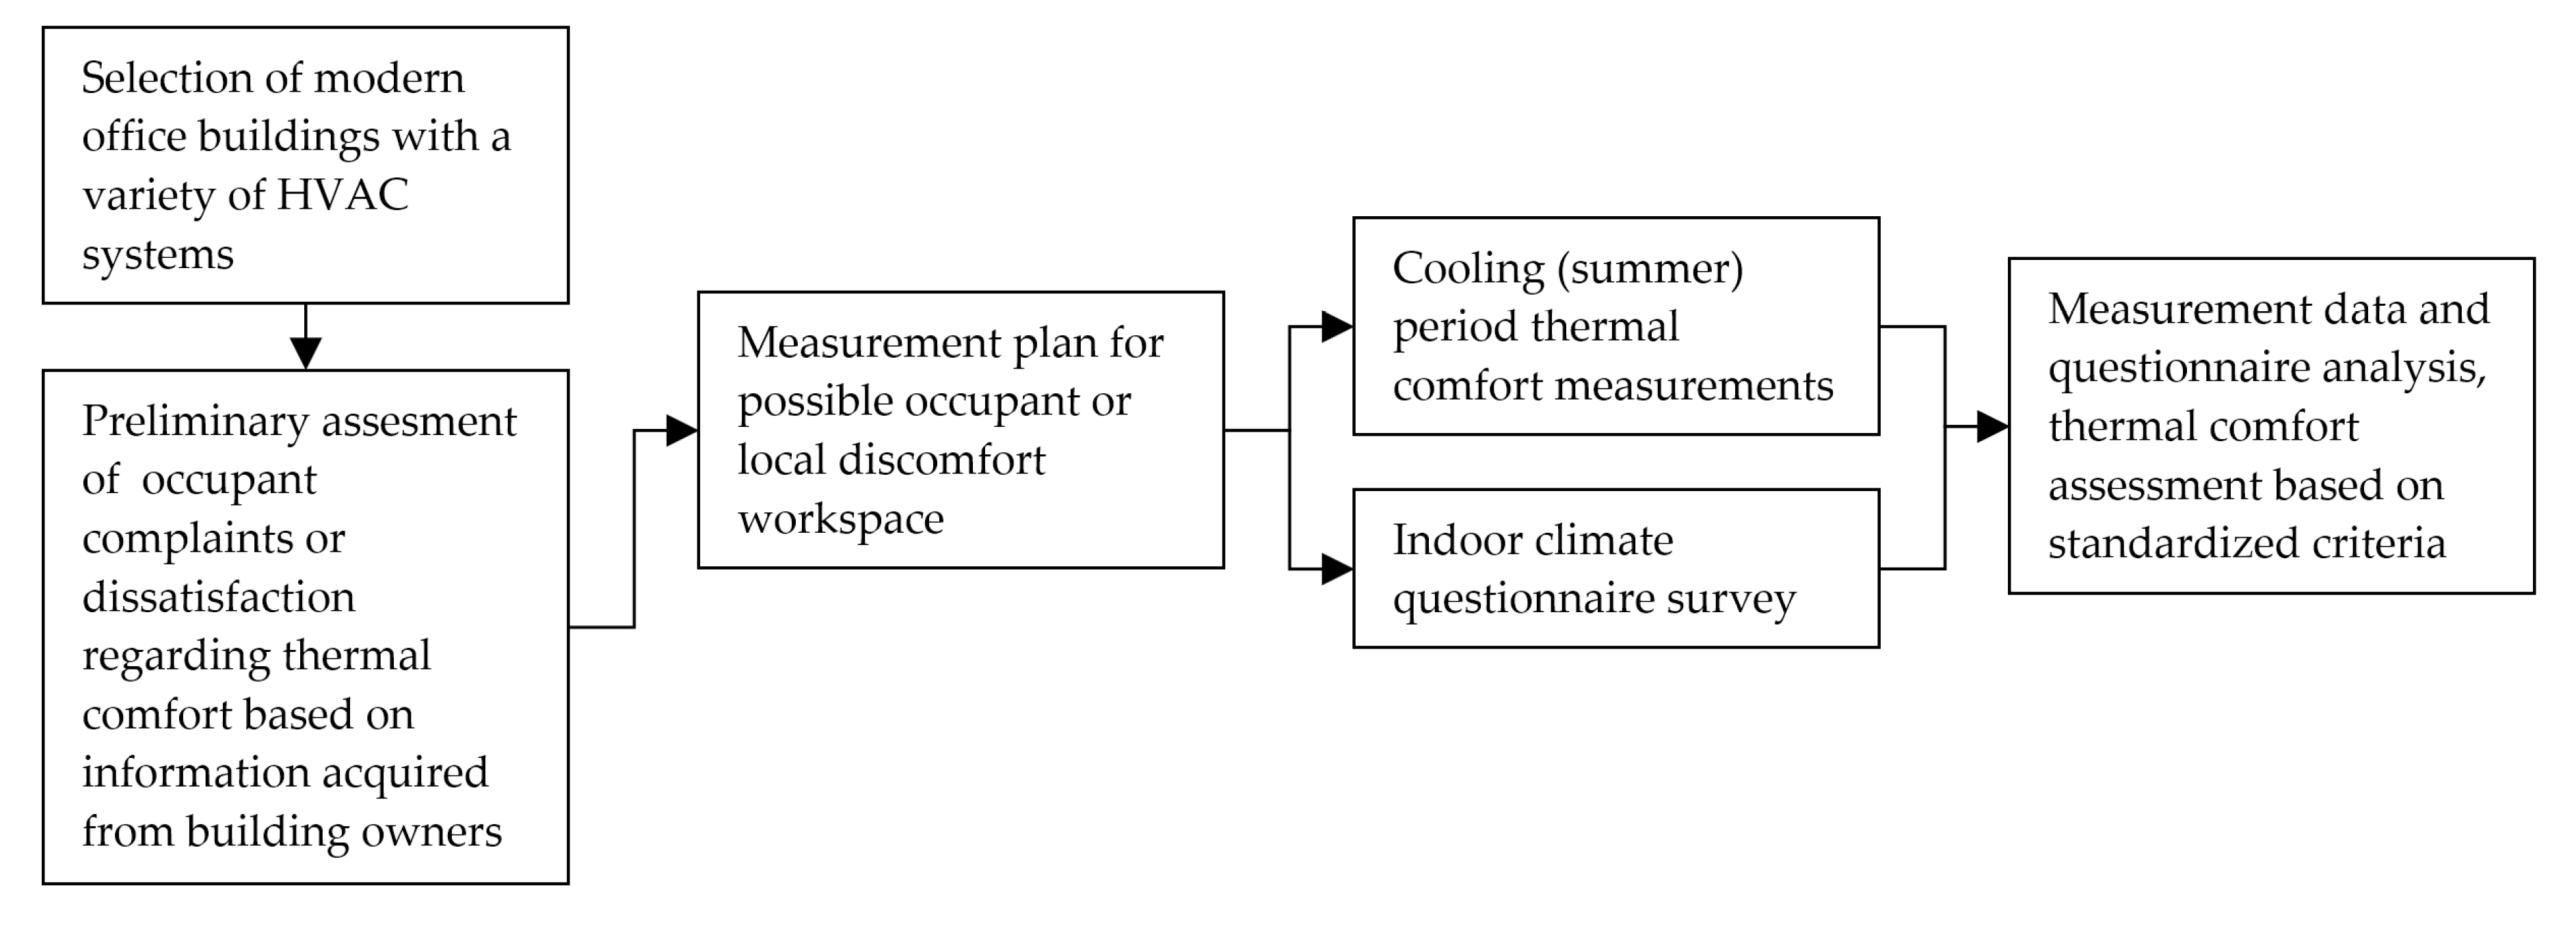
2. Methods
2.1. Reference Objects
2.2. Measurement Equipment
2.3. Data Analysis
1.05 + 0.645 × Icl for Icl > 0.078
2.4. Indoor Climate Questionnaire
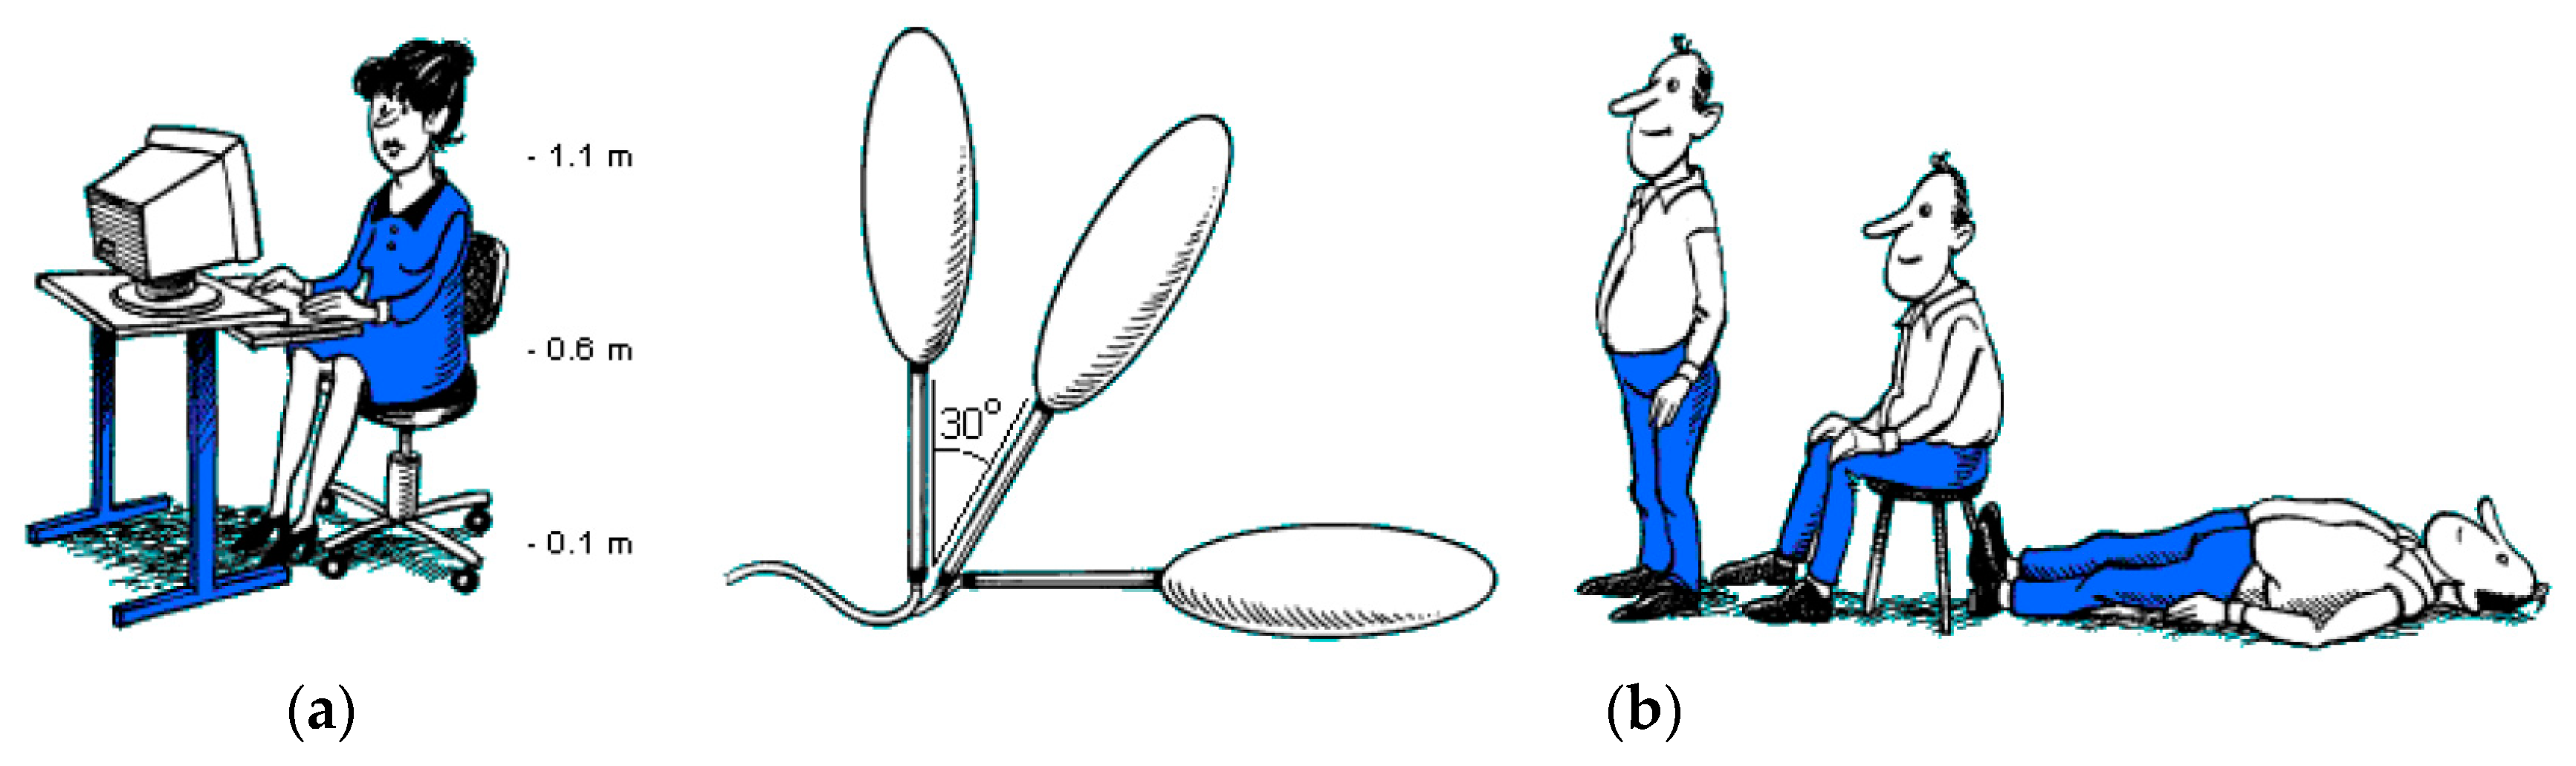
2.5. On-Site Measurements
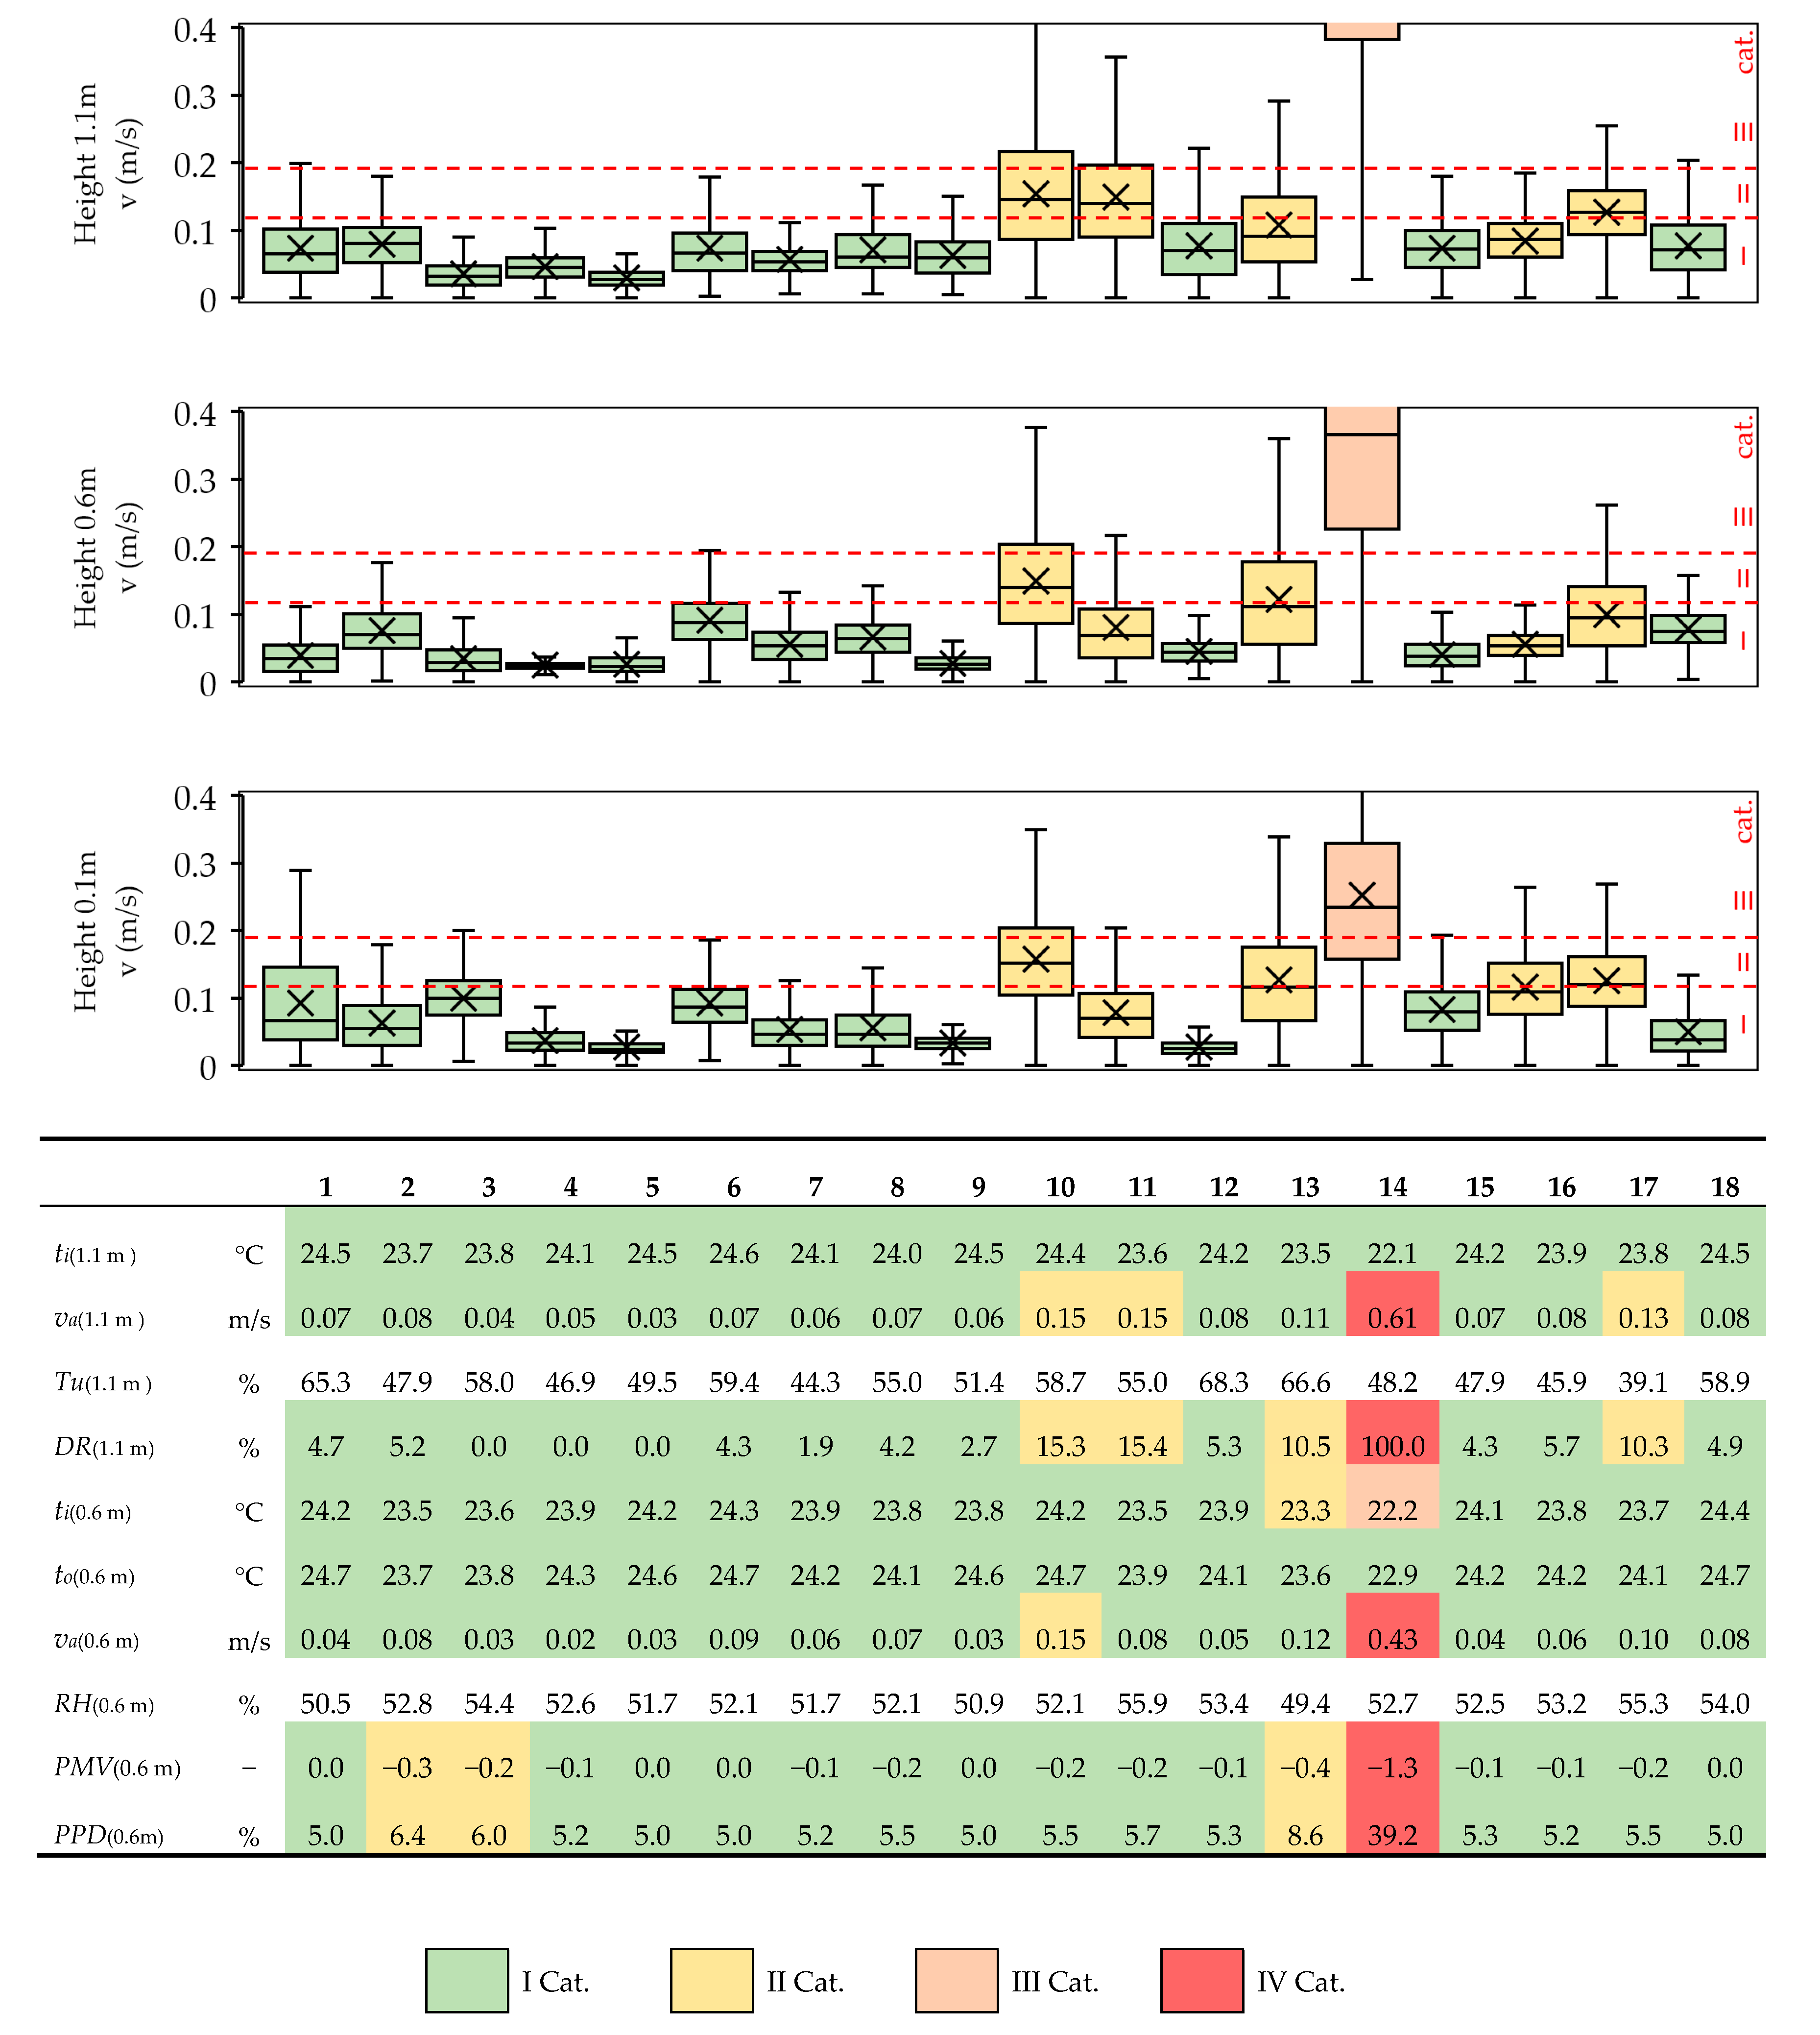
3. Results
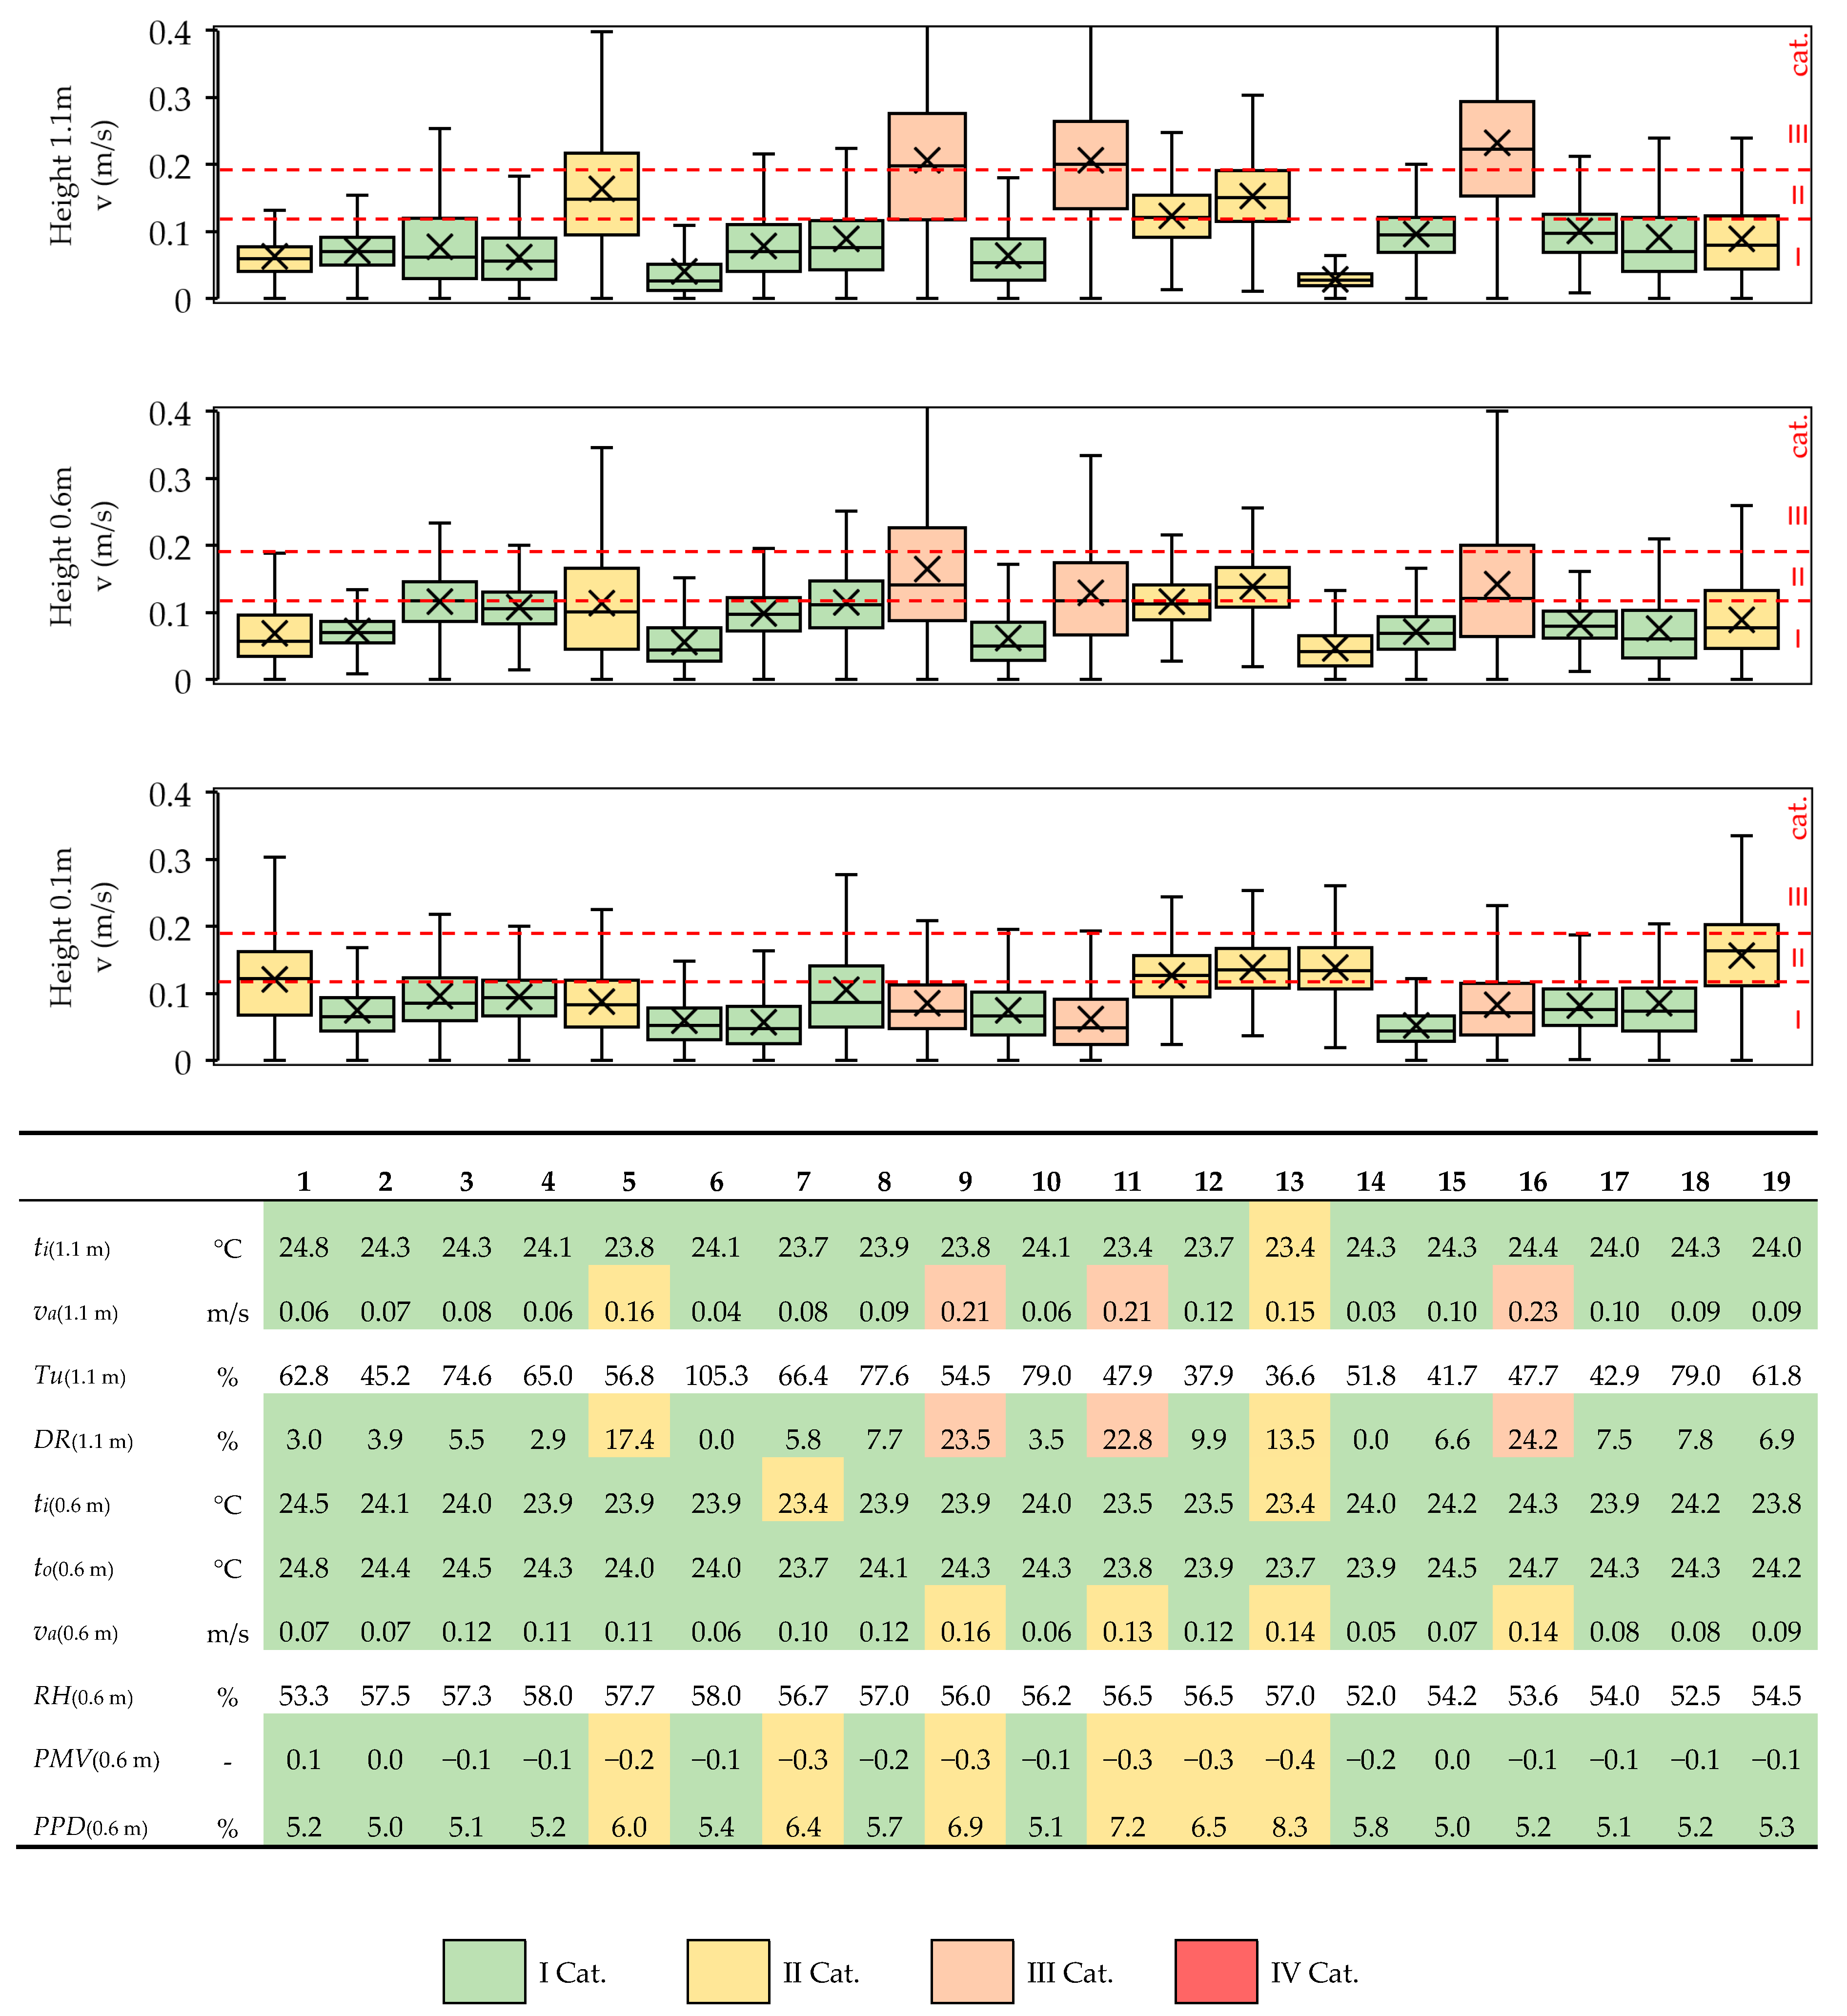
3.1. Building A Results
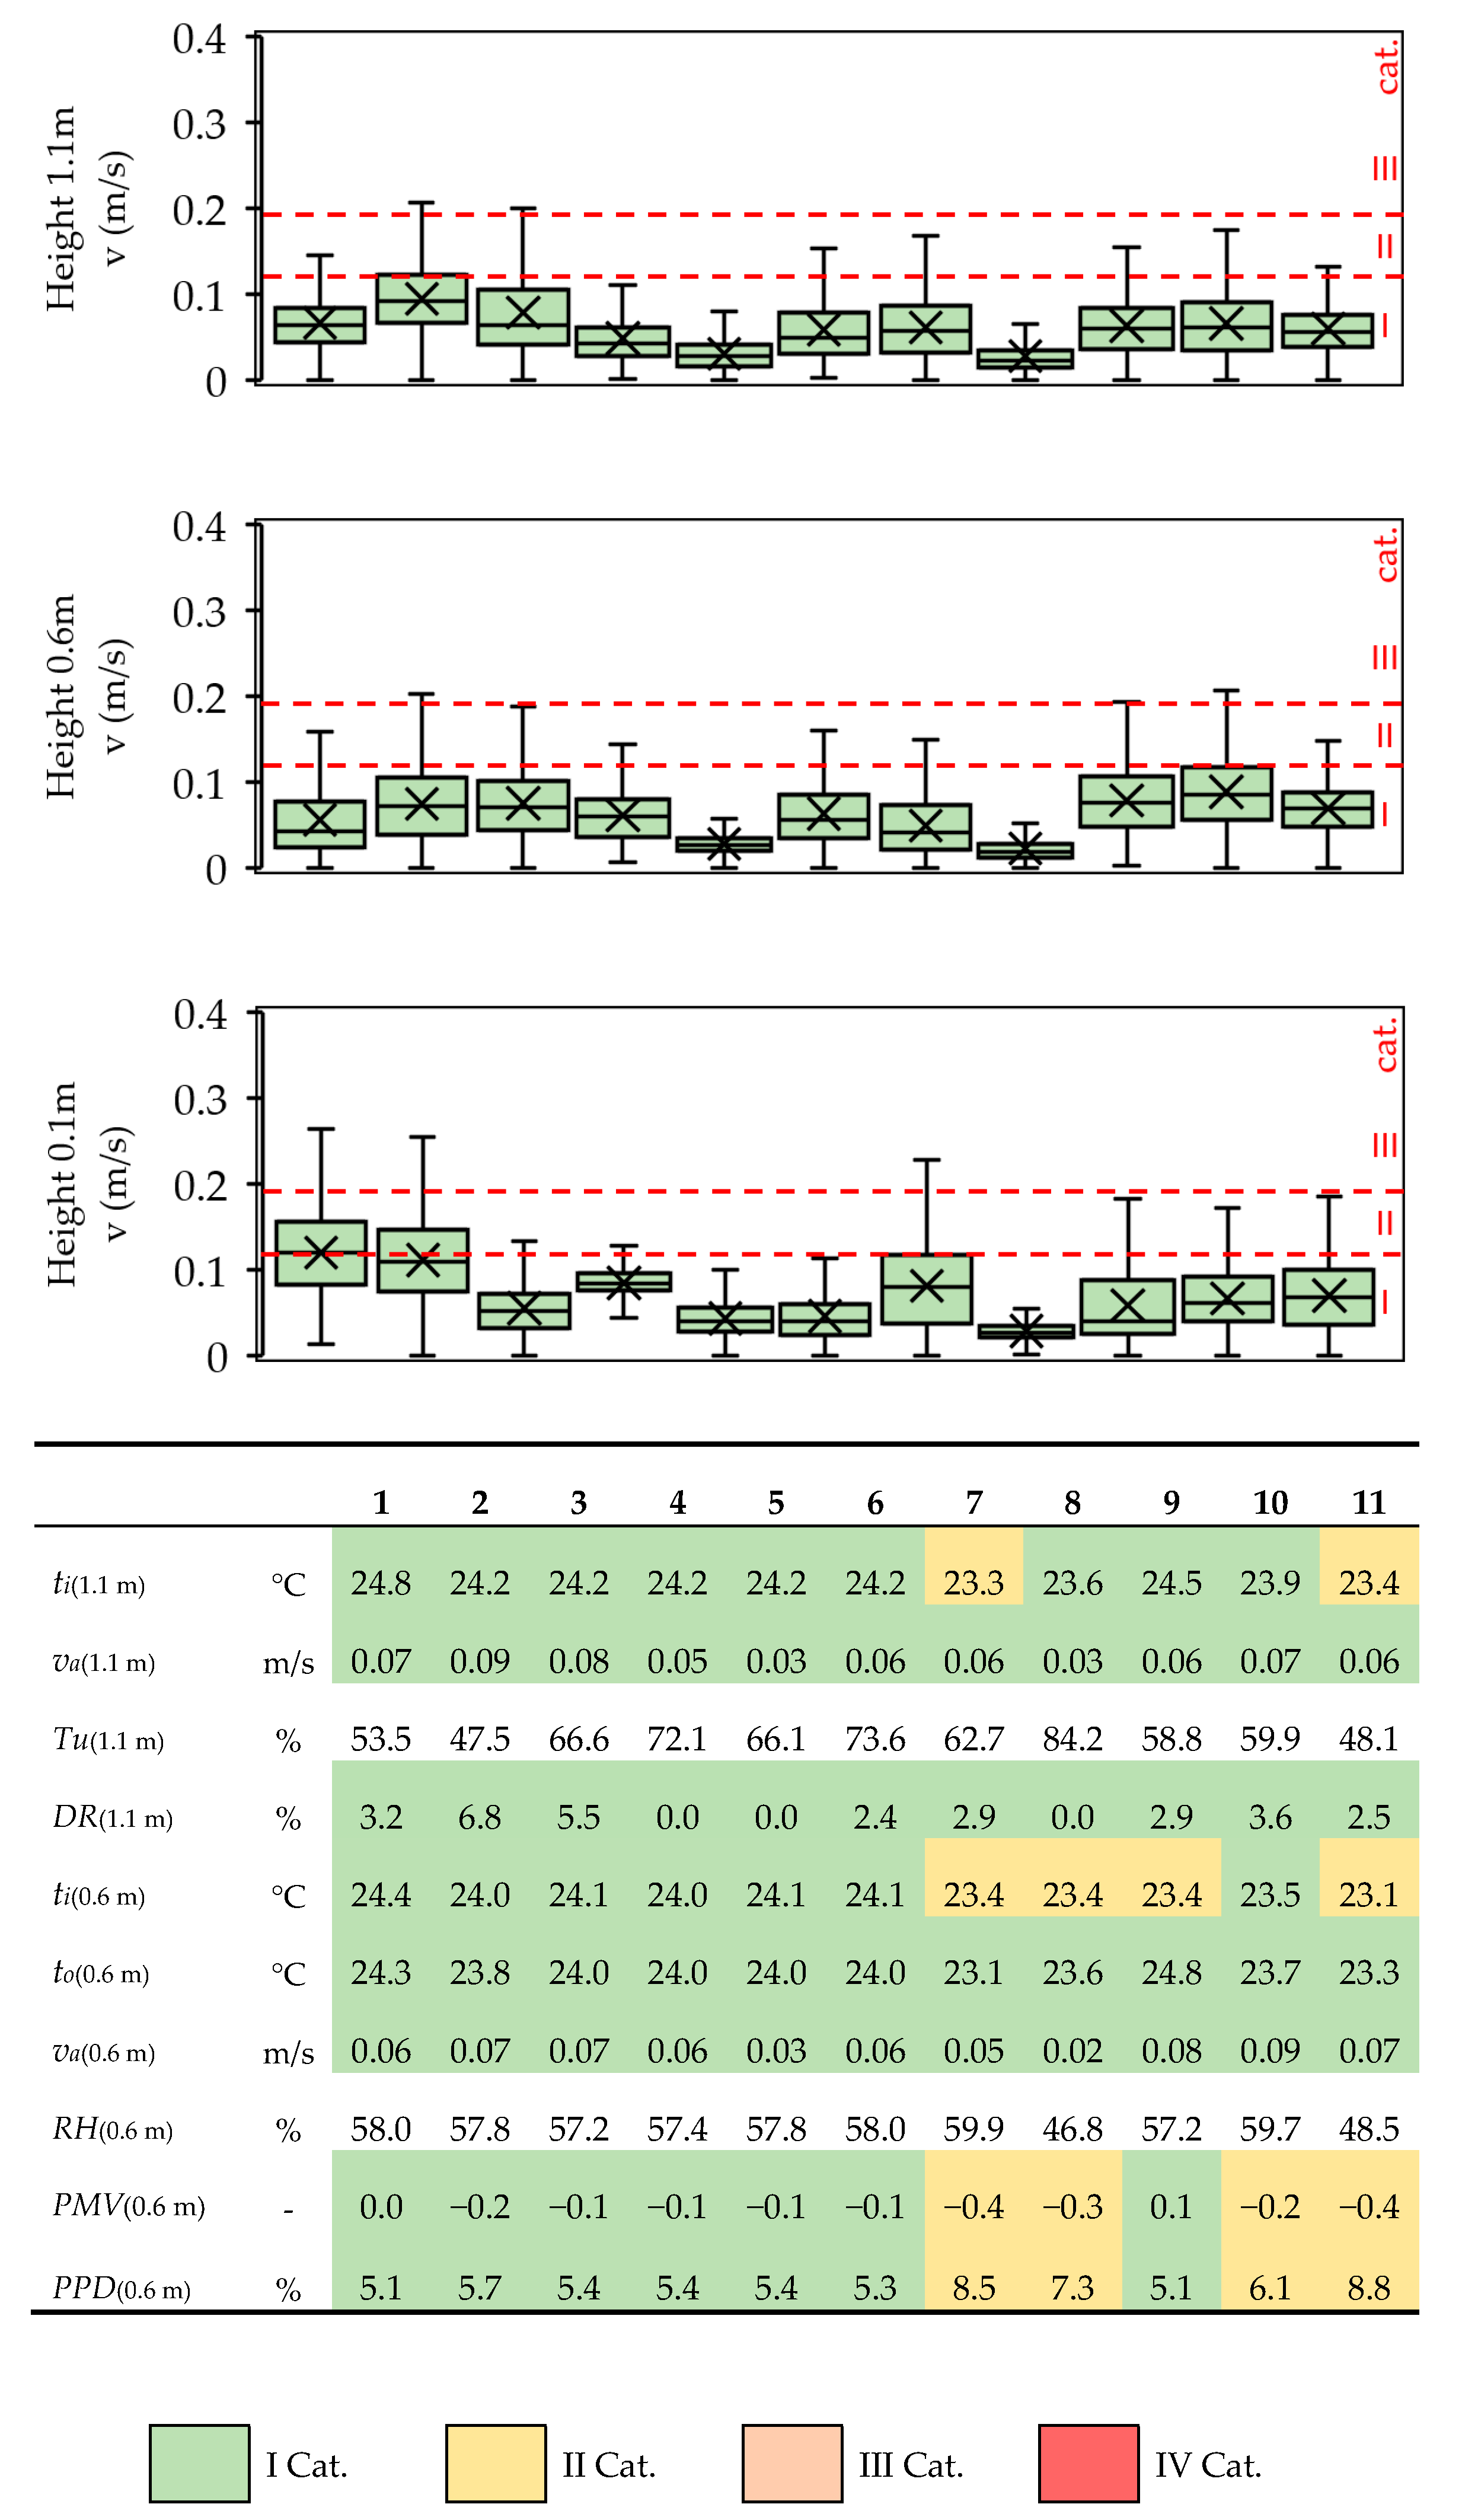
3.2. Building B Results
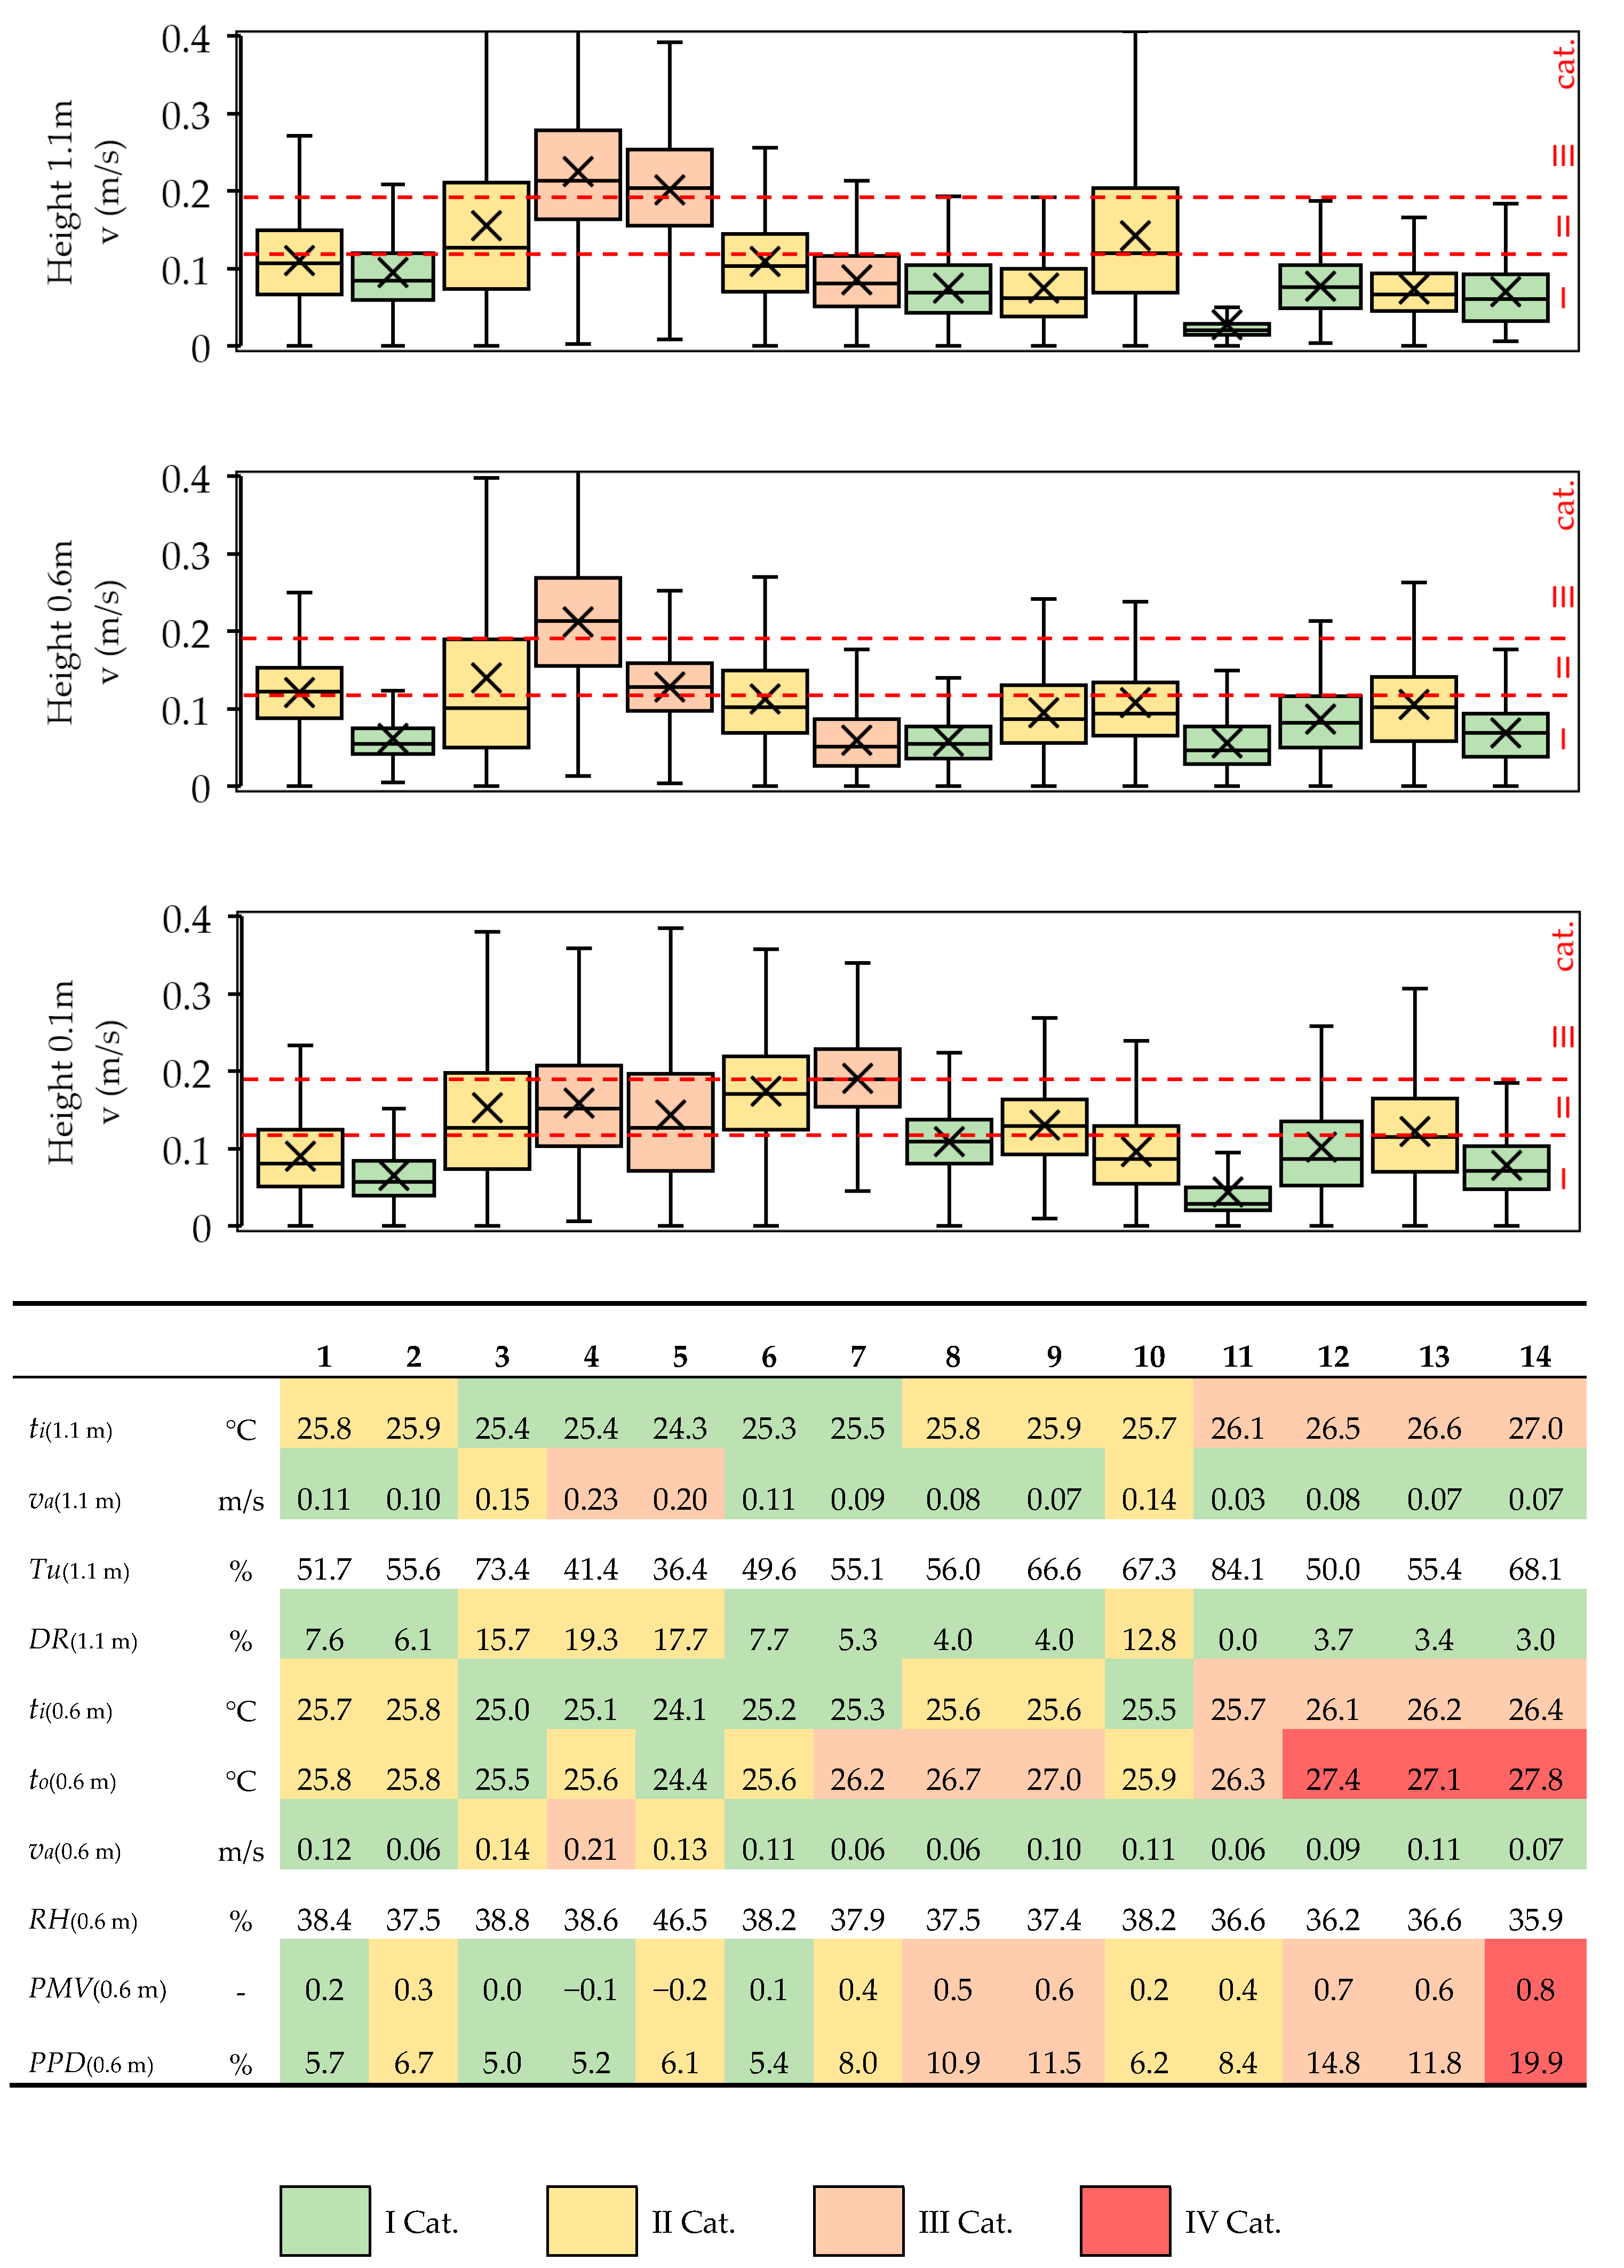
3.3. Building C Results
3.4. Building D Results
3.5. Building E Results
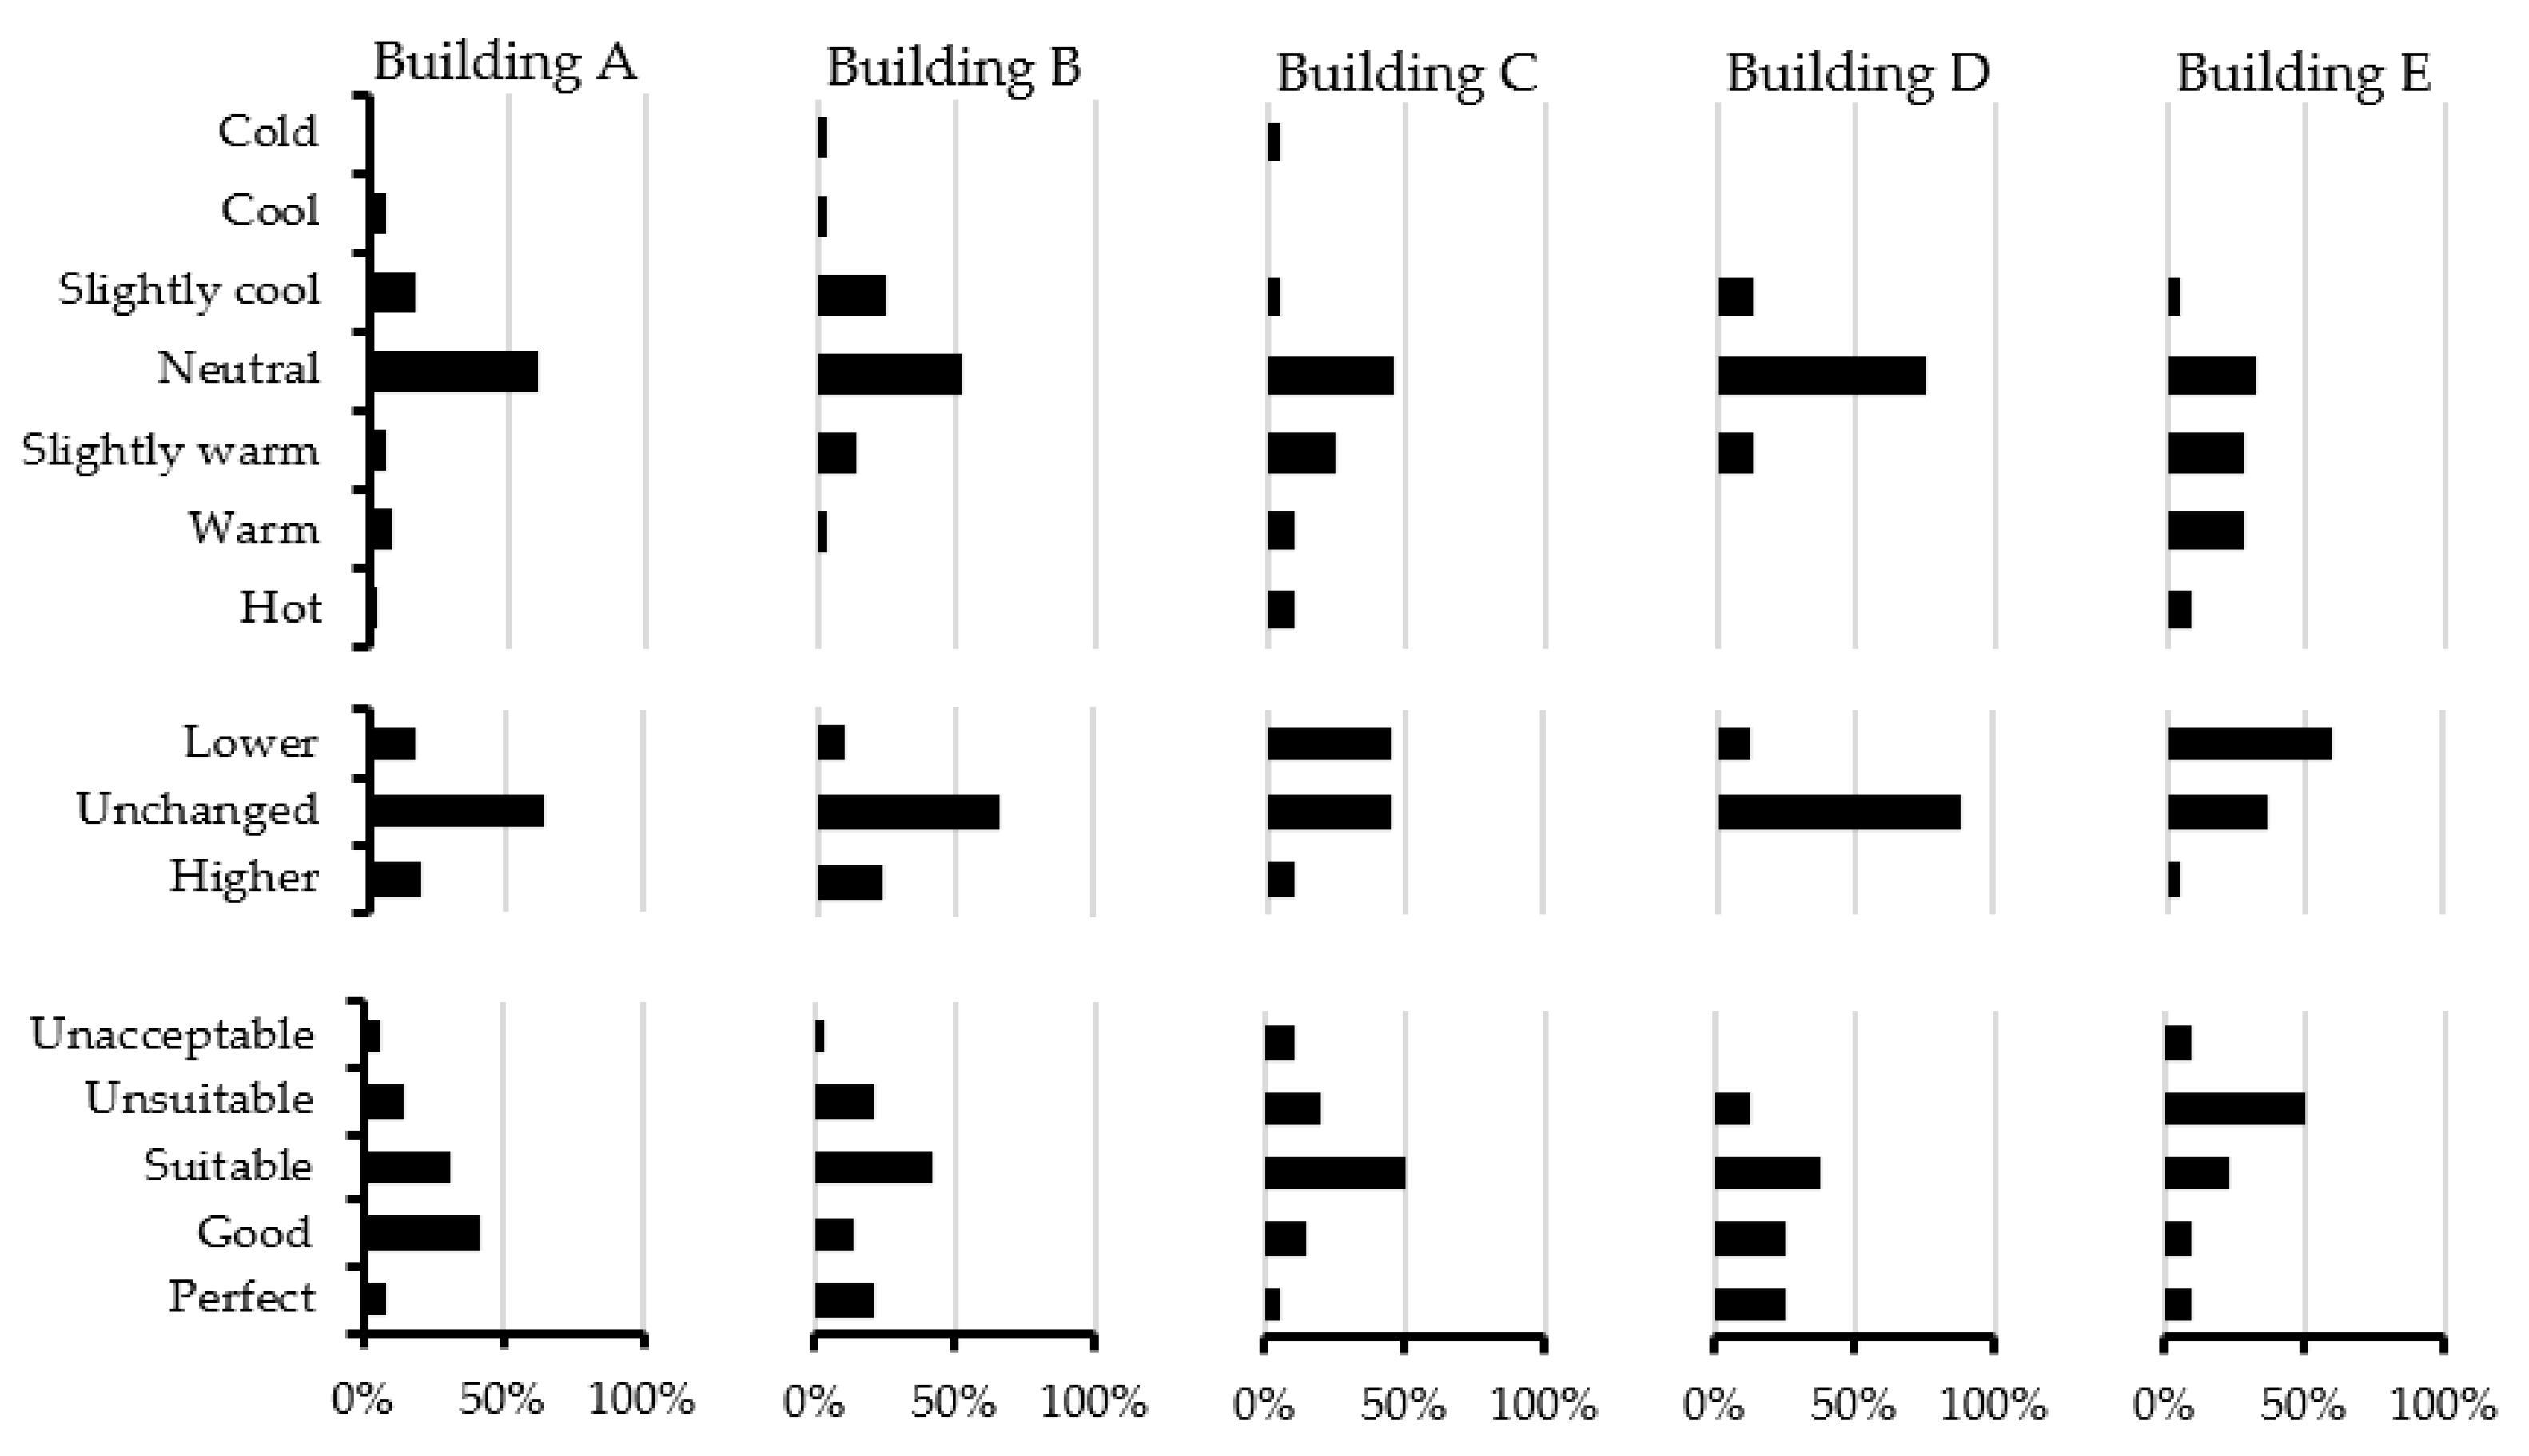
3.6. Results of the Indoor Climate Questionnaire
4. Discussion
5. Conclusions
Author Contributions
Funding
Acknowledgments
Conflicts of Interest
Nomenclature
| A | net floor area (m2) |
| Cres | respiratory convective heat exchange (W/m2) |
| DR | draught rate (%) |
| Ec | evaporative heat exchange at the skin, when the person experiences a sensation of thermal neutrality (W/m2) |
| Eres | respiratory evaporative heat exchange (W/m2) |
| fcl | clothing surface area factor |
| g | solar radiation transmittance through window glass |
| H | heat loss (W/K) |
| Hd | dry heat loss (W/m2) |
| hc | convective heat transfer coefficient [W/(m2 × K)] |
| HVAC | heating, ventilation, and air conditioning |
| Icl | clothing insulation [(m2 × K)/W] |
| ICQ | indoor climate questionnaire |
| M | metabolic rate (W/m2) |
| mtsk | mean skin temperature (°C) |
| pa | water vapor partial pressure (Pa) |
| PMV | predicted mean vote |
| PPD | predicted percentage dissatisfied (%) |
| RH | relative humidity (%) |
| SD | standard deviation |
| TABS | thermally active building systems |
| TC | thermal comfort |
| tcl | clothing surface temperature (°C) |
| ti | indoor air temperature (°C) |
| to | operative temperature (°C) |
| Tu | turbulence intensity |
| U | thermal transmittance [W/(m2×K)] |
| va | air velocity (m/s) |
| var | relative air velocity (m/s) |
| W | effective mechanical power (W/m2) |
| WWR | window-to-wall ratio |
Appendix A
- Gender―( ) Female, ( ) Male
- Age―( ) 18–25, ( ) 26–35, ( ) 36–45, ( ) 46–55, ( ) 56–65, ( ) 66+
- Workstation―( ) Private office (max 3 people), ( ) Open office
- Which amount of the workday you spend at your desk―( ) Whole workday, ( ) Half of the workday (up to 4–5 h), ( ) Few hours (max 1–2 h)
- In which zone do you spend the most of your workday (1–n in picture)―( ) 1–n
- How do you rate you thermal sensation (choose neutral if you do not want a change in temperature)―( ) Hot, ( ) Warm, ( ) Slightly warm, ( ) Comfortable, ( ) Slightly cool, ( ) Cool, ( ) Cold
- How do you perceive odor intensity―( ) No odor, ( ) Weak, ( ) Moderate, ( ) Strong, ( ) Very strong, ( ) Unbearable
- Would you prefer the room temperature to be―( ) Higher, ( ) Unchanged, ( ) Lower
- Does the room lighting disturb working―( ) Yes, ( ) No
- Does the sunlight disturb working―( ) Yes, ( ) No
- Please rate (room temperature is)―( ) Perfect, ( ) Good, ( ) Suitable, ( ) Unsuitable, ( ) Unbearable
- Please rate (air quality is)―( ) Perfect, ( ) Good, ( ) Suitable, ( ) Unsuitable, ( ) Unbearable
- How do you perceive acoustic level (colleagues’ speech and overall room acoustics)―( ) Does not disturb at all, ( ) Rarely disturbs, ( ) Sometimes disturbs, ( ) Often disturbs, ( ) Disturbs all the time
- How do you perceive other noise in your workplace―( ) Does not disturb at all, ( ) Rarely disturbs, ( ) Sometimes disturbs, ( ) Often disturbs, ( ) Disturbs all the time
- Whether and how often have you experienced the following symptoms (eye dryness or irritation)―( ) Never, ( ) Rarely, ( ) Sometimes, ( ) Often, ( ) All the time
- Whether and how often have you experienced the following symptoms (headache or fatigue)―( ) Never, ( ) Rarely, ( ) Sometimes, ( ) Often, ( ) All the time
- Whether and how often have you experienced the following symptoms (nasal or throat dryness or irritation)―( ) Never, ( ) Rarely, ( ) Sometimes, ( ) Often, ( ) All the time
- Whether and how often have you experienced the following symptoms (concentration problems)―( ) Never, ( ) Rarely, ( ) Sometimes, ( ) Often, ( ) All the time
References
- Seppanen, O. Ventilation Strategies for Good Indoor Air Quality and Energy Efficiency. Int. J. Vent. 2008, 6, 297–306. [Google Scholar]
- Yang, Z.; Ghahramani, A.; Becerik-Gerber, B. Building occupancy diversity and HVAC (heating, ventilation, and air conditioning) system energy efficiency. Energy 2016, 109, 641–649. [Google Scholar] [CrossRef]
- Mathews, E.H.; Botha, C.P.; Arndt, D.C.; Malan, A.G. HVAC control strategies to enhance comfort and minimise energy usage. Energy Build. 2001, 33, 853–863. [Google Scholar] [CrossRef]
- Simmonds, P. The Utilization of Optimal-Design and Operation Strategies in Lowering the Energy-Consumption in Office Buildings. Renew. Energy 1994, 5, 1193–1201. [Google Scholar] [CrossRef]
- Guo, W.; Zhou, M. Technologies toward thermal comfort-based and energy-efficient HVAC systems: A review. In Proceedings of the 2009 IEEE International Conference on Systems, Man and Cybernetics, San Antonio, TX, USA, 11–14 October 2009; pp. 3883–3888. [Google Scholar]
- Fanger, P.O.; Christensen, N.K. Perception of draught in ventilated spaces. Ergonomics 1986, 29, 215–235. [Google Scholar] [CrossRef] [PubMed]
- Shahrestani, M.; Yao, R.M.; Cook, G.K. Decision Making for HVAC&R System Selection for a Typical Office Building in the UK. Ashrae Trans. 2012, 118, 222–229. [Google Scholar]
- Nemethova, E.; Stutterecker, W.; Schoberer, T. Thermal Comfort and HVAC Systems Operation Challenges in a Modern Office Building—Case Study. Sel. Sci. Pap. J. Civ. Eng. 2016, 11, 103–114. [Google Scholar] [CrossRef]
- Shahzad, S.S.; Brennan, J.; Theodossopoulos, D.; Hughes, B.; Calautit, J.K. Energy Efficiency and User Comfort in the Workplace: Norwegian Cellular vs. British Open Plan Workplaces. Energy Procedia 2015, 75, 807–812. [Google Scholar] [CrossRef]
- Choi, J.H.; Loftness, V.; Aziz, A. Post-occupancy evaluation of 20 office buildings as basis for future IEQ standards and guidelines. Energy Build. 2012, 46, 167–175. [Google Scholar] [CrossRef]
- Karjalainen, S. Thermal comfort and gender: A literature review. Indoor Air 2012, 22, 96–109. [Google Scholar] [CrossRef]
- Schellen, L.; Loomans, M.G.L.C.; de Wit, M.H.; Olesen, B.W.; Lichtenbelt, W.D.V. The influence of local effects on thermal sensation under non-uniform environmental conditions-Gender differences in thermophysiology, thermal comfort and productivity during convective and radiant cooling. Physiol. Behav. 2012, 107, 252–261. [Google Scholar] [CrossRef] [PubMed]
- Rupp, R.F.; Vasquez, N.G.; Lamberts, R. A review of human thermal comfort in the built environment. Energy Build. 2015, 105, 178–205. [Google Scholar] [CrossRef]
- Pfafferott, J.U.; Herkel, S.; Kalz, D.E.; Zeuschner, A. Comparison of low-energy office buildings in summer using different thermal comfort criteria. Energy Build. 2007, 39, 750–757. [Google Scholar] [CrossRef]
- Hens, H.S.L.C. Thermal comfort in office buildings: Two case studies commented. Build. Environ. 2009, 44, 1399–1408. [Google Scholar] [CrossRef]
- Kolarik, J.; Toftum, J.; Olesen, B.W. Operative temperature drifts and occupant satisfaction with thermal environment in three office buildings using radiant heating/ cooling system. In Proceedings of the Healthy Buildings Europe 2015, Eindhoven, The Netherlands, 18–20 May 2015. [Google Scholar]
- Griefahn, B.; Kunemund, C. The effects of gender, age, and fatigue on susceptibility to draft discomfort. J. Therm. Biol. 2001, 26, 395–400. [Google Scholar] [CrossRef]
- Maykot, J.K.; Rupp, R.F.; Ghisi, E. A field study about gender and thermal comfort temperatures in office buildings. Energy Build. 2018, 178, 254–264. [Google Scholar] [CrossRef]
- Maula, H.; Hongisto, V.; Ostman, L.; Haapakangas, A.; Koskela, H.; Hyona, J. The effect of slightly warm temperature on work performance and comfort in open-plan offices - a laboratory study. Indoor Air 2016, 26, 286–297. [Google Scholar] [CrossRef]
- Wang, Z.; de Dear, R.; Luo, M.H.; Lin, B.R.; He, Y.D.; Ghahramani, A.; Zhu, Y.X. Individual difference in thermal comfort: A literature review. Build. Environ. 2018, 138, 181–193. [Google Scholar] [CrossRef]
- Kim, J.; Zhou, Y.X.; Schiavon, S.; Raftery, P.; Brager, G. Personal comfort models: Predicting individuals’ thermal preference using occupant heating and cooling behavior and machine learning. Build. Environ. 2018, 129, 96–106. [Google Scholar] [CrossRef]
- Pazhoohesh, M.; Zhang, C. A satisfaction-range approach for achieving thermal comfort level in a shared office. Build. Environ. 2018, 142, 312–326. [Google Scholar] [CrossRef]
- Enescu, D. A review of thermal comfort models and indicators for indoor environments. Renew. Sustain. Energy Rev. 2017, 79, 1353–1379. [Google Scholar] [CrossRef]
- Laftchiev, E.; Nikovski, D. An IoT system to estimate personal thermal comfort. In Proceedings of the 2016 IEEE 3rd World Forum on Internet of Things (WF-IoT), Reston, VA, USA, 12–14 December 2016; pp. 672–677. [Google Scholar]
- Ghahramani, A.; Castro, G.; Karvigh, S.A.; Becerik-Gerber, B. Towards unsupervised learning of thermal comfort using infrared thermography. Appl. Energy 2018, 211, 41–49. [Google Scholar] [CrossRef]
- Jung, W.; Jazizadeh, F. Human-in-the-loop HVAC operations: A quantitative review on occupancy, comfort, and energy-efficiency dimensions. Appl. Energy 2019, 239, 1471–1508. [Google Scholar] [CrossRef]
- Shi, J.; Yu, N.P.; Yao, W.X. Energy efficient building HVAC control algorithm with real-time occupancy prediction. In Proceedings of the 8th International Conference on Sustainability in Energy and Buildings, Turin, Italy, 11–13 September 2017. [Google Scholar]
- Thalfeldt, M.; Pikas, E.; Kurnitski, J.; Voll, H. Facade design principles for nearly zero energy buildings in a cold climate. Energy Build. 2013, 67, 309–321. [Google Scholar] [CrossRef]
- Kähkönen, E. Draught, Radiant Temperature Asymmetry and Air Temperature – a Comparison between Measured and Estimated Thermal Parameters. Indoor Air 1991, 1, 439–447. [Google Scholar] [CrossRef]
- Kiil, M.; Mikola, A.; Thalfeldt, M.; Kurnitski, J. Thermal comfort and draught assessment in a modern open office building in Tallinn. E3S Web Conf. 2019, 111, 02013. [Google Scholar] [CrossRef]
- Rhee, K.N.; Olesen, B.W.; Kim, K.W. Ten questions about radiant heating and cooling systems. Build. Environ. 2017, 112, 367–381. [Google Scholar] [CrossRef]
- Saber, E.M.; Tham, K.W.; Leibundgut, H. A review of high temperature cooling systems in tropical buildings. Build. Environ. 2016, 96, 237–249. [Google Scholar] [CrossRef]
- Schellen, L.; Loomans, M.G.L.C.; de Wit, M.H.; Olesen, B.W.; Lichtenbelt, W.D.V.M. Effects of different cooling principles on thermal sensation and physiological responses. Energy Build. 2013, 62, 116–125. [Google Scholar] [CrossRef]
- Maula, H.; Hongisto, V.; Koskela, H.; Haapakangas, A. The effect of cooling jet on work performance and comfort in warm office environment. Build. Environ. 2016, 104, 13–20. [Google Scholar] [CrossRef]
- Gao, S.; Wang, Y.A.; Zhang, S.M.; Zhao, M.; Meng, X.Z.; Zhang, L.Y.; Yang, C.; Jin, L.W. Numerical investigation on the relationship between human thermal comfort and thermal balance under radiant cooling system. Energy Procedia 2017, 105, 2879–2884. [Google Scholar] [CrossRef]
- Cen, C.; Jia, Y.H.; Liu, K.X.; Geng, R.X. Experimental comparison of thermal comfort during cooling with a fan coil system and radiant floor system at varying space heights. Build. Environ. 2018, 141, 71–79. [Google Scholar] [CrossRef]
- Kolarik, J.; Toftum, J.; Olesen, B.W.; Jensen, K.L. Simulation of energy use, human thermal comfort and office work performance in buildings with moderately drifting operative temperatures. Energy Build. 2011, 43, 2988–2997. [Google Scholar] [CrossRef]
- Fonseca, N. Experimental study of thermal condition in a room with hydronic cooling radiant surfaces. Int. J. Refrig. 2011, 34, 686–695. [Google Scholar] [CrossRef]
- Li, R.L.; Yoshidomi, T.; Ooka, R.; Olesen, B.W. Field evaluation of performance of radiant heating/cooling ceiling panel system. Energy Build. 2015, 86, 58–65. [Google Scholar] [CrossRef]
- Saber, E.M.; Iyengar, R.; Mast, M.; Meggers, F.; Tham, K.W.; Leibundgut, H. Thermal comfort and IAQ analysis of a decentralized DOAS system coupled with radiant cooling for the tropics. Build. Environ. 2014, 82, 361–370. [Google Scholar] [CrossRef]
- Chiang, W.H.; Wang, C.Y.; Huang, J.S. Evaluation of cooling ceiling and mechanical ventilation systems on thermal comfort using CFD study in an office for subtropical region. Build. Environ. 2012, 48, 113–127. [Google Scholar] [CrossRef]
- Mustakallio, P.; Bolashikov, Z.; Kostov, K.; Melikov, A.; Kosonen, R. Thermal environment in simulated offices with convective and radiant cooling systems under cooling (summer) mode of operation. Build. Environ. 2016, 100, 82–91. [Google Scholar] [CrossRef]
- Cehlin, M.; Karimipanah, T.; Larsson, U.; Ameen, A. Comparing thermal comfort and air quality performance of two active chilled beam systems in an open-plan office. J. Build. Eng. 2019, 22, 56–65. [Google Scholar] [CrossRef]
- Kim, T.; Kato, S.; Murakami, S.; Rho, J. Study on indoor thermal environment of office space controlled by cooling panel system using field measurement and the numerical simulation. Build. Environ. 2005, 40, 301–310. [Google Scholar] [CrossRef]
- Fredriksson, J.; Sandberg, M.; Moshfegh, B. Experimental investigation of the velocity field and airflow pattern generated by cooling ceiling beams. Build. Environ. 2001, 36, 891–899. [Google Scholar] [CrossRef]
- Rhee, K.N.; Shin, M.S.; Choi, S.H. Thermal uniformity in an open plan room with an active chilled beam system and conventional air distribution systems. Energy Build. 2015, 93, 236–248. [Google Scholar] [CrossRef]
- Koskela, H.; Haggblom, H.; Kosonen, R.; Ruponen, M. Air distribution in office environment with asymmetric workstation layout using chilled beams. Build. Environ. 2010, 45, 1923–1931. [Google Scholar] [CrossRef]
- Indraganti, M.; Ooka, R.; Rijal, H.B. Thermal comfort in offices in summer: Findings from a field study under the ‘setsuden’ conditions in Tokyo, Japan. Build. Environ. 2013, 61, 114–132. [Google Scholar] [CrossRef]
- De Vecchi, R.; Candido, C.; de Dear, R.; Lamberts, R. Thermal comfort in office buildings: Findings from a field study in mixed-mode and fully-air conditioning environments under humid subtropical conditions. Build. Environ. 2017, 123, 672–683. [Google Scholar] [CrossRef]
- Azad, A.S.; Rakshit, D.; Wan, M.P.; Babu, S.; Sarvaiya, J.N.; Kumar, D.E.V.S.K.; Zhang, Z.; Lamano, A.S.; Krishnasayee, K.; Gao, C.P.; et al. Evaluation of thermal comfort criteria of an active chilled beam system in tropical climate: A comparative study. Build. Environ. 2018, 145, 196–212. [Google Scholar] [CrossRef]
- He, Y.D.; Li, N.P.; Huang, Q. A field study on thermal environment and occupant local thermal sensation in offices with cooling ceiling in Zhuhai, China. Energy Build. 2015, 102, 277–283. [Google Scholar] [CrossRef]
- CEN EN 15251:2007. European Committee for Standardization, Indoor Environmental Input Parameters for Design and Assessment of Energy Performance of Buildings Addressing Indoor Air Quality, Thermal Environment, Lighting and Acoustics; European Committee for Standardization: Brussels, Belgium, 2007. [Google Scholar]
- Fanger, P.O. Thermal Comfort, Analysis and Applications in Environmental Engineering; Danish Technical Press: Manhattan, KS, USA, 1970. [Google Scholar]
- CEN EN 16798-1:2019. Energy Performance of Buildings―Ventilation for Buildings―Part 1: Indoor Environmental Input Parameters for Design and Assessment of Energy Performance of Buildings Addressing Indoor Air Quality, Thermal Environment, Lighting and Acoustics―Module M1-6; European Committee for Standardization: Brussels, Belgium, 2019. [Google Scholar]
- ISO 7726:1998. Ergonomics of the Thermal Environment—Instruments for Measuring Physical Quantities; International Organization for Standardization: Geneva, Switzerland, 1998. [Google Scholar]
- Dantec Dynamics. ComfortSense specification; Dantec Dynamics A/S, A Nova Instruments Company: Denmark, Skovlunde, 2019; Available online: http://www.dantecdynamics.jp/docs/products-and-services/thermal-comfort/PI264_ComfortSense.pdf (accessed on 5 June 2019).
- Ministry of Economic Affairs and Communications. Estonian Regulation No 258: Minimum Requirements for Energy Performance. Riigi Teataja 2007, 72, 445. [Google Scholar]
- Thermal Comfort. Innova AirTech Instruments A/S. 2002. Available online: http://www.labeee.ufsc.br/sites/default/files/disciplinas/Thermal%20Booklet.pdf (accessed on 10 July 2019).
- CEN EN 15726:2011. Ventilation for Buildings—Air Diffusion―Measurements in the Occupied Zone of Air-Conditioned/Ventilated Rooms to Evaluate Thermal and Acoustic Conditions; European Committee for Standardization: Brussels, Belgium, 2011. [Google Scholar]
- ISO 7730:2005. Ergonomics of the Thermal Environment―Analytical Determination and Interpretation of Thermal Comfort Using Calculation of the PMV and PPD Indices and Local Thermal Comfort Criteria; International Organization for Standardization: Geneva, Switzerland, 2005. [Google Scholar]
- Google. Google Forms. Google Inc., Mountain View (CA), USA. 2019. Available online: https://www.google.com/forms/about/ (accessed on 1 July 2019).
- EMHI. Observation Data. Estonian Weather Service: Tallinn, Estonia. 2019. Available online: https://www.ilmateenistus.ee/ilm/ilmavaatlused/vaatlusandmed/tunniandmed/?lang=en (accessed on 15 September 2019).
- Wang, J.Y.; Wang, Z.; de Dear, R.; Luo, M.H.; Ghahramani, A.; Lin, B.R. The uncertainty of subjective thermal comfort measurement. Energy Build. 2018, 181, 38–49. [Google Scholar] [CrossRef]


| Bldg | Year of Constr. | Net Floor Area (m2)/appr. Total Measured Area (%) | No of Floors/ No of Measured Floors | Thermal Transmittance W/(m2 × K) | Specific Heat Loss of External Envelopes W/(m2 × K)/Window-to-Wall Ratio/Glazing g Value |
|---|---|---|---|---|---|
| A | 2015 | 10,800/30 | 13/4 | Uwindow 0.80/Uwall 0.18 Uroof 0.09/Ufloor 0.14 | H/A 0.50 WWR 0.69 g 0.25 |
| B | 2018 | 7000/20 | 5/3 | Uwindow 0.83/Uwall 0.12 Uroof 0.09/Ufloor 0.13* (*above ambient air) | H/A 0.31 WWR 0.59 g 0.24 |
| C | 2017 | 18,900/10 | 14/2 | Uwindow 0.65/Uwall 0.10 Uroof 0.10/Ufloor 0.15 | H/A 0.30 WWR 0.38 g 0.30 |
| D | 2018 | 13,900/100 (available office space) | 2/2 | Uwindow 1.0/Uwall 0.15 Uroof 0.14/Ufloor < 0.15 | H/A < 0.20 WWR < 0.25 g 0.30 |
| E | Reconstr, 2014 (1982) | 5300/20 | 6/1 | Uwindow > 1.2/Uwall > 0.25 Uroof N/A/Ufloor N/A | H/A > 0.50 WWR 0.90 g 0.40 |
| Bldg. | Heating | Ventilation | Cooling |
|---|---|---|---|
| A | Water-based convectors (height 300 mm, length 700–1800 mm) below the windowsill. Installed room unit heating power 18 W/m2. | Mixing ventilation 1.4 l/(s × m2) using active exposed chilled beams (effective length 2700–3300 mm) mounted in the open ceiling (height 2.75 m) for supply and circular valves (Ø 125 mm) for extract air (height 2.7 m). | Active exposed chilled beams (effective length 2700–3300 mm) mounted in the open ceiling (height 2.75 m). Installed room unit sensible cooling power 52 W/m2. |
| B | Thermally active building system (slab, room height 3.0 m). Installed heating power 43 W/m2. | Displacement ventilation 1.4 l/(s × m2) including duct diffusers (Ø 160–315 mm, nozzle angle 120–180 °C) for supply (height 2.7–2.8 m), mounted in the open ceiling to the perimeter of rooms. Wall and ceiling grilles with plenum box serving extract air (height 2.8 m on cornice, 2.6 m for ribbed suspended ceiling). | Thermally active building system (slab, room height 3.0 m). Installed sensible cooling power 41 W/m2. |
| C | 4-pipe active ceiling integrated chilled beams (effective length 900–1500 mm) mounted in suspended ceiling (height 2.7 m). Installed room unit heating power 17 W/m2. | Mixing ventilation 1.7 l/(s × m2) using 4-pipe ceiling integrated chilled beams (effective length 900–1500 mm) for supply air and circular valves (Ø 100 mm) for extract air (height 2.7 m). | 4-pipe active ceiling integrated chilled beams (effective length 900–1500 mm) mounted in suspended ceiling (height 2.7 m). Installed room unit sensible cooling power 46 W/m2. |
| D | 4-pipe radiant panels mounted in the open ceiling on the height of 2.4 m. Installed room unit heating power 24 W/m2. | Mixing ventilation 2.1 l/(s × m2). Rectangular diffusers including directionally adjustable nozzles (plates 160 × 160 / 200 × 200 mm) mounted on plenum box for supply air and circular plate (Ø 200–250 mm) combined with plenum box for extract air in the open ceiling (height 2.7 m). | 4-pipe radiant panels mounted in the open ceiling on the height of 2.4 m. Installed room unit sensible cooling power 10 W/m2. |
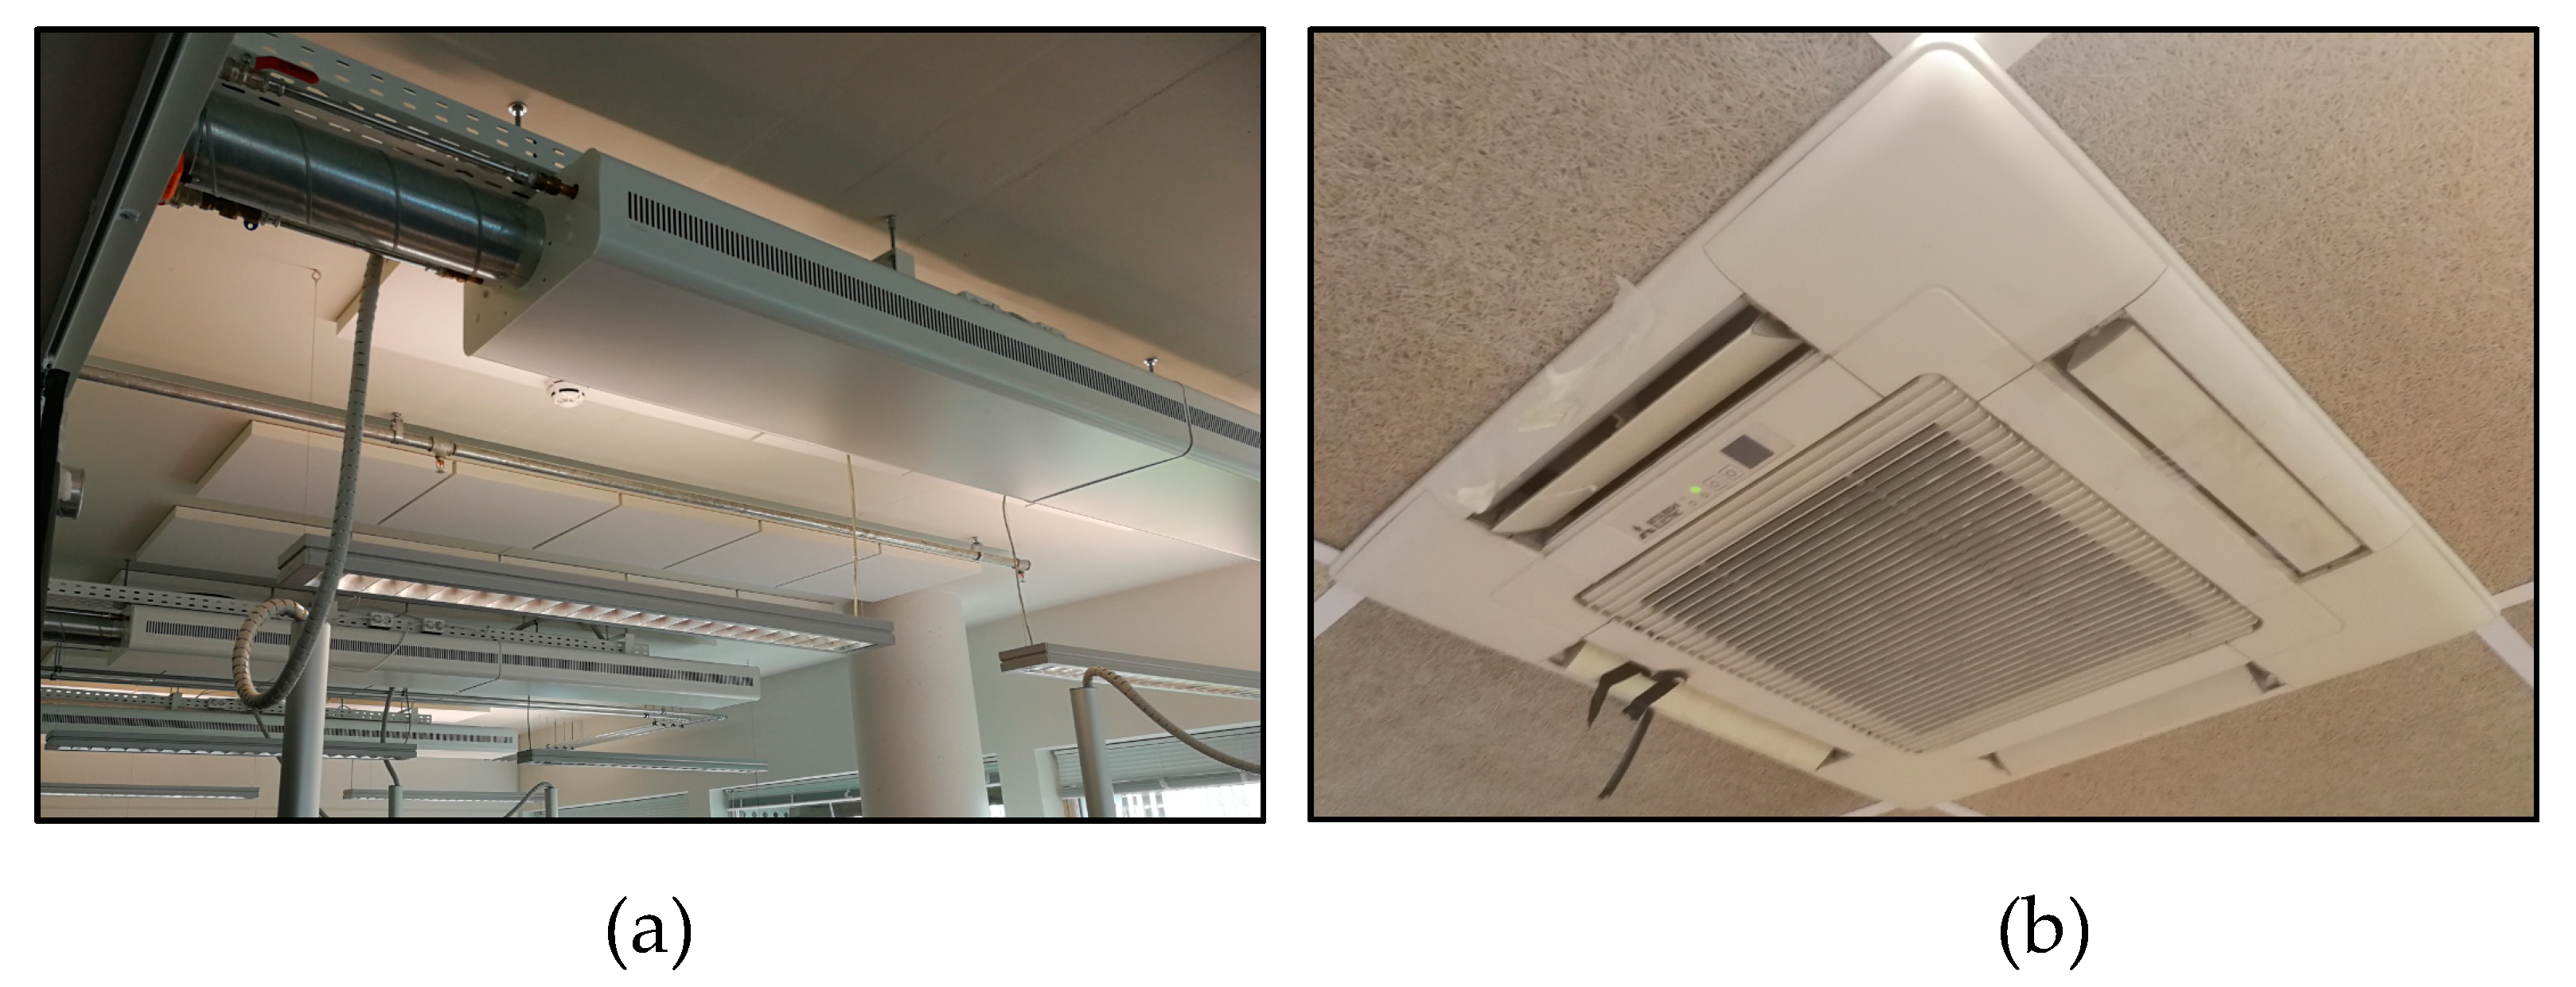
| E | Electrical convectors (height 200 mm, length 1500 mm) in front of windows. Installed room unit heating power 60 W/m2. | Mixing ventilation 1.3 l/(s × m2) with circular supply and extract air valves (Ø 160–250 mm) mounted in the suspended ceiling (height 2.5–2.7 m). | Multi-split fan coil units (without heating function) mounted in the suspended ceiling (height 2.7 m). Installed total cooling power 78 W/m2. (Ventilation supply air is not chilled) |
| 54T33 Draft Probe | 54T37 Relative Humidity Probe | 54T38 Operative Temperature Probe | |
|---|---|---|---|
| Image |  |  |  |
| Range | 0.05–5 m/s −20 °C to +80 °C | 0–100% | 0 to +45 °C |
| Accuracy | ±0.02 m/s ±0.2 K | +1.5% | ±0.2 K |
| Building | Time of Measurements | Weather Conditions | Maximum Outdoor Temp. °C | Mean Outdoor Temp. °C |
|---|---|---|---|---|
| A | 06.08.2019 before midday | cloudy skies showers | +20.9 | +15.2 |
| B | 14.08.2019 after midday | cloudy skies no precipitation | +19.7 | +13.8 |
| C | 12.08.2019 after midday | cloudy skies light showers | +22.0 | +17.3 |
| D | 29.08.2019 after midday | sunny skies no precipitation | +26.5 | +20.6 |
| E | 05.08.2019 after midday | cloudy skies no precipitation | +19.7 | +13.8 |
© 2020 by the authors. Licensee MDPI, Basel, Switzerland. This article is an open access article distributed under the terms and conditions of the Creative Commons Attribution (CC BY) license (http://creativecommons.org/licenses/by/4.0/).
Share and Cite
Kiil, M.; Simson, R.; Thalfeldt, M.; Kurnitski, J. A Comparative Study on Cooling Period Thermal Comfort Assessment in Modern Open Office Landscape in Estonia. Atmosphere 2020, 11, 127. https://doi.org/10.3390/atmos11020127
Kiil M, Simson R, Thalfeldt M, Kurnitski J. A Comparative Study on Cooling Period Thermal Comfort Assessment in Modern Open Office Landscape in Estonia. Atmosphere. 2020; 11(2):127. https://doi.org/10.3390/atmos11020127
Chicago/Turabian StyleKiil, Martin, Raimo Simson, Martin Thalfeldt, and Jarek Kurnitski. 2020. "A Comparative Study on Cooling Period Thermal Comfort Assessment in Modern Open Office Landscape in Estonia" Atmosphere 11, no. 2: 127. https://doi.org/10.3390/atmos11020127
APA StyleKiil, M., Simson, R., Thalfeldt, M., & Kurnitski, J. (2020). A Comparative Study on Cooling Period Thermal Comfort Assessment in Modern Open Office Landscape in Estonia. Atmosphere, 11(2), 127. https://doi.org/10.3390/atmos11020127